changes in partnership patterns across the life course: an ... · thus, examining the age at...
TRANSCRIPT

DEMOGRAPHIC RESEARCH VOLUME 33, ARTICLE 6, PAGES 145−178 PUBLISHED 15 JULY 2015 http://www.demographic-research.org/Volumes/Vol33/6/ DOI: 10.4054/DemRes.2015.33.6 Research Article
Changes in partnership patterns across the life course: An examination of 14 countries in Europe and the United States
Brienna Perelli-Harris
Mark Lyons-Amos
© 2015 Brienna Perelli-Harris & Mark Lyons-Amos. This open-access work is published under the terms of the Creative Commons Attribution NonCommercial License 2.0 Germany, which permits use, reproduction & distribution in any medium for non-commercial purposes, provided the original author(s) and source are given credit. See http://creativecommons.org/licenses/by-nc/2.0/de/

Table of Contents
1 Introduction 146 2 Analytical framework 148 2.1 Changes in marriage and cohabitation 148 2.2 Age 149 2.3 Separation and re-partnering 150 2.4 Differences across Europe and with the United States 150 3 Data 152 4 Methods 154 5 Results 158 5.1 Extracted classes 158 5.2 Posterior class distributions 164 6 Discussion 168 7 Acknowledgements 171 References 173 Appendix 1a 178 Appendix 1b 178

Demographic Research: Volume 33, Article 6 Research Article
http://www.demographic-research.org 145
Changes in partnership patterns across the life course: An examination of 14 countries in Europe and the United States
Brienna Perelli-Harris1
Mark Lyons-Amos2
Abstract
BACKGROUND Studies on Europe and the US indicate that marriage has been postponed, cohabitation has increased, and unions are more likely to dissolve. However, cross-national studies documenting these trends have typically studied each transition separately.
OBJECTIVE This study aims to simultaneously capture these different partnership trends while examining heterogeneity within countries. Using latent class growth curves, we ask 1) what is changing more – the increase in premarital cohabitation or the increase in divorce and union dissolution? and 2) is cohabitation emerging as a relationship indistinguishable from marriage? These analyses also allow us to see whether changes over time follow a universal trajectory, and whether the US is an outlier in terms of relationship turnover.
METHOD We use latent class growth models to trace the complexity of union formation in the United States and 14 countries in Europe by examining how union status can change between the ages of 15–45 for women born 1945–74. After determining the optimal number of latent classes, we calculate the probability of falling into each class by country and cohort. This shows the heterogeneity of union patterns across countries and over time.
RESULTS In all countries, changes in partnership patterns have been driven by the postponement of marriage. Premarital cohabitation has changed patterns of partnership behavior more than union dissolution. Cohabitation has emerged as its own class, but is not identical to
1 University of Southampton, U.K. 2 Institute of Education. All work conducted by Mark Lyons-Amos was while a member of the University of Southampton, U.K., funded by the European Research Council Starting Grant CHILDCOHAB.

Demographic Research: Volume 33, Article 6
146 http://www.demographic-research.org
any marriage class. The US does not have disproportionately higher “relationship churning” in later cohorts compared to Eastern European countries.
1. Introduction
Throughout the industrialized world, relationship patterns have been transforming. Rather than entering and remaining within marriage, individuals now often enter into cohabiting relationships that may persist, convert to marriage, or end in dissolution (Perelli-Harris et al. 2012; Heuveline and Timberlake 2004). Individuals may experience a single union that lasts a lifetime or have multiple unions that change over the life course. Thus, the timing, duration, and repetition of cohabiting and marital unions have become very complex. This variety of relationship trajectories poses a challenge for understanding new family forms and comparing them across countries.
Most of what we know about union formation cross-nationally focuses on one event at a time; for example, marriage or divorce. Researchers tend to rely on averaged behaviors and measures of central tendency, such as the median or variation in age at marriage and union formation (e.g., Billari and Liefbroer 2010; Manning, Brown, and Payne 2014) or the rate of cohabitation and divorce (e.g., Kalmijn 2007; Kennedy and Ruggles 2014). Some studies use percentages, life-table techniques, or event history analysis to describe the likelihood of experiencing single events (e.g., Andersson and Philipov 2002; Heuveline and Timberlake 2004; Perelli-Harris et al. 2012) or a comparison of two events, such as marriage and cohabitation (e.g., Hoem et al. 2009). While these studies provide a valuable perspective on entrance into adulthood, they do not allow for a comparison of changes in union formation across the life course as adults mature during prime family formation ages, nor do they describe holistic relationship patterns within and across countries.
In this paper we use Latent Class Growth Curve Models (LCGM) to examine partnership formation along multiple dimensions in 14 countries in Europe and the United States. LCGM traces relationship histories for each individual and then clusters the histories into latent classes. We then compare the distribution of the latent classes across countries. This approach provides a more comprehensive picture of the complexity of relationship patterns than basic measures of entry and exit from unions alone. The models show how individuals can transition into and out of different relationship states (i.e., never married, cohabiting, married having previously cohabited, directly married, and single after union separation) from ages 15–45. Our data also allows us to compare the changing distribution of partnership patterns for the 1945–54, 1955–64, and 1965–74 cohorts. We expect that the heterogeneity of partnership patterns
Perelli-Harris and Lyons-Amos: Changes in partnership patterns across the lifecourse
http://www.demographic-research.org 147
will increase over time, as individuals no longer follow a standard life course. The LCGM also provide insights into several dimensions of partnership formation.
First, the LCGM provide better information on how marriage has changed and the role of cohabitation across the life course. Investigating how people enter and possibly exit marriage reveals to what extent marriage is still a life-long union, preceded by cohabitation and/or ending in divorce. We can see whether the increase in premarital cohabitation or the increase in divorce has had a greater impact on partnership patterns, which could have broader implications for individuals and society. People can start their relationship with premarital cohabitation and then formalize their relationship through marriage with few negative consequences for themselves or others. Ending marriage with divorce, on the other hand, is more likely to have greater social, psychological, and financial implications, including a negative impact on well-being, physical and mental health, and child outcomes (Amato 2010). Thus, the change in marriage could primarily be due to increased premarital cohabitation, which has few social implications, or it could be due to increased instability, which could potentially have larger ramifications. In addition, analyzing cohabitation trajectories provides greater information on the function of cohabitation and to what extent it is becoming an alternative to marriage.
Second, the growth curves represent the ages at which different transitions occur between 15 and 45, the prime childbearing ages for women. This age range goes beyond that of most sequence analysis studies, which focus on events that mark the entrance into adulthood (Elizinga and Liefbroer 2007; Lesnard et al. 2010). The curves show the probability of women being in each partnership state across ages for each class, simultaneously providing information on type of union status and when women are most likely to be in a given state. Thus, examining the age at partnership formation shows how marriage has been postponed, when women are most likely to cohabit, and the level of union dissolution throughout the age range. Third, we incorporate union dissolution and re-partnering into the models by tracing a curve for separation (i.e., returning to the state of being single after separation) and allowing individuals to re-enter the marital or cohabiting state. Such an approach investigates union formation beyond first partnerships and allows us to think more comprehensively about the inter-relationship between cohabitation, marriage, and re-partnering.
Because our data cover a substantial proportion of Europe’s population, including North-South family patterns (Reher 1998) and East-West household regimes (Coale 1992), the data is representative of a large variety of European relationship patterns. Our analysis also allows us to see to what extent the United States is an outlier in partnership behavior, especially in terms of relationship “churning” (Cherlin 2009). Previous studies usually compare the US to Western Europe; however, here we investigate whether some countries in Eastern Europe may provide a better comparison.

Demographic Research: Volume 33, Article 6
148 http://www.demographic-research.org
Several Eastern European countries have had very high divorce rates; for example, divorce rates in Russia have been among the highest in the world since the 1970s (United Nations 2012), and re-partnering in Russia is currently on the rise (Zakharov 2015). Therefore the US may have more in common with countries such as Russia than Western Europe. Taken as a whole, these comparisons will provide insight into how family formation varies and changes across different social, cultural, and economic contexts.
2. Analytical framework
In this paper we take a holistic approach that simultaneously models the timing, sequencing, and quantum of events (Billari 2005). We address the following research questions: how are partnership patterns distinguished by the changes in marriage and cohabitation, the age at which unions are formed, and the dissolution of relationships and re-partnering? How prevalent are different patterns of union formation across countries and cohorts? Below we discuss each of these dimensions in turn, as well as differences in family patterns across Europe and the United States.
2.1 Changes in marriage and cohabitation
Over the past few decades the institution of marriage has changed dramatically in most countries of Europe and the United States (Cherlin 2009; Perelli-Harris and Sánchez Gassen 2012). Marriage is no longer a life-long commitment that automatically starts with two people marrying before living together. Instead, marriages can start with cohabitation and end in divorce. Examining the different ways of starting and ending marriage provides insight into the institution of marriage and its meaning today. Marriages that start with cohabitation may not have a firm commitment from the outset: instead couples may “slide” into their relationships (Manning and Smock 2005). Marriages that start with cohabitation may also be qualitatively different from those in which couples marry directly; for example, more prone to divorce (Teachman 2003; Berrington and Diamond 1999), although this association may be due to selection factors (Lillard, Brien, and Waite 1995) and appears to be changing (Liefbroer and Dourleijn 2006; Reinhold 2010). In any case, the possibility of marriage ending in divorce has changed expectations and rules of behavior. Because couples are no longer guided by set norms that require commitment, marriage has become a less stable arrangement in which individuals can no longer rely on a mutual understanding of how

Perelli-Harris and Lyons-Amos: Changes in partnership patterns across the lifecourse
http://www.demographic-research.org 149
to act (Cherlin 2004). As a whole, new ways of starting and ending marriage indicate that marriage is becoming deinstitutionalized and less predictable.
Changes in marriage have also been accompanied by a rise in cohabitation across Europe and the United States (Kiernan 2004; Perelli-Harris et al. 2012; Kennedy and Bumpass 2008; Heuveline and Timberlake 2004). It is difficult to know what the increase in cohabitation indicates: is cohabitation confined to a short-term trial period that converts to marriage, is it a long-term, stable relationship that is a substitute for marriage, or is it a short-lived relationship that indicates high levels of relationship turnover? Researchers have sought to understand and classify cohabitation using a variety of comparison groups and criteria (Smock 2000; Prinz 1995; Villeneuve-Gokalp 1991; Kiernan 2004). For example, Heuveline and Timberlake (2004) used indicators such as incidence of cohabitation, median duration of cohabitation, and proportion ending in marriage to sort countries into six ideal types of cohabitation (marginal, prelude to marriage, stage in marriage process, alternative to single, alternative to marriage, and indistinguishable from marriage). Classifying countries based on average behavior, however, does not take into account the multiple types of behaviour that exist simultaneously within a country. For example, in Norway, where cohabitation is said to be “indistinguishable from marriage”, we may find several types of cohabitation: a proportion of women may cohabit into their 30s and 40s, and a similarly large proportion may premaritally cohabit and/or dissolve their unions. Therefore, the heterogeneity of patterns of union formation can indicate that cohabitation has multiple meanings within a given country.
2.2 Age
The timing of union formation – whether marriage or cohabitation – can also signify different types of relationship. Couples who form unions early may have relationship types distinct from those who form unions late. Previous studies show that union formation differs dramatically across cohorts, periods, and countries (Billari 2005; Hoem et al. 2009; Sobotka and Toulemon 2008). Throughout Europe and the US, marriage and union formation have increasingly been postponed (Sobotka and Toulemon 2008; Hoem et al. 2009; Billari and Liefbroer 2010; Manning, Brown, and Payne 2014), although the median age at first cohabitation has not increased in the United States (Manning, Brown, and Payne 2014). Nevertheless, Billari and Liefbroer (2010) show that although most countries have undergone shifts to average later ages at marriage, countries have also experienced an increase in the variance in median age at first marriage. The authors conclude that across Europe the transition from adulthood has shifted from “early, contracted, and simple” to “late, protracted, and complex.”

Demographic Research: Volume 33, Article 6
150 http://www.demographic-research.org
Therefore, by examining the variation in the age pattern of union formation, we can better understand the role of postponement in changes in union formation. We can see which countries have uniformly delayed marriage and union formation, which have witnessed greater variation in marriage timing, and which have experienced shifts in marriage timing due to premarital cohabitation.
2.3 Separation and re-partnering
Relationship patterns have also become more complicated due to the increasing instability that results from separation and divorce. A range of cross-national studies on union dissolution have shown how divorce has increased in most European countries and the US, but nonetheless not at the same rate in all countries (e.g., Heuveline and Timberlake 2004; Sobotka and Toulemon 2008; Kalmijn 2007; Andersson and Philipov 2002; Kennedy and Ruggles 2014). These studies provide important information on the level and determinants of divorce, but they tend to focus on the outcome of unions, usually first unions, without presenting the whole picture of entrance into union formation. Other studies have shown how re-partnering has been increasing, with second and higher-order unions more likely to be cohabiting than marital (Sweeney 2010; Skew, Evans, and Gray 2009; Galezewska, Perelli-Harris, and Berrington 2013). In some countries the level of re-partnering can be substantial (Galezewska, Perelli-Harris, and Berrington 2013), possibly affecting fertility (Thomson et al. 2012) or other outcomes (Sweeney 2010). Thus, it is important to incorporate union dissolution and re-partnering, not just entrance into first unions.
2.4 Differences across Europe and with the United States
Despite changes in partnership in nearly all countries, the timing, sequencing, and type of union formed has not converged across Europe (Billari and Liefbroer 2010). Instead, regional patterns have remained entrenched, indicating the persistent effect of social norms, economic conditions, policy context, and culture on family formation behavior. Several arguments explain the reasons for differences across Europe. First, differences in family formation appear to reflect historical cultural systems. Culture may be evident in the degree of “family ties”, with Northern European countries exhibiting “weak family ties” that correspond to early home-leaving and high levels of cohabitation, and Southern European countries maintaining “strong family ties” that encourage marriage (Reher 1998). Note, however, that even though Southern European countries appear to have preserved traditional marriage norms, both the age at marriage and those who have

Perelli-Harris and Lyons-Amos: Changes in partnership patterns across the lifecourse
http://www.demographic-research.org 151
ever cohabited have increased, although childbearing within cohabitation has hardly increased at all (Sobotka and Toulemon 2008; Perelli-Harris et al. 2012).
Eastern and Western Europe also appear to have different cultural patterns of family formation, with Eastern Europe historically characterized by early, universal marriage, and Western Europe characterized by later marriage and a substantial proportion never marrying (Coale 1992). Some parts of Eastern Europe appeared to diverge further in the 1970s, when divorce rates increased substantially. For example, Russia has had the highest divorce rates in the world, potentially due the young age at marriage and marriage prompted by pregnancy, both associated with higher risk of divorce (Jasilioniene 2007). With the collapse of socialism, which was accompanied by economic and social turmoil, many Eastern European countries began to experience a decline in marriage rates, indicative of increasing cohabitation, postponement, and even non-marriage, although the countries also became increasingly different from each other (Sobotka and Toulemon 2008; Perelli-Harris and Gerber 2011). These new changes in union formation, coupled with high divorce rates, have continued to characterize patterns of union formation and childbearing within cohabitation into the 2000s (Perelli-Harris et al. 2012).
Patterns of family formation also differ by institutional and policy context. The welfare state context shapes how states relate to individuals and families and may influence decisions about family formation (Esping-Andersen 1990). For example, welfare regimes that provide support to individuals may foster independent living and cohabitation, while those that rely on support from families may promote traditional marriage systems and late home leaving. In addition, states regulate tax and transfer systems: whether these systems are organized around married couples or individuals could influence couples’ decisions to marry or remain within cohabitation (Perelli-Harris and Sánchez Gassen 2012). In general, marriage and cohabitation policy and law can privilege marriage, thereby encouraging couples to marry, or harmonize cohabitation and marriage, possibly resulting in higher levels of cohabitation (Perelli-Harris and Sánchez Gassen 2012).
Note that most of our discussion has focused on differences across Europe, paying little attention to the United States, which is also included in our analysis. Some have argued that the United States has a unique family formation pattern, due to the relatively high levels of divorce, re-partnering, and short-term cohabiting relationships, not to mention teenage pregnancy and childbearing to single-mothers (Cherlin 2009). Cherlin (2009) argues that the US “marriage-go-round” is the result of an emphasis on individualism bolstered by religious and legal institutions that support personal growth and renewal at the expense of lasting relationships. While Cherlin acknowledges socio-economic and ethnic differentials and, indeed, the heterogeneity of union formation across American society, it is still unclear to what extent the US patterns of

Demographic Research: Volume 33, Article 6
152 http://www.demographic-research.org
heterogeneity match those in other countries. Given the high levels of divorce and re-partnering in parts of Eastern Europe, the US may not be an outlier and may instead be more similar to other countries than expected (although we will not specifically look at race and ethnic differentials, which may still set the US apart).
To reiterate, most of the demographic literature has focused on differences between countries in aggregate statistics, rather than comparing differences of composition within countries. By comparing patterns of heterogeneity across countries we can see which patterns are unique to particular countries and which are prevalent in all. We expect that all countries will have some proportion of the population represented in each partnership pattern, but the distribution of patterns will vary considerably. In addition, what is a predominant pattern in one country may turn out to be a significant minority in another country, even though that pattern may not be considered typical. Taken as whole, this analysis of the heterogeneity of relationship patterns in different countries can provide insights into how new behaviors emerge and whether they are indicative of certain universal trends.
3. Data
We analyze retrospective union and fertility histories from 15 surveys that have been standardized in a dataset called the Harmonized Histories (Perelli-Harris, Kreyenfeld, and Kubisch 2010, and see www.nonmarital.org). Most of the data come from the Generations and Gender Surveys, which interviewed nationally representative samples of the resident population in each country. The countries which had GGSs were (date of survey in parentheses): Austria (2008–09), Belgium (2008–10), Bulgaria (2004), Estonia (2004–5), France (2005), Lithuania (2006), Italy (2003), Norway (2007–8), Romania (2005), and Russia (2004). Because the GGS is not available for all countries (or the retrospective histories were not adequate for our purposes), we also relied on other data sources. The Dutch data come from the 2003 Fertility and Family Survey (FFS). The UK data are from the British Household Panel Survey (BHPS), which based the analysis on interviews in 2005–06 but included information from previous surveys. The Spanish data come from the Survey of Fertility and Values conducted in 2006, and the Polish data are from the Employment, Family, and Education survey conducted in 2006. The US data are from two rounds of the National Survey of Family Growth, conducted in 1995 and between 2006 and 2008. The surveys that comprise the Harmonized Histories have been frequently used in other studies and are generally considered high quality. In particular, fertility and marriage trends from most of the Generations and Gender Surveys reflect trends found in vital registration statistics (e.g., Vergauwen et al. 2015).

Perelli-Harris and Lyons-Amos: Changes in partnership patterns across the lifecourse
http://www.demographic-research.org 153
Despite slightly different survey designs, the union histories are relatively comparable. Because not all surveys include complete male union histories, we restrict the analyses to women. Our data include the month of entrance into cohabiting and marital unions as well as separation and divorce. Questions about cohabitation generally refer to co-resident relationships with an intimate partner that last more than three months. In the Italian and Austrian surveys, however, there is no minimum duration. Registered unions, or PACS, are recorded in the French GGS, but we include them with marriages because they are officially registered.3
Our analysis examines the relationship states that occur between the ages of 15 and 45, the ages at which women can become mothers. The age range interviewed in most of our surveys allows us to compare women born in 1945–54, 1955–64, and 1965–74. With these cohorts we can examine a wide age range but still capture recent changes in the younger cohorts. In Austria and Poland only women up to age 49 were interviewed: thus we only include one or two cohorts from each survey. In the US the earliest cohorts we can observe in the 1995 NSFG were born in 1950–54. Therefore, we use the 1995 NSFG for the 1950-54 cohorts and 1955-64 cohorts. We use the NSFG 2006–08 survey for the 1965-74 cohorts; we do not merge the two NSFG surveys due to different interviewing designs and sampling strategies, and because the sample size was sufficiently large. Table 1 shows the number of women aged 15–45 in each survey by cohort for the analysis sample.
Because we are interested in analyzing union patterns across countries and over time, we pool the datasets to create a standard set of latent class growth curves for all countries. The large size of the pooled dataset allows a greater number of classes to emerge than for any individual country alone, thereby facilitating a more precise analysis of heterogeneity within countries. Note that while the Harmonized Histories surveys are relatively comparable, each survey’s sampling strategy differs, which can have different implications for the creation of the latent classes. Some surveys have no weights (for example, Bulgaria, Poland and Romania), while some surveys include sample weights at the individual level (Austria, France) or at both the household and individual level (UK). Thus, we first applied each country’s weighting scheme to ensure national representation. In addition, some surveys (i.e., Italy) have very large samples, which may dominate the pooled sample. To create a sample with each survey equally represented we have rescaled the population totals so that each survey contributes the same proportion to the total sample. This approach allows the internal validity of the surveys to be maintained, but ensures that no one survey dominates the sample.
3 Fewer than 1% of first marriages in France are PACS.

Demographic Research: Volume 33, Article 6
154 http://www.demographic-research.org
Table 1: Number of women analyzed in each country by cohort before weighting
Country 1945–54 1955–64 1965–74 Austria GGS 166 1,130 Belgium GGS 450 566 479 Bulgaria GGS 770 1141 1514 Estonia GGS 851 879 801 France GGS 794 730 783 Italy GGS 6642 7056 5750 Lithuania GGS 575 756 680 Netherlands FFS 945 1084 993 Norway GGS 1205 1290 1487 Poland EFE 1,386 Romania GGS 1167 933 1103 Russia GGS 1153 1367 1025 Spain SFS 1051 1378 1413 UK BHPS 814 922 958 US NSFG 1,635a 3,935a 1,913b
Note: a) data are from 1995 National Survey of Family Growth and refer to the 1950–54 and 1955–64 cohorts; b) data are from
2006–08 National Survey of Family Growth and refer to the 1965–74 cohorts. Sources: Generations and Gender Surveys in Austria (2008–09), Belgium (2008–10), Bulgaria (2004), Estonia (2004–5), France
(2005), Lithuania (2006), Italy (2003), Norway (2007–8), Romania (2005), and Russia (2004); Fertility and Family Survey in the Netherlands (2003); British Household Panel Survey for the United Kingdom (2005–6); Poland Employment, Family, and Education Survey (2006); Spanish Fertility Survey (2006); US National Survey of Family Growth (1995, 2006–8).
4. Methods
In this paper we use latent class growth models (LCGMs) to determine classes of relationship patterns. LCGMs are commonly used in psychology (Perlman et al. 2015), behavioral studies (Pickles and Croudace 2010; Hix-Small et al. 2004; Schaeffer et al. 2003), criminology (Muthén 2004), and education (van Lier et al. 2004), with recent applications in demography (Dariotis et al. 2011; Cheadle, Amato, and King 2010) and life course research (Virtanen et al. 2011). Latent class growth models are an extension of conventional growth curve models and assume that individuals are drawn from subpopulations (latent classes) that have different growth trajectories. In our study, individuals’ relationship histories are traced and then clustered into latent classes that represent different patterns of union formation. To our knowledge, our study is the first time LCGMs have been applied to cross-national survey data to compare latent classes of union formation within and across countries.

Perelli-Harris and Lyons-Amos: Changes in partnership patterns across the lifecourse
http://www.demographic-research.org 155
To create the Latent Class growth curves, we first expand the data into person-years. 4 We then fit separate trajectories for each union status: never in a union, cohabiting, directly married, married having previously cohabited, and single after being in a previous union. 5 We distinguish between direct marriage and marriage preceded by cohabitation to show how entrance into marriage changes over time. This approach reveals to what extent cohabitation is emerging as a precursor to marriage or as a long-term relationship that lasts until the respondent is 45.
To reiterate, the response variable for the model is defined as the random variable 𝑦𝑖 . This variable is defined at every year of the respondent’s partnership history.
𝑦𝑖 ,𝑎𝑔𝑒 = 𝑠
⎩⎪⎨
⎪⎧
0 𝑁𝑒𝑣𝑒𝑟 𝑖𝑛 𝑎 𝑢𝑛𝑖𝑜𝑛1 𝐶𝑜ℎ𝑎𝑏𝑖𝑡𝑖𝑛𝑔234
𝑀𝑎𝑟𝑟𝑖𝑒𝑑 𝑝𝑟𝑒𝑐𝑒𝑑𝑒𝑑 𝑏𝑦 𝑐𝑜ℎ𝑎𝑏𝑖𝑡𝑎𝑡𝑖𝑜𝑛𝐷𝑖𝑟𝑒𝑐𝑡𝑙𝑦 𝑚𝑎𝑟𝑟𝑖𝑒𝑑
𝑆𝑖𝑛𝑔𝑙𝑒 𝑎𝑓𝑡𝑒𝑟 𝑠𝑒𝑝𝑎𝑟𝑎𝑡𝑖𝑜𝑛
Respondents switch between these different states as they move along the life
course from ages 15–45. If two of these partnerships are present within the same year, then the higher value state is selected (for example, if cohabitation transitions to marriage in the same year, the year is classified as 𝑦𝑖𝑗 = 2 rather than 1). In certain circumstances the selection of higher states will lead to the truncation of some relationships; for instance, if a relationship occurs during the same year as a separation. In order to avoid missing relationships because they are overwritten by the ‘single after separation’ state, we replace years classified as separation with the new relationship status, although again these relationships may be truncated. As a result, short periods of separation could be missed. However, because few respondents have this type of relationship pattern, the underestimation does not substantially bias our results.
We recognize that this specification of partnership does not include explicit states for higher order partnerships. We tried to estimate models including states for second or higher order marriages and cohabitation. However, this led to structural problems within the model since the rarity of these states meant that it was difficult to detect higher order classes. Since our model allows re-entry into union following separation, we believe this specification can adequately capture re-partnering when it occurs.
4 Although person-months would more accurately reflect changes in union status, computational limitations require the use of yearly intervals. However, yearly intervals are commonly used in studies using LCGM (e.g., Goldberg 2013). In addition, we ran models using monthly data for one country (France) and found no substantial differences in the number or type of classes. 5 Women are considered single at time of separation, not divorce. We also include women whose previous partnerships ended in death of spouse, but there are relatively few cases.

Demographic Research: Volume 33, Article 6
156 http://www.demographic-research.org
We then use the statistical software Mplus (Muthén and Muthén 1998−2011) to calculate growth equations that describe different trajectories. Trajectories are combined to form each latent class, which describe different partnership patterns across the life course. Each woman has a probability of being in each latent class; the more closely her observed partnership history is to the class trajectories, the higher the probability of class membership. The probability of being in partnership 𝑠 at a given age is defined as 𝜋𝑖,𝑎𝑔𝑒𝑠 = Pr (𝑦𝑖,𝑎𝑔𝑒 = 𝑠) (see Equation 1). i indexes the individual woman. The probability of partnerships across the life course is modeled as a growth equation, where 𝑦𝑖 ,𝑎𝑔𝑒 is a function of 𝑎𝑔𝑒 and 𝑎𝑔𝑒2 5F
6. A separate growth equation is specified for each class 𝐶𝑗, where j indexes the class and there are 1…J classes. For logit estimation, we set direct marriage, the most prevalent state, as the reference category (i.e., this logit is omitted to identify the model).
ln��𝜋𝑖,𝑎𝑔𝑒𝑠 �𝐶𝑗 = 𝑗��𝜋𝑖,𝑎𝑔𝑒𝑠=3 �𝐶𝑗 = 𝑗�
� = 𝛼𝑗𝑠 + 𝛽1,𝑗𝑠 𝑎𝑔𝑒𝑖 + 𝛽2,𝑗
𝑠 𝑎𝑔𝑒𝑖2, 𝑗 = {1 … . 𝐽}, 𝑠 = {0 … 4} (1)
In Equation 1, the class-specific intercept is described by 𝛼𝑗𝑠 , while the class-
specific growth curve is described by 𝛽1,𝑗𝑠 and 𝛽2,𝑗
𝑠 . All three of these parameters vary depending on membership in a particular class. In Equation 1 the trajectories differ only according to class membership, 𝐶𝑗.7
Latent Class Growth Curve models provide objective measure of the number of classes that optimally fit the data. Thus, we can use an inductive approach to allow the optimal number of classes to emerge from the data rather than determining the number of classes a priori, which may not accurately reflect the actual data.8 We rely on the Lo-Mendell-Rubin Likelihood Ratio Test (LMR-LRT) (Lo, Mendell, and Rubin 2001) to determine the number of classes, mirroring the recommendation of Nylund, Asparouhov, and Muthén (2007) and applied by Virtanen et al. (2011). The LMR-LRT
6 We tested the specification of the shape of the age profile to include the possibility of linearity on the logit scale, as well as extending the selected model to include a cubic term. Both of these models provided worse model fit than the quadratic model selected based on AIC, BIC, and Sample-Size adjusted BIC. We note also that we can, where necessary, include different shapes for profiles in different classes – a distinct advantage over sequence analysis, which requires a universal distance measure to construct clusters. 7 Growth Mixture Models, an extension of Eq. 1, describe individual deviation from the overall growth curve within class j via random coefficients, and can extract fewer classes and estimate more parsimonious models. However, it was extremely difficult to obtain convergent solutions for models with random coefficients, since in some classes the probability of certain states was approximated at zero (and hence the variance estimate was difficult to obtain). Therefore the models must be restricted to LCGM only, which assumes that variation in partnership trajectories is a function of class membership only. 8 Elzinga and Liefbroer (2007) imply that one of the disadvantages of sequence analysis is that it is difficult to decide on the number of clusters or classes using an inductive approach. LCGM seeks to use an inductive approach to determine the number of classes using model fit statistics.

Perelli-Harris and Lyons-Amos: Changes in partnership patterns across the lifecourse
http://www.demographic-research.org 157
is similar to conventional Likelihood Ratio tests that interpret p-values below a certain threshold as indicative of an improvement in model fit, where the p-value is adjusted to reflect the fact that the Likelihood does not follow a Chi-Square distribution.9 As noted, other tests of model fit (such as the shape of the partnership growth curves) were determined by comparing AIC, BIC, and SS-BIC values, and choosing the model with the best fit (i.e., the lowest fit statistic).
To examine heterogeneity within and across countries, we present two types of results. First, we show class trajectories, which are based on the equations generated for each class. Each trajectory is used to produce a probability of union status from age 15–45. Second, we estimate the posterior probability of class membership by cohort and country. The probability of class membership is the probability that a particular respondent is a member of class j given their partnership history, which is assumed to be non-zero for all j. If the observed history closely matches the class trajectory the posterior probability of class membership will be high; conversely, if the history deviates substantially, the probability of class membership will be low. The posterior probabilities for each respondent sum to 1 across all classes for each individual. We present the mean posterior probability of class membership by country and cohort.
The classes reflect the entire pooled dataset, but they may not be completely representative of current behavior in Europe and the United States, because of the composition of the sample. In addition, a large proportion of trajectories in the youngest cohort are right truncated by the date of survey. To ensure that our results reflect trends within the data, rather than an artifact of our sample selection, we conducted three robustness checks. First, because more women are from older cohorts, the results could be driven by women with traditional marriage patterns, thus preventing the observation of new patterns more common in the younger cohorts (for example cohabitation classes similar to the marriage classes). To check for this, we re-estimated the models for each cohort separately. Comparison of the predicted curves revealed that all curves for each cohort were captured by the pooled model (i.e., each of the extracted models produced classes which were similar when comparing predicted probabilities for each age). We did not find any additional classes in any of the cohorts. We were particularly concerned about recent changes in union formation in the 1965–74 cohort; however, only four classes were extracted, none of which had a substantially different profile to those extracted from the pooled model. In particular, we did not find an additional cohabitation class.
The second robustness check is also related to the truncation issue among younger women. Because the youngest cohorts have not been exposed to the full age-range
9 Although the Bootstrap Likelihood Ratio test is a superior measure for testing the number of classes due to a lower false positive rate (Nylund, Asparouhov, and Muthén 2007), this test is considered too computationally intensive in this circumstance.

Demographic Research: Volume 33, Article 6
158 http://www.demographic-research.org
(depending on survey date), classes that represent behavior more likely to occur at older ages (i.e., 30–45) may only include older women. This means that younger women have a lower probability of falling into classes dominated by separation and re-partnering that occurs later in the life course. To assess the impact of this truncation we tested models by censoring partnership histories for all women at ages 40, 35, and 30. This procedure resulted in a smaller number of classes with a similar profile to those already extracted, with few classes incorporating separation behavior in any cohort. Nonetheless, despite the limitation of the underrepresentation of the younger cohorts, we prefer to retain the upper age limit of 45 for all cohorts to examine union transitions into mid-life, while also including younger cohorts who are experiencing new patterns of union formation.
Finally, we were concerned that the sample specification did not allow classes to emerge that were present in particular countries. For example, Norway may have had a more distinct cohabitation class that is indistinguishable from marriage, and the other countries with more traditional patterns may have prevented this pattern from emerging. On the other hand, the countries with newer patterns may have prevented additional traditional patterns from emerging. To address this issue, we took two approaches. First, we removed two countries with very traditional patterns (Italy and Spain) and then two countries with newer patterns (Norway and the Netherlands) and reran the models. These alternative strategies also resulted in the same number of classes, none of which were substantially different from those in the original pooled dataset. Second, we examined each country separately. This resulted in far fewer classes (a maximum of six), none of which were substantially different from the original pooled model. This check indicates that the smaller datasets have less statistical power and result in less variation, which make the few classes extracted a crude description of partnership behavior. Therefore, we feel confident that the pooled dataset is not only representative of the examined cohorts and countries but also allows for greater heterogeneity to emerge in each of the countries and cohorts.
5. Results
5.1 Extracted classes
As discussed above, we are interested in determining the optimal number of latent classes that reflect relationship patterns across Europe and for the United States. The LMR-LRT p-values indicate that the addition of an eighth class improves model fit at the 5% level (LMR p-value is 0.018). Since the LMR-LRT tends to be conservative (Nylund, Asparouhov, and Muthén 2007) we accept 5% significance as sufficient
Perelli-Harris and Lyons-Amos: Changes in partnership patterns across the lifecourse
http://www.demographic-research.org 159
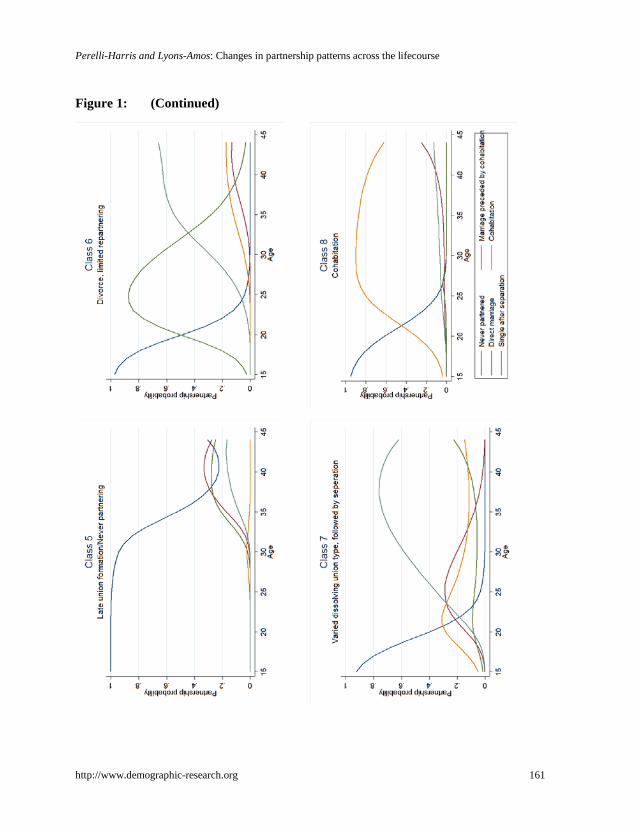
evidence of the existence of eight classes. The addition of a ninth class is not significant on the same criterion, so we select the eight-class model. The eight classes extracted from the model are shown in Figure 1. (See also Appendix 1a and 1b for an alternative presentation of results.) Note that the area under the curve represents the probability of being in a particular relationship state at a given age. Thus, the peak of each growth curve shows the ages when that state is most likely for individuals in each class.
The eight classes that emerge differ across each of the dimensions discussed in the theoretical framework. First, the classes represent different types of union. Classes 1 and 2 are dominated by direct marriage. Classes 3 and 4 show some cohabitation and primarily stable marriage preceded by cohabitation. Class 5 shows late union formation, dominated by cohabitation; class 8 is also characterized by cohabitation followed by some marriage in the early 40s. Second, the classes show how age contributes to the distinction between different patterns of union formation. Class 2 shows the postponement of direct marriage compared to class 1, while class 4 shows the postponement of marriage preceded by cohabitation compared to class 3. Class 5 stands out with its late pattern of union formation. Finally, we can see union dissolution and re-partnering predominantly in classes 6 and 7.
Note that because the latent class growth curve models optimize both the type of union and the age at which different transitions occur, the classes are not perfectly aligned along any dimension. Nearly every class includes a small probability of experiencing other behaviors, or the behaviors are not precisely timed at a given period but instead occur across the life course. For example, class 2 has a tiny probability of experiencing separation in the early 40s. These small deviations are necessary, because the range and timing of behaviors is quite complex for the thousands of respondents in the dataset. Nonetheless, the classes capture a large range of significant patterns. We now turn to a detailed description of each class.

Demographic Research: Volume 33, Article 6
160 http://www.demographic-research.org
Figure 1: Latent classes based on models of growth trajectories
Perelli-Harris and Lyons-Amos: Changes in partnership patterns across the lifecourse
http://www.demographic-research.org 161
Figure 1: (Continued)

Demographic Research: Volume 33, Article 6
162 http://www.demographic-research.org
Classes 1 & 2: Direct marriage, stable throughout. Class 1 shows a very early marriage pattern, with the bulk of direct marriages predicted to occur before age 20, and all marriages predicted to occur before age 23. The marriages are essentially stable with a tiny upturn in divorce to about 4% at age 44. Class 2 shows a similar pattern, only postponed by about 5 years. Nearly all marriages occur before age 30, with a probability of 99% of the class being married in their 30s. Only a tiny percentage is likely to end in divorce.
Classes 3 & 4: Premarital cohabitation followed by relatively stable marriage. Classes 3 and 4 represent marriage that was preceded by cohabitation, but class 3 shows an earlier pattern of union formation than class 4. For class 3, nearly all women are predicted to enter into a union by age 27. About a third of the class is likely to experience cohabitation at age 19, with a high probability of transitioning to marriage shortly thereafter. By age 30 the predicted probability of marriage is 97%. Note that there is more than a 20% chance that women in class 3 are likely to experience divorce by age 44, which is much higher than in the early marriage class (class 1). This suggests that women who premaritally cohabited at an early age have higher divorce rates than women who directly married, as has been found in previous studies (Liefbroer and Dourleijn 2006). The separation line does not climb above 0 until the late 30s, when all women would have already married. Thus, in this class, cohabitation only precedes marriage and does not therefore capture behaviors of dissolving cohabiting relationships with marital re-partnering. Class 4 has a later pattern of marriage preceded by cohabitation, but in this class the probability of women premaritally cohabiting at age 25 is nearly 50%. The probability of marriage is over 90% among women in their thirties. Fewer women are predicted to have divorced by age 44, probably because they had been married for a shorter period of time or because women who marry later have lower divorce risks than those who marry earlier. Note that class 4 also includes a small bump of women who directly married, separated, and then entered cohabitation followed by marriage, suggesting that early divorces are likely to be followed by cohabitation rather than direct marriage.
Class 5: Late union/never partnering. Class 5 captures late and varied partnership behavior. The never-partnered state extends into the early 30s, with the probability of never being partnered above 95% until after age 27. Marriage preceded by cohabitation starts to increase in the early 30s, with about one third of respondents predicted to be in this type of marriage in their early 40s. Some direct marriages occur in the early 30s, but the probability of directly marrying levels off at around 30% after age 35. Some of the unions also separate, with a steady increase in singles in the mid-30s, but it is difficult to know if those who separate are likely to re-enter a partnership. Although there is a bump in cohabitation between the ages of 25 and 35, this never exceeds 5%. Class 5 also captures those who do not form partnerships before age 44; this class is the

Perelli-Harris and Lyons-Amos: Changes in partnership patterns across the lifecourse
http://www.demographic-research.org 163
only one with a probability of never marrying in the 30s greater than 1%. At age 44, nearly 25% are still unpartnered, with a small upturn that captures anyone remaining unpartnered in the dataset.
Classes 6 and 7: Divorce and Separation. Classes 6 and 7 represent relationship patterns with substantial divorce and separation. In class 6, direct marriage starts early, with a steep increase in the teenage years. The probability of direct marriage then peaks around age 25 at nearly 90%. Starting in the late 20s, divorce starts to increase; we can assume these are divorces from marriage, because they are preceded by marriage, not cohabitation. By the late 40s, over 65% of women are predicted to still be single after separation. Some enter a second (or possibly third or higher) cohabitation or marriage preceded by cohabitation. It is unlikely that women re-enter direct marriage in this class, because the direct marriage trajectory declines so dramatically after age 25. Class 7 has substantial premarital cohabitation and marriage followed by divorce. Cohabitation peaks at age 22 followed by a similar bump in ‘marriage preceded by cohabitation’, shifted to the right. Direct marriage is also at a low level in this class: it appears that those who separate could directly remarry, because the probability of direct marriage climbs above 20% after age 40. Nonetheless, direct remarriage is at a very low level except in the early 40s. Overall, however, the majority of women allocated to this class have a higher probability of remaining single after separation, into their 30s and 40s.
Class 8: Cohabitation. Because of its predominant cohabitation trajectory, class 8 could be considered the class in which cohabitation is closest to ‘indistinguishable from marriage’. Nonetheless, this class is not completely similar to any of the marriage classes (i.e., classes 1–4). Unlike the marriage trajectories in classes 1–4, the cohabitation trajectory in class 8 does not reach 90% and remains relatively stable. Instead, the cohabitation trajectory peaks around age 29 and begins to decline substantially after the mid-30s, with a low level of separation and a steady increase in marriage preceded by cohabitation. The ‘marriage preceded by cohabitation’ trajectory peaks to about a quarter after age 40, suggesting that cohabitation is not a long-term state. This class also includes a small bump in ‘direct marriage’ and a low level of separation, representing women who directly marry, divorce, and then enter cohabitation. Thus, while long-term cohabitation does have its own class, the class is not identical to a marriage class or even one where marriage is preceded by cohabitation.

Demographic Research: Volume 33, Article 6
164 http://www.demographic-research.org
5.2 Posterior class distributions
We now turn to a comparison of the heterogeneity of relationship patterns within and across countries. Figure 2 presents the average predicted probability for women to fall into each class by country for the birth cohorts a) 1945–54, b) 1955–64, and c) 1965–74 (see also Appendices 1a and 1b for tables showing the Mean posterior distribution of class membership by country and cohort). As expected, the three cohort figures reflect the differences in marriage timing and the uptake of premarital cohabitation across Europe and the U.S. In each figure the countries are ordered according to class 1, the early direct marriage class. In general, all three figures are dominated by the first four marriage classes, which primarily represent marriage that remains stable into the women’s late 30s and early 40s. The third and fourth classes include some premarital cohabitation, but this type of cohabitation quickly changes into marriage, which generally lasts into the mid-40s. Relatively few women fall into class 5, the late partnership formation class, indicating that co-residential partnerships are not being abandoned altogether, nor even postponed much into the 30s. Nonetheless, this class is smaller in the earlier cohorts and does become larger over time, especially in Belgium and the Southern European countries.
Thus, even though we have ordered the classes by the ‘early’ stable marriage category in Figure 2, we reiterate that the classes not only reflect age but also type of union and separation. In all cohorts, the countries with later and more heterogeneous union formation patterns are generally at the top of Figure 2; for example, those in Northern Europe. Some early marriage countries, for example Russia, may not be as near to the bottom as expected, because some respondents who marry early end up in the divorce class (class 6).

Perelli-Harris and Lyons-Amos: Changes in partnership patterns across the lifecourse
http://www.demographic-research.org 165
Figure 2: Mean posterior probability of class membership by country for a) 1945–54 birth cohorts, b) 1955–64 birth cohorts, and c) 1965–74 birth cohorts
a)
b)

Demographic Research: Volume 33, Article 6
166 http://www.demographic-research.org
Figure 2: (Continued)
c)
Notes: * This Austrian cohort only includes women born 1960–64, because only women up to 49 were interviewed in 2008/9.
**We only include the 1965–74 cohorts in Poland, because only women up to age 40 were interviewed in 2006. † The 1995 NSFG was used for the 1950–54 and 1955–64 cohorts. † † The 2006-08 NSFG was used for the 1965–74 cohorts.
We now turn to a separate description of each cohort figure. Figure (a) shows the
1945–54 cohort, which is the ‘baby boomer’ cohort in many countries. This cohort formed unions during the ‘Golden Age of Marriage’, when marriage was at its peak. Figure (a) indicates that over 50% of respondents in all countries remained in stable direct marriages until their mid-40s. However, we can already see some interesting divergence from this stable marriage pattern. Premarital cohabitation is at a low level in most countries, as is divorce and repartnering. Estonia, Norway, the US, and Russia have over 40% of women falling into classes not dominated by direct marriage, although in Estonia, Norway, and Russia most of those who do not directly marry premaritally cohabit (classes 3 and 4) or form unions later in life (class 5). The US has a relatively large percentage of women falling into the divorce and separation classes

Perelli-Harris and Lyons-Amos: Changes in partnership patterns across the lifecourse
http://www.demographic-research.org 167
(class 6 and class 7). This is not surprising, since the US had early reforms in divorce law and an earlier upsurge in divorce than in many countries. However, Lithuania, Russia, and Estonia also had large bands for class 6, reflecting high divorce rates in these countries. Some countries had practically no divorce in this cohort, for example Spain and Italy, which are dominated by direct marriage.
The 1955–64 cohorts started to show a greater percentage of countries experiencing premarital cohabitation and other patterns of union formation behavior. Less than 25% of women in Austria and Norway directly married, while less than half directly married in Western Europe, Estonia, and the US. Southern and Eastern Europe continued to have a greater share directly marrying. The widening of the class 3 and class 4 bars indicate that most of Western and Northern Europe and the US experienced an increase in premarital cohabitation: an increase very limited in Southern Europe and most of Eastern Europe, with the exception of Bulgaria, which had substantial early premarital cohabitation. However, the class 8 bar, which represents the cohabitation class, has only limited increases, indicating that long-term cohabitation (even if followed by marriage) was still relatively rare. Lithuania, Russia, and to some extent Estonia stand out with the largest class 6 bars, indicating a high proportion that divorce with some entrance into a new cohabiting union or marriage preceded by cohabitation. Interestingly, the US had very little change between the two cohorts; the divorce class (class 6) declined slightly, with a slight increase in the class 7 bar, suggesting that some people who married and divorced cohabited and possibly married and then dissolved their relationships. The US’s large class 7 bar corroborates studies which show a high level of “relationship churning” (Cherlin 2009), but it no longer seems the outlier when compared to much of Eastern Europe.
The change between the 1955–64 cohort and 1965–74 cohort is remarkable. In the latter only the Eastern European countries have more than 25% of respondents in the early marriage class (class 1). Italy, Spain, and to some degree Poland show a large increase in class 2, which indicates that the greatest changes in relationship formation in these countries have been due to the timing of marriage, not new union forms or union dissolution. In fact, divorce class 6 and separation class 7 are still miniscule in Italy and Spain. The Northern and Western European countries and the US, on the other hand, have experienced a substantial increase in marriage that is preceded by cohabitation, particularly in class 4, suggesting that women are spending longer periods in premarital cohabitation and postponing marriage.
Many Northern and Western European countries have also experienced a substantial increase in class 8, from under 10% to over 20% in some Western European countries. This increase implies that long-term cohabitation is becoming more popular, but nonetheless it often transitions to marriage or ends in separation in the late 30s and early 40s. However, it is possible that figure (c) may not represent the experiences of

Demographic Research: Volume 33, Article 6
168 http://www.demographic-research.org
the 1970–74 cohorts, because their cohabiting unions may be more stable and less likely to convert to marriage in their late 30s and early 40s, which is not completely captured in class 8. The experience of the youngest cohorts could flatten the shape of the cohabitation trajectory in class 8; however, we will not know for sure until full relationship data becomes available.
Lithuania, Russia, Bulgaria, and the US have not seen as much of an increase in long-term cohabitation (class 8), but instead have seen a substantial increase in divorce and separation. This indicates that a substantial proportion of relationships in these countries remain fragile. In most countries, however, the divorce class (class 6) has shrunk over time. In the Northern and Western European classes the decline in divorce has been accompanied by an increase in class 7, suggesting that relationships which are more likely to break down no longer start off with early direct marriage, but instead start with early cohabitation sometimes followed by marriage. It is possible that the decline in class 6 is because the youngest cohorts (1970–74) are not exposed to risk long enough for them to experience divorce. However, since class 6 is dominated by direct marriage, it is unlikely that many young women in Northern and Western Europe would end up in class 6 rather than the direct marriage classes (1 or 2), especially because the bars for these classes are relatively small. Instead, it is more likely that women transfer from classes 3 or 8 into class 7. On the other hand, in the Eastern European countries, which still have a large proportion of the population falling into the direct marriage classes, class 6 may increase over time as more women divorce.
6. Discussion
Numerous studies on European countries and the US show that marriage has been postponed, cohabitation has increased, and unions are more likely to dissolve (Sobotka and Toulemon 2008; Kennedy and Bumpass 2008; Billari and Liefbroer 2010). However, no study has been able to capture all of these dimensions simultaneously to show which changes have contributed the most to new patterns of union formation. Here we illustrate the variety of relationship patterns in Europe and the United States and show how the distribution of these patterns has shifted over time. The value of this approach is that it shows the relative importance of different types of transition for changing union patterns. Rather than looking only at one event – or the timing of one event – we can see which event matters most to changes in overall partnership patterns. These findings lead us to several conclusions.
First, the figures show that most of the change in union formation has occurred due to the postponement of stable marriages rather than the increase in long-term cohabitation and divorce. In all countries we can see a decline in the early marriage

Perelli-Harris and Lyons-Amos: Changes in partnership patterns across the lifecourse
http://www.demographic-research.org 169
classes and an increase in the later marriage classes. The vast majority of marriages were stable throughout the respondents’ 30s and early 40s, when women would have been having children. For example, in the 1965–74 cohort more than 50% of respondents were in stable marriage classes (1, 2, 3, or 4), and in most countries this percentage was closer to 60 or 70. These results suggest that in most countries, marriage has been changing primarily due to the increase in premarital cohabitation, a development which should have fewer negative implications than if marriage were changing more due to divorce.
We can also see the role that cohabitation plays in shifting the age at marriage. Most studies analyzing cohabitation and marriage use competing risk hazard models to model choices between the two types of union (e.g., Hoem et al. 2009), rather than examining how cohabitation may shift the age at marriage. Our approach shows that across most countries premarital cohabitation delays the entrance into stable marriages, but has not become a long-term alternative. For example, the broadening of class 4 in Northern and Western Europe in Figure 2 shows how relationships often start with cohabitation that later transition to official marriage. Nonetheless, in countries such as Spain and Italy the primary change in relationship patterns has been due to changes in the timing of direct marriage without premarital cohabitation (a shift from class 1 to 2). We also see a small increase in class 5 in most of Western and Southern Europe, indicating postponing or not entering unions before age 45. Thus, across Europe and the US, changes in the timing of living with and marrying a partner have been one of the most crucial changes to partnership formation in the past decades.
Second, the LCGMs did not produce a cohabitation class that looked identical to the marriage classes. Previous research based on life-table estimates has suggested that cohabitation in some countries looks like an “alternative to marriage” or “indistinguishable from marriage”, suggesting that cohabiting unions have become long-term, stable unions (Heuveline and Timberlake 2004; Kiernan 2004). Yet long-term cohabitation without some entrance into marriage or separation did not emerge as a class by itself. Instead, we find that in the cohabitation class, women tend to marry or separate in their late 30s or 40s. This suggests that cohabitation is not a replacement for marriage, with consistent stability throughout the reproductive years. It is important to note, however, that union formation is changing rapidly, and long-term cohabitation may be increasing. Our models cannot take into account the behavior of women in the youngest cohort (1970–74) after age 30 or 35 (depending on the year of interview). It is possible that cohabiting women in these cohorts will not marry in their late 30s or early 40s, which could possibly alter the cohabitation trajectory of class 8. If this happens, cohabitation could become more indistinguishable from marriage in the coming years.
Third, our findings show how relationship patterns are changing due to shifts in separation and re-partnering. As in some other studies (e.g., Liefbroer and Dourleijn
Demographic Research: Volume 33, Article 6
170 http://www.demographic-research.org
2006), we find that cohabitation and marriages preceded by cohabitation are more likely to end in separation than direct marriages. The separation class dominated by premarital cohabitation (class 7) is becoming more prevalent than the divorce class dominated by direct marriage (class 6), although this is predominantly due to the decline in direct marriage. We did not find evidence of many women directly remarrying: class 6 shows that divorced women may enter into cohabitation which is sometimes followed by marriage, but the downward-sloping direct marriage line suggests that women are not directly remarrying. Class 7 does have some women directly remarrying, but it is in the context of higher levels of cohabitation and marriage preceded by cohabitation. As a whole, these results provide evidence that cohabitation is becoming more prevalent for second and higher unions.
Several limitations of this research must be noted. First, as discussed above, respondents in the later cohorts of 1965–74 have not reached 45 by the time of the survey. This could possibly underestimate the probability of falling into the separation or divorce classes and overestimate the probability of falling into classes with less separation. Second, because we must specify the trajectories using yearly data, relationships may be truncated and periods of separation lasting less than a year may be missed; however, this applies to relatively few cases. Third, each survey is subject to errors and limitations that may bias results (see Perelli-Harris, Kreyenfeld, and Kubisch 2010 for a description of each survey), although the surveys have been frequently used in other studies and generally found to accord with official statistics (Vergauwen et al. 2015). Finally, these analyses do not include covariates that could help to explain whether the patterns may be stratified within countries, for example by education (see Perelli-Harris and Lyons-Amos 2014), or why partnership patterns are changing across countries. Future research using latent class growth curves could provide greater insight into the predictors of partnership patterns or associated outcomes.
In general, this investigation has provided insight into the heterogeneity of relationship behavior within countries and shown the similarity of relationship patterns across countries. The findings reinforce the idea that summary measures do not necessarily capture the diversity of behaviors within a country and that countries may end up looking more like each other once heterogeneity is taken into account. The US is an ideal case for illustrating this. While the US appears to be an outlier when using certain summary statistics, such as the percentage of cohabiting unions that dissolve or the number of marriages that end in divorce (Cherlin 2009), we can see that the US does not stand out when observing relationship patterns by age and union type. Although we saw that the US was unusual in the 1950–54 cohort, especially due to the higher proportion of respondents who were in the divorce classes, the US did not stand out in the subsequent cohorts. In fact, the US does not appear to have disproportionately higher “relationship churning” in the later cohorts, especially when compared to the
Perelli-Harris and Lyons-Amos: Changes in partnership patterns across the lifecourse
http://www.demographic-research.org 171
Eastern European countries, which have rarely been included in previous comparisons. Russia, Lithuania, and Estonia have a greater proportion of the population falling into classes 6 and 7, indicating more relationship instability and turnover. Therefore, our analysis shows that patterns of union dissolution and repartnering in the US are more similar to Eastern than Western Europe. The underlying reasons for the partnership patterns may be similar: for example, these societies have been facing economic uncertainty that may strain relationships. Previous research has shown that childbearing within cohabitation in Russia and the US can be characterized by a “pattern of disadvantage” (Perelli-Harris and Gerber 2011; Perelli-Harris et al. 2010, McLanahan 2004), which may be carrying through to partnership instability in general. On the other hand, the explanations for similar partnership patterns could be quite different, reflecting unique cultural responses to social change. In any case, further research needs to explore why these countries have such unstable partnership patterns.
Finally, our analyses have provided insight into how relationship patterns are changing throughout the reproductive period. In most contemporary countries, marriage and cohabitation are intertwined with each other; cohabitation is increasingly preceding marriages that last throughout the reproductive period, and, less frequently, partnerships are followed by divorce. However, our findings show that changes in union formation across countries do not necessarily occur in the same way. In Northern and Western Europe the entrance into and exit from marriage has become much more unpredictable, with an increase in variety of union patterns, although most marriages are still stable throughout the reproductive years. In Southern Europe the emergence of cohabitation and divorce has not been as important as the postponement of marriage, indicating that the institution of marriage has remained strong. Nonetheless, the delay in direct marriage must be leading to differences in the way men and women conduct intimate relationships without living together, as well as the interaction with families who are increasingly supporting single people as the age at leaving home increases. In parts of Eastern Europe, on the other hand, marriage is more likely to begin without cohabitation but end with divorce, suggesting that marital relationships are more fragile. Finally, although the United States is often considered an outlier in terms of relationship churning, our findings show that Eastern Europe is quite similar, but without the steep increase in cohabitation. Thus, although unions are changing in all countries, they are not changing in the same way, nor following universal trajectories of change.

Demographic Research: Volume 33, Article 6
172 http://www.demographic-research.org
7. Acknowledgments
An earlier version of this article was presented at the Seminar on “First Union Patterns around the World,” organized by the IUSSP, Madrid, Spain, June 20–22, 2012. We would like to thank the participants at this seminar, at the Max Planck Institute for Demographic Research, and at the Centre for Population Change at the University of Southampton for insightful comments, particularly Julia Mikolai and Ann Berrington. Models were estimated using the iridis-3 high performance computing facility at the University of Southampton. Thank you to everyone who helped collect, clean, and harmonize the Harmonized Histories data, especially Karolin Kubisch at MPIDR. The GGS data were obtained from the GGP Data Archive and refer to the publication that contains the model survey instruments: United Nations 2005. Generations & Gender Programme: Survey Instruments. New York and Geneva: UN, 2005. Please see www.nonmarital.org for further acknowledgments. This project was funded by the European Research Council Starting Grant CHILDCOHAB.

Perelli-Harris and Lyons-Amos: Changes in partnership patterns across the lifecourse
http://www.demographic-research.org 173
References
Amato, P.R. (2010). Research on Divorce: Continuing Trends and New Developments. Journal of Marriage and Family 72(3): 650–666. doi:10.1111/j.1741-3737.2010. 00723.x.
Andersson, G. and Philipov, D. (2002). Life-table representations of family dynamics in Sweden, Hungary, and 14 other FFS countries: A project of descriptions of demographic behavior. Demographic Research 7(4): 67–144. doi:10.4054/demre s.2002.7.4.
Berrington, A. and Diamond, I. (1999). Marital dissolution among the 1958 British birth cohort: The role of cohabitation. Population Studies 53(1): 19–38. doi:10.1 080/00324720308066.
Billari, F.C. (2005). Life course analysis: two (complementary) cultures? Some reflections with examples from the analysis of the transition to adulthood. Advances in Life Course Research 10: 261–281. doi:10.1016/1040-2608(05)10 010-0.
Billari, F.C. and Liefbroer, A.C. (2010). Towards a new pattern of transition to adulthood? Advances in Life Course Research 15(2–3): 59–75. doi:10.1016/j.alc r.2010.10.003.
Cheadle, J.E, Amato, P.R., and King, V. (2010). Patterns of nonresident father contact. Demography 47(1): 205–225. doi:10.1353/dem.0.0084.
Cherlin, A.J. (2004). The Deinstitutionalization of American Marriage. Journal of Marriage and Family 66: 848–861. doi:10.1111/j.0022-2445.2004.00058.x.
Cherlin, A.J. (2009). The Marriage-go-round: The state of marriage and the family in America today. New York: Knopf.
Coale, A.J. (1992). Age of Entry into Marriage and the Date of the Initiation of Voluntary Birth Control. Demography 29(3): 333–341. doi:10.2307/2061821.
Dariotis, J.K, Pleck, J.H., Astone, N.M., and Sonenstein, F.L. (2011). Pathways of early fatherhood, marriage, and employment: A latent class growth analysis. Demography 48(2): 593–623. doi:10.1007/s13524-011-0022-7.
Elzinga, C. and Liefbroer, A. (2007). De-standardization of Family-Life Trajectories of Young Adults: A Cross-National Comparison Using Sequence Analysis. European Journal of Population 23(3): 225–250. doi:10.1007/s10680-007-9133-7.

Demographic Research: Volume 33, Article 6
174 http://www.demographic-research.org
Esping-Andersen, G. (1990). The three worlds of welfare capitalism. Princeton, NJ: Princeton University Press.
Galezewska, P., Perelli-Harris, B., and Berrington, A. (2013). Repartnering after divorce and separation in Europe and the United States. Paper presented at the Divorce Conference 2013, Oxford, U.K., September 26–28 2013.
Goldberg, R.E. (2013). Family Instability and Pathways to Adulthood in Cape Town, South Africa. Population and Development Review 39(2): 231−256. doi:10.1111/j.1728-4457.2013.00590.x.
Heuveline, P. and Timberlake, J.M. (2004). The role of cohabitation in family formation: the United States in comparative perspective. Journal of Marriage and Family 66(5): 1214–1230. doi:10.1111/j.0022-2445.2004.00088.x.
Hix-Small, H., Duncan, T.E., Duncan, S.C., and Okut, H. (2004). A multivariate associative finite growth mixture modelling approach examining adolescent alcohol and marijuana use. Journal of Psychopathology and Behavioural Assessment 26(4): 255–270. doi:10.1023/B:JOBA.0000045341.56296.fa.
Hoem, J.M., Jasilioniene, A., Kostova, D., and Muresan, C. (2009). Traces of the Second Demographic Transition in selected countries in Central and Eastern Europe: union formation as a demographic manifestation. European Journal of Population 25(2): 123–156. doi:10.1007/s10680-009-9177-y.
Jasilioniene, A. (2007). Premarital conception and divorce risk in Russia in light of the GGS data. Rostock, Germany: Max Planck Institute for Demographic Research (MPIDR Working Paper WP-2007-025).
Kalmijn, M. (2007). Explaining cross-national differences in marriage, cohabitation, and divorce in Europe, 1990–2000. Population Studies 61(3): 243–263. doi:10.1 080/00324720701571806.
Kennedy, S. and Bumpass, L. (2008). Cohabitation and children’s living arrangements: New estimates from the United States. Demographic Research 19: 1663–1692. doi:10.4054/DemRes.2008.19.47.
Kennedy, S. and Ruggles, S. (2014). Breaking up is hard to count: The rise of divorce in the United States, 1980–2010. Demography 51(2): 587–598. doi:10.1007/s13 524-013-0270-9.
Kiernan, K. (2004). Unmarried cohabitation and parenthood: here to stay? European perspectives. In: Smeeding, T.M., Rainwater, L., and Moynihan, D.P. (eds.). The Future of the Family. New York: Russell Sage Foundation: 66–95.

Perelli-Harris and Lyons-Amos: Changes in partnership patterns across the lifecourse
http://www.demographic-research.org 175
Lesnard, L., Cousteaux, A., Chanvril, F., and Le Hay, V. (2010). Do Transitions to Adulthood Converge in Europe? An Optimal Matching Analysis of Work-Family Trajectories of Young Adults from 20 European Countries. OSC Notes & Documents: 2010–2004.
Liefbroer, A.C. and Dourleijn, E. (2006). Unmarried Cohabitation and Union Stability: Testing the Role of Diffusion Using Data from 16 European Countries. Demography 43(2): 203–221. doi:10.1353/dem.2006.0018.
Lillard, L.A, Brien, M.J., and Waite, L.J. (1995). Premarital cohabitation and subsequent marital. Demography 32(3): 437–457. doi:10.2307/2061690.
Lo, Y., Mendell, N.R., and Rubin, D.B. (2001). Testing the number of components in a normal mixture. Biometrika 88: 767–778. doi:10.1093/biomet/88.3.767.
Manning, W.D., Brown, S.L., and Payne, K.K. (2014). Two decades of stability and change in age at first union formation. Journal of Marriage and Family 76(2): 247–260. doi:10.1111/jomf.12090.
Manning, W.D. and Smock, P.J. (2005). Measuring and Modeling Cohabitation: New Perspectives From Qualitative Data. Journal of Marriage and Family 67(4): 989–1002. doi:10.1111/j.1741-3737.2005.00189.x.
McLanahan, S. (2004). Diverging Destinies: How children are faring under the Second Demographic Transition. Demography 41(4): 607–627. doi:10.1353/dem.2004.0 033.
Muthén, B.O. (2004). Latent variable analysis: Growth mixture modeling and related techniques for longitudinal data. In: Kaplan, D. (ed.). Handbook of quantitative methodology for the social sciences. Thousand Oaks, CA: Sage Publications: 346–370. doi:10.4135/9781412986311.n19.
Muthén, L.K. and Muthén, B.O. (1998–2011). Mplus User’s Guide. Los Angeles, CA: Muthén & Muthén.
Nylund, K.L., Asparouhov, T., and Muthén, B. (2007). Deciding on the Number of Classes in Latent Class Analysis and Growth Mixture Modeling: A Monte Carlo Simulation Study. Structural Equation Modeling 14(4): 535−569. doi:10.1080/10705510701575396.
Perelli-Harris, B., Sigle-Rushton, W., Kreyenfeld, M., Lappegård, T., Keizer, R., and Berghammer, C. (2010). The Educational Gradient of Childbearing within Cohabitation in Europe. Population and Development Review 36(4): 775‒801. doi:10.1111/j.1728-4457.2010.00357.x.

Demographic Research: Volume 33, Article 6
176 http://www.demographic-research.org
Perelli-Harris, B. and Gerber, T.P. (2011). Nonmarital childbearing in Russia: Second Demographic Transition or Pattern of Disadvantage? Demography 48(1): 317–342. doi:10.1007/s13524-010-0001-4.
Perelli-Harris, B., Kreyenfeld, M., and Kubisch, K. (2010). Technical Manual for the Harmonized Histories Database. Rostock, Germany: Max Planck Institute for Demographic Research (MPIDR Working paper 2010–2011).
Perelli-Harris, B., Kreyenfeld, M., Sigle-Rushton, W., Keizer, R., Lappegård, T., Jasilioniene, A., Berghammer, C., and Di Giulio, P. (2012). Changes in union status during the transition to parenthood: An examination of 11 European countries. Population Studies 66(2): 167–182. doi:10.1080/00324728.2012.6730 04.
Perelli-Harris, B. and Lyons-Amos, M. (2014). Partnership patterns in the United States and across Europe: “Diverging destinies” or “diverging contexts”? Southampton, U.K.: ESRC Centre for Population Change (CPC Working Papers 53).
Perelli-Harris, B. and Sánchez Gassen, N. (2012). How Similar are Cohabitation and Marriage? Legal Approaches to Cohabitation across Western Europe. Population and Development Review 38(3): 435–467. doi:10.1111/j.1728-4457. 2012.00511.x.
Perlman, M., Jenkins, J., Lyons-Amos, M.J., Leckie, G., and Steele, F. (2015). Capturing the sequence of interaction between young siblings. PLoSONE 10(5): e0126353. doi:10.1371/journal.pone.0126353.
Pickles, A. and Croudace, T. (2010). Latent Mixture Models for multivariate and longitudinal outcomes. Statistical Methods in Medical Research 19: 271–289. doi:10.1177/0962280209105016.
Prinz, C. (1995). Cohabiting, Married, or Single. Aldershot, U.K.: Avebury.
Reher, D.S. (1998). Family ties in Western Europe: Persistent contrasts. Population and Development Review 24(2): 203–234. doi:10.2307/2807972.
Reinhold, S. (2010). Reassessing the link between premarital cohabitation and marital instability. Demography 47(3): 719–733. doi:10.1353/dem.0.0122.
Schaeffer, C.M., Petras, H., Ialongo, N., Poduska, J., and Kellam, S. (2003). Modeling growth in boys’ aggressive behavior across elementary school: Links to later criminal involvement, conduct disorder, and antisocial personality disorder. Developmental Psychology 39: 1020–1035. doi:10.1037/0012-1649.39.6.1020.

Perelli-Harris and Lyons-Amos: Changes in partnership patterns across the lifecourse
http://www.demographic-research.org 177
Skew, A, Evans, A., and Gray, E. (2009). Repartnering in the United Kingdom and Australia. Journal of Comparative Family Studies 40(4): 563–585.
Smock, P.J. (2000). Cohabitation in the United States: an appraisal of research themes, findings, and implications. Annual Review of Sociology 26: 1–20. doi:10.1146/an nurev.soc.26.1.1.
Sobotka, T. and Toulemon, L. (2008). Overview Chapter 4: Changing family and partnership behavior: Common trends and persistent diversity across Europe. Demographic Research 19(6): 85–138. doi:10.4054/DemRes.2008.19.6.
Sweeney, M. (2010). Remarriage and Stepfamilies: Strategic Sites for Family Scholarship in the 21st Century. Journal of Marriage and Family 72(3): 667–684. doi:10.1111/j.1741-3737.2010.00724.x.
Teachman, J.D. (2003). Childhood Living Arrangements and the Formation of Coresidential Unions. Journal of Marriage and Family 65(3) 507–524.
Thomson, E., Winkler-Dworak, M., Spielauer, M., and Prskawetz, A. (2012). Union instability as an engine of fertility? A microsimulation model for France. Demography 49(1): 175–195. doi:10.1007/s13524-011-0085-5.
United Nations. (2012). Demographic Yearbook. New York: United Nations.
van Lier, P.A.C., Muthén, B., van der Sar, R.M., and Crijnen, A.A.M. (2004). Preventing disruptive behavior in elementary schoolchildren: Impact of a universal classroom-based intervention. Journal of Consulting and Clinical Psychology 72: 467–478. doi:10.1037/0022-006X.72.3.467.
Vergauwen, J., Wood, J., De Wachter, D., and Neels, K. (2015). Quality of demographic data in GGS Wave 1. Demographic Research 32(24): 723–774. doi:10.4054/DemRes.2015.32.24.
Villeneuve-Gokalp, C. (1991). From Marriage to Informal Union: Recent Changes in the Behaviour of French Couples. Population: An English Selection 3: 81–111
Virtanen, P., Lipiäinen, L., Hammerström, A., Janlert, U., Saloiemi, A., and Nummi, T. (2011). Tracks of labour market attachment in early middle age: A trajectory analysis over 12 years. Advances in Life Course Research 16: 55–64. doi:10.101 6/j.alcr.2011.03.001.
Zakharov, S. (2015). Braki I razvodi v sovremennoi Rossii. (Marriage and divorce in modern Russia). Demoscope Weekly. Moscow, Russia: Higher School of Economics.

Demographic Research: Volume 33, Article 6
178 http://www.demographic-research.org
Appendix 1a: Mean posterior distribution of class membership by country and cohort
Class 1: Early and direct
stable marriage Class 2: Later, direct and
stable marriage Class 3: Early marriage,
preceded by cohabitation Class 4: Postponed marriage,
preceded by cohabitation 1945–54 1955–64 1965–74 1945–54 1955–64 1965–74 1945–54 1955–64 1965–74 1945–54 1955–64 1965–74 Austria
0.128 0.096
0.106 0.064
0.307 0.222
0.177 0.251
Belgium 0.444 0.343 0.163 0.211 0.195 0.128 0.122 0.127 0.137 0.062 0.070 0.198 Bulgaria 0.510 0.488 0.438 0.207 0.122 0.118 0.148 0.204 0.209 0.031 0.055 0.066 Estonia 0.324 0.278 0.181 0.190 0.106 0.040 0.122 0.159 0.202 0.085 0.096 0.0927 France 0.500 0.274 0.080 0.169 0.094 0.066 0.045 0.148 0.186 0.0519 0.147 0.243 Lithuania 0.411 0.353 0.400 0.313 0.257 0.198 0.022 0.042 0.054 0.013 0.025 0.036 Italy 0.527 0.449 0.267 0.401 0.408 0.503 0.007 0.018 0.033 0.010 0.028 0.052 NL 0.498 0.331 0.111 0.228 0.132 0.101 0.045 0.148 0.148 0.074 0.178 0.307 Norway 0.368 0.155 0.056 0.181 0.091 0.060 0.123 0.196 0.161 0.108 0.209 0.268 Poland
0.504
0.267
0.038
0.032
Romania 0.588 0.528 0.544 0.211 0.222 0.169 0.054 0.073 0.097 0.0289 0.031 0.039 Russia 0.399 0.401 0.377 0.166 0.149 0.079 0.077 0.073 0.097 0.057 0.047 0.052 Spain 0.426 0.414 0.217 0.432 0.366 0.419 0.034 0.034 0.044 0.028 0.043 0.072 UK 0.482 0.273 0.087 0.183 0.129 0.105 0.035 0.082 0.105 0.059 0.130 0.222 USAa,b 0.349 0.273 0.131 0.137 0.157 0.159 0.055 0.093. 0.093 0.089 0.107 0.157
Appendix 1b: Mean posterior distribution of class membership by country and cohort
Class 5: Late union
formation/Never partnering Class 6: Divorce, limited re-
partnering Class 7: Varied dissolving
union types Class 8: Cohabitation
1945–54 1955–64 1965–74 1945–54 1955–64 1965–74 1945–54 1955–64 1965–74 1945–54 1955–64 1965–74 Austria
0.09 0.086
0.052 0.034
0.067 0.096
0.066 0.148
Belgium 0.095 0.138 0.140 0.023 0.011 0.008 0.020 0.072 0.095 0.0186 0.041 0.126 Bulgaria 0.035 0.026 0.024 0.046 0.053 0.048 0.010 0.027 0.033 0.0106 0.021 0.060 Estonia 0.034 0.037 0.039 0.144 0.140 0.071 0.063 0.097 0.122 0.035 0.084 0.249 France 0.087 0.106 0.093 0.085 0.073 0.015 0.029 0.056 0.074 0.034 0.104 0.238 Lithuania 0.052 0.056 0.098 0.139 0.219 0.179 0.031 0.036 0.069 0.014 0.009 0.031 Italy 0.038 0.070 0.095 0.003 0.007 0.006 0.003 0.008 0.018 0.007 0.008 0.024 NL 0.024 0.045 0.056 0.077 0.050 0.021 0.034 0.056 0.060 0.017 0.056 0.191 Norway 0.089 0.100 0.104 0.062 0.051 0.015 0.045 0.084 0.112 0.020 0.110 0.221 Poland
0.029
0.065
0.030
0.030
Romania 0.018 0.019 0.029 0.069 0.076 0.050 0.009 0.024 0.029 0.020 0.023 0.038 Russia 0.053 0.042 0.030 0.142 0.177 0.133 0.072 0.067 0.129 0.031 0.043 0.089 Spain 0.042 0.062 0.117 0.027 0.048 0.041 0.003 0.010 0.018 0.005 0.019 0.068 UK 0.076 0.129 0.137 0.132 0.150 0.065 0.024 0.065 0.111 0.006 0.037 0.164 USAa,b 0.047 0.043 0.079 0.168 0.115 0.100 0.114 0.154 0.189 0.035 0.054 0.087 Note: a) data are from 1995 National Survey of Family Growth and refer to the 1950–54 and 1955–64 cohorts; b) data are from
2006–08 National Survey of Family Growth and refer to the 1965–74 cohorts. Sources: Generations and Gender Surveys in Austria (2008–09), Belgium (2008–10), Bulgaria (2004), Estonia (2004–5), France
(2005), Lithuania (2006), Italy (2003), Norway (2007–8), Romania (2005), and Russia (2004); Fertility and Family Survey in the Netherlands (2003); British Household Panel Survey for the United Kingdom (2005–6); Poland Employment, Family, and Education Survey (2006); Spanish Fertility Survey (2006); US National Survey of Family Growth (1995, 2006–8).