challenges and opportunities for the nordic power …...system flexibility one specific feature of...
TRANSCRIPT

Challenges and Opportunities for the Nordic Power System
Nordic Power System

This report summarises the shared view of the four Nordic Transmis-
sion System Operators (TSOs) Svenska kraftnät, Statnett, Fingrid and
Energinet.dk, of the key challenges and opportunities affecting the
Nordic power system in the period leading up to 2025.
The Nordic power system is changing. The main drivers of the changes
are climate policy, which in turn stimulates the development of more
Renewable Energy Sources (RES), technological developments, and a
common European framework for markets, operation and planning.
While the system transformation has already started, the changes will
be much more visible by 2025.
The structural changes will challenge the operation and planning of
the Nordic power system. The main changes relate to the following:
• The closure of thermal power plants.
• The share of wind power in the Nordic power system is rising.
Installed capacity for wind power is expected to triple in the period
2010–2025.
• Swedish nuclear power plants will be decommissioned earlier than
initially planned (four reactors with a total capacity of 2,900 MW will
be decommissioned by 2020) while Finland will construct new nu-
clear capacity (one unit of 1,600 MW, which will be onstream in
2018 and another unit of 1,200 MW planned for 2024).
• The capacity from interconnectors between the Nordic power
system and other systems will increase by more than 50 per cent
in 2025. The existing interconnectors and those under construc-
tion are shown in Figure 1.
Executive summary
Overview of existing HVDC interconnectors and HVDC interconnectors under construction
Figure 1 Overview of existing and planned HVDC interconnectors in the Nordic power system. Only those planned HVDC interconnectors with a final investment decision are included.
Existing
Skagerrak 1–4NorNedKonti-Skan 1–2KontekBaltic CableSwePol LinkFenno-Skan 1–2NordBaltEstlink 1–2Vyborg LinkStorebaelt
1600 MW700 MW
680/740 MW600 MW600 MW600 MW
1200 MW700 MW
1000 MW1400 MW
600 MW
Under Construction
CobraKriegers FlakNord LinkNorth Sea Link
700 MW (2019)400 MW (2019)
1400 MW (2020)1400 MW (2021)
Under development (not in map, comprehensive list in Appendix 3)
Viking LinkDK West – GermanyNorth ConnectHansa PowerBridge
Existing
Skagerrak 1-4 1600 MW
NorNed 700 MW
Konti-Skan 1-2 680/740 MW
Kontek 600 MW
Baltic Cable 600 MW
SwePol Link 600 MW
Fenno-Skan 1-2 1200 MW
NordBalt 700 MW
Estlink 1-2 1000 MW
Vyborg Link 1400 MW
Storebaelt 600 MW
Under Construction
Cobra 700 MW (2019)
Kriegers Flak 400 MW (2019)
Nord Link 1400 MW (2020)
North Sea Link 1400 MW (2021)
Under development (not in map, comprehensive list in Appendix 3)
Viking Link
DK West – Germany
North Connect
Hansa PowerBridge2Page
Nordic Power System

These changes present challenges for forecasting, operation and plan-
ning of the power system. Further automatisation and digitalisation of
the power system could offer new opportunities within system regu-
lation, and enable consumers to play a more active role. Smart me-
ters, energy management systems, automated demand response and
microgrids, are key enablers in the restructuring of the Nordic power
system. The Nordic TSOs are developing these enablers both at a na-
tional and a Nordic level. There will be an increase in the interconnec-
tion of markets, big data processing, price- and system-respondent
components and more advanced system-balancing. The system will
be more complex, more integrated and more automated, and will re-
quire new measures from TSOs, regulators and market stakeholders.
Further development of the currect markets is necessary. Low prices
and market uncertainties are clouding the investment climate for new
generation capacity and adversely affecting the profitability of exist-
ing conventional generation. The capacity mechanisms that are being
introduced and assessed in various European countries represent a
further challenge. The Nordic TSOs wish to improve the current mar-
ket design to accommodate these changes.
It is important to adopt a holistic perspective and to plan the trans-
mission grid in relation to the market and the response from both
generation and consumption. In order to do this efficiently, the TSOs
must have a common understanding of how the changes will affect the
Nordic power system and how we can respond.
Figure 2 shows the Nordic TSOs' best estimate scenario of the Nordic
energy balances in 2025. The main challenges foreseen by the Nordic
TSOs in the period leading up to 2025 include:
• Meeting the demand for flexibility.
• Ensuring adequate transmission and generation capacity to guaran-
tee security of supply and to meet the demand of the market.
• Maintaining a good frequency quality and sufficient inertia in the
system to ensure operational security.
These challenges, many of which we are already facing, but which will
be more prevalent in the years leading up to 2025, are analysed and
discussed in further detail below.
Executive summary
Figure 2 An estimate of production and consumption in the Nordic power system in 2025 as a result of market simulation in 2015.
450
400
350
300
250
200
150
100
50
0
Nordic energy balances 2025
TWh/year
CHP and other thermal
Nuclear power
Wind power
Hydro Power
Industrial consumption
Other consumption
Tota
l
Swed
en
Den
mar
k
Nor
way
Finl
and
3Page
Nordic Power System

System flexibility
One specific feature of the power system is the need to keep power
production at the exact same level as power consumption at all times.
This requires flexibility, which can be defined as the controllable part
of production and consumption that can be used to change input or
output for balancing purposes. Intermittent renewable production is
a main driver for increasing flexibility demand, whereas existing flexi-
bility resources are limited and to some extent decreasing. Increased
transmission capacity towards Continental Europe can provide flexi-
bility in some situations, but also means increased competition for the
low cost flexibility provided by Nordic hydro power.
In a well-functioning power market, a severe shortage of flexibility should
be avoidable. However, it is uncertain whether the current economic in-
centives are sufficiently robust. Potential problems include regulatory
and/or technological obstacles preventing a transition to a system with a
more diversified supply of flexibility, and market designs intended to se-
cure flexible capacity in line with market signals being developed too late.
Another potential challenge could be distortion of the price signals, for
instance through unsuitable RES subsidy schemes or fixed prices for
end users. Such market imperfections will present challenges for sys-
tem operation in the coming years. In severe cases, it could lead to hours
without price formation in the day-ahead market, and periods of insuf-
ficient available balancing resources in the operational hour. It is also
possible that these challenges will occur in individual geographical sub-
areas even though there is enough flexibility available at system-level.
One prioritised area within TSO cooperation involves developing more
knowledge about the technological and economical potential for new
flexibility, in order to obtain a more accurate picture of prospective
challenges in balancing the system. Other possible solutions that
could be implemented by the TSOs include:
• Developing markets to provide the needed flexibility. Finer time
resolution in the day-ahead and intraday markets as well as the
balancing market, and a stronger emphasis on the intraday mar-
kets would reduce imbalances and hence the need to balance
resources within the operational hour.
• Utilising transmission capacity more efficiently - evaluation of
different capacity methods is ongoing.
• Restrict ramping on each HVDC interconnector even further.
Possible solutions requiring broader collaboration:
• Ensuring that the rules and regulations of the market facilitate the
most cost-effective development and utilisation of available flexibility.
• Utilising the AMS meters to further develop demand response.
Generation adequacy
ENTSO-E’s adequacy assessment shows that the Nordic power system
will be able to cover demand in the Nordic countries in 2025; however,
more accurate assessments will be required to obtain a more reliable
evaluation of the situation. The ongoing and predicted changes in the
power system will make it more difficult and more expensive to fully
eliminate the risk of capacity shortages. This implies a need for a clear
definition of generation adequacy, and discussions of the socio-econo-
mic best instruments to use in order to maintain generation adequacy.
At the moment, low market prices represent one of the main challeng-
es for the Nordic power system. Reduced profitability of conventional
power generation will lead to lower capacity of thermal and nuclear
power plants. If price signals do not reach market participants, the lat-
ter will not respond by regulating production and/or changing demand
in shortage/scarcity situations, or investing in new generation. Thus,
securing adequate capacity is also a question of getting prices right.
A second challenge relates to the adoption of appropriate methodol-
ogies and definitions. Traditional adequacy methodologies are deter-
ministic and therefore disregard capacity based on intermittent power
sources. They also underestimate the value of transmission capacity,
and do not cover the stochastic nature of component failure in the
power system. In addition, the current adequacy assessments and
mitigation measures do not fully value cross-border exchange.
Possible solutions that could be implemented by the TSOs:
• Development of harmonised, shared Nordic probabilistic meth-
odologies to address uncertainties in the power system.
• Measures to address adequacy should be identified from a
Nordic perspective; however, mitigation measures can be deve-
loped on both a national and a regional level. Hence, the Nordic
countries need to identify common principles for mitigation measures.
Executive summary
4Page
Nordic Power System

Possible solutions requiring broader collaboration:
• Adequacy is to a large extent a common Nordic challenge which
will necessitate ongoing common market development and imple-
mentation of common adequacy assessments. In order to achieve
this, the regulatory framework will have to adopt common defini-
tions of generation adequacy.
• RES subsidies to be coordinated on the regional level.
Frequency quality
System frequency is an indicator of the instantaneous power balance
between production and consumption and power exchange, while fre-
quency quality is a key indicator of system security. Frequency devia-
tions outside the target area challenge system security by reducing the
balancing reserves available to address disturbances. Frequency quali-
ty is a common feature of the Nordic synchronous system.
Larger imbalances caused by forecast errors and HVDC ramping
present a challenge for the TSOs. Maintaining adequate frequency
and balancing reserves is critical for securing real-time balance. The
current market design, which is based on hourly resolution, does not
guarantee momentary balance within intra-hour timeframes. The
trend of increasing intra-hour imbalances is expected to continue as
a result of faster, larger and more frequent changes in generation and
ramping of HVDC interconnectors. More unpredictable power gener-
ation in the Nordic power system will result in more forecast errors.
Another challenge is the increased need for, though reduced access to,
reserve capacity in the current market situation. Smaller power plants
do not provide the same extent of frequency and balancing reserves
as traditional plants. When fewer large power plants are in operation,
capacity problems can arise, and the system is less well equipped to
maintain stable frequencies.
A third challenge concerns the availability of transmission capacity
for frequency and balancing reserves. Effective management of grid
congestion plays an important role in securing system operation and
efficient resource utilisation. It is not possible to regulate resources to
balance the system if these are stuck behind a bottleneck. The costs of
reserves and availability of transmission capacity vary between areas
and over time, which means that the distribution of reserves must be
dynamically optimised to ensure that necessary grid capacity is avail-
able. This would reduce costs compared with applying fixed distribu-
tion of reserves over time.
Possible solutions that could be implemented by the TSOs:
• Clarification of a common Nordic specification for frequency quality,
including requirements for frequency and balancing reserves.
• Further development of joint Nordic ICT solutions. Introduction of
more advanced systems for supervision and control, and more au-
tomatisation of operational processes.
• Develop Nordic markets for all balancing products.
Possible solutions requiring broader collaboration:
• Finer time resolution in the energy and balancing markets.
• Stronger incentives for Balance Responsible Providers to maintain
the balance by ensuring correct price signals.
• Review efficient and market based solutions for allocating transmis-
sion capacity to balancing and reserve markets.
• Harmonisation of products and market solutions for frequency and
balancing regulation.
Inertia
Inertia in a power system is connected to the rate of change of frequen-
cy. With insufficient inertia, frequency drops can be too rapid, causing
the frequency to reach the load-shedding value before reserves have
reacted sufficiently. Higher volumes of RES, phasing out of nuclear
units, and high imports through HVDC connections all reduce inertia
levels. In 2025 the inertia, measured as kinetic energy, is estimat-
ed to be below the required volume of 120–145 GWs 1–19 per cent
of the time depending on the climate year (based on analyses with
historical reference period 1962–2012). The lowest kinetic energy
values are observed during summer nights with high wind produc-
tion. In the current Nordic power system (2010–2015), the estimated
kinetic energy was below 140 GWs 4 per cent of the time or less;
however, in 2009 the duration was approximately 12 per cent.
The main challenge lies in maintaining sufficient inertia in the system to
guarantee operational security since insufficient inertia would put sys-
tem stability at risk in the event of a large unit trip.
Executive summary
5Page
Nordic Power System

Another challenge relates to the lack of minimum requirements i.e. a
common understanding of how low a level of inertia the system can
accommodate, and expectations of the future Nordic power system.
Market solutions or incentives will be required to ensure that sufficient
inertia is maintained in the system at all times.
The solutions for coping with low inertia can be split between legislative,
market and the TSOs’ own measures.
Possible solutions to be implemented by the TSOs:
• Setting minimum requirements for kinetic energy in the system.
• Limiting the power output of the largest units (generators and importing
HVDC links) in situations with low inertia, to a level where the freque-
ncy remains within the allowed limits in the event of large unit trips.
Possible solutions requiring broader collaboration:
• In the short term, inertia in the system can be increased by running
existing production units with lower average output.
• Adding more frequency containment reserves, including HVDC
Emergency Power Control, or increasing the reaction speed of the
reserves for getting faster responses during disturbances.
• Installing System Protection Schemes or using HVDC links.
• Adding rotating masses, such as synchronous condensers.
• Adding synthetic inertia to the system.
Transmission adequacy
Transmission capacity plays a key role in addressing the system chal-
lenges described above. Adequate transmission capacity enables
cost-effective utilisation of energy production, balancing and inertia
resources and helps to ensure the security of supply.
Each TSO in the Nordic region is responsible for developing the trans-
mission system within its borders. The Nordic TSOs have published na-
tional grid development plans presenting both approved projects and
project candidates. The very nature of the transmission system makes
regional cooperation essential to achieve an effective power system. This
is fully acknowledged by the Nordic TSOs, and joint grid development
plans have been published since 2002. Identified potential transmission
investments are subject to a bilateral study between the involved TSOs.
One challenge of transmission planning involves applying the correct
assumptions and properly valuing all benefits. Uncertainty surrounding
future developments has increased in recent years, making it more diffi-
cult to predict the future power system. In addition, not all power system
benefits of transmission capacity are properly valued when evaluating
transmission investments. The focus has historically been on commer-
cial benefits, while there is a growing need to adequately value the securi-
ty of supply. Consequently, there is a need to further develop cooperation
with regard to modelling tool development and method improvement.
Another difficulty relates to balancing Nordic, European and national per-
spectives in transmission planning. It is critical to address these issues
today in order to successfully deal with predicted system challenges.
A second challenge involves maintaining operational security and an
efficient market while reconstructing the grid. While development and
increased application of live work will help meet this challenge the
planned outages of grid components will nonetheless be very frequent
in the coming decade, with resulting intermittently limited capacity.
The investment portfolio shows that this is especially relevant for the
next few years, since investments for the Nordic TSOs peak in 2018.
Possible solutions that could be implemented by the TSOs:
• Additional transmission capacity can alleviate the challenges with
generation adequacy, flexibility and real-time balancing.
• Improving modelling tools and common understanding of the in-
terpretation of findings, along with a robust scenario strategy.
Improving methods of including additional values in transmission
planning and in-depth analysis of which services that are valuable
for the power system.
Possible solutions requiring broader collaboration:
• Clarification of differences and common goals for grid develop-
ment in the Nordic region.
The way forward
The challenges listed need to be addressed. If no measures are taken,
there could be severe consequences. The timeline in Figure 3 high-
lights the most important triggers (changes) which will exacerbate the
challenges. Leading up to 2025 and beyond, the risk of the identified
challenges will increase. Action from the Nordic TSOs and other stake
Executive summary
6Page
Nordic Power System

holders in the Nordic power sector will reduce the risk.
Improvement possibilities have been identified with regard to mar-
ket design and operations. The Nordic TSOs have started several
projects, including initiatives to boost knowledge about frequency, qual-
ity and handling of inertia; to develop a common market for balancing
reserves, more finely tuned time resolution, full-cost balancing, cost-
recovery and efficient balancing incentives, to stimulate demand side
response and to secure more efficient utilisation of transmission capacity.
More extensive cooperation between the Nordic TSOs is a prerequi-
site for successful development and implementation of the available
solutions; however, the Nordic TSOs cannot achieve everything on
their own. Successfully stabilising the power system will require ex-
tended cooperation across the power sector. An example where coop-
eration between regulators and TSOs is necessary is the EU regulato-
ry cross-border cost-allocation (CBCA) tool, which the Nordic TSOs do
not believe is an efficient way to speed up market integration.
Possible solutions have been identified for each challenge analysed
in this report. Some of these solutions are market based where there
need to be an agreement of which market model to develop and
implement. Other solutions are technical solutions where cost and cost-
sharing are the main issues. A third category of solutions is knowledge
related – more insight is needed in order to evaluate the solutions.
Many of the proposed solutions cannot be developed and implemented
without extensive collaboration with the regulators and the power indu-
stry. The power system is becoming more complex and more integrat-
ed. Cooperation both across country borders and between different
stakeholders in the Nordic power system is a prerequisite for success.
Research, development and demonstrations will also be required,
especially where future solutions are unclear, and/or contain new
technology or concepts. By further developing the R&D cooperation
between the Nordic TSOs, an increased commitment and more effi-
cient information sharing is acheived.
The Nordic TSOs will follow up this report with a second phase that will
further examine the solutions identified in this report. The aim of the next
phase is to take the cooperation a step further and agree on measures.
Executive summary
Figure 3 Timeline of the identified challenges. The figure include four triggers (changes) that will exacerbate the challenges. Leading up to 2025 and beyond, the risk of the identified challenges will increase if no measures are taken.
Timeline of the identified challenges
Timeline of the identified challenges
System flexibility
Transmission adequacy
Generation adequacy
Frequency quality
Inertia
Toda
y
2020
2025
2035
Outages due to investment peak in the Nordic transmission system Swedish nuclear phase-out New interconnectors to Continental Europe
Wind power capacity tripled
Increasing risk
7Page
Nordic Power System

Contents
The Nordic power system 2025 11
1.1 Introduction 11 1.2 Uncertainties will shape the future Nordic power system 11
1.3 Main trends towards 2025 12
1.4 Our scenario for 2025 13
System flexibility 16
2.1 Definition of system flexibility 16 2.2 Existing production flexibility – an increasingly scarce resource 16
2.3 Continental development reduces the available flexibility 17
2.4 Large potential for new flexibility in the Nordic region 18
2.5 Challenges and possible solutions in the next decade 19
Generation adequacy 21
3.1 Introduction 21 3.2 Challenge 1: Securing sufficient, trustworthy capacity through market signals 22
3.3 Challenge 2: Increasing adequacy issues in the Nordic power system 22
3.4 Challenge 3: Need for methodologies 26
3.5 Solutions on generation adequacy 27
Frequenzy quality 28
4.1 Ongoing changes in the power system will challenge frequency quality 28
4.2 An increasingly challenging situation 28
4.3 Challenge 1: Larger structural intra-hour imbalances and more forecast errors 29
4.4 Challenge 2: Increased need for, but reduced access to reserve capacity 30 4.5 Challenge 3: The need to ensure adequate transmission capacity for reserves 31
1
2
3
4
8Page
Nordic Power System

Frequenzy quality
4.6 Solutions for reducing and handling imbalances 31
4.7 Increasing value through cooperation and joint solutions 34
Inertia 35
5.1 Introduction 35
5.2 Methodology 36
5.3 Available and required amount of kinetic energy 37
5.4 Adequacy of inertia 39
5.5 Sensitivity analyses 40
5.6 Possible solutions for low inertia situations 40
Transmission adequacy 42
6.1 Introduction 42 6.2 Challenges in transmission system development 47 6.3 Possible solutions 49
The way forward 50
7 The way forward 50
Appendix 48
Appendix 1 Definitions 53 Appendix 2 Inertia 54 Appendix 3 Status of investment in the Nordic power system 59
4
6
7
5
Contents
9Page
Nordic Power System

ACER Agency for the Cooperation of Energy Regulators
aFFR Automatic Frequency Restoring Reserves
AMS Automatic Metering System
CACM Capacity Allocation and Congestion Management
CBA Cost-Benefit Analysis
CHP Combined Heat and Power
CoBA Coordinated Balancing Areas
EC European Commission
EENS Expected Energy Not Supplied
ENTSO-E European Network of Transmission System Operators for Electricity
EPC Emergency Power Control
FCR Frequency Containment Reserves
HVDC High Voltage Direct Current
ICT Information and Communications Technology
LOLE Loss of Load Expectation
mFRR Manually Frequency Restoring Reserves
MSG Market Steering Group
NOIS Nordic Operator Information System
NSL North Sea Link
NTC Net Transmission Capacity
PMU Phasor Measurement Unit
PV Photovoltaics (Solar Power)
RES Renewable Energy Sources
RoCoF Rate of Change of Frequency
RSC Regional Security Coordination Service Provider
R&D Research and Development
SOA System Operation Agreement
TSO Transmission System Operator
TYNDP Ten-Year Network Development Plan
List of abbrevations
List of abbreviations
10Page
Nordic Power System

1.1 Introduction
The Nordic power system is changing. More Renewable Energy
Sources (RES), more transmission capacity between the Nordic pow-
er system and Continental Europe, and changes in consumption are
resulting in significant challenges with regard to forecasting, operat-
ing and planning the power system. These changes are driven by a
climate change agenda, technical development, including digitalisa-
tion, and a common European framework for markets, operation and
planning. This system transformation has already started, but will be
even more apparent in 2025.
The Nordic power system is a synchronous area1 with a common
frequency. Consequently, imbalances affect the frequency and pow-
er flows in the entire system. With Europe moving towards a more
integrated power system and the Nordic countries becoming more
interlinked, the Nordic countries are even more dependent on each
other. This is necessitating further harmonisation of the existing Nor-
dic market solutions and preparations for efficient integration with the
European markets.
The Nordic Transmission System Operators (TSOs) have a long his-
tory of collaborating on operations, planning and market solutions.
The TSOs now see a need to establish a coherent system-wide collab-
oration in order to cooperate more efficiently. A common understand-
ing of the way the changes will affect the Nordic power system and
how the TSOs should respond is required. The purpose of this report
is to enable the four Nordic TSOs, Svenska kraftnät, Statnett, Fingrid
and Energinet.dk, to jointly agree on priorities for the Nordic power
system and to contribute to a constructive collaboration. We aim to
create a common understanding of the major challenges and opportu-
nities the Nordic power system is facing as we approach 2025. Lands-
net is not included in this strategy.
In this chapter, the ongoing and predicted changes in the Nordic pow-
er system in the period leading up to 2025 are introduced. This chap-
ter also contains a brief discussion of the ensuing challenges, as well
as the Nordic TSOs' "best estimate" scenario for 2025.
1.2 Uncertainties will shape the future Nordic power system
While the Nordic power system undoubtedly faces major changes,
significant uncertainty attaches to the magnitude and pace of these
changes, and how these will affect the power system. The location of
new renewable energy generation will have a significant effect on the
need for new transmission lines. Future regulations, including subsidy
schemes, will thus have a major impact on the design of the Nordic
power system. Technical developments are also uncertain. For exam-
ple, the role of demand response depends on the level of system au-
tomatisation while the suitability of battery storage as a flexibility pro-
vider will be contingent on the cost and capacity of the batteries of the
future. Technical developments are facilitating closer coupling between
different synchronous areas.
Electricity prices are currently very low, both in the Nordic countries
and the rest of Europe. The main reasons for this are low price levels
for coal, gas and CO2, and a rising share of subsidised RES in the ener-
gy mix. In the Nordic area, the growing volume of unregulated gener-
ation, in particular during summer, and in periods of high water inflow
to hydropower plants’ reservoirs, is further depressing prices. The cur-
rent low price level in the market is not incentivising new investments in
any type of power generation. In addition, existing baseload generation
is struggling with unprofitable operations. The early commissioning of
thermal power, especially Swedish nuclear, illustrates this point. It is
uncertain how electricity prices will develop as we approach 2025. We
are likely to see a rebound due to a gradual rebalancing of the glob-
al fuel markets, though continuously low prices all the way to 2025 is
also a possible scenario. The market tools and the market design need
to adapt to this new low-price situation. Lack of incentives for investors
could have adverse long-term effects on the security of supply.
In order to better understand the uncertainties, and to be pre-
pared to deal with these, the Nordic TSOs have a strong focus on
research and development. The TSOs have collaborated within re-
search and development since the early 1990s. Today, the Nordic
R&D group coordinates research and development projects of com-
mon interest, shares information about each TSO’s R&D strategies,
future R&D needs and best practices and, acts as a common Nordic
1
The Nordic power system 2025
1The Nordic synchronous system consists of the electricity systems of Finland, Sweden, Norway and the eastern part of Denmark (Sjaelland) while the western part of Denmark (Jutland) is synchronised with the Continental European system. Unless otherwise specified we will include all of Denmark (i.e. also Jutland) when analyzing and discussing the Nordic power system.
11Page
Nordic Power System

voice with regard to ENTSO-E’s R&D and Innovation Committee. The
Nordic TSOs are currently running eleven common R&D projects
based on common Nordic needs.
1.3 Main trends towards 2025
The structural changes in the power system will challenge the way we
traditionally think about and operate the Nordic power system. The
main changes are:
• The closure of thermal power plants.
• The share of RES in the generation mix is increasing while the
capacity of coal and gas is declining.
• Swedish nuclear power plants will be decommissioned earlier than
initially planned while Finland is constructing new nuclear plants.
• More interconnectors between the Nordic power system, the Con-
tinental European system, and other systems (the UK, Russia, the
Baltic system).
In order to meet the challenges of climate change and energy security,
which are on the European Commission’s agenda (ENTSO-E 2014), a
similar transition in power systems is expected elsewhere in Europe
over the next ten years. Further RES integration and increased elec-
trification of both the transport and household sector are expected.
Regional coordination is, and is becoming even more, critical to the
secure operation of an interconnected European power system. The
functioning of cross-border markets, and regional cooperation is
therefore one of the main vehicles for delivering the Energy Union,
and securing benefits on a European and national level. The network
codes facilitate harmonisation, integration and efficiency of the Euro-
pean electricity market, and are intended to enable efficient coopera-
tion between all stakeholders including the TSOs. However, this will
entail more formalised and standardised regulation that will prolong
the process for modifications.
Historically, the Nordic power system has experienced problems on
cold winter days with high demand and limited generation and trans-
mission capacity. It was relatively easy to predict in which period this
could happen, and plan accordingly. Now, in addition to hours of peak
demand, problematic situations may also include hours with low load
and high wind production. These hours are much more difficult to pre-
dict and prepare for. This results in low inertia, as the thermal power
plants tend to close down in these situations.
The changes in the power system will influence existing, and create
new, market participants. The roles and interaction of the participants
will change. New participants, e.g. prosumers2 and aggregators3, will
challenge current business models, and will require new ICT solutions.
The digital transformation of the power system; smart meters, energy
management systems, automated demand response and microgrids
could be key enablers in the restructuring of the Nordic power system.
The Nordic TSOs are developing these enablers both at a national and
a Nordic level. These ICT (information and communications techno-
logy) and market solutions will play a central role in the transition of
the power system. The system will be more complex, more integrated
and more automated. While this is an important trend, its exact impact
in 2025 is highly uncertain.
All these changes suggest that it will be even more important to look
at the whole picture, and to plan the transmission grid in relation to
the market and the response from both generation and consumption.
The Nordic power system 2025
2A prosumer is an end-user that both produces and consumes power.3An aggregator collects and manages small-scale consumption, and can activate participation in reserve and balancing markets.
1
12Page
Nordic Power System

1.4 Our scenario for 2025
The Nordic Grid Development Plan (Energinet.dk, Fingrid, Statnett
and Svenska kraftnät, Landsnet 2014) and each country’s grid devel-
opment plans are used as a basis for systemising the development of
the grid. Transmission capacity has increased in recent years and will
continue to expand in the future, as illustrated in Figure 4. These vast
investments in the Nordic grid over the next ten years will reduce bot-
tlenecks and improve system flexibility. The total investment portfolio
will peak in 2018.
The Nordic power system 2025
Figure 4 Total investment portfolio for the TSOs 2014–2020.
1
2500
2000
1500
1000
500
0
Total investments by the Nordic TSOs (MEUR/year)
Energinet.dk
Fingrid
Statnett
Svenska kraftnät
MEUR/year
2014
2015
2016
2017
2018
2019
2020
13Page
Nordic Power System

The Nordic power system 2025
Figure 5 shows the Nordic TSOs’ best estimate scenario for 2025. The
scenario is based on an expectedly moderate growth in consumption,
existing climate and energy policies, and known investment and de-
commissioning plans for production capacity.
By 2025, the connection capacity between the Nordic power system
and the power systems of the European Continent, the Baltic system
and the UK will almost have doubled, see Figure 6.
The main challenges we foresee in our scenario for 2025 are:
• An increased demand for flexibility.
• Securing transmission and generation adequacy to guarantee
security of supply.
• Maintaining a good frequency quality.
• Securing sufficient inertia in the system.
These challenges are further analysed and discussed in the following
chapters. We aim to systemise and prioritise the various challenges,
many of which we are already facing today, but which will be more
prevalent as we approach 2025.
1
450
400
350
300
250
200
150
100
50
0
Nordic energy balances 2025
TWh/year
CHP and other thermal
Nuclear power
Wind power
Hydro Power
Industrial consumption
Other consumption
Tota
l
Swed
en
Den
mar
k
Nor
way
Finl
and
Figure 5: An estimate of electricity production and consumption in the Nordic power system in 2025 as a result of market simulation per-formed in 2015.
14Page
Nordic Power System

The Nordic power system 2025
1
Overview of existing HVDC interconnectors and HVDC interconnectors under construction
Figure 6 Overview of existing and planned HVDC inter-connectors in the Nordic power system. Only those planned HVDC interconnectors with a final investment decision are included.
6Existing
Skagerrak 1 – 4 1600 MW
NorNed 700 MW
Konti-Skan 1 – 2 680/740 MW
Kontek 600 MW
Baltic Cable 600 MW
SwePol Link 600 MW
Fenno-Skan 1 – 2 1200 MW
NordBalt 700 MW
Estlink 1 – 2 1000 MW
Vyborg Link 1400 MW
Storebaelt 600 MW
Under Construction
Cobra 700 MW (2019)
Kriegers Flak 400 MW (2019)
Nord Link 1400 MW (2020)
North Sea Link 1400 MW (2021)
Under development (not in map, comprehensive list in Appendix 3)
Viking Link
DK West – Germany
North Connect
Hansa PowerBridge
Existing
Skagerrak 1-4 1600 MW
NorNed 700 MW
Konti-Skan 1-2 680/740 MW
Kontek 600 MW
Baltic Cable 600 MW
SwePol Link 600 MW
Fenno-Skan 1-2 1200 MW
NordBalt 700 MW
Estlink 1-2 1000 MW
Vyborg Link 1400 MW
Storebaelt 600 MW
Under Construction
Cobra 700 MW (2019)
Kriegers Flak 400 MW (2019)
Nord Link 1400 MW (2020)
North Sea Link 1400 MW (2021)
Under development (not in map, comprehensive list in Appendix 3)
Viking Link
DK West – Germany
North Connect
Hansa PowerBridge
15Page
Nordic Power System

2.1 Definition of system flexibility
One of the specific characteristics of the power system is the need to
maintain the total amount of production and consumption at the same
level at all times. This requires flexibility, which can be defined as the
controllable part of production and consumption that can be used to
change input or output for balancing purposes. Another category is
energy storage that can act as both consumption and production, de-
pendent on the situation. Examples of time horizons and correspond-
ing needs for flexibility include:
• Long-term – in order to balance the variations in generation and
consumption between seasons and years
• Medium-term – balancing between months, weeks and days
• Day-ahead – establishing a balance hour by hour for the next day
• Intraday – adjusting the balance hour by hour for the same day
• Operation – fine-tuning the already balanced system minute by
minute, second by second
Examples of flexibility sources include hydropower plants with reser-
voirs, coal and gas power plants, price-dependent consumption, bat-
teries and hydro plants with the capacity to pump up water for later
use. Intermittent wind, run-of-river hydro and PV plants can also pro-
vide short-term down-regulation when they are producing. They also
have a potential for short-term up-regulation if production is reduced
in advance.
2.2 Existing production flexibility – an increasingly scarce
resource
The high percentage of hydro production with reservoirs in the Nordic
region provides large volumes of relatively cheap flexibility, both in the
day-ahead market and in the operational hour. The reservoirs provide
excellent opportunities to accumulate water for a long time, and the
cost of ramping up and down these plants is close to zero. In addition
to the hydropower, the Nordic countries have a significant volume of
flexible thermal coal and gas power plants that can also provide both
long- and short-term flexibility, though at a higher cost than hydropower.
Until now, the flexibility provided by the hydro plants with reservoirs
has been large enough to cover most of the flexibility needed in Nor-
way and Sweden, and a significant proportion of the flexibility demand
in Denmark and Finland. Flexible thermal power plants and connec-
tions abroad mainly cover the residual demand. This has resulted in a
relatively low price volatility in the day-ahead market and relatively low
operational balancing costs. This will probably change in the period
leading up to 2025.
• Demand for flexibility is increasing, both in the day-ahead market
and in the operational hour.
• At the same time, the flexibility provided by existing hydro plants
is limited and thermal production capacity is declining.
A higher market share of intermittent renewables will be the main
driver of increased demand for flexibility in the period leading up to
2025. In periods of low consumption and high production from wind,
solar and run-of-river hydro, other production units need to provide
more flexibility in the day-ahead market by ramping down their pro-
duction. Meanwhile, forecasting errors affecting a larger proportion
of total production will increase the need for balancing closer to, and
within, the operational hour.
With increasing transmission capacity towards the Continental Euro-
pean, the UK and the Baltic systems, the Nordic region both provides
and receives flexibility. However, the new capacity will contribute to
increased competition for the low cost flexibility provided by hydro-
power. This will increase the value of hydro production, and lead to
higher short-term price volatility in the day-ahead market and higher
balancing costs in the operational hour. In addition, the reserve re-
quirements of system operation may increase due to greater changes
in the power flow and larger imbalances.
The options for further redispatching of flexible production are limit-
ed by numerous factors. We are already experiencing periods where
hydro plants are reaching limits and thus cannot provide any addition-
al flexibility. The same is the case for the thermal units. In Statnett’s
market simulations for 2025, the following occurs more frequently:
• Hydro plants with reservoirs and thermal plants are producing at
full capacity, typically during high consumption periods in the win-
ter, and low production from wind and run-of-river hydro.
System flexibility
2
16Page
Nordic Power System

• In the summer, production from hydro plants with reservoirs and
thermal plants is close to zero. This occurs in periods of low con-
sumption and high output from wind and run-of-river hydro, forc-
ing hydro plants with reservoirs and thermal power plants to hold
back production. Figure 7 illustrates the low levels of regulated
hydro production during summer nights in dry years.
The first situation leads to more price peaks in the day-ahead market,
typically at the same level as continental peak prices. In the operating
hour, the resources for up-regulation become scarcer. This increases
prices in the balancing market.
In the second situation, characterised by low consumption and high
wind and run-of-river production, the result is very low prices in the
day-ahead market. In the operating hour, the options for short-term
down-regulation are more limited. This can result in higher prices in
the balancing market. An additional challenge in this kind of situation
is that the flexible hydro and thermal plants will not deliver any inertia
to the system since they are disconnected (see chapter 5).
All other factors remaining equal, an increased scarcity of flexible pro-
duction in the Nordic region will have several consequences for the
power system:
• Increased short-term price volatility in the day-ahead market,
more in line with European Continental prices. This will occur more in
the southern and eastern parts of the Nordic region than in the
northern part of the region.
• Reduced hourly price differences between the southern parts of
the Nordic region and the European Continent.
• Higher balancing costs.
• Less inertia during periods of very low production from nuclear,
other thermal and large hydro plants.
• More power transmission between the hydro stations with
reservoirs and the consumption centres and the interconnectors
in the south.
2.3 Continental development reduces the available flexibility
The continental market has currently sufficient thermal production
capacity to cover the demand during the periods of low production
System flexibility
2
30000
20000
10000
0
Simulated production from regulated hydropower in Norway and Sweden combined For different time slots in the day
DK
1 Weeks 52
03-06
12-15
18-21
21-24
MW
Figure 7 Simulated production from regulated hydropower in Norway and Sweden combined. Average of five dry years in 2025.
17Page
Nordic Power System

from intermittent renewable sources. However, the increasing share
of intermittent renewables reduces both the usage and profitability of
the thermal plants, and without sufficient remuneration, a significant
share of the thermal capacity will shut down. If this happens, the ca-
pacity margin5 in the day-ahead market will be gradually tighter over
the next decade. This will affect the Nordic countries since there is a
probability of having a tight margin on the Continent and in the Nordic
area at the same time.
The UK and France are establishing capacity markets and several
other countries are considering the same, however not the Nordic
countries. It is uncertain, how these markets will be operated towards
2025, and to which extent the consumption will participate. In addi-
tion, Germany has chosen to establish a strategic reserve instead of
a capacity market. This makes it more likely that the capacity margin
in the European continental day-ahead market will be tighter. Statnett
made an analysis that investigates the consequences of not having
capacity markets in Europe (Statnett 2015a). The main conclusion is
that this will lead to less thermal capacity in the day-ahead and balanc-
ing markets, and therefore more numerous and higher price spikes.
The study also indicates higher price peaks in the hours with a tight
margin in the Nordic countries.
2.4 Large potential for new flexibility in the Nordic region
There is large technical potential for expanding available flexibility
within the Nordic area, although they offer different potential for flexi-
bility. Some new possibilities are for example:
• Consumer flexibility – households, energy-intensive industry, heat
and transport sector
• Expanding the flexibility of hydro plants by installing additional
turbines and pumps
• Utilising intermittent renewable wind, solar and hydro production
for balancing purposes
• Installing batteries combined with solar energy
• Constructing peak load gas turbines
• Rebuilding existing CHP plants to make them more flexible
• Utilising nuclear plants in balancing markets
System flexibility
5The difference between the available generation capacity and consumption.6 For the bidding zones in the Nordic countries please refer to Nord Pool: http://nordpoolspot.com/maps/#/nordic
2
Figure 8 Hourly observed day-ahead prices in southern Norway and Germany – Week 2, 2016. Because of capacity constraints within the hydro system, southern Norway is subject to the exact same price vol-atility as in Germany. In this case, the socio-economic benefit of adding more transmission capacity is low. This illustrates the link between day-ahead prices and capacity constraints.
60
50
40
30
20
10
0
Hourly observed day-ahead prices in Germany and southern Norway
Germany
Southern Norway (NO2)6
1 7 13 19 25 31 37 43 49 55 61 67 73 79 85 91 97 103
109
115
121
127
133
139
145
151
157
163
169
175
181
187
NOK
Hours
18Page
Nordic Power System

Energy-intensive industry in Finland, Sweden and Norway can provide
more flexibility both in the day-ahead and the balancing market. The
consumption of households has been highly inflexible so far, but with the
introduction of smart metering and the resulting opportunities to manage
household equipment more astutely, this may change. This will enable
households to shift some of their consumption from peak hours to off-
peak hours. How significant the overall contribution from the demand
side will be in the period leading up to 2025 is however uncertain, and will
depend on both technological developments and economic incentives.
There is major technical potential to increase hydro generation capac-
ity, in particular in the southern part of Norway. The water Framework
Directive might constrain this possibility and it is hence important that
the implementation of the directive is done with as little impact on the
hydro regulation potential as possible. In addition, several studies
have demonstrated a technical potential for pumping plants running
into thousands of megawatts. This would require huge investments7
and would not be profitable under current market conditions.
Wind, solar and run-of-river hydro plants always have the possibility of
down-regulating their production. They can also deliver up-regulation if
production has been reduced in advance. Combined heat and power pro-
duction with a closer interaction with the heat market can also make an
increasingly important contribution, especially during periods of low elec-
tricity consumption and high production from wind and run-of-river hydro.
2.5 Challenges and possible solutions in the next decade
The power system is increasingly experiencing higher scarcity of ex-
isting production flexibility. However, there is significant potential for
adding new flexibility. In a well-functioning market, a severe shortage
of flexibility should therefore be avoidable. It is uncertain whether the
markets of today can solve this challenge. Will the economic incen-
tives be strong enough? Are regulatory or technological obstacles or
delays in developing new market designs hindering the transition to-
wards a system with a more diversified supply of flexibility?
More short-term price volatility in the day-ahead market and periods
of higher prices in the balancing markets should provide incentives
for expanding flexibility, which suggests that the market should be
System flexibility
7New tunnels represent the main cost
2
4000 000
3000 000
2000 000
1000 000
0
Regulating power in the Nordic countries
Down-regulation
Regulatory volume as part of total energy trading
Up-regulation
2010 2011 2012 2013 2014
1,0 %
0,8 %
0,6 %
0,4 %
0,2 %
0 %
Regulating volumes (MWh)
Figure 9 Observed volumes for up and down-regulation 2010–14. The curves show a stable need for up-regulation and down-regulation dur-ing this period. However, we expect a need to increase – with more RES and interconnectors in the years leading up to 2025.
19Page
Nordic Power System

able to solve the problem. However, challenges could arise if either the
change is too rapid for new flexibility to be found or if the price signals
are distorted, for instance, by unsuitable RES subsidy schemes or fixed
prices for end-users. Such market imperfections can make the transi-
tion less smooth and pose challenges for the operation of the power
system in coming years. In severe cases, it could lead to hours without
price formation in the day-ahead market, and periods of insufficient
available balancing resources in the operational hour. It is also possible
that these challenges will manifest themselves in geographical sub-
areas even though there is sufficient flexibility on a system level.
One prioritised area for TSO cooperation is to develop more know-
ledge about the technological and economical potential for new flexi-
bility in order to gain a more precise picture of the possible challenges
of balancing the system in the coming years. Other possible solutions
that could be implemented by the TSOs are:
• Developing the power and reserve markets to more accurately
reflect the changing fundamentals of the power system. More fine-
ly tuned time resolution in the day-ahead and intraday markets as
well as the balance market, and more emphasis on the intraday
markets would, for instance, reduce the imbalances and hence the
need to balance resources within the operational hour.
• Utilising the transmission capacity more efficiently – continuing to
evaluate different capacity allocation options.
• Restrict ramping on each HVDC interconnector even further.
Possible solutions requiring broader collaboration:
• Ensuring that the rules and regulations of the market facilitate the
most cost-effective development and utilisation of available flexi-
bility.
• Utilising the information provided by the automatic metering
system (AMS) to introduce demand response.
The challenges presented by a shortage of available flexibility, and
the possible solutions, are further discussed in Chapter 3 (Generation
adequacy) and Chapter 4 (Frequency quality). The flexibility issue also
impacts the benefits of building new transmission capacity and the
availability of inertia.
System flexibility
2
20Page
Nordic Power System

3.1 Introduction
Generation adequacy expresses the ability of generation capacity to
match the load in the power system.
As larger amounts of renewable energy are integrated into the power
system there is a move from regional to European markets and there is
hence an increasing need to have a Pan-European overview of genera-
tion adequacy. At the same time, reduced profitability of conventional
power generation represent a growing potential challenge to future
capacity generation adequacy. Generation adequacy relates to the
part of security of supply concerning the ability of the power system to
supply customers’ aggregate power requirements. The ongoing and
foreseen changes of the power system will make it more difficult and
expensive to fully eliminate the risk of capacity shortages. This implies
a need for a clear definition of generation adequacy, and discussions
of the socio-economic best instruments to use in order to maintain
generation adequacy.
In January 2016, the Nordic power system experienced a market situ-
ation with a very tight demand-supply balance in the day-ahead market
(Figure 10), and following high prices in most of the Nordic bidding zones.
Along with the first market signals of a tighter demand-supply bal-
ance, generation adequacy studies are highlighting an increasing risk
of energy not supplied to the consumers. Additionally, the recent as-
sessment from ENTSO-E shows that an increasing number of coun-
tries plan to rely on imports to maintain adequacy in the period leading
up to 2025, and a growing importance of cross-border exchanges in
the pan-European system.
In order to assess whether or not increasing dependency on neigh-
bouring countries and increasing shares of renewable energy pose a
challenge for the Nordic power system, it is important to make a com-
mon assessment of capacity adequacy. Therefore, future analyses of
adequacy should be based on a jointly developed methodology that
adopts a probabilistic modelling perspective for all hours of the year.
This would facilitate a more consistent assessment of variable renew-
able energy generation, projected interconnector flows, demand-side
management and flexibility in the market.
Generation adequacy
3
Figure 10 Demand-supply balance in the Nordic power system on 21 January 2016, showing a very tight demand-supply balance. Market Data from Nord Pool Spot.
400
350
300
250
200
150
100
50
0
Demand-supply balance in the Nordic Power system on 21 January 2016
30 000 40 000 50 000 60 000 70 000
€/MWh
MWDemand
Supply
21Page
Nordic Power System

The main challenges for the Nordic power system with respect to gen-
eration adequacy are:
• Market influence: Increasing shares of renewable generation
and reduced profitability of conventional power generation result
in reduced capacity from nuclear and other thermal power plants.
Inadequate generation should also be viewed in the context of
market developments. If price signals are too low for market part-
icipants, the latter cannot react adequately, either in terms of short-
term responses to shortage situations, or in terms of long-term
investment decisions. Thus, generation adequacy is a question of
getting prices right.
• Lack of cross-border adequacy assessment: Expanding
market integration and increasing cross-border capacity means
that, as a minimum, regional adequacy assessments will be re-
quired to properly evaluate shortages and thus identify the right
basis for appropriate mitigation measures. However, it is also nec-
essary to acknowledge that some adequacy challenges occur in
local situations, e.g., where demand can be “locked-in” due to
faults on transmission lines.
• Need for methodologies: Traditional adequacy methodologies
are national and deterministic. These include parameters like
available thermal capacity and seasonal peak load demand. Conse-
quently, adequacy assessments disregard capacity based on
variable power sources, underestimate the value of transmission
capacity, and do not cover the uncertain nature of faults in compo-
nents in the power system.
3.2 Challenge 1: Securing sufficient, trustworthy capacity
through market signals
The Nordic region as a whole is receiving an increasing share of RES.
At the same time, low wholesale electricity prices are reducing reve-
nues from traditional power plants, which in turn lead to a decreasing
capacity for thermal power plants such as coal and nuclear. Demand
is not expected to change significantly since economic activities are
only expected to pick up slowly and use of power in other sectors (e.g.
heating and transport) is not forecast to increase dramatically.
In overall terms, an evolving common European market is providing
the basis for determining production capacity in the power system.
Adequacy refers to the ability of the power system to supply custom-
ers’ aggregate power loads at all times, taking into account the sched-
uled and unscheduled outages of system components. For the market
to serve that purpose, the regulatory framework and the market de-
sign have to facilitate proper market dynamics.
There must be room for higher price max and that price signals reach
market participants. If proper price signals do not reach market partic-
ipants, the latter cannot react adequately, be it short-term responses
to shortage situations or long-term investment decisions.
3.3 Challenge 2: Increasing adequacy issues in the Nordic
power system
3.3.1 ENTSO-E and Nordic approaches
ENTSO-E’s generation adequacy assessment is based on a nation-
al power balance-based approach, which includes parameters such
as “available thermal capacity” and “seasonal peak load demand”,
but often disregards capacity based on intermittent energy sources.
(ENTSO-E 2015d)
The Nordic countries (mainly TSOs) have carried out a number of
studies that take account of national adequacy issues, including as-
sumptions on interlinked neighbouring countries. Some of the studies
are deterministic while others are probabilistic.
Please note that the output figures are not direct assumptions of black-
outs since additional measures can be used in operations. However, it
is important to highlight that these kind of models often overestimate
actual flexibility. They give an indication of the risk of adequacy prob-
lems, but have a tendency to underestimate actual risk.
3.3.2 Danish studies
In 2015, both Energinet.dk and the Danish Energy Agency conducted
adequacy assessments based on probabilistic approaches. The mod-
els were spreadsheet-based, and built on consumption, wind and so-
lar power profiles. (Energistyrelsen 2015) Overall, the analyses do not
reveal major adequacy issues in the Nordic countries. The sensitivity
analyses in one of the studies conclude:
• Any rise in the risk of failure on interconnectors would have a rela-
Generation adequacy
3
22Page
Nordic Power System

tively large impact on risks for Danish generation adequacy.
• A faster shut down of some of the Danish decentralised and cen-
tralised power plants (compared to the 2025 scenario presented
in chapter 1.4) increases the risk of Danish generation adequacy
problems. This effect is stronger in eastern than in western Denmark.
According to Energinet.dk’s generation adequacy assessment for
Denmark, generation adequacy in eastern Denmark will come under
pressure in 2018, as the strategic reserve of 200 MW has not been
approved. By 2020, the level of security of supply will no longer be
critical, given expected developments in neighbouring countries and
the estimated domestic capacity. If more power stations than expect-
ed are closed down in eastern part of Denmark or the Kriegers Flak
interconnector is delayed, new initiatives may be required to maintain
security of supply levels in eastern part of Denmark.
3.3.3 Finnish studies
In 2015, a deterministic study of the adequacy of power capacity was
conducted in Finland for the period leading up to 2030 (Pöyry 2015).
The study concluded that the capacity deficit in Finland in relation to
peak demand will be at its highest around 2018. It also concludes that
Finland will be dependent on imports until 2030.
Fingrid has developed a method of assessing the power adequacy of a
power system with stochastic characteristics and conducted a probabil-
istic study of adequacy in Finland (Tulensalo 2016). The study focused
on the day-ahead market and system service reserve capacity was cat-
egorised as unavailable. The occurrence of faults affecting both gener-
ation units and cross-border interconnectors was taken into account.
Exchanges with Russia were not taken into consideration in the study.
Loss of load expectation (LOLE) shows how many hours’ loss-of
load can be expected during a year. These figures are not the same
as blackout or brownout, but only provide an indication of potential
stressed capacity balances that will need to be managed. Finally, the
capacity margin shows any missing generation capacity or demand
flexibility.
Generation adequacy
3
Main conclusions:Even though some of the Nordic countries are dependent on im-ports, the overall picture is that interconnections are sufficient to address the import needs, and seen as a whole the total remaining capacity is also sufficient to cover peak demand.
• Some countries, e.g. Belgium, Denmark, Finland and Sweden are structurally dependent on imports through the period analysed 2016–2020–2025.
• The need for imports appearing at the beginning and at the end of the year indicates the effect of low temperatures and a corre-sponding increase in demand.Source: (ENTSO-E 2015d)
15
10
5
0
– 5
– 10
– 15
Scenario outlook & adequacy forecast from ENTSO-E
DK
DK FI NO SE
Simultaneous Export Capacity for Adequacy
Simultaneous Import Capacity for Adequacy
Remaining Capacity
GW
2016
2020
2025
2016
2020
2025
2016
2020
2025
2016
2020
2025
The recent assessment from ENTSO-E shows an increasing number of countries relying on imports to maintain adequacy between 2016 and 2025. At the same time it shows an increasing role og crossborder exchanges in maintaining adequacy in the Pan-European system.
23Page
Nordic Power System

In overall terms, the Finnish studies show that the EENS will increase
over the next ten years in Finland, and that the dependency on neigh-
bouring countries will also rise.
3.3.4 Norwegian study
In 2015, Statnett conducted a deterministic study (Statnett 2015a).
The study concluded that in 2030 Europe will have a negative capacity
margin at an average of 0.3 per cent of the time, but that this will vary
significantly between climate years. During the worst years, the capac-
ity margin will be negative roughly 2 per cent of the time, and some
countries will be close to rationing.8 These results assume a long-term
market balance and do not take into account the probability of availa-
ble grid and generation.
The study shows that although sharing back-up capacity helps in
many hours, the potential is limited during periods of high residual de-
mand (demand after deducting solar and wind power production). The
study analyses correlations in European weather patterns based on
weather series. During winter, residual demand in one country is more
than 60 per cent dependent on the residual demand in neighbouring
countries. This poses no problem in normal conditions; sharing of
back-up capacity and flexibility generally functions well. The problems
will arise on days when residual demand is very high in several coun-
tries at the same time.
Generation adequacy
8 It should be noted that this conclusion is based on the assumption of an energy-only market, and hence does not take account of any capacity mechanisms.
3
Finland Capacity margin (MW)
Simulation year LOLE (h)
EENS (MWh)
In a medi-an year
In a cold year once in 10 years
2012 0.01 ± 0.14 1.4 ± 29 1400 890
2014 0.07 ± 0.09 15 ± 24 990 490
2017 1.8 ± 0.54 490 ± 220 360 −290
2023 5.3 ± 1.1 1800 ± 550 90 −680
Table 1 The simulation results of the case studies for 2012–2023. Loss of load expectation (LOLE) and expected energy not supplied (EENS) are pre-sented with a 95 per cent confidence interval for all simulated cases (Tulen-salo, 2016). The simulation results show that there is an increasing risk of energy not served over the next ten years.
Figure 11 Duration curves for Finland of the minimum remaining capacity index during the simulated years 2012, 2014, 2017 and 2023. (Tulensalo 2016)
3000
2000
1000
0
– 1000
– 2000
– 3000
Duration curve of the minimum remaining capacity index
DK
2012
2014
2017
2023
Remaining capacity MW
0,2 0,4 0,6 0,8
Probability (%)
24Page
Nordic Power System

3.3.5 Swedish study for 2030
During 2015 Svenska kraftnät developed a new method for assessing
the Swedish adequacy situation based on probabilistic modelling. The
spot market for 2030 was modelled without any strategic reserves.
Consequently, the loss-of-load in the simulations should be interpret-
ed as a situation when the spot market does not clear. In addition, the
market is modelled without demand price elasticity and demand flexi-
bility, which would improve the situation.
If we are looking only at the expected capacity margin, Sweden should
not experience any shortage. If, instead, the individual simulations are
analysed, the picture is somewhat different. Figure 12 shows the sim-
ulated capacity margin for 2030 and in 70 out of 500 simulated years
the spot market will not clear, i.e. the margin is negative. If a strategic
reserve of 750 MW is assumed, 17 out of 500 simulated years will
still show lack of capacity. This result can also be expressed as a 3.4
% probability of having at least one hour with the loss of load in 2030,
even with the capacity reserve activated.
Generation adequacy
3
2030 LOLE (h)EENS (MWh)
Capacity margin (MW)
SE1 0.04 0.3 145
SE2 0.04 0.6 243
SE3 1.1 453 830
SE4 1.1 122 223
Table 2 Results from adequacy analyses of the spot market in the Swedish bidding zones. Please note that these figures are not the same as blackout or brownout figures, but only provide an indication of potential stressed capaci-ty balances that will need to be managed. Finally, the capacity margin shows any missing generation capacity or demand flexibility. The results show that in 2030 SE3 will have the highest risk of energy not supplied followed by SE4. Both SE1 and SE2 have a very low risk.
Figure 12 Illustration of the minimum regional margin in each of the 500 simulations for bidding zones SE3 and SE4 in 2030. Here, 70 of 500 years have a negative value, which means that the spot market will not clear without additional measures.
2500
2000
1500
1000
500
0
– 500
– 1000
– 1500
– 2000
– 2500
Regional margin minimum
SE3
SE4
MW
7 23 45 67
89
11
1 13
315
5
177
199
22
1
243
265
28
7
309
331
35
3
375
397
41
9 44
146
3
485
25Page
Nordic Power System

3.4 Challenge 3: Need for methodologies
3.4.1 Probabilistic methodologies
A shared feature of all the studies is the complex nature of the various is-
sues that can cause adequacy shortfalls. Shortfalls arise when a series of
events occur such as cold winter spells combined with increasing num-
bers of faults with infrastructure or generation facilities. Consequently,
it has to be acknowledged that no simple fixes exist, and that isolated
mitigation measures are not capable of addressing all the shortfalls.
The methodology of the Danish, Swedish and one Finnish study is
based on a probabilistic modelling approach (Monte Carlo), which
models every hour of the year using historical weather and demand
profiles. These are combined randomly with the stochastically simu-
lated availability for interconnectors and power plants.
In 2014, ENTSO-E highlighted a need to improve the modelling of
transmission management in times of scarcity. It decided to switch to
a probabilistic analysis, which is more suited to an interconnected sys-
tem characterised by variations in load and high penetration of variable
generation. In 2015, ENTSO-E conducted a pilot phase study in order
to define a framework for probabilistic market modelling adequacy as-
sessments for the forthcoming Mid-Term Adequacy Forecast Report
and subsequent developments in further reports. The overall principle
adopted in the probabilistic studies was to simulate several years’ op-
eration of the power system on an hourly basis, with hourly profiles
for wind and solar power and demand. It also includes the availability
of thermal power plants and interconnectors (including both planned
and forced outages). In the ENTSO-E pilot phase, outages for intercon-
nectors were not included in the model; however, the forthcoming Mid-
Term Adequacy Forecast Report will include some interconnectors.
Flexible production is simulated using a methodology in which each
power station is assigned a risk of being unavailable (for example, due
to a breakdown) in a given hour while international connections can
drop out individually, or all connections to a neighbouring region can
drop out at the same time due to inadequate power in the region.
Future analyses of adequacy should apply a new common metho-
dology, including a probabilistic modelling perspective for all hours
of the year, which enables a more consistent assessment of varia-
Generation adequacy
3
26Page
Nordic Power System

ble renewable energy generation, projected interconnector flows,
demand-side management and flexibility in the market.
3.5 Solutions on generation adequacy
National analyses show an increased interdependency within the Nor-
dic countries, between the Nordic countries and to the European Con-
tinent. This is due to the increasing number of interconnectors and a
cross-border market. Cross-border dependency is most prevalent in
Denmark and Finland.
Furthermore, the studies reveal an increasing level of expected energy
not supplied due to decreasing capacity in the Nordic region. In the
studies, Finland, southern Sweden and eastern Denmark face short-
term adequacy challenges. Some of these can be solved through fu-
ture planned transmission or production capacity. The overall trend is
however towards a tighter capacity margin, which could influence the
level of expected energy not supplied. Further studies in the form of a
common Nordic project will be required to clarify future consequences.
The findings from various national studies and ENTSO-E’s most re-
cent adequacy assessment have given rise to a list of action points.
Cross-border collaboration on adequacy is important. Transmission
capacity is increasing, both within the Nordic system and between the
Nordic and other systems. Furthermore, the Nordic countries reap cer-
tain benefits from sharing back-up capacity. The Nordic countries have
a history of sharing capacity in the wholesale market, now it is time
to harvest the benefits of sharing back-up capacity between countries.
Solutions through collaboration between the Nordic TSOs:
• Continuing development of a common market – enabling
consumers: In the long-term, consumers are expected to play a
more prominent role by expressing a willingness to pay for security
of supply. A shared solution that fosters consumer flexibility and
participation in the common market will improve the situation and
force new and effective solutions. Consumer flexibility is however
expected to make only a small contribution to adequacy over the
shorter term due to the limited potential flexibility in some
Nordic countries.
• Common methodologies – probabilistic: A probabilistic
cross-border approach should be adopted for adequacy assess
ments, as this provides a more holistic assessment of potential
capacity scarcities in the assessed region. More importantly, such
an approach illustrates the potential support each country can re-
ceive or give through possible economic exchanges arising from
the variety of generation mixes in the region.
• Common study – from national adequacy to Nordic system
adequacy: Capacity issues have been predicted in Finland, east-
ern Denmark and southern Sweden. At the same time, Finland and
Denmark are increasingly relying on imports. In order to
analyse this issue more thoroughly, a common analysis is requi-
red from a Nordic perspective, and later also from a larger pers-
pective. The study needs to include evaluations on situations that
could lead to adequacy problems, and subsequently highlight
opportunities for regional collaboration.
• Collaboration on mitigation measures – common princi-
ples: Some adequacy problems can be the result of common
Nordic situations (e.g. cold winter spells combined with a dry year).
However, this also means that mitigation measures can be devel-
oped through Nordic collaboration. Other adequacy problems
can be local in nature. In such situations the affected countries
have to identify national solutions. Here, the first step is to find
common principles for mitigation measures that take account of
the specific characteristics of the adequacy shortfall.
Overall, solutions to solve potential adequacy shortfalls cannot be
solved by the TSOs alone. Some of the challenges will have to be
addressed at a Nordic or European level. These issues include:
• Aligned RES subsidies: RES subsidies to be coordinated on the
regional level.
• Common definition: Adequacy is a common Nordic challenge
which will necessitate ongoing common market development
and implementation of common adequacy assessments. In order
to do this, the regulatory framework will have to adopt common
definitions of generation adequacy.
• Collaboration on the regulatory framework for both metho-
dologies and mitigation measures: Use of methodologies and
mitigation measures are closely linked to the regulatory frame-
work in both national member states and Europe. To fulfill the am-
bition of conducting common regional and European studies that
can be used nationally, will require a common framework.
Generation adequacy
3
27Page
Nordic Power System

4.1 Ongoing changes in the power system will challenge fre-
quency quality
The common frequency in the Nordic synchronous system means that
imbalances affect the entire synchronous area. It is therefore impor-
tant that the TSOs who are operating the same system adopt a shared
view on target levels for frequency quality. Frequency is a crucial pa-
rameter when dimensioning reserves, and adequate frequency quality
therefore indicates a sufficient level of security of supply. A common
Nordic target for the frequency quality is currently being assessed as
part of the new Nordic System Operation Agreement (SOA). This will
be important for system operation in the period leading up to 2025,
during which imbalances are expected to grow.
The main challenges with regard to maintaining an adequate
frequency quality are:
• Larger structural intra-hour imbalances and more forecast errors.
• An increased need for, but reduced access to, reserve capacity.
• A growing need for transmission capacity for reserves.
• Changes around hour shift.
Over the next ten years, the Nordic power system will experience
challenging situations with larger, faster and more frequent fluctua-
tions. Major and rapid changes in the power flows via HVDC links and
changes in wind generation will cause significant balancing difficulties.
This will also affect bottleneck handling. Figure 13 shows simulated
exchange via HVDC links during an average winter week in 2025,
without and with the new planned interconnectors Nordlink, NSL and
Hansa PowerBridge. The market simulations show large changes in
power flow via HVDC links during mornings and evenings. The Nordic
TSOs need to continue building a common toolbox to manage these
imbalance challenges.
4.2 An increasingly challenging situation
System frequency is an indicator of the instantaneous power balance
between production and consumption, including power exchange in
the power system. Major frequency deviations indicate reduced sys-
tem security. This implies an increased risk of disturbances that will
lead to a frequency low enough to trigger automatic load-shedding, i.e.
the last resort of system stability measures.
Frequency quality
4
Figure 13 Simulated exports and imports via HVDC connections from the Nordic synchronous system in 2025, without and with the new planned HVDC interconnectors Nordlink, NSL and Hansa Power-Bridge. Simulated week in winter, per hour during week, average of51 historic years. Ramping restrictions on the cables are not taken into account.
8000
6000
4000
2000
0
– 2000
– 4000
– 6000
– 8000
Nordic exports and imports 2025, average winter week
With Nordlink, NSL and Hansa PowerBridge
Without Nordlink, NSL and Hansa PowerBridge
MW
Mon
day
Tues
day
Wed
nesd
ay
Thur
sday
Frid
ay
Satu
rday
Sund
ay
28Page
Nordic Power System

In the planning phase, well-functioning markets are important for a
planend balancing between demand and supply contractually; however,
imbalances will still occur in real-time system operation. System opera-
tors have various tools to manage imbalances, both administrative- and
market-based. Adequate frequency and balancing reserves are critical for
maintaining the real-time balance. Maintaining the frequency level at 50
± 0.1 Hz at all times has proved increasingly difficult for system opera-
tors, see Figure 14.
Changes in the power system in the years leading up to 2025 will
result in an additional deterioration of frequency quality if new and
appropriate measures are not introduced. The trend towards more
imbalances caused by power exchanges and shifts in generation will
continue. The following challenges will amplify this trend:
• Faster, larger and more frequent changes in generation and power
flow will further exacerbate real-time imbalances.
• A significantly higher proportion of the generation portfolio will be
directly weather-dependent, as well as less predictable, less flexi-
ble and less controllable.
• New components with higher rated power, such as new power
plants and interconnectors, could challenge system stability in the
event of disconnection.
• Periods with few hydro power plants with reservoirs in operation,
which makes it difficult to source a sufficient volume of frequency
containment reserves and down-regulating resources.
4.3 Challenge 1: Larger structural intra-hour imbalances and
more forecast errors
Major frequency deviations are likely to occur around hour shifts
in the morning and in the evening, when there are large shifts in
consumption, production and exchange on the HVDC links. Large
intra-hour imbalances arise due to the differences between the ramps
by which consumption, production and exchange achieve their hourly
energy plans. The current marked design does not ensure momentary
balance at intra-hour timeframes, even if all the balancing responsible
parties are in balance per hour - so called structural imbalances.
The trend towards increasing intra-hour imbalances is expected to
continue due to faster, larger and more frequent changes in gener-
ation and ramping on HVDC links. Efficient use of the HVDC links in
the day-ahead and intra-day market requires faster changes in flow
Frequency quality
4
500
450
400
350
300
250
200
150
100
50
0
Development in Frequency Quality from 2001 to the first quarter of 2016
Minutes per week
Floating average of 52 weeks
Minutes per week outside the normal frequency band (49.9–50.1 Hz)
2001
2002
2003
2004
2005
2006
2007
2008
2009
2010
2011
2012
2013
2014
2015
2016
Figure 14 Nordic frequency: The number of minutes per week with frequency outside 49.9–50.1 Hz, between 2001 and March 2016.
29Page
Nordic Power System

9 Must-run hydro: Production from power plants without reservoirs and power plants with reservoirs that are required to produce power at a specific time for various reasons, including full reservoirs, flow restrictions, reservoir targets etc. Includes all hydropower production with zero marginal costs.
60 000
50 000
40 000
30 000
20 000
10 000
0
Nordic production and demand in 2025For a typical single year (weather as 1982) and night hours
1 4 7 10 13 16 2219 31 34 37 40 43 45 49 52
Nordic production and demand 2025Average of 50 years and night hours
MW
Demand
Nuclear
Other thermal
Wind and solar
Must-run hydro
Hydro › 10MW
Hydro ‹ 10MW
Week
2825
direction than are currently accepted. This will further increase the
intra-hour imbalances if mitigation measures are not introduced.
More unpredictable power generation in the Nordic system will
increase of forecast errors. In addition, significant amounts of unpre-
dictable power generation in the Continental European power system
will cause large imbalances more often. With a tighter coupling of the
two systems both physically and market-wise, the central European
imbalances will permeate into the Nordic system through intra-day
trade and balancing markets.
4.4 Challenge 2: Increased need for, but reduced access to
reserve capacity
In future, the Nordic system will feature new components with high-
er rated power, such as new larger nuclear plants in Finland and
larger HVDC interconnetors to neighbouring power systems. This
will challenge system stability in the event of disconnection while
larger dimensioning faults increase the need for reserves to recover.
To some extent, power plants with lower rated power display dif-
ferent characteristics to traditional thermal and larger hydropower
plants, due to differences in kinetic energy, regulation capability,
and control functions. Often these smaller power plants do not
provide frequency and balancing reserves.
When fewer large power plants are running, challenges with regard
to reserve capacity arise, and the capability of the system to maintain
a stable frequency deteriorates. Analyses from Statnett show that if
the market has the same functions and products in 2025 as today,
the market will not be able to secure an adequate level of inertia, fre-
quency and balancing reserves, especially in summer periods. Figure
15 shows simulated Nordic production and load in 2025 for the night
segment in a hydrologically normal year. The load in the summer pe-
riod is mostly covered by must-run hydro9, nuclear and wind power.
The low production levels challenge both the availability of resources
for frequency balancing and inertia.
Frequency quality
Figure 15: Simulated Nordic production and load in 2025, for the night segment in a normal year (average of 51 hydrological years) (Statnett). Import covers the remaining demand.
4
30Page
Nordic Power System

4.5 Challenge 3: The need to ensure adequate transmission
capacity for reserves
Access to frequency and balancing reserves requires available trans-
mission capacity. Effective management of congestions in the grid plays
an important role in securing system operation and efficient use of re-
sources. From a physical point of view, reserves should be distributed
in such way that the requisite up- and down-regulation resources will
be available for surplus or deficit areas. The costs of reserves and trans-
mission capacity vary between areas and over time, meaning that the
distribution of reserves has to be dynamically optimised to ensure that
necessary grid capacity is available for the reserves. This would reduce
costs compared to having a fixed distribution of reserves over time.
One current challenge relates to geographically unbalanced volumes
of primary reserves (FCR) in the synchronous system. Another chal-
lenge involves a lack of Regulation Power Market (RPM) bids in the
multinational deficit area in the south (NO1, SE3, SE4 and DK2) on
cold days, and in particular when temperatures drop and there is a
significant risk of market shortages. Such situations often result in
congestions from west to east in Norway and from north to south in
Sweden. This creates a risk that reserves earmarked for disturbances
have to be used for Nordic imbalances. This would lead to unaccept-
able system security.
4.6 Solutions for reducing and handling imbalances
• Higher time resolution in energy and balancing markets
Intra-hour structural imbalances are predictable and should be
more extensively handled in the planning phase through the pow-
er markets. Higher time resolution in energy and balancing mar-
kets, along with appropriate incentives for the balance responsible
parties will secure a better planned power balance at the sub-hour
timeframe and then result in a significant reduction in intra-hour
imbalances. This will improve frequency quality and security of
supply. It will also reduce the demand for frequency and balancing
reserves.
Higher time resolution will also provide new market opportunities
for consumers and producers, facilitate increased grid utilisa-
Frequency quality
4
31Page
Nordic Power System

tion and improve the accuracy and effectiveness of incentives for
market participants.
An ongoing joint Nordic project is currently examining options to im-
plement more finely tuned time resolution in the Nordic system, i.e.
in the energy market, the balancing market and settlement. Impor-
tant main drivers for the project are existing/new system challenges
and regulations in the upcoming Network codes. The project shall
within April 2017 work out a recommendation to implementation
concept and submit this to the Nordic Market Steering Group (MSG)
for further decision.
• Securing adequate frequency and balancing reserves
To secure frequency quality, it will also be crucial to adjust the cur-
rent mechanisms to meet new challenges. As markets may not be
able to secure adequate inertia, frequency and balancing reserves in
all future periods, it will become more important to secure reserves
before the day-ahead market. New solutions for securing an ade-
quate level of inertia should be considered in the context of frequen-
cy containment reserves (FCR).
The Nordic TSOs are currently developing a common market for
automatic frequency restoration reserves (aFRR). A number of
other Nordic projects intended to further develop and improve fre-
quency containment reserves are also underway. To date, aFRR
have been procured separately by each country based on a nation-
al distribution of the total Nordic need. The aim is to achieve more
efficient socio-economic solutions while taking into account oper-
ational distribution requirements. The Nordic TSOs have agreed
on a system for market-based reservation of transmission capaci-
ty, which will involve capacity being allocated to the market where
it is expected to have the greatest value. To this end, as a first step
Statnett and Svenska kraftnät have run a bilateral pilot project on
transmission capacity allocation for exchange of aFRR.
Adequate solutions have been developed to allocate transmis-
sion capacity to the reserve markets. In theory, an optimal solu-
tion would be to clear all reserve markets and the electricity spot
market simultaneously, where the allocation of transmission
capacity between the various markets is part of the optimisation
Frequency quality
4
Figure 16: Illustration of how a quarter-hour market with production changes in quarterly steps reduces imbalances. In the figure on the left, which represents an hourly market, the production plans remain constant throughout the hour and ramp at hour shift while consump-tion changes during the hour remain at a constant rate. In the figure on the right, production changes in four steps, here representing aquarter-hour market, and both the instantaneous power balance (ver-tical) and the imbalance energy (the blue area) decrease significantly.
Illustration of how a quarter-hour market reduces structural imbalances
Consumption
Prodution
Consumption
Prodution
32Page
Nordic Power System

algorithm. However, this is a long-term objective. Over the short term,
the aim should be to introduce more effective coordination of re-
serve procurement, including more efficient allocation of transmis-
sion capacity to the reserve markets. The solutions for exchang-
ing reserves will have to be further developed and coordinated in
the Nordic countries in order to allow reserves to be shared and
exchanged within and outside the synchronous area.
From a longer-term perspective, current or potential future loca-
tion of reserves, and in particular affordable reserves, should be
considered in any analysis of potential grid reinforcements.
Accurate price signals play an important role in securing long-term
incentives for market stakeholders to invest in functionality to serve
adequate frequency and balancing reserves. The market structure,
including more products for balancing and integration of more ar-
eas, should be evaluated with respect to the pricing of imbalances.
Reserves also need to be procured from new sources. The imple-
mentation of the third package by the European Commission,
including network codes, will lead to changes in roles, rules, meth-
ods, cooperation and products in the reserve markets. These chang-
es will to some extent help to pave the way for new suppliers. Below
are some foreseen developments:
• Standard products will also facilitate new suppliers, including
for demand-side and small-scale resources.
• The introduction of a new role in the Nordic area, Balance Ser-
vice Provider, will enable the market to submit reserves to TSO.
• Extended cooperation in balancing (outside the Nordic sys-
tem) will secure better utilisation of reserves and could
increase the reserves available for balancing.
The implementation of AMS with two-way communication could
enable accurate metering of electricity consumption with finer time
resolution and allow electricity consumers to receive price informa-
tion and thereby send more dynamic price signals to end-users.
The solutions for and access to reserves will be more flexible in
future markets. It will be vital to secure an adequate amount of
reserves for the day-ahead market. The most efficient socio-eco-
nomic approach would be to complete trading of reserves shortly
before closure of the day-ahead market on a daily basis.
• Utilisation of market harmonisation and joint/coordi-
nated ICT solutions
There is currently a major focus in the Nordic region on further
market harmonisation. This is being driven by both the operational
needs of the Nordic TSOs and the implementation of common Eu-
ropean network codes. The Nordic TSOs currently employ a joint
planning system for manual balancing (NOIS) but it needs to be
improved. During 2016, a new company eSett, which will introduce
a new ICT system, will assume operational responsibility for im-
balance settlement and invoicing for Finland, Norway and Sweden.
Several joint R&D initiatives using advanced technology are current-
ly being piloted as part of the Nordic TSOs’ long-term development
plans. One key initiative involves the deployment and use of syn-
chro-phasor technology (called PMUs – phasor measurement units).
PMUs will contribute more real-time information that will be useful
for system operators.
• Leveraging of new technologies in system operation
Advanced systems that provide better supervision and real-time
control, and more automation of operational processes will be re-
quired to handle increased complexity and risk in the power sys-
tem moving forward. In future it will be necessary to make even
faster decisions in system operation, which will make it crucial to
have adequate real-time information. Control centres and operating
systems will have to process high volumes of increasingly complex
system data. As the power system develops into a more online and
real-time system, the control centres will be the main hub for moni-
toring, planning, and control actions. The national control centres will
have to have access to operational information on the status of both
the national and Nordic systems, and related preventive and correc-
tive control actions. This will require more real-time analyses.
Additional automatic and responsive control systems will be required
in the future. To increase system observability, the algorithms for bid
selection in reserve markets will have to be optimised, including for
congestion management and electronic activation of bids. The embed-
Frequency quality
4
33Page
Nordic Power System

ding of power grid and ICT systems will improve the efficiency of net-
work operations, and will also facilitate more timely and precise knowl-
edge and information about the status of the system, which in turn will
help to reduce the consequences of failures and frequency deviations.
4.7 Increasing value through cooperation and joint solutions
Further market and operational development will have to take place
within the framework of joint European legislation, including the Eu-
ropean network codes, as well as through close collaboration between
the Nordic TSOs. With more interconnectors linking other areas,
greater impact from these areas is likely. Nordic market solutions will
need to be harmonised and preparations made for efficient integration
with European markets.
The Nordic TSOs will establish a Regional Security Cooperation Ser-
vice Provider (RSC) from 2017. This will comply with EU regulations
on capacity calculation and congestion management (CACM network
code) and system operation (EC 2015), both of which are already in
force. The Nordic RSC is a joint office set up by the TSOs to provide
services to the TSOs relating to the common grid model, capacity cal-
culation, security analysis, outage coordination and short-term ade-
quacy analysis. The national TSOs will remain in charge of security of
supply and final operating decisions.
The current focus in European legislation on boosting regional
cooperation in balancing represents a first step on the road to a pan-
European balancing market. The tools used for regional cooperation
on netting and frequency restoration reserves in Europe are “Coordi-
nated Balancing Areas” (CoBAs). While the Nordic TSOs already coop-
erate, further harmonisation and formalisation of the legislative frame-
work is required. The Nordic TSOs have announced that they will form
a Nordic CoBA for manual frequency restoration reserves (mFRR).
Frequency quality
4
34Page
Nordic Power System

5.1 Introduction
Inertia is defined as the resistance of a physical object to change
its state of motion. In a power system, inertia mostly derives from
synchronous generators and turbines at conventional power sta-
tions, where the motion is the rotational speed of the synchronous
generator rotors (Tielens & Van Hertem 2016.) The rotating speed
of the generators corresponds to the system frequency. In a power
system, inertia refers to the resistance of the system to change
its frequency after an incident. When the generation-consumption
balance changes after generation or load variations, the frequency
always changes too.
A significant imbalance occurs, for example, when a generator
with a high volume of generated power is disconnected from the
system. The mechanical rotating speeds of turbine-generator ro-
tors decelerate, which releases kinetic energy from the rotors into
the power system. The frequency then starts to decrease. In this
way, the connected generators will compensate for the imbalance
caused by the disconnected generator; however, the generators’
immediate rotating speed, and hence the power system frequen-
cy, decrease.
Reserves regulate their power according to the frequency and help
to keep the frequency near the nominal value. If the frequency be-
comes too low after a disturbance, loads are shed in progressive
steps in order to boost the frequency and to keep the system oper-
ational. If load-shedding does not help and the frequency decreas-
es too much, the generators are disconnected from the system
and a blackout occurs.
Inertia in a power system and the rate of change of frequency (Ro-
CoF) are interrelated. Large amounts of inertia in the system re-
duce the rate of change of frequency. Power system inertia main-
ly derives from the kinetic energy stored in the rotors of turbine
generators, (Ulbig, Borsche & Andersson 2015), which then pro-
vide kinetic energy to the grid or absorb it from the grid when the
frequency changes. With high inertia, the frequency decrease is
slower and the frequency containment reserves (FCR) have more
time to react and increase the frequency back towards the nomi-
nal value. Figure 17a shows how the amount of inertia affects the
frequency response after a generator trip. Figure 17b shows the
power responses from inertia, reserves and load.
Inertia
5
Figure 17 Frequency and power responses after a generator trip. a) Initial frequency and frequency responses after a generator trip with high and low inertia and the corresponding RoCoF values. b) Power responses from kinetic energy (inertial response), FCR and load reduction.
Initial frequency
Low inertia
High inertia
Minimum frequency
Minimum frequency
RoCof/RoCof
Frequency
a
FCRInertial responseLoad reduction
low inertia
solid line: high inertiadashed line: low inertia
Time
FCR
Inertial response
Load reduction
Solid line: High inertia
Dashed line: Low inertia
Power
bTime
Initial frequency
Low inertiaHigh inertia
Minimum frequency
Minimum frequencyRoCoF RoCof
FCR
Inertial response
Load reduction
Solid line: High inertiaDashed line: Low inertia
35Page
Nordic Power System

With too low inertia, the frequency drop can be too fast, with
the result that the frequency reaches the load-shedding value
before the reserves have reacted sufficiently.
Larger amounts of renewable energy, phasing out of nuclear units
and higher imports through HVDC connections all reduce inertia
and kinetic energy levels. This may jeopardise system security
after a large unit trip. The Nordic TSOs’ joint project the ‘Future
System Inertia’ report address many of these issues (ENTSO-E
2015b). The next phase of the project is intended to anticipate,
avoid and mitigate low system kinetic energy situations by esti-
mating future kinetic energy levels, developing measures to han-
dle low inertia situations and improving inertia estimation tools.
In the following sections the adequacy of inertia during the target
year (2025) is evaluated, along with the sensitivity of the assess-
ments. Potential remedial actions are also reviewed. The scope of
the study only covers the minimum frequency after the tripping of
the largest unit (generator or HVDC link importing power) since
the minimum frequency depends on the amount of inertia. Certain
other aspects relating to low inertia, such as transient stability and
frequency peak following the disconnection of a power-exporting
HVDC link are not in the scope of the report.
5.2 Methodology
There is currently no requirement for minimum system inertia.
However, the frequency after a dimensioning incident should
be maintained above a specified value in order to avoid any
load-shedding steps. In this analysis, it is assumed that the fre-
quency has to be maintained above 49.0 Hz after any incident in
order to maintain a margin from the highest load-shedding step,
48.8 Hz (ENTSO-E 2015a).
To maintain the frequency above 49.0 Hz, the system must have
a sufficient amount of kinetic energy. However, inertia is not the
only factor that affects the minimum frequency. There are four
main factors: the size of the disturbance, the amount of inertia, the
load self-regulation and the amount and behaviour of the FCR re-
serves, including the HVDC emergency power control (EPC) in the
Inertia
5
36Page
Nordic Power System

system at the time of the incident. However, in all cases, the inertia
sets the initial rate of change of frequency for any given incident.
To gain an overview of the likely inertia situation during the target
year, the hourly kinetic energy is estimated based on power pro-
ductions from the market simulation scenario for 2025 described
in chapter 1.4, and average inertia constants (ENTSO-E 2015b)
of the various types of production in different bidding zones. The
market simulations are carried out using all the measured histor-
ical data (e.g. inflows and temperatures) for all climate years be-
tween 1962 and 2012.
Disturbance simulations are carried out to gain an overview of
how much kinetic energy is needed to withstand the tripping of
the largest unit. The methods used to estimate kinetic energy and
simulate disturbances are discussed in more detail in Appendix 2:
Inertia. Figure 17 shows two examples of disturbance simulations.
5.3 Available and required amount of kinetic energy
The duration of available total kinetic energy and kinetic energy
per production type is presented in Figure 18. The significance
of the future challenges relating to inertia is established by com-
paring estimated kinetic energy with the required kinetic energy
under various assumptions. The sensitivity of the assumptions is
discussed in Appendix 2: Inertia.
The effect of total load, wind and solar production and HVDC im-
ports on the amount of kinetic energy is presented in Figure 19.
The figure shows the estimated hourly kinetic energy for all the
climate years (1962–2012) used in the market simulation scenar-
io. The lowest kinetic energy values are observed during summer
nights when the load is low, see Figure 20. If the sum of wind and
solar power and HVDC imports is high, kinetic energy can be low
even with higher load levels; see Figure 19. The required amount
of kinetic energy is dependent on the amount of load in the syn-
chronous area, where the requirement is shown by the red line in
Figure 19. The requirement line is based on the disturbance sim-
ulations described in the Appendix assuming 0.75%/Hz for load
frequency dependence, so that the initial frequency is 49.9 Hz and
Inertia
5
Figure 18 Duration of estimated total kinetic energy and kinetic energy per production type in 2025. The curves are calculated based on all cli-mate years (1962–2012) in the market simulation scenario.
350
300
250
200
150
100
50
0
Total kinetic energy and kinetic energy per production type
Total
Hydro conventional
Nuclear
Other thermal
Hydro small
Wind and solar
Kinetic energy (GWs)
0 10 20 30 40 50 60 70 80 90 100
% of time
37Page
Nordic Power System

the minimum frequency is 49.0 Hz after the tripping of the largest
unit (Oskarshamn 3).
The kinetic energy in the system varies on a seasonal (Figure 20),
and daily and weekly (Figure 21) basis. The lowest kinetic energy
values are observed during summer nights.
Inertia
5
Figure 19 Estimated kinetic energy in 2025 as a function of total load in the synchronous area with wind and solar production and HVDC import including all climate years (1962–2012). The red line shows the required amount of kinetic energy when 0.75 %/Hz is assumed for load frequency dependence (other assumptions in Appendix 2).
350
300
250
200
150
100
50
0
Kinetic Energy (GWs)
30 35 40 45 50 55 60 65 70
Total Load (GW)
Wind and solar Production and HVDC Import (GW)
-5 0 10 15 20
Estimated kinetic energy in 2025 as a function of total load
-5 0 10 15 20
300
250
200
150
100
0
Estimated kinetic energy as a function of time in 2025
Sund
ay
Q1-
79
Q2-
79
Q3-
79
Q4-
79
Q1-
80
Q2-
80
Q3-
80
Q4-
80
Q1-
81
Q2-
81
Q3-
81
Q4-
81
Q1-
82
Kinetic Energy (GWs)
Climate year/Time
Figure 20 Estimated kinetic energy as a function of time in 2025. The figure shows variation of the kinetic energy during three climate years (1979–1981).
38Page
Nordic Power System

5.4 Adequacy of inertia
According to the Future System Inertia report, the kinetic energy ca-
pacity in the Nordic power system was about 390 GWs in 2015. In
the period 2009–2015, the estimated annual minimum kinetic values
ranged between 110 and 130 GWs while the corresponding annual
maximum values varied from 260–270 GWs. In the period 2010–
2015, the estimated kinetic energy was below 140 GW for 4 per cent
of the time or less; however, in 2009 this duration was as high as 12
per cent (ENTSO-E 2015b).
In 2025 the inertia, measured as kinetic energy, is estimated to be
below the required volume of 120-145 GWs between 1 and 19 per
cent of the time, the average being 8 per cent (based on analyses with
historical reference period 1962-2012) which is shown by the red line
in Figure 19. Table 3 presents the basic statistical properties of the
estimated kinetic energy.
Inertia
5
Figure 21 Estimated kinetic energy as a function of time in 2025. The figure shows the daily and weekly variation of the kinetic energy during a period of two months in the summer of a climate year (1980).
350
300
250
200
150
100
0
01.0
6. 1
980
08.0
6. 1
980
15.0
6. 1
980
22.0
6. 1
980
29.0
6. 1
980
06.0
7. 1
980
13.0
7. 1
980
20.0
7. 1
980
27.0
7. 1
980
Climate Year / Time
Clim
ate
Year
/tim
e
Daily and weekly variations of the kinetic energy
Kinetic Energy (GWs)
All climate years
Dry year (1969)
Wet year (2000)
Kinetic energy (GWs) min. 83 86 117
Kinetic energy (GWs) max. 315 305 304
Kinetic energy (GWs) mean 194 176 210
Kinetic energy (GWs) median 191 170 204
Table 3 Statistical information of the estimated kinetic energy values for 2025 for all climate years (1962–2012), and for a dry year and a wet year.
39Page
Nordic Power System
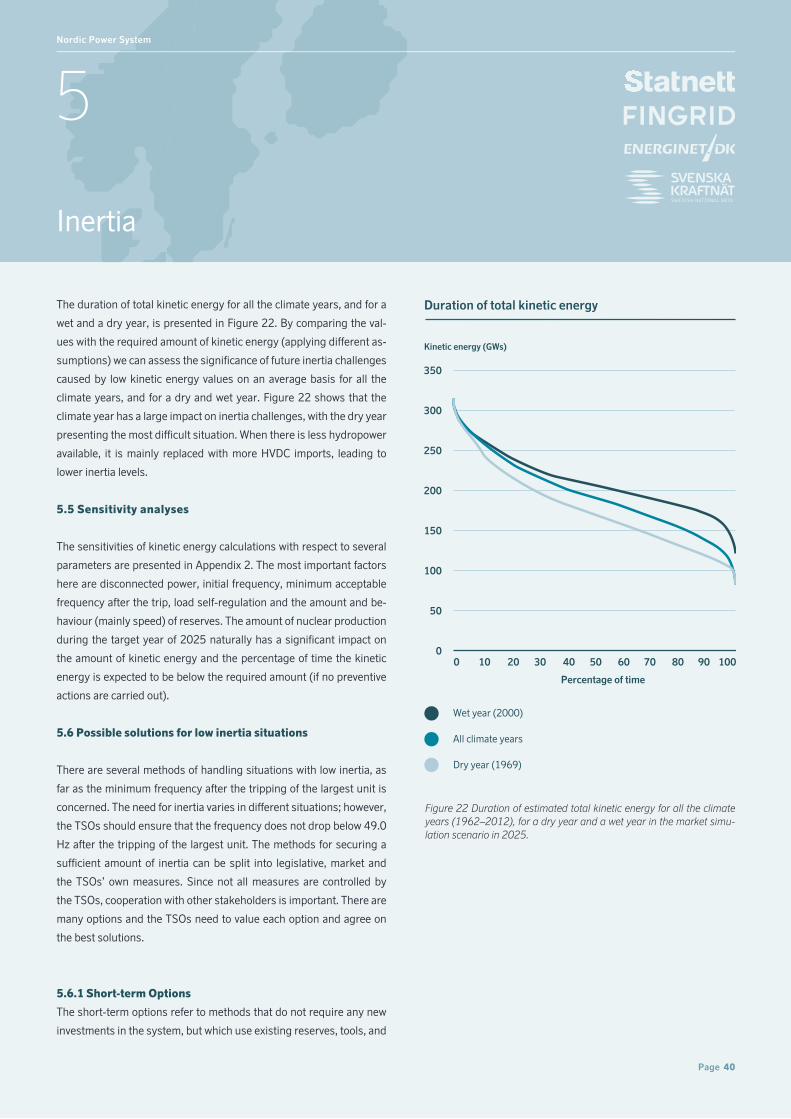
The duration of total kinetic energy for all the climate years, and for a
wet and a dry year, is presented in Figure 22. By comparing the val-
ues with the required amount of kinetic energy (applying different as-
sumptions) we can assess the significance of future inertia challenges
caused by low kinetic energy values on an average basis for all the
climate years, and for a dry and wet year. Figure 22 shows that the
climate year has a large impact on inertia challenges, with the dry year
presenting the most difficult situation. When there is less hydropower
available, it is mainly replaced with more HVDC imports, leading to
lower inertia levels.
5.5 Sensitivity analyses
The sensitivities of kinetic energy calculations with respect to several
parameters are presented in Appendix 2. The most important factors
here are disconnected power, initial frequency, minimum acceptable
frequency after the trip, load self-regulation and the amount and be-
haviour (mainly speed) of reserves. The amount of nuclear production
during the target year of 2025 naturally has a significant impact on
the amount of kinetic energy and the percentage of time the kinetic
energy is expected to be below the required amount (if no preventive
actions are carried out).
5.6 Possible solutions for low inertia situations
There are several methods of handling situations with low inertia, as
far as the minimum frequency after the tripping of the largest unit is
concerned. The need for inertia varies in different situations; however,
the TSOs should ensure that the frequency does not drop below 49.0
Hz after the tripping of the largest unit. The methods for securing a
sufficient amount of inertia can be split into legislative, market and
the TSOs’ own measures. Since not all measures are controlled by
the TSOs, cooperation with other stakeholders is important. There are
many options and the TSOs need to value each option and agree on
the best solutions.
5.6.1 Short-term Options
The short-term options refer to methods that do not require any new
investments in the system, but which use existing reserves, tools, and
Inertia
5
Figure 22 Duration of estimated total kinetic energy for all the climate years (1962–2012), for a dry year and a wet year in the market simu-lation scenario in 2025.
350
300
250
200
150
100
50
0
Duration of total kinetic energy
DK
Wet year (2000)
All climate years
Dry year (1969)
Kinetic energy (GWs)
0 10 20 30 40 50 60 70 80 90 100
Percentage of time
40Page
Nordic Power System

markets, including procuring larger amounts of reserves. In the short-
term, the TSOs need to be aware of the real-time kinetic energy situ-
ation and the corresponding minimum frequency after the tripping of
the largest unit since the required measures depend on the current
situation. Although a tool for real-time estimation of the system kinetic
energy has already been developed, further development opportuni-
ties exist in this area.
In the short-term, it will be possible to boost inertia in the system by
running existing production units with lower average power output or
to limit the power output of the largest units (generators and HVDC
links) to a level where the frequency remains inside the permitted lim-
its. Each synchronised unit adds to the total inertia regardless of its
power output. Running more units is not efficient and requires mar-
ket measures to offer compensation to plants that add inertia, which
must be considered together with the need for frequency containment
reserves (FCR).
Limiting wind power production and replacing this with other types of
generation (with inertia) is also an option in terms of adding inertia to
the system in the short-term.
5.6.2 Long-term Options
Long-term options require investments in the system, legislative
actions or market measures.
More inertia can be added into the system by installing rotating mass-
es, such as synchronous condensers. Establishing inertia markets or
setting minimum system requirements for kinetic energy could also
be options for securing sufficient levels of inertia.
Synthetic inertia (sometimes called virtual inertia) refers, for example,
to the modulation of the power output of the power converters in wind
power plants, HVDC links to outside the synchronous area and battery
systems, in such a way that their output behaves in a somewhat sim-
ilar manner to the synchronous machines after frequency variations.
Adding synthetic inertia is an important option in terms of securing
sufficient inertia in the future. Once the network code on requirements
for the grid connection of generators becomes effective, it is for the
TSOs to decide whether synthetic inertia will be required. (EC, 2016)
Over the long-term, other means include installing system protection
schemes. For example, the maximum effective disconnected power
can be limited by installing system protection schemes that, for in-
stance, disconnect load in case it is needed.
It is also possible to add more FCR, including HVDC EPC, in the sys-
tem, or potentially to increase the reaction speed of the reserves in
the event of a disturbance. Both of these measures help in low inertia
situations. It may also be possible to use more loads as reserves.
Inertia
5
41Page
Nordic Power System

6.1 Introduction
6.1.1 Definition of transmission adequacy
Transmission capacity plays an important role in meeting the system
challenges described in the previous chapters. Adequate transmis-
sion capacity facilitates cost-effective utilisation of energy production,
balancing and inertia resources and helps to guarantee security of
supply.
An adequate level of transmission capacity is reached when the bene-
fits of further capacity investments are less than the associated costs.
This definition means that there will occasionally be periods of con-
gestion and price differences between bidding zones. Similarly, an
adequate level of transmission capacity cannot be expected to com-
pletely rule out a risk of loss of load in areas with a strained power
balance. The key to transmission system planning is to balance costs
and benefits with regard to the risks.
This chapter discusses the challenges that lie ahead with regard to
creating an adequate future-proof transmission system.
6.1.2 Nordic transmission adequacy today
The Nordic transmission grid is well developed compared to European
systems. Thanks to a well-integrated electricity market with marginal
disturbance to cross-border trade, the Nordic countries achieved the
European Energy Union’s target of 10 per cent interconnection ca-
pacity between countries (in relation to national production capacity)
some time ago. Figure 23 shows the transmission capacities between
bidding zones in the Nordic and Baltic power systems.
Transmission adequacy
6
NO4
NO3
NO5 NO1
NO2
SE1
SE2
SE3
SE4
F1
EE
LV
ERI
LRILRE
LBILBE
LT
DK1
DK2
700
1100 1500
60
100
1300
10161200
3300
56
250
300
200
1000
1000600
5005003900
200
600
7300
7300
320
3500 2095 2145
2200600
500
200 300
1632
680723
1300590
600 6151700
2000740
700600
700 1234600 1800
684 291
323
1000879
1000
1500600
615 6801350
5300
3300
Figure 23 The Nordic and Baltic power systems with transmission capacities (maximum net transfer capacities of March 2016 (Nord Pool 2016a).
Nordic and Baltic power system
23
42Page
Nordic Power System

Transmission adequacy
6
Congested interconnectors within the Nordic transmission system re-
sult in recurrent price differences between bidding zones. Figure 24
shows the number of congested hours (hours with a price difference)
between the Nordic bidding zones in the period 2013–2015. Sever-
al connections have been congested for more than 4,000 hours per
year, or close to 50 per cent of the time over the past three years.
Figure 24 Number of congested hours (hours with a price difference) per year between the Nordic bidding zones during 2013–2015 (Nord Pool 2016b).
8000
6000
4000
2000
0
Number of congested hours between Nordic bidding zones
2013
2014
2015
DK
1-D
K2
DK
1-N
O2
DK
1-SE
3
DK
1-SE
4
SE1-
SE3
SE2-
SE3
SE3-
SE4
SE1-
FI
SE3-
FI
SE3-
NO
1
SE2-
NO
3
SE1-
NO
4
SE2-
NO
4
NO
2-N
O5
NO
2-N
O1
NO
1-N
O5
NO
1-N
O3
NO
3-N
O4
Hours
43Page
Nordic Power System

Transmission adequacy
6
To understand the magnitude of the bottlenecks it is also necessary
to consider resulting price differences and existing transmission ca-
pacity. The congestion rent for an interconnector reflects both these
factors, as it is the product of power flow and price differences for a
certain period of time. The number of congested hours and the related
price differences typically depend on weather variations, changes in
generation capacity and buildout of new transmission capacity. Figure
25 shows that congestions in connections between Sweden and Fin-
land have resulted in large congestion rents over the last two years,
partly due to a wet 2015 with large amounts of low-cost hydro power
and structural production deficits.
6.1.3 Transmission planning
Each TSO in the Nordic region is responsible for developing the
transmission system within its borders. The Nordic TSOs have
Figure 25 Congestion rents between Nordic bidding zones for 2013–2015 (Nord Pool 2016b).
120
100
80
60
40
20
0
Congestion rent between Nordic bidding zones
2013
2014
2015
DK
1-D
K2
DK
1-N
O2
DK
1-SE
3
DK
2-SE
4
SE1-
SE2
SE2-
SE3
SE3-
SE4
SE1-
FI
SE3-
FI
SE3-
NO
1
SE2-
NO
3
SE1-
NO
4
SE2-
NO
4
NO
2-N
O5
NO
2-N
O1
NO
1-N
O5
NO
1-N
O3
NO
3-N
O4
MEUR
44Page
Nordic Power System

Transmission adequacy
6
published national grid development plans that present both ap-
proved projects and project candidates. The very nature of the trans-
mission system makes regional cooperation essential to achieving an
effective power system. This has been fully acknowledged by the Nor-
dic TSOs, and joint grid development plans have been published since
2002. Within the framework of the Ten Year Network Development
Plan (TYNDP), regional plans for the Nordic and Baltic countries are
published every two years.
Several investment projects intended to address the current bottlenecks
are in the planning phase or under construction. The SouthWest Link
between SE3 and SE4 is planned to be commissioned during 2016 and
2017. Reinforcement of the grid on the Swedish west coast will lead to
fewer capacity reductions in the Hasle section as well as between Swe-
den and Denmark while reinforcements in southern Norway will also
contribute to less congestion between NO1 and SE3. In August 2016,
Svenska kraftnät and Fingrid will conclude a bilateral study on increased
capacity between Finland and Sweden. Reinforcement of north-south
capacity is planned or ongoing in both Norway, Sweden and Finland.
The regulatory framework is different in each of the Nordic coun-
tries, and the exact formulations of objectives vary between the
TSOs. There is, however, a common understanding that the trans-
mission system should enable an effective power system with
a high degree of security of supply and facilitate integration of
renewable power production and an increased integration of markets.
6.1.4 Regional investment plans 2015
ENTSO-E is structured into six regional groups for grid planning and
other system development tasks. All the Nordic countries except Ice-
land are members of the Baltic Sea Regional Group, and Denmark and
Norway are also part of the North Sea region. These regional groups
publish biennial Regional Investment Plans. A number of drivers were
identified for regional transmission planning in the Baltic Sea region,
as shown in Figure 26.
Identified potential transmission investments are subject to a bilateral
study between the involved TSOs. In this type of study, preconditions
can be adapted to more accurately reflect the regional power system,
and relevant sensitivity analyses can be performed. A cost-benefit
analysis similar to that used by ENTSO E will be performed. If the
project is beneficial for the involved parties, the question of cost-
sharing will have to be addressed before the project can be realised.
Regulation (EU) No 347/2013 introduced cross-border cost allo-
cation (CBCA) as a regulatory tool to facilitate the implementation
of projects of common interest (PCIs). CBCA claims can be submit-
ted by project promoters and settled by regulatory authorities or
ACER when a cost-benefit analysis (CBA) shows that a PCI gener-
ates a net negative impact for the host country while one or more
third countries receive a net positive impact. The idea is that the
cost shall be borne by the State(s) that benefit(s), regardless of
its/their geographical proximity to or involvement in the project.
The Nordic TSOs recognise the benefits of integrating the Europe-
an energy markets and support the development of transmission
capacity based on principles of welfare and voluntary agreements.
However, CBCA is not an appropriate policy instrument and the
project-by-project approach should be replaced with a more
holistic view.
Encouraging states to work together to find mutually beneficial
solutions, including cost-sharing, is a more efficient and appro-
priate strategy for further market integration. This approach has
been proven to successfully facilitate market integration in and
between the Nordic Region and Continental Europe. Replacing
the CBCA with strong regional cooperation, where TSOs and
authorities are involved with commitment and support, is there-
fore believed to be a more efficient way forward.
The Nordic TSOs agree that CBCA is increasing interconnector risk.
6.1.5 Efficient utilisation of transmission capacity
Securing adequate transmission capacity is not only a question
of building overhead lines and cables, but also of utilising exist-
ing capacity efficiently. Allocation of transmission capacity within
the day-ahead and intraday markets is regulated in the European
Guideline on Capacity Allocation and Congestion Management
(CACM). The guideline permits two approaches to calculating
cross-zonal capacity for commercial power exchange: Flow-based
or Coordinated Net Transfer Capacity. The preferred capacity
45Page
Nordic Power System

Transmission adequacy
6
Figure 26 Drivers for grid development in the Baltic Sea region (ENTSO-E 2015c)
???
??? 1. New interconnectors. Strengthen capacity from the Nordic countries to facilitate power export and to integrate different power markets. 2. North South flows. Renewables in the northern areas and increased export capacity from the Nordic region increase incentives for internal north-south reinforcement. 3. Arctic consumptions. Establishment of new power intensive industries may create a need for reinforcements in northern areas. 4. Baltic integration. Market integration and energy security in the Baltic countries drive further interconnection to the Nordic and the European continental system. 5. Nuclear and thermal decommissioning. The risk surrounding future system adequacy is increased.
Heading 3
2
5
1
2
5
4
NNO
NSY
SE1
SE2
SE4
FI
NF1
EE
LV
LT
DK1
DK2
NST
SE3
Drivers for grid development in the Baltic Sea region
261. New interconnectors. Strengthen capacity
from the Nordic countries to facilitate power ex-
port and to integrate different markets.
2. North South flows. Renewables in the north-
ern areas and increased export capacity from
the Nordic region increase incentives for inter-
nal north-south reinforcement.
3. Arctic consumptions. Establishment of new
power intensive industries may create a need for
reinforcements in northern areas.
4. Baltic integration. Market integration and
energy security in the Baltic countries drive fur-
ther interconnection to the Nordic and the Euro-
pean continental system.
5. Nuclear and other thermal decommission-
ing. The risk surrounding future system adequa-
cy is increased.
46Page
Nordic Power System

Transmission adequacy
6
calculation approach in CACM is flow-based since the physical
properties of the transmission grid are better represented in the
market algorithm under such an approach. Either option will in-
volve a change to today’s approach and result in more efficient
utilisation of both production resources and transmission capaci-
ty. These options are currently being evaluated and a decision on
which method that will be used in the Nordic day-ahead market is
expected in the fourth quarter of 2016.
Besides the allocation of transmission capacity within individual
markets, the issue of efficient allocation between markets needs
to be considered. For example, the value of transmission capacity
could sometimes be higher in the balancing market than in the
day-ahead market. Methods for this type of evaluation are being
developed by the TSOs, for instance in the “Hasle pilot”, and these
will help to secure more efficient transmission system.
6.2 Challenges in transmission system development
6.2.1 Challenge 1: Managing uncertainties in the develop-
ment of the future power system
The greatest challenge regarding transmission system planning
concerns the uncertainty of future developments. While the most
important factors currently comprise the integration of wind pow-
er, changing economic conditions for thermal power production
and consumption development, many further factors also come
into play. Over the long term, technological developments on the
demand side as well as in generation technologies and storage
could significantly affect the power system.
It is necessary to consider several scenarios to capture some of the
uncertainties. However, even a range of scenarios may not reflect
all potential actual developments. For example, few analyses pre-
dicted the prevailing low electricity prices, and the pending large-
scale decommissioning of thermal power plants. Furthermore,
considering a large spread of scenarios may also not resolve the prob-
lem as these could be too improbable to provide meaningful support
for any decision.
The challenges involved in making accurate predictions has increased
in recent years. Falling electricity prices have pushed a large part of
the thermal production to a tipping point in terms of continued opera-
tions. In the Nordic countries, as well as in the rest of Europe, the level
of renewables in the power system is the subject of political debate,
and discussions are underway on whether today’s energy-only mar-
ket is the best option for the future. The outcome of these issues will
have a major impact on the need for transmission capacity, and it is
likely that national political decisions and regulatory frameworks will
play an important role in this context. The future of the CO2 market
and the development of European environmental targets will be of ma-
jor importance for predicting the long-term power system.
The Nordic power system is impacted by neighbouring systems.
In particular, German internal congestion has a significant effect
on prices in southern Scandinavia during times of high production
from renewable energy sources. Similarly, Finland and the Baltic
countries are affected by trade with Russia, as illustrated, for ex-
ample, by a number of sudden regulatory changes in the latter
country in recent years. Any change in these issues will derive
from political decisions outside of the Nordic countries, and will
have a substantial impact on transmission capacity requirements.
On a general level, predictions for the future power system will af-
fect which transmission investments are made. Scenarios are used
as a basis for analysis, where inaccurate predictions could result
in socio-economic losses or inadequate security of supply. On the
other hand, the fact that substantial potential gains can be made
from many transmission investments means that postponing an
investment decision can also result in a socio-economic loss.
A number of inherent factors are also increasing the complexity
and sensitivity of scenario analyses. The Nordic region has an
increasingly interconnected power system, which means that we
are increasingly being affected by developments in neighbouring
regions. This situation could also result in diminishing marginal
gains. While the first interconnector between two areas may be an
obvious investment, the benefit of a second or third interconnector
is likely to be smaller and may require more detailed and robust
analyses. The interdependencies between different transmission
investments are affecting project evaluations, and the profitability
of an interconnector may be greatly impacted by other projects.
47Page
Nordic Power System

Transmission adequacy
6
6.2.2 Challenge 2: Including additional power system
values in transmission planning
The second challenge is to broaden our view of the application
areas of transmission capacity for power system services, and to
embrace those values in transmission planning. Historically, the
focus of transmission planning has been on reducing congestions
in the day-ahead market.
Transmission capacity plays an important role in ensuring securi-
ty of supply. If local generation cannot meet demand, transmission
capacity can be used for this purpose in the form of imports.
Improved security of supply can be a main driver of a particular
transmission investment, and this should be adequately reflected
in the analysis and weighed against other costs and benefits. Trans-
mission capacity could provide an alternative to local generation
capacity with regard to improving security of supply.
To maintain stability in the power system, the generation and load in
the system must be equal at all times. In the event of sudden failures
or outages, reserve power must be generated and transferred to the
places where it is needed. The transfer of reserve power is a system
service whose value is not normally included in transmission planning.
A recent pilot study concerning reservation of transmission capacity
earmarked for frequency reserves was carried out for the connection
between southern Norway and Sweden (Statnett 2015c). It showed
that it was both possible and socio-economically viable to reserve
capacity for frequency reserves during the tested weeks.
6.2.3 Challenge 3: Balancing national, Nordic and
European perspectives
Since the Nordic system is so strongly interlinked, it is important
to adopt a Nordic perspective when planning for an efficient trans-
mission system. The Nordic countries have a history of success-
ful collaboration. Plans, data and ideas have been shared through
numerous collaborations for the benefit of the Nordic TSOs. The
Nordic perspective has also featured prominently in transmission
planning: In the period 2002–2008, the Nordel cooperation pub-
lished the Nordic Grid Master Plans, which were based on socio-
economic benefits for the Nordic area (NordREG 2010).
48Page
Nordic Power System

Transmission adequacy
6
However, the Nordic perspective, and its relation to national and
European values, is not clearly defined in any governing document.
The Nordic energy regulators identified that the evaluation criteria
for transmission investments were most often based on national
socio-economic benefits, and that “a possible barrier related to the
national evaluation criteria may arise if an investment is profitable
for the Nordic region as a whole, but not for one particular coun-
try” (NordREG 2010). In practice it is not common for an investment
project to be beneficial for the Nordic region but not for one of the
involved countries; however, such a situation could occur and hence
hinder adequate transmission system development.
6.2.4 Challenge 4: Maintaining operational security and an
efficient market while reconstructing the grid
In addition to requiring new transmission capacity, the Nordic grid is
old and in need of extensive reinvestment. Consequently, a very high
volume of grid projects will be realised in the coming decade. One
major challenge for the TSOs involves making the necessary invest-
ments in time to meet the future needs of the system while maintain-
ing operational security and efficient markets during the construction
phase. While development and increased application of live work will
help meet this challenge, planned outages of grid components will
nonetheless be very frequent in the coming decade, with resulting in-
termittently limited capacity. The investment portfolio shows that this
is especially relevant for the next few years since investments for the
TSOs peak in 2018, see Figure 4.
6.3 Possible solutions
The first set of proposed solutions focus on the TSOs’ ability to
remedy the issues of uncertainties:
• Guide the power system when it is indecisive. The TSOs
have unique insight into the power system, and we should con-
tinuously communicate our knowledge. This would improve the
conditions for regulators, policy makers and market actors to take
informed decisions, and in turn reduce some of the uncertainties
of the future power system.
• Develop uncertainty analysis and results communica-
tion. We use scenarios to illustrate the uncertainty space, but how
should they be set up and evaluated? Should they “span a large
space” of potential outcomes? These issues call for some caution in
the interpretation of the results, and points to the importance of eval-
uating the analysis methods.
• Develop modelling tools. There is room for improve-
ment in our analysis models. To correctly capture flexibility
and to understand how capacity mechanisms influence the power
system might be relevant areas of development.
The challenge to include additional values in transmission plan-
ning is TSO internal, and so is the proposed way forward.
• Develop methods to include additional values in trans-
mission planning. The Hasle-pilot (Statnett 2015c) is an exam-
ple of where a system service (reservation of capacity for balancing
power) was valuated and weighed against the value of transmis-
sion capacity in the day-ahead market. Such development leads to
a more efficient transmission system.
Ways to maintain and strengthen the Nordic perspective are sug-
gested below.
• Coordinate and align national grid development plans.
A first step could be to coordinate release dates. The plans could
also include and elaborate on the general situation in, and the
effects of investments on, the other Nordic countries.
• Transparent objectives and analyses. With transparent
objectives and methods in transmission planning the Nordic per-
spective may become less elusive as a concept and communica-
tion become more straightforward.
• Update overview of TSO mandates and directives. The Nor-
dic energy regulators identified different national legislation and TSO
directives as a possible barrier to effective transmission investments
in a Nordic perspective. The report was requested from the Electricity
Market Group (EMG) under the Nordic Council of Ministers in 2008.
Does the aim remain? In that case, an updated overview is probably
warranted, not least with the increased influence of pan-European
planning in mind.
49Page
Nordic Power System

The way forward
7
The Nordic power system is changing, and not without consequenc-
es. This report concludes that these changes will result in the follow-
ing challenges: An increased demand for flexibility, securing trans-
mission and generating adequacy to guarantee security of supply,
maintaining a good frequency quality and securing sufficent inertia
in the system. These challenges were also identified in the Nordic
strategy published by the four Nordic TSOs in 2015. The strategy
summary showing a Nordic vision for 2025 is shown in Figure 28.
The identified challenges need to be addressed. If no measures are
taken, there can be severe consequences. The need to address the
various challenges is illustrated in the timeline in Figure 29, where
the most important triggers (changes) that will exacerbate the chal-
lenges are also highlighted. The timeline illustrates the situation
if no measures are taken. Action from the Nordic TSOs and other
stakeholders in the Nordic power sector will reduce the risk of the
identified challenges.
There are, however, several solutions available, including market and
technical measures. More extensive cooperation between the Nordic
TSOs is a prerequisite for successful development and implemen-
tation of the available solutions; however, the Nordic TSOs cannot
achieve everything on their own. Successfully developing the power
system, will require extended cooperation across the power sector.
When it comes to ensuring enough system flexibility it is essential
that the regulation of the market facilitate the most cost-efficient
development and utilisation of available flexibility, which cannot be
achieved by the TSOs alone. It is similarly necessary with broader
collaboration to have the regulatory framework to adopt common
definitions of generation adequacy that focuses on an socioeco-
nomically efficient level of security of supply. A sufficient frequency
quality can be obtained through a number of solutions that requires
broader collaboration such as harmonizing of products and market
solutions and an efficient allocation of transmission capacity to re-
serve markets. It is possible to avoid a too low level of inertia through
technical adaption of existing power production units. There is also
a need to clarify common goals for grid development in the Nordics
which calls for an involvement of the regulators.
Some of the identified solutions are marked based where there need
to be an agreement on which market model to develop and imple-
Syste
m Operation Market facilitation New
technologies Common tools Syste
m d
evel
opm
ent Highly
efficient and secure Nordic green power
system
Strategy summery
Ensuring a future robust Nordic power system
Maintaining current high level of security of supply
Better market support for adequacy
Empowering consumers
Strong Nordic voice in EU
1
2
3
4
5
Figure 28 Strategy summary - A Nordic Vision for 2025
50Page
Nordic Power System

The way forward
7
ment. Other solutions are technical where cost and cost-sharing
are the main issue. A third category of solutions is knowledge related
- more insight is needed to evaluate the solutions. Many of the pro-
posed solutions cannot be developed and implemented without exten-
sive collaboration with the regulators and power industry. The power
system is becoming more complex and more integrated. Cooperation
both across contry borders and between different stakeholders is a
prerequisite for success.
Research, development and demonstrations will also be required,
especially where future solutions are unclear, and/or contain new
technology or concepts. By further developing the R&D coopera-
tion between the Nordic TSOs, an increased commitment and more
efficient information sharing is achieved.
The challenges addressed in this report present very welcome input
for the Nordic R&D roadmap which is due to be published in 2017.
The roadmap gathers the various elements of the Nordic Flagship
R&D project and schedules these into achievable milestones in the
coming years.
In addition to engaging with the broader Nordic power sector, the
TSOs will also intensify their own collaboration. The TSOs will follow
up this report with a second phase. As presented in this report the
challenges are on different maturity level and some challenges needs
to be further analysed while for others we can agree on solutions. The
TSOs hence aim in the next phase to 1) Quantify challenges where
needed, 2) Assess the value of the solutions, 3) Compare solutions,
and 4) Agree on the right solutions. The aim of this phase is thus to
take the cooperation a step further and agree on measures.
Figure 29 Timeline fo the identified challenges. The figure include four triggers (changes) that will exacerbate the challenges. Leading up to 2025 and beyond, the risk of the identified challenges will increase if no measures are taken.
Timeline of the identified challenges
System flexibility
Transmission adequacy
Generation adequacy
Frequency quality
Inertia
Toda
y
2020
2025
2035
Outages due to investment peak in the Nordic transmission system Swedish nuclear phase-out New interconnectors to Continental Europe
Wind power capacity tripled
Increasing risk
51Page
Nordic Power System

ACER 2015. Recommendation of the Agency for the Cooperation of Energy Regulators No 03/2015 of 20 July 2015 On the Network Code on Power Balancing. Retrieved from http://www.acer.europa.eu/offi-cial_documents/acts_of_the_agency/recommendations/acer%20recommendation%2003-2015.pdf
EC 2015. European Commission Regulation (EU) 2015/1222 of 24 July 2015 A Guideline on Capacity Allocation and Congestion Man-agement. Retrieved from http://eur-lex.europa.eu/legal-content/EN/TXT/?uri=CELEX:32015R1222
EC 2016. European Commission Regulation (EU) 2016/631 of 14 april 2016 Establishing a Network Code on Requirements for Grid Connection of Generators. Retrieved from http://eur-lex.europa.eu/legal-content/EN/TXT/?uri=OJ:JOL_2016_112_R_0001
Energinet.dk 2016. Anlægsrapport 2015/16. Retrieved March 15, 2016, from Anlægsrapportens investeringsoversigt updated 12. Jan-uary 2016: https://www.anlaegsrapport.dk/2015_2016/Oekonomi/Sider/%c3%98konomi-El-transmission.aspx
Energinet.dk, Fingrid, Statnett and Svenska kraftnät, Landsnet 2014. Nordic Grid Development Plan. Nordic TSOs.
Energistyrelsen 2015. Beregning af effekttilstrækkelighed på SISY-FOS-modellen. Energistyrelsen.
ENTSO-E 2014. TYNDP 10-year Network Development Plan. Brus-sles: The European Network of Transmission System Operators for Electricity.
ENTSO-E 2015a. Appendix 5 of System Operation Agreement 2. Sep-tember 2015. Retrieved 16 April, 2016, from https://www.entsoe.eu/Documents/Publications/SOC/Nordic/System_Operation_Agree-ment_appendices_English_2015_update.pdf
ENTSO-E 2015b. Nordic Report Future System Inertia. Brussels: ENTSO-E.
ENTSO-E 2015c. Regional Investment Plan 2015 Baltic Sea region. Retrieved April 18, 2016, from ENTSO-E: https://www.entsoe.eu/Documents/TYNDP%20documents/TYNDP%202016/301015_Re-gional%20Investment%20Plan%202015%20-%20RG%20BS%20-%20Final.pdf#search=regip%202015
ENTSO-E 2015d. Scenario Outlook & Adequacy Forecast. Brussels: ENTSO-E.
Fingrid 2015. Main Grid Development Plan 2015 - 2025. Helsinki: Fingrid.
Nord Pool 2016a. Maximum NTC Values. Retrieved May 3, 2016,from https://www.nordpoolspot.com/globalassets/dowload-center/tso/max-ntc.pdf
Nord Pool 2016b. Nord Pool Spot Historical Market Data. Retrieved March 23, 2016, from http://nordpoolspot.com/historical-mar-ket-data/
NordREG 2010. Grid investments in a Nordic Perspective. Eskilstuna: NordREG.
Pöyry 2015. Adequacy of power capacity in Finland and the develop-ment of capacity structure until 2030. Pöyry Management Consulting Oy.
Statnett 2015a. Energy-Only Market in Europe 2030. Oslo: Statnett.
Statnett 2015b. Nettutviklingsplanen (NUP). Oslo: Statnett.
Statnett 2015c. Secondary reserves in Hasle-pilot. Retrieved April 17, 2016, from http://www.statnett.no/Drift-og-marked/Markedsinfor-masjon/sekundarreserver/Hasle-piloten/
Svenska kraftnät 2015. Nätutvecklingsplan 2016 - 2025. Sundby-berg: Svenska kraftnät.
Tielens, P., & Van Hertem, D. 2016. The Relevance of Inertia in Power Systems. Renewable and Sustainable Energy Reviews. Volume 55, pp. 999-1009.
Tulensalo, J. 2016. Utilization of a Power Market Simulator in Genera-tion Adequacy Assessment.
Ulbig, A., Borsche, T., & Andersson, G. 2015. Analyzing Rotation-al Inertia, Grid Topology and their Role for Power System Stability. ETH Zurich, Power Systems Laboratory, Vol. 48, No 30. New Delhi: 9th IFAC Symposium on Control of Power and Energy Systems CPES 2015.
References
52Page
Nordic Power System

Definitions
Appendix 1
Definitions of key concepts:
Adequacy is the ability of an electric power system to supply the
aggregate electric power and energy required by the customers,
under steady-state conditions
a) Generation adequacy: An assessment of the ability of the
generation capacity of the power system to match the Load in the
power system.
b) Transmission adequacy: An assessment of the ability of a
power system to manage the flows in the grid resulting from the
location of Load and generation.
c) System adequacy of a power system is a measure of the abil-
ity of a power system to supply the load in all the steady states in
which the power system may exist considering standards condi-
tions. System adequacy is analysed through Generation Adequacy
and Transmission Adequacy (main focus on generation capacity
and load and on simultaneous interconnection transmission ca-
pacity).10
Balancing: All actions and processes, on all timelines, through
which TSOs ensure, in a continuous way, to maintain the system
frequency within a predefined stability range, and to comply with
the amount of reserves needed per Frequency Containment Pro-
cess, Frequency Restoration Process and Reserve Replacement
Process with respect to the required quality.10
Flexibility is the ability of a power system to maintain continuous
service in the face of rapid and large swings in supply or demand
Power system flexibility represents the extent to which a power
system can adapt power generation and consumption as needed
to maintain system stability in a cost-effective manner. Flexibility
services include “up-regulating and down-regulating” that pro-
vides additional power as needed to maintain system balance, and
“down-regulation” that reduces the power generation in the sys-
tem. Contingency (short-term) reserves are required for ensuring
power system stability in the event of large power system com-
ponent outages. Ramping capability is an expression of how fast
flexible resources can change demand or supply of power. 11
Frequency stability: The ability of the Transmission System to
maintain stable frequency in N-Situation (where no element of the
Transmission System is unavailable due to a Fault) and after being
subjected to a disturbance.10
Inertia: The property of a rotating rigid body, such as the rotor
of an alternator, such that it maintains its state of uniform rota-
tional motion and angular momentum unless an external torque
is applied.10
Synthetic inertia: The facility provided by a power park module
or HVDC system to replace the effect of inertia of a synchronous
power generating module to a prescribed level of performance.10
10ENTSO-E 2016. Definitions and Acronyms. Retrieved March 12, 2016, from Glossary: https://emr.entsoe.eu/glossary/bin/view/GlossaryCode/GlossaryIndex11ECOFYS 2014. Flexibility options in electricity systems. Berlin: ECOFYS Germany GmbH.
53Page
Nordic Power System

Inertia
Appendix 2
Methodology
Hourly kinetic energy estimation
Hourly power productions of the different production types in the dif-
ferent bidding zones are used in order to estimate available kinetic
energy during each hour of the target year (2025) for each production
type and bidding zone. The following equation is used in the estimation:
where Wkin is kinetic energy in gigawattseconds, P is aggregate active
power production of the production type in the specific bidding zone,
H is average inertia constant of the production type in seconds, p is
the average ratio of actual power production divided by the sum of
rated power values ( ) of the production type in the specific bid-
ding zone, and cos is the average power factor (PR/SR). The power
productions are variables and based on the hourly market simulation
scenario used throughout the report. The other parameters are as-
sumed constant.
The following categorisation of the power production types and the
average inertia constants (in parenthesis) are in most cases used for
each production type12:
- nuclear (H = 6.3 s)
- other thermal (H = 4 s)
- hydro conventional (H = 3 s)
- hydro small-scale (H = 1 s)
- wind and solar (H = 0) => no kinetic energy
For p, the value of 1 is used for other production categories except for
hydro a value of 0.8 is used. This means that rated power production
of each unit for other production types is assumed (p = 1, a conserv-
ative estimate). For hydro, 80 % production of their rated capacity is
assumed on average. The 80 % assumption for hydro is because the
efficiency of a hydro generator is usually at maximum around 80 %
production13.
For the power factor, cos �, an average value of 0.9 is assumed for
each production type.
Exceptions of the above values are such that for Eastern part of Den-
mark (DK2), other thermal production the values of H and p are 3 and
0.5, respectively.
Simulation of disturbances
In order to estimate the required amount of kinetic energy in different
situations, the E-Bridge RAR (Requirements for Automatic Reserves)
Simulink model14 is used to find out minimum kinetic energy that is
needed to withstand the tripping of the largest unit. It is assumed that
the step size will be –1450 MW (equivalent to the tripping of Oskar-
shamn 3). Olkiluoto 3 will be 1600 MW but it has a system protection
scheme (SPS) of 300 MW reducing its tripped power to 1300 MW. If
the loads of the SPS are not connected, the plant runs at 1300 MW.
In a normal case, the load self-regulation (frequency dependence) is
assumed to be 0.75 %/Hz and the reserves are the same as typical
reserves in 2016. This is because the amount and behaviour of the
12ENTSO-E 2015. Nordic Report Future System Inertia. Brussels: ENTSO-E. 13Björnstedt, J. 2012. Integration of Non-synchronous Generation, Frequency Dynamics. Lund University: Department of Measurement Technology and Industrial Electrical Engineering. 14E-Bridge Consulting GMBH 2011. Analysis & Review of Requirements for Automatic Reserves in the Nordic Synchronous System - Simulink Model description . Bonn: E-Bridge Consulting GMBH.
350
300
250
200
150
100
0
Hourly total inertia for all climate years
Sund
ay
1960
1965
1970
1975
1980
1985
1990
1995
2000
2005
2010
2015
Kinetic Energy (GWs)
∑ iPP R
φcoskin ⋅⋅
=p
HPW
∑ iPP R
φcoskin ⋅⋅
=p
HPW
∑ iPP R
φcoskin ⋅⋅
=p
HPW
∑ iPP R
φcoskin ⋅⋅
=p
HPW
Figure 30 Hourly total inertia for all climate years.
54Page
Nordic Power System

Inertia
Appendix 2
future reserves is not yet known. In this normal case, it is conserva-
tively assumed that the initial frequency is 49.9 Hz and all the normal
reserves (FCR-N) have already been activated before the trip. In the
simulations, the acceptable minimum frequency after the trip is 49 Hz
as has been assumed in the Nordic analyses earlier.
Hourly amount of kinetic energy
Hourly estimated amount of kinetic energy during 2025 for each cli-
mate year is presented in Figure 30, and durations of kinetic energies
per bidding zone for all climate years are presented in Figure 31.
Sensitivity analyses
Uncertainty in the amount of kinetic energy
Table 4 and Table 5 present a comparison between the original mar-
ket simulation scenario for 2025 and a scenario with the half of nucle-
ar production. In the scenario with the half of nuclear power, it is as-
sumed that only half of the nuclear production of the original scenario
is available. The assumption is that the nuclear production is replaced
with higher import and wind and solar production.
In the scenario with the half of nuclear power, the percentage of time
when the kinetic energy is below the required amount is 22 % (1901
hours per year) when all climate years are taken into account. For dry
year conditions (1969), the duration is 39 % (3355 hours per year),
and for wet year conditions (2000) the duration is 4.2 % (369 hours
per year). In the full nuclear scenario, the respective durations are 7.7
%, 18 %, and 0.7 % (meaning 673, 1616, and 63 hours per year).
Figure 31 Durations of kinetic energies per bidding zone for all the climate years.
Kinetic Energy (GWs)
Duration of total Kinetic Energy
70
60
50
40
30
20
10
0
SE3
F1
SE2
SE1
SE4
0 10 20 30 40 50 60 70 80 90 100
% of time
NO2
NO5
NO4
NO3
NO1
DK2
All climate years Full nuclear Half nuclear
Kinetic energy (GWs) min. 83 63
Kinetic energy (GWs) max. 315 277
Kinetic energy (GWs) mean 194 161
Kinetic energy (GWs) median 191 159
Table 4. Statistical information of the estimated amount of kinetic energy with full nuclear scenario (the original market simulation scenario for 2025) and a scenario with half of nuclear production.
55Page
Nordic Power System

Inertia
Appendix 2
Maximum Disconnected Power
Sensitivity of the required amount of inertia with respect to the
disconnected power is presented in Table 7.
Duration of time in percentage (hours per year) when the kinetic energy is below the requirement Average power of the units, p (pu)
H (percentage of the values of the original values scenario)
Conventional hydro: 0.6, others: 0.8
Conventional hydro: 0.7, others: 0.9
Conventional hydro: 0.8, others: 1
Conventional hydro: 0.9, others: 1 All: 1
80 7.1 % (618) 14 % (1191) 23 % (1994) 28 % (2432) 33 % (2894)
90 3.3 % (274) 7.7 (672) 14 % (1191) 17 % (1507) 21 % (1815)
100 0.84 % (74) 3.9 % (345) 9.7 % (849) 10 % (915) 13 % (1126)
110 0.15 (13) 1.5 % (130) 4.7 % (409) 6.4 % (559) 8.1 % (709)
120 0.02 (1.6) 0.35 % (31) 2.1 % (187) 3.4 % (294) 4.6 % (407)
Table 6. Sensitivity of the duration of time when the inertia (measured by kinetic energy) is below the requirement as a function of average generated power of the units (p) and average inertia constants (H) for all bidding zones ( including DK2).
Disconnected power (MW) 1000 1100 1200 1300 1400 1500 1600
Required amount of kinetic
energy (GWs)48 62 79 101 128 166 217
Table 7. Sensitivity of the required amount of inertia as a function of the disconnected power.
All climate years Number of hours per year % of time
Kinetic energy (GWs) belowFull nuclear
Half nuclear
Full nuclear
Half nuclear
85 0.078 110 0.00089 1.3
90 1.1 222 0.013 2.5
95 3.9 367 0.045 4.2
100 15 534 0.17 6.1
110 99 985 1.1 11
120 325 1585 3.7 18
130 613 2274 7.0 26
140 973 2978 11 34
150 1487 3681 17 42
Table 5. Number of hours per year and the share of time when the estimated inertia is below the indicated values for the full nuclear (the original scenario) and for a scenario wi]half of nuclear production.
56Page
Nordic Power System

Inertia
Appendix 2
Amount of Reserves
Sensitivity of the required amount of kinetic energy on the amount
of reserves is presented in Table 9. The amount and behaviour of
reserves in 2025 is not yet known, therefore the usual reserves in
2016 are used as a reference. The simulations are carried out in
such a way that the output of the reserves is multiplied with the
ratios indicated in the table. The response of the reserves is other-
wise kept the same.
Amount of reserves (percentage of the reference reserves: usual reserves in 2016) 80 90 100 110 120 130 140
Required amount of kinetic energy (GWs) 269 192 145 119 102 89 79
Table 9. Sensitivity of the required amount of kinetic energy as a function of the amount of reserves.
Initial frequency and minimum frequency after the trip
Sensitivity of the required amount of inertia depending on the
range of frequencies is presented in Table 8. For the assessment
of the probability of the different initial frequency values, historical
data on the frequency behaviour is presented in Table 12.
Required amount of kinetic energy (GWs) Minimum frequency (Hz) after the trip
Initial frequency (Hz) 48.8 49 49.2 49.5
50 58 96 191 833
49.95 65 114 239 1130
49.9 78 145 329 1927
Table 8. Sensitivity of the required amount of kinetic energy as a function of the initial frequency and minimum frequency after the trip.
57Page
Nordic Power System

Inertia
Appendix 2
Required amount of kinetic energy (GWs) Load self-regulation (% / Hz)
Amount of load (GW) 0 0.25 0.5 0.75 1 1.5 2
20 234 211 189 170 153 125 104
25 234 205 179 157 138 109 86
30 234 200 170 145 125 95 71
35 234 194 161 134 114 82 58
40 234 189 153 125 104 71 47
45 234 184 145 117 95 61 39
50 234 179 138 109 86 52 31
55 234 175 131 102 78 45 25
60 234 170 125 95 71 39 21
Table 10. Sensitivity of the required amount of kinetic energy as a function of load self-regulation and amount of load.
Load self-regulation and amount of Load
Sensitivity of the required amount of kinetic energy as a function of
the load self-regulation (frequency dependence) and amount of load
is presented in Table 10. Historical data on the minimum load can be
found in Table 11 for the assessment of probable minimum load.
Historical data analyses
Frequency below 2008 2009 2010 2011 2012 2013 2014 2015
49.90 0.624 0.764 0.947 1.04 0.933 0.967 0.932 0.961
49.92 2.19 2.47 2.93 3.09 2.93 2.85 3.02 3.11
49.94 6.83 7.07 8.04 8.18 8.00 7.58 8.12 8.33
49.96 16.3 16.5 18.0 18.1 17.9 17.1 18.0 18.3
49.98 31.3 31.3 32.7 32.6 32.5 31.8 32.8 33.0
Table 12. The share of time (%) when frequency is below the indicated frequency.
All climate years Min. consumption in the sync. area (GW)
Consumption over 30 GW in the sync. area ](% of time)
2013 24.1 90.5
2014 24.9 91.2
2015 26.5 94.4
Table 11. Minimum load in the synchronous area and the share of time when the consumption is over 30 GW.
58Page
Nordic Power System

Status of investment in the Nordic power system
Appendix 3
Based on a request from the Electricity Market group under the
Nordic Council of Ministers, in the years of no publication of Nor-
dic Grid Development Plan, the Nordic TSOs will publish a status
update of the Nordic grid investments.
Nordic grid planning
In 2014 Nordic TSOs re-established a Nordic planning group in
order to ensure continuous Nordic focus in regional transmission
planning.
Nordic TSOs take part both in common Regional planning in ENT-
SO-E (in Regional groups Baltic Sea and North Sea) and cooperate
in grid planning issues on Nordic level (Nordic Planning Group).
All the Nordic TSOs are currently in a middle of high investment
activities both due to expected power system changes caused
by the increased installation of renewable generation and due to
re-investments caused by aging of power system components.
Status of selected Nordic projects
Increased capacity, Nordics to Continent (incl. Great Britain)
Increased capacity, Nordics to Continent (incl. Great Britain) Planned projects
Norway–DE 1400 MW 2020
Norway–GB 1400 MW 2021
Sweden–DE 700 MW 2025
DKwest–NL 700 MW 2019
DKeast–DE 400 MW 2018
DKwest–GB 1400 MW 2022
DKwest–DE
(two projects) <=2000MW <=2022
2
1
5
46 3
7
59Page
Nordic Power System

Status of investment in the Nordic power system
Appendix 3
Increased capacity, Nordics to Continent (incl. Great Britain) Planned projects
(1) Norway–Germany (Nord Link) 1400 MW.
Licenses permitted, investment decided, construction started.
2020
(2) Norway–England (North Sea Link) 1400 MW.
Licenses permitted, investment decided, construction started.
2021
(3) Eastern Denmark–Germany 400 MW (Kriegers Flak): Together
with German TSO 50Hertz Transmission GmbH offshore interconnec-
tor for the Kriegers Flak offshore wind farm is being developed. The
new interconnector will take advantage of the proximity of Danish and
German wind farms by adding short cables and thus connecting the
wind farms to both Germany and Denmark. The European Commission
is supporting the interconnection with up to 150 m€. The tendering
for the project is in progress and the first main equipment is ordered.
All contracts are expected to be signed by the end of 2016.
2019
(4) Western Denmark–Netherlands 700 MW (Cobra): The project
obtained in the summer 2014 a conditional investment approval by
the Danish and Dutch Ministries. Contracts have been awarded to
Prysmian for the cables and to Siemens for the converter stations in
January 2016. With the contract award the project enters the Con-
struction phase, with planned installation works in 2017-18 followed
up by commissioning and operation in Q1 2019.
2019
(5) Western Denmark–Great Britain 1400 MW (Viking Link):
The project is making good progress and is following the project plan.
The project is in the feasibility and planning phase. Expected commis-
sioning is in late 2022. Request for §4 approval has been submitted to
the Danish Energy Agency during winter 2016. The sea bed survey is
in progress and will be finished during autumn 2016.
2022
60Page
Nordic Power System

Increased capacity between the Nordic and Baltic systems
Today the Baltic power system is synchronised with the Russian
system. Based on security of supply and based on geopolitical
risks, the European Commission aims for a Baltic system stronger
connected to the Continental and the Nordic system. This is also
the main driver for the increased capacity between the Baltic and
the Nordic systems. Two interconnectors were lately commis-
sioned. Additional DG Eenergy evaluates a desynchronisation of
the Baltics from the Russian system. One of the evaluated alterna-
tives is synchronisation the Nordic system with the Baltic system.
Status of investment in the Nordic power system
Appendix 3
Increased capacity, Nordics to Continent (incl. Great Britain) Planned projects
(6) Western Denmark–Germany: The project is in two parts, East
Coast and West Coast. The East Coast project is an upgrade of the
existing 220 kV line over the border to 400 kV which will increase
the trading capacity from 1500/1780 MW to 2500/2500 MW.
This will in Kassø connect to the 400 kV backbone from Kassø to
Tjele which was upgraded in 2014. Energinet.dk is still awaiting §4
approval of request submitted to the Danish Energy Agency.
The West Coast project being studied is a connection from Endrup
(DK) to Niebüll (DE) as a 400 kV double circuit. This will increase
capacity on the border from 2500 MW to 3500 MW. Request for §4
approval has been submitted to the Danish Energy Agency during
winter 2016.
2022
(7) Sweden–Germany 700 MW (Hansa PowerBridge)
Svenska kraftnät and the German TSO 50 Hz are planning a new
interconnector. A joint pre-feasibility study was done in 2014
and was followed by internal studies. A cooperation agreement to
continue with more detailed preparatory work was signed in late
2015 and the first investment decisions are planned for the first
part of 2017. A second interconnector (Hansa PowerBridge 2) will
later also be considered.
2025
Project Commissioned
Estlink 2 (Finland–Estonia, 650 MW) 2014
NordBalt (Sweden–Lithuania, 700 MW) 2016
61Page
Nordic Power System

Status of investment in the Nordic power system
Appendix 3
Increased capacity, North–South in the Nordics Planned projects
Finland 2015–2024
Sweden 2017–2025
Norway 2016–2022
Finland Three 400 kV AC lines still to be commissioned
• (1) Hirvisuo–Pyhänselkä 400 kV AC line in construction,
planned commissioning 2016
• (2) Petäjävesi–Pyhänselkä 400 kV AC line, EIA done 2012,
route selected 2013, expected into operation by 2023
• (3) Keminmaa–Pyhänselkä 400 kV AC line expected 2024
Sweden (from North to South)
• Series compensation between bidding zones SE1 and SE2 is still con-
sidered in combination with other reactive compensation alternatives
between SE2 and SE3. There is today no expected commissioning date
for these investments.
• New shunt compensation and upgrades of existing series compensa-
tion between bidding zones SE2 and SE3 are planned for installation
between 2017 and 2025. This will increase the north–south capacity.
• (4) Studies have started on how to replace the oldest 400 kV lines
with new and stronger lines. This will also lead to an increased capacity
for power flows between SE2 and SE3.
In Norway many projects (5) are planned in order to increase the
North-South capacity. Among the most important projects are:
• Ofoten–Balsfjord–Skaidi; to be commissioned 2016–2020
• Voltage upgrades through north and mid of Norway
• New lines in Mid-Norway (Fosen)
• Ørskog–Sogndal; to be commissioned 2016/2017
• Vestre Korridor; to be commissioned 2017–2022
45 12
6
37
62Page
Nordic Power System

Increased capacity, Finland–Sweden Planned projects
Svenska kraftnät and Fingrid have started a joint study in 2015
to analyze transmission needs between Sweden and Finland. The
study will include the third AC-line in the North and replacement
of Fenno-Skan 1 at the current location or between areas SE2–FI.
Renewal of Fenno-Skan 1 is studied with existing or increased
capacity. Capacity study is expected to be completed in autumn 2016.
400 kV AC line 2025
Renewal of Fenno-Skan 1 ~2030
(1) Finland–Sweden 400 kV AC line 2025
(2) Renewal of Fenno-Skan 1 link. The link is currently operated with
a reduced capacity due to cable conditions.
2030
Status of investment in the Nordic power system
Appendix 3
1
2
63Page
Nordic Power System

Status of investment in the Nordic power system
Appendix 3
Securing the Arctic region Planned projects
400 kV line Norway 2016/2021
Reinforcing 220kV Finland–Norway
Norway
Statnett is building the new line (1, 2) Ofoten–Balsfjord–Skaidi in
order to obtain an adequate SoS for the region. The first part of the line
(Ofoten–Balsfjord) will be commissioned in 2016/17 while the second
part (Balsfjord–Skaidi) is planned to be commissioned in 2021. A line
further east (Skaidi–Varangerbotn) is planned, however no decisions
taken.
Finland–Norway. Statnett has completed a Concept Selection Study
for the North of Norway. Based on the study Statnett has concluded
that, assumed increased petroleum activity, a new line from Finland
to the north of Norway might be beneficial. Capacity increase of the
existing 220 kV connection Norway–Finland is also studied. (3).
Nordic Prioritised Cross-Sections, 2004
In 2004 Nordic TSOs agreed on reinforcing five prioritised
cross-sections.
Out of the suggested five projects, four have been commissioned
while for the last one (SouthWest Link), the western part was
cancelled due to changed circumstances and needs. The original
Swedish part of the project are about to be fully commissioned (de-
tails below).
3
1
5
4
6
27
Project Commissioned
Fenno–Skan 2 2011
Nea–Järpströmmen 2009
Great Belt 2010
Skagerrak 4 2014
SouthWest Link Sweden More details below
64Page
Nordic Power System

Status of investment in the Nordic power system
Appendix 3
SouthWest Link Planned projects
(1) The SouthWest Link is in its final phase of completion.
The northern part is realised as a 400 kV AC overhead line and
was taken into operation in April 2015. The first of the two HVDC-
links in the southern part is scheduled to be taken into operation
in the autumn of 2016 and the second in the middle of 2017.
21
5
46
3
7
65Page
Nordic Power System

Nordic Power System
Phone: +47 23 90 30 00
Fax: +47 23 90 30 01
E-mail: � [email protected]
statnett.no
Phone: +45 70 10 22 44
Fax: +45 76 24 51 80
E-mail: [email protected]
Energinet.dk
Phone: +46 10 475 80 00
Fax: +46 10 475 89 50
E-mail: [email protected]
svk.se
Phone: +358 30 395 5000
E-mail: webmaster@� ngrid.�
Fingrid.� Oslo 2016.08.15