power system review - utilities commission power system revie… · 1.1 the power system review is...
TRANSCRIPT

Level 9, 38 Cavenagh Street DARWIN NT 0800
Postal Address GPO Box 915 DARWIN NT 0801
Email: [email protected]
Website: www.utilicom.nt.gov.au
POWER SYSTEM REVIEW
2008-09
March 2010

i
2008-09 Power System Review March 2010
Table of Contents
Key Findings................................................................................................................................... 1
Major events in 2008-09..................................................................................................................................................1
Generation adequacy ......................................................................................................................................................2
Networks adequacy .........................................................................................................................................................3
Adequacy of fuel supplies ...............................................................................................................................................4
System performance – generation and networks ..........................................................................................................4
Customer service indicators............................................................................................................................................6
Introduction..................................................................................................................................... 8
Overview of 2008-09 Review ..........................................................................................................................................9
Structure of Review .......................................................................................................................................................10
Power System Overview ............................................................................................................. 12
Power system information.............................................................................................................................................13
Significant power system events...................................................................................................................................14
Electricity Generation.................................................................................................................. 17
Historical electricity usage.............................................................................................................................................17
Historical electricity demand .........................................................................................................................................21
Generation capacity.......................................................................................................................................................23
Baseline capacity projections........................................................................................................................................26
Demand forecasts..........................................................................................................................................................29
Forecast supply-demand balance.................................................................................................................................31
Electricity generation performance ...............................................................................................................................40
Adequacy of fuel supplies .............................................................................................................................................46
Electricity Networks..................................................................................................................... 50
Electricity networks overview ........................................................................................................................................51
Network planning and reliability ....................................................................................................................................52
Forecast electricity demand and network capacity-demand balance .........................................................................54
Network performance ....................................................................................................................................................57
Customer Service Indicators ...................................................................................................... 68
Appendix A: Substation capacity 2008-09....................................................................................................................72

ii
2008-09 Power System Review March 2010

iii
2008-09 Power System Review March 2010
Disclaimer
The Power System Review is prepared by the Utilities Commission as a report to the
Minister, participants in the electricity supply industry and the community in accordance with
section 45 of the Electricity Reform Act.
The Review also reports on performance against standards of service under the Electricity
Standards of Service Code, and on performance of the power system under the System
Control Technical Code.
The Review is prepared using information sourced from participants in the electricity supply
industry, Northern Territory Government agencies and relevant publicly available data. The
Commission understands this information to be current as at December 2009.
The Review contains predictions, estimates and statements that are based on the
Commission’s interpretation of data provided by electricity industry participants, and
assumptions about the power system, including load growth forecasts and the affect of
potential major developments in particular power systems. The Commission considers that
the Review is an accurate report within the normal tolerance of economic forecasts.
Any person using the information in the Review should independently verify the accuracy,
completeness, reliability and suitability of the information and source data. The Commission
accepts no liability (including liability to any person by reason of negligence) for any use of
the information in this Review or for any loss, damage, cost or expense incurred or arising by
reason of any error, negligent act, omission or misrepresentation in the information in this
Review or otherwise.
Inquiries
Any questions regarding this report should be directed in the first instance to the Executive
Officer, Utilities Commission at any of the following:
Utilities Commission
GPO Box 915
DARWIN NT 0801
Telephone: 08 8999 5480
Fax: 08 8999 6262
Email: [email protected]

1
2008-09 Power System Review March 2010
CHAPTER 1
Key Findings
1.1 The Power System Review is an annual document prepared by the Utilities
Commission to advise the Minister, participants in the electricity supply industry
(including potential participants) and the community on power system performance and
capacity.
1.2 The 2008-09 Review provides an overview of the generation capacity, forecast
electricity load and generation, network and customer service performance of the
Northern Territory’s three main power systems, Darwin-Katherine, Tennant Creek and
Alice Springs for the period 2008-09 to 2018-19.
1.3 The Commission has decided to expand the scope of the 2008-09 Review to
consolidate the system performance data available to the Commission in a single
document. The 2008-09 Review includes information which in previous years was
separately reported in the Northern Territory Electricity Market Information statement
and the Standards of Service performance report.
1.4 The scope of the Power System Review is an evolving project, and the Commission
anticipates further changes to the approach and content of subsequent reviews in
response to the findings of the series of reviews being undertaken by the Commission
during 2010 for the Treasurer. In particular, the Commission anticipates future Power
System Reviews will provide more detailed data and analysis of power system
performance, reliability and security.
Major events in 2008-09
1.5 Equipment failures in and around the Casuarina zone substation in the northern
suburbs of Darwin during September and October 2008 led to extended power outages
to a large number of customers, with the most significant outage causing more than
11 000 customers to lose power for up to 14 hours. The Territory Government
commissioned the Independent Enquiry into Casuarina Substation Events and
Substation Maintenance Across Darwin (the Davies Enquiry), which exposed
deficiencies in electricity networks maintenance practices and asset management by
the service provider, the Power and Water Corporation (PWC).
1.6 The PWC response to the Davies Enquiry included establishing the Remedial Asset
Management Program (RAMP) to ensure safe access to substations, carry out
remedial works and replace failed equipment at Casuarina zone substation. PWC also
continued efforts to improve asset management systems and capability, and
implemented an action plan to improve asset management operations in the long term.
1.7 Energy infrastructure projects underway or completed in 2008-09 included the
completion of works on Weddell power station stage two, adding up to 44 megawatt of
capacity to the Darwin-Katherine system, or about 9 per cent of system capacity.

2
2008-09 Power System Review March 2010
1.8 Additional sources of gas for electricity generation became available with the
completion of a pipeline connecting the Darwin liquefied natural gas (DLNG) plant to
the Darwin city gate gas hub in July 2009, and the first supply of gas from the Eni
Australia B.V. (Eni) owned and operated Blacktip gas field in the Bonaparte Gulf in
October 2009. From the December quarter 2009, gas for electricity generation in the
Darwin-Katherine, Tennant Creek and Alice Springs systems was available in varying
quantities and quality from the Amadeus Basin fields, Blacktip field and the DLNG
plant.
Generation adequacy
1.9 Generation peak demand in the Darwin-Katherine system increased by 22.5 per cent
between 1999-00 and 2008-09, an average of 2.1 per cent per year. Generation peak
demand increased by 2.4 per cent between 2007-08 and 2008-09. The rate of peak
demand growth over the period has been influenced by periods of major industrial
development; for example the 2005-06 and 2006-07 period, when the DLNG plant was
under construction, saw an increase in peak demand of 8.4 per cent.
1.10 The increase in generation peak demand in the Alice Springs system between 2007-08
and 2008-09 was about 0.1 per cent. The average annual rate of peak demand growth
between 2001-02 and 2008-09 was about 2.7 per cent.
1.11 Generation peak demand increased by 5.7 per cent in the Tennant Creek system
between 2007-08 and 2008-09. The average annual rate of peak demand growth
between 2001-02 and 2008-09 was 2.5 per cent.
1.12 To assess the adequacy of generation infrastructure to meet forecast generation peak
demand in the period 2009-10 to 2018-19, the Commission has tested the sensitivity of
ten year forecasts provided by electricity industry participants.
1.13 For the Darwin-Katherine system, the Commission has used a high growth scenario of
4 per cent per year, a baseline growth scenario of 2.4 per cent a year, and a low
growth scenario of 1 per cent a year. For the Alice Springs and Tenant Creek systems,
the Commission has used a high growth scenario of 2.5 per cent per year, a baseline
growth scenario of 1.0 per cent a year, and a low growth scenario of 0.1 per cent a
year.
1.14 Under the low, baseline and high growth scenarios, projected generation capacity in
each system using current security of supply criteria (N-2, or the loss of two largest
units of generation capacity) appears adequate to meet forecast peak demand in the
medium term to 2011-12 and long term to 2018-19, with the exception of:
• the Darwin-Katherine system, where projected generation capacity is adequate until 2012-13 under the high peak demand growth scenario, and until 2014-15 under the baseline peak demand growth scenario; and
• the Alice Springs system, where projected generation capacity is adequate until 2016-17 under the high peak demand growth scenario.
1.15 The projected adequacy of generation capacity in the Darwin-Katherine and Alice
Springs systems is subject to the planned installation of additional capacity in the
period to 2011-12. Alteration to plans to add or retire capacity will affect the projected
adequacy of capacity to meet forecast demand.

3
2008-09 Power System Review March 2010
1.16 The Commission was advised in November 2009 that, between 2009-10 and 2011-12,
12.1 MW of capacity is to be added at the Katherine power station in 2010-11, 30 MW
of capacity is to be added at the Weddell power station in 2011-12, and the 30 MW of
capacity at the Berrimah power station is to be retired from service by 2011-12.
1.17 For the Alice Springs system, between 2009-10 and 2011-12, 32.1 MW of capacity is
to be added at the Owen Springs power station in 2010-11, and 14 MW of capacity at
the Ron Goodin Power station is to be retired or relocated in 2010-11.
1.18 The Commission notes that this assessment of the adequacy of generation
infrastructure to meet forecast peak demand is based on an assumption of all
generation infrastructure being in good working condition and generally available for
dispatch. Without additional information about scheduled extended outages, the
condition of generation assets and availability of plant, the Commission cannot
ascertain whether there is adequate reserve capacity to meet forecast peak demand,
particularly in the short to medium term.
1.19 The Commission considers that additional information is necessary to effectively
assess generation adequacy. In future reviews, key data to be required of generators is
expected to include: the operating capacity of plant under varying circumstances, the
condition of the assets, and the potential for planned and unplanned outages to reduce
available generation capacity.
Networks adequacy
1.20 The Commission began examining planning and reliability of electricity networks in the
2004-05 Review. The power outages caused by problems with the Casuarina zone
substation in late 2008 highlighted the risks associated with inadequate oversight of the
performance and capacity of the entire power system, including electricity networks.
1.21 PWC is forecasting an increase in average network peak demand of 2.5 per cent a
year across the Territory, with higher network peak demand growth forecast in areas
such as the Darwin central business district, Palmerston and East Arm peninsula.
1.22 PWC provided the Commission with capacity, forecast peak demand and reserve
margin data for substations in the Darwin-Katherine, Tennant Creek and Alice Springs
systems. The Commission has not independently tested the network peak demand
forecasts provided by PWC, and has not assessed the capacity of network assets
relative to forecast network peak demand. In particular, the Commission does not have
sufficient data on the condition of network assets, and the associated capability of
these assets to meet demand and maintain security of supply to provide a full
assessment.
1.23 PWC advised the Commission that about $287 million is to be spent between 2009-10
and 2013-14 augmenting and maintaining existing network assets, and constructing
new network assets.
1.24 The Commission is aware that PWC is putting significant effort into improving network
planning and asset management practices. The Commission will also be examining
network planning and reliability during 2010 under a System Planning, Monitoring and
Reporting review in response to terms of reference from the Treasurer. The
Commission expects to provide more comprehensive assessment of these matters in
future Reviews.

4
2008-09 Power System Review March 2010
Adequacy of fuel supplies
1.25 Natural gas is the primary fuel for electricity generation in the Darwin-Katherine,
Tennant Creek and Alice Springs systems.
1.26 The primary gas supply for electricity generation was in transition during 2008-09, from
the Amadeus basin fields in central Australia to the Eni Blacktip field in the Bonaparte
Gulf.
1.27 Supply of gas from the Blacktip field was delayed beyond the contract date of
1 January 2009 due to difficulties experienced by Eni sourcing components on time,
and extreme weather conditions. Blacktip gas was used for electricity generation from
October 2009, although this gas was not processed to the required specification. The
Commission understands that full specification gas was supplied from mid January
2010 at volumes sufficient to meet requirements for electricity generation.
1.28 PWC was able to mitigate the risk of a potential shortfall in fuel for electricity generation
during 2008-09 due to the delay in availability of Blacktip gas by using about
1.1 petajoules of liquid fuels. In the second half of 2009 PWC purchased gas from the
DLNG plant. The Commission expects that the use of liquid fuels will reduce
significantly from the second half of 2009-10 as Blacktip gas takes over as the main
fuel source.
1.29 The supply of gas into generation facilities has been very reliable, with only four
occasions since 1987 when gas has not been supplied to a power station in the
Darwin-Katherine system in May 1999, December 2004 and in November and
December 2009.
1.30 The Commission understands that the gas supply-demand balance in the period to
2010-11 to 2018-09 is adequate, with gas supply contract volumes from the Amadeus
Basin fields, Blacktip and from the DLNG plant able to supply sufficient fuel to meet
forecast electricity generation requirements without resorting to obtaining additional
gas or using liquid fuels.
System performance – generation and networks
1.31 The Electricity Standards of Service Code requires PWC to report on performance
against defined reliability indicators for electricity generation and networks.
Duration of power outages
1.32 The average duration of generation and network related power outages in the
Katherine, Tennant Creek and Alice Springs regions in 2008-09 was better than the
combined standard for generation and network outages. However, the average
duration of power outages in the Darwin region, where the majority of electricity
customers in the four regions reside, was worse than the combined standard for
generation and network outages.
1.33 The Commission notes that the Electricity Standards of Service Code allows network
related performance indicators to be adjusted to exclude major event days. The three
major event days recorded in 2008-09 were:
• Darwin on 2 October 2008 following a failure at the Casuarina zone substation. SAIDI was adjusted downwards by 75 minutes;

5
2008-09 Power System Review March 2010
• Katherine region on 12 May 2009 due to an outage caused by a flashover on the 22 kV distribution board. This affected about 1 400 customers for 125 minutes, and SAIDI was adjusted by 53 minutes; and
• Alice Springs on 22 September 2008 when strong wind and flying debris caused by a severe storm caused power outages on a number of feeders. SAIDI was adjusted downwards by 439 minutes.
1.34 Electricity customers in the Darwin region experienced an average of 344.4 minutes off
supply in 2008-09 from generation and networks outages, compared to the combined
standard of 262.7 minutes, due to an (adjusted) average loss of supply of 311 minutes,
91 minutes more than the standard of 220 minutes off supply from network related
outages.
1.35 The (adjusted) average minutes off supply from network related power outages in the
Alice Springs region was 154 minutes, compared to the standard of 108 minutes.
However, the overall average duration of power outages was 157.6 minutes, below the
combined standard of 230.5 minutes.
1.36 More detail on the average duration of generation and network related power outages
for 2008-09, is provided in table 1.1.
Table 1.1: Average minutes off supply (SAIDI), generation, network (adjusted) and combined results,
2008-09
Region Generation
Result
Generation
Standard
Network
Result
Network
Standard
Combined
Result
Combined
Standard
Darwin 33.4 42.7 311 220 344.4 262.7
Katherine 24.1 25.7 182 401 206.1 426.7
Tennant Creek 49.6 125 245 411 294.6 536
Alice Springs 3.6 122.5 154 108 157.6 230.5
Frequency of power outages
1.37 The average frequency of generation and network related power outages in 2008-09
was better than the combined standard for frequency of generation and network
outages for the Katherine, Tennant Creek and Alice Springs regions, but worse than
the standard for the Darwin region.
1.38 The average frequency of network related outages is also adjusted to exclude major
event days. Network SAIFI was adjusted downwards by 0.1 interruptions for Darwin,
0.5 interruptions for Katherine and 0.6 interruptions for Alice Springs.
1.39 The increased frequency of network related power outages in the Darwin region is
attributed by PWC to the problems with the Casuarina zone substation in late 2008,
and outages associated with the subsequent repairs and maintenance, with customers
experiencing an adjusted average of 6.1 network related outages, compared to the
standard of 4.2 outages. Overall, customers in the Darwin region experienced an
average of 9.1 generation and network outages in 2008-09, compared to the combined
standard of 8.1 outages.
1.40 More detail on the average frequency of generation and network related power outages
for 2008-09 is provided in table 1.2.

6
2008-09 Power System Review March 2010
Table 1.2: Average number of interruptions (SAIFI), generation, network (adjusted) and combined results,
2008-09
Region Generation
Result
Generation
Standard
Network
Result
Network
Standard
Combined
Result
Combined
Standard
Darwin 3.0 3.9 6.1 4.2 9.1 8.1
Katherine 1.5 1.1 4.7 9.6 6.2 10.7
Tennant Creek 1.7 12.5 4.2 9.8 5.9 22.3
Alice Springs 0.5 3.6 3.1 2.9 3.6 6.5
Customer service indicators
1.41 The Electricity Standards of Service Code requires PWC to report against defined
customer service indicators for electricity networks and retail.
1.42 Customer service indicators for electricity network and retail service performance
include the time taken to connect a property to the network, the time taken for
telephone calls to be answered by an operator, and the number of customer
complaints (about network and retail services).
1.43 In 2008-09, PWC Networks connected 99.2 per cent of existing properties to the
network within 24 hours, and 91.3 per cent of properties in new subdivisions within
5 working days. This is better than the agreed standard of 98 per cent and 90 per cent,
respectively.
1.44 However, PWC Networks did not meet the standard for connecting properties in new
subdivisions where minor extensions or augmentation is required, with 66.5 per cent of
connections taking more than 10 weeks, compared to the agreed standard of 35 per
cent of connections. PWC attributes this result to the diversion of resources to the
RAMP program.
1.45 PWC reported that 62 per cent of telephone calls were answered by a human operator
within 20 seconds. All calls to PWC concerning electricity are recorded, so this
measure includes retail and network inquiries, e.g. billing or supply problems. The
standard is for 63 per cent of telephone calls to be answered within 20 seconds of a
customer choosing to speak to a person.
1.46 PWC recorded 2 235 complaints from customers in 2008-09 about electricity retail and
network performance. The most common matters for complaint were billing, level of
service and pension concession. The number of complaints as a percentage of
customers in 2008-09 was 3.2 per cent.

7
2008-09 Power System Review March 2010
1.47 More detail on the type of customer complaints received in 2008-09 is provided in
table 1.3.
Table 1.3: Customer complaint types
Complaint type 2008-09
Billing 1 106
Level of service 341
Pension concession 299
High bill 120
Other 369
Total 2 235

8
2008-09 Power System Review March 2010
CHAPTER 2
Introduction
2.1 The Power System Review is an annual report prepared by the Utilities Commission to
advise the Minister, participants in the electricity supply industry and the community on
power system performance and capacity.
2.2 The purpose of the Review is to provide information and analysis on the historical and
forecast power system performance, focusing on the previous financial year, and on
the next 10 years. The Review is prepared in accordance with the Electricity Reform
Act [s45], which requires the Commission to monitor and advise on the Northern
Territory power systems by:
• reporting forecasts of electricity load and generating capacity;
• reviewing and reporting on the performance of the Territory’s power systems;
• advising on matters relating to the future capacity and reliability of the Territory’s power systems relative to forecast load;
• advising on other electricity supply industry and market policy matters; and
• reviewing the prospective trends in the capacity and reliability of the Territory’s power systems relative to projected load growth.
2.3 This 2008-09 Review focuses on system performance in 2008-09, and on forecast
system performance in the period 2009-10 to 2018-19.
2.4 In a change from the approach taken in previous years, the 2008-09 Review also
reports the performance by the Power and Water Corporation (PWC) against electricity
generation, network and customer standards of service indicators specified in the
Electricity Standards of Service Code, and on the technical performance of the
Darwin-Katherine power system for the period January to June 2009.
2.5 The information and analysis in this Review is considered current up to the end of
December 2009, and only relates to the Darwin-Katherine, Alice Springs and Tennant
Creek power systems (referred to as the market systems).1
2.6 The Commission prepares the Review with the assistance and advice of participants in
the electricity supply industry and other electricity industry stakeholders. The
Commission appreciates the effort and input of all those who have contributed to the
Review, but notes that the views expressed in the Review are those of the
Commission, and may not necessarily reflect those of the parties consulted.
1 The activities of electricity industry participants and customers in the market systems are regulated under the
Electricity Reform Act, Electricity Networks (Third Party Access) Act and Code and associated legislation. At
present, only the Darwin-Katherine, Alice Springs and Tennant Creek systems meet this criteria.

9
2008-09 Power System Review March 2010
Overview of 2008-09 Review
Expanded scope of Review
2.7 The Commission has decided to expand the scope of the 2008-09 Review to
consolidate the system performance data available to the Commission in a single
document.
2.8 Previous Reviews have reported on forecasts of electricity demand, the adequacy of
generation capacity and gas supplies, system planning arrangements and network
reliability. However, the Commission has also separately collected and reported
information on system capacity and performance in the:
• Northern Territory Electricity Market Information statement, an annual report on electricity usage, generation capacity and network length. This information is provided as part of annual licence returns by licensed participants retailers, and is published by the Commission to provide key statistics for the electricity supply industry; and
• Standards of Service Performance report, an annual report on the standard of electricity generation, network and retail service performance. The Electricity Standards of Service Code requires PWC to report annual performance against specified standards of service indicators.
2.9 Additionally, the Commission intends reporting system performance data provided
biannually by the System Controller from January 2010.2 The System Control
Technical Code [s7.4] requires the System Controller to report to the Commission on
the performance and major incidents of the power system on or before 31 January and
31 July each year.
2.10 Regular and comprehensive public reporting on power system performance is a feature
of the electricity supply industry elsewhere in Australia. The Australian Energy
Regulator (AER) publishes an annual State of the Energy Market report to provide a
high level overview of energy market activity in Australia, and supplement the AER’s
extensive technical reporting on the energy sector. The Australian Energy Market
Operator (AEMO) publishes detailed reports on the operation of energy markets,
notably the National Transmission Statement and Electricity Statement of
Opportunities.
2.11 The Commission considers that collating and analysing all data relevant to system
capacity and performance in a single document will assist participants in the electricity
supply industry, and the community, make an informed view about the performance
and prospective trends for the Territory’s power systems. The expanded scope of the
Review should make system reporting in the Territory more consistent with practice
elsewhere in Australia.
2 The Electricity Reform Act [s38] gives the System Controller the functions of monitoring and controlling the
operation of the power system to ensure the system operates reliably, safely and securely in accordance with the System Control Technical Code. The System Control function is currently held by the PWC System Control unit, according to the System Control licence granted by the Commission.

10
2008-09 Power System Review March 2010
2.12 The expanded scope of the Power System Review is an evolving project, and the
Commission expects that future reviews will provide more detailed data and analysis
on power system performance and capacity. The Commission welcomes feedback on
the 2008-09 Review so that the scope and content of future Reviews provide an
accurate and relevant source of information on system performance and capacity to
the Minister, participants in the electricity supply industry and the community.
Electricity Standards of Service Code
2.13 The Electricity Standards of Service Code requires PWC to report annually to the
Commission on performance against defined standards for electricity generation,
networks and customer service.3
2.14 The Code establishes 47 indicators, and defines a standard of performance for 46 of
these indicators. The current standards specified in the Code apply until 30 June 2011,
at which time they may be revised by the Commission. The Commission notes that
electricity standards of service are to be considered through a Review of Electricity
Standards of Service to be conducted during 2010 by the Commission under terms of
reference approved by the Treasurer.
2.15 The Commission has previously released PWC’s annual report on standards of
service, and a brief overview of the report.4 The Commission considers the standards
of service indicators are relevant to the capacity and reliability of the power systems,
and there is merit in their being reported along with other system performance data.
Half year Power system performance reports
2.16 PWC System Control is required to provide the Commission with half yearly reports
setting out the performance and major incidents of the Darwin-Katherine, Alice Springs
and Tennant Creek power systems. The half yearly reports are to include information
on system security problems and relevant technical or operational details.
2.17 The Commission received the half yearly report for the Darwin-Katherine system for
January to June 2009 in July 2009, and expects to receive further half yearly reports by
31 January and 31 July each year for the Darwin-Katherine, Alice Springs and Tennant
Creek systems. The Commission intends reporting data contained in the half yearly
reports on a regular basis, and providing more comprehensive analysis of the
performance data in future Reviews.
Structure of Review
2.18 The 2008-09 Review is structured as follows:
• Chapter 1 provides an overview of the findings in the 2008-09 Review;
• Chapter 2 is the introduction;
3 Utilities Commission website, www.utilicom.nt.gov.au, Electricity Standards of Service Code.
4 Utilities Commission website, www.utilicom.nt.gov.au, 2007-08 Standards of Service Report.

11
2008-09 Power System Review March 2010
• Chapter 3 provides an overview of the Darwin-Katherine, Alice Springs and Tennant Creek systems, significant power system events and some key performance and forecast data;
• Chapter 4 provides performance and capacity data, and forecasts of demand and capacity for the electricity generation sector, and an assessment of the adequacy of the supply of fuel for electricity generation;
• Chapter 5 provides performance and forecast data for the electricity network sector, and analysis of network planning and reliability; and
• Chapter 6 provides performance against customer service indicators specified in the Electricity Standards of Service Code for PWC Retail and PWC Networks.
12
2008-09 Power System Review March 2010
CHAPTER 3
Power System Overview
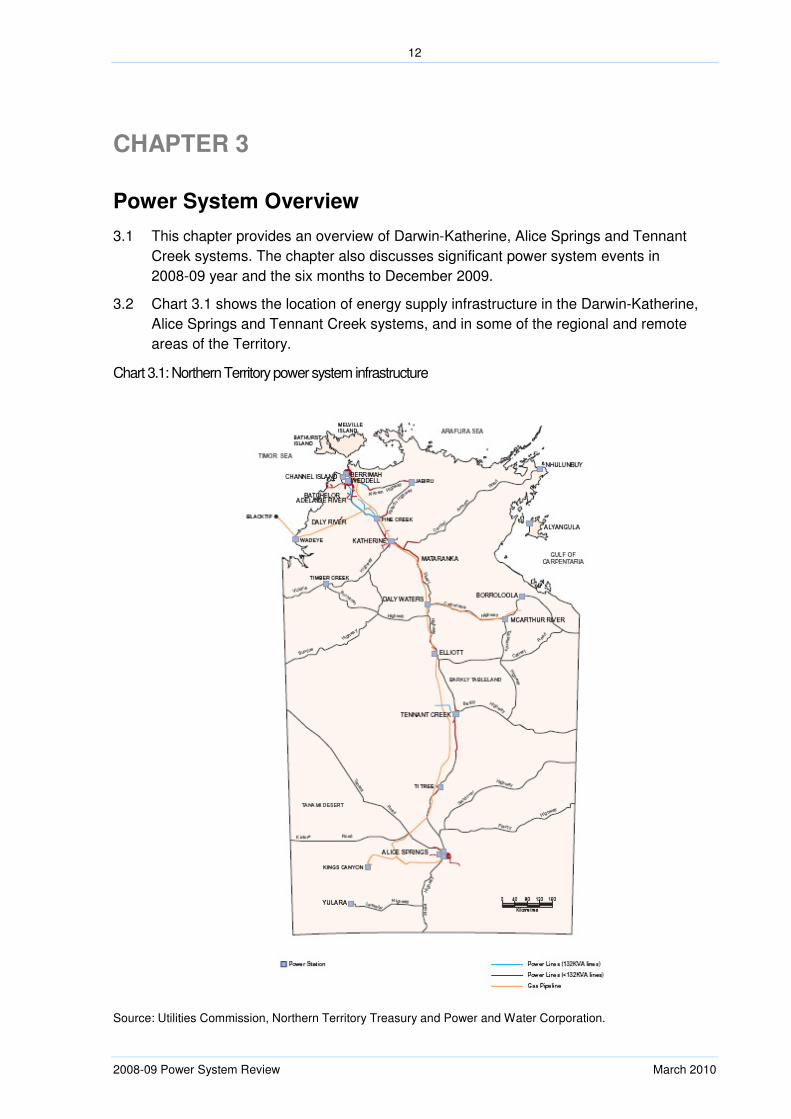
3.1 This chapter provides an overview of Darwin-Katherine, Alice Springs and Tennant
Creek systems. The chapter also discusses significant power system events in
2008-09 year and the six months to December 2009.
3.2 Chart 3.1 shows the location of energy supply infrastructure in the Darwin-Katherine,
Alice Springs and Tennant Creek systems, and in some of the regional and remote
areas of the Territory.
Chart 3.1: Northern Territory power system infrastructure
Source: Utilities Commission, Northern Territory Treasury and Power and Water Corporation.

13
2008-09 Power System Review March 2010
Power system information
3.3 Table 3.1 provides an overview of the Darwin-Katherine, Alice Springs and Tennant
Creek systems for 2008-09.
Table 3.1: Power system data for 2008-09 (at 30 June 2009)
Darwin-Katherine Alice Springs Tennant Creek
Connections (customer numbers) 58 319 12 109 1 709
Generation (rated) capacity ( megawatts) 370 63 17
Peak demand (megawatts) 267 54.4 7.3
Electricity sent out (gigawatt hours for
2008-09) 1 341 216 26
Network line length (kilometres) 4 773 603 373
Licencees
Generation
PWC Generation
NGD (NT) P/L
Cosmo Power P/L
LMS Generation P/L
PWC Generation
Central Energy Power PWC Generation
Network PWC Network PWC Network PWC Network
Retail PWC Retail PWC Retail PWC Retail
Source: Electricity industry participants; and Utilities Commission licence register. The table only relates to the market systems.
3.4 PWC is the primary industry participant in the market systems, generating the majority
of electricity, operating the network and supplying retail services to all customers.
3.5 PWC is a vertically integrated electricity supplier which also provides water supply and
sewerage services. PWC’s generation, network and retail units operate as separate
businesses with internal transactions between units subject to oversight and regulation
by the Commission. PWC is owned by the Territory Government and is also subject to
oversight by a shareholding Minister under the Government Owned Corporations Act.
3.6 The other industry participants are the three licensees generating electricity in the
Darwin-Katherine system, and a further licensee generating electricity in the Alice
Springs system. These four licensees have historically generated electricity under
power purchase agreements with PWC. This remained the case in 2008-09. However,
the Commission understands that the agreement with Cosmo Power Pty Ltd ended in
2008-09, but that the 7.5 MW of capacity remains available to supply electricity into the
Darwin-Katherine system, at this time.
3.7 Additional information on these four licensees is provided in Chapter Four.

14
2008-09 Power System Review March 2010
Significant power system events
3.8 The Commission identified the following events that occurred during 2008-09 and in
the period to December 2009 that influenced power system performance:
• Casuarina zone substation failures in September and October 2008;
• announcement of a Remedial Asset Management Program (RAMP) by PWC Networks in early 2009;
• availability of new capacity in the Darwin-Katherine system from Weddell power station stage two in early 2009 and the start of construction of Owen Springs power station in the Alice Springs system; and
• energy infrastructure projects that diversified the sources of fuel for electricity generation in the market systems.
Casuarina zone substation failures
3.9 The northern suburbs of Darwin experienced six power outages in September and
October 2008 following equipment failures in and around Casuarina zone substation.
About 15 000 customers were affected, many more than once, with the most significant
outage causing more than 11 000 customers to lose power for up to 14 hours.
3.10 In response to the community disruption and concern about the performance of PWC’s
electricity network assets, the Territory Government commissioned Mervyn Davies, a
former senior executive of Energy Australia and a member of the Board of Western
Power, to undertake the Independent Enquiry into Casuarina Substation Events and
Substation Maintenance Across Darwin (the Davies Enquiry). A Preliminary Report
was released in November 2008, and the Final Report in February 2009.5
3.11 The Davies Enquiry found serious deficiencies in PWC’s procedures for monitoring and
reporting the condition of assets, and maintenance practices were assessed as below
the standard for good industry practice. The Davies Enquiry made 11 major
recommendations about PWC’s electricity networks and assets, focusing on
maintenance effectiveness, asset management, leadership and supervision and
personnel development.6
Remedial asset management program
3.12 The Territory Government and PWC accepted all the recommendations of the Davies
Enquiry. PWC’s immediate response was to establish the RAMP to ensure safe access
to substations, carry out remedial works and replace the failed equipment at the
Casuarina zone substation. PWC also continued efforts to improve asset management
systems and capability, and initiated a long term action plan to improve PWC’s
maintenance and asset management operations for the long term.
3.13 RAMP involves a significant investment by PWC in maintenance and remediation of
network assets to meet acceptable standards of reliability and safety. The investment
5 Refer Power and Water Corporation website, www.powerwater.com.au for these reports.
6 Refer statement from Minister for Essential Services on 5 February 2009: Announcement of Release of Davies
Enquiry Final Report.

15
2008-09 Power System Review March 2010
is additional to the capital expenditure program of over $1 billion announced by PWC in
2007-08 to augment and upgrade electricity, water and sewerage assets.
Weddell power station and Owen Springs power station
3.14 The Weddell power station stage one was completed in February 2008 with the
commissioning of a GE LM6000 PD gas fuelled combustion turbine. Weddell power
station stage two was completed in November 2008 with the commissioning of a
second GE LM6000 PD gas fuelled combustion turbine. PWC advised the Commission
in November 2009 that the sustainable installed capacity of these two sets is 86 MW,
representing about 17.7 per cent of capacity in the Darwin-Katherine system. The
Weddell power station is the largest electricity generation project undertaken in the
market systems in 20 years and is intended to meet increasing base load and peak
demand in the Darwin-Katherine system.
3.15 The Commission notes that both Weddell sets appear to have experienced initial
operating problems that led to a number of unplanned shutdowns in 2009. The effect of
this on overall system reliability appears to have been exacerbated by the unplanned
shutdown of generation sets at the Channel Island power station in the same period.
3.16 The Owen Springs power station was under construction in 2008-09. The power station
is intended to meet increasing peak demand and will eventually replace the ageing
Ron Goodin power station as the major power station in the Alice Springs system.
Following complaints from nearby residents of excessive noise, PWC announced that it
would relocate two new sets from the Ron Goodin power station to Owen Springs
power station.
New sources of fuel for electricity generation
3.17 Natural gas from the Amadeus Basin gas fields in central Australia has been the
primary fuel for electricity generation in the Darwin-Katherine, Alice Springs and
Tennant Creek systems since the mid-1980’s. However, the production of gas from
these fields has been declining since the late 1990’s, and alternative fuel sources are
required to meet electricity demand.
3.18 In June 2006, Eni Australia B.V. (Eni) agreed to supply PWC with 740 petajoules (PJ)
of gas over 25 years from the Blacktip field in the Bonaparte Gulf. Under this
agreement, gas from the Blacktip field was to replace gas from the Amadeus Basin
fields as the primary fuel for electricity generation in the Territory’s power systems from
1 January 2009. However, supply was delayed until late 2009, with delays being mainly
attributed by Eni to difficulties sourcing components on time and extreme weather
conditions. The Commission understands that full specification gas was supplied in
sufficient volumes to meet PWC’s from mid January 2010.
3.19 PWC was able to reduce the risk of a potential shortfall in gas for electricity generation
caused by the delay in availability of Blacktip gas by purchasing gas from the Darwin
liquefied natural gas (DLNG) plant. This gas was available from July 2009 after
construction of a pipeline connecting the DLNG plant to the Darwin city gate gas hub.
In addition, PWC reached agreements with Eni and the pipeline companies involved in
transporting gas from the Eni gas processing plant at Wadeye to PWC’s power stations
to allow some Blacktip gas to be used from October 2009, despite the gas not being
fully processed to specifications agreed by PWC and Eni. This reduced PWC’s
requirement for more costly diesel fuel.
16
2008-09 Power System Review March 2010
3.20 During 2008-09, PWC used about 1.1 petajoules of diesel to augment constricted gas
supplies, with diesel accounting for about 5.4 per cent of total fuel used for electricity
generation. The balance of the fuel requirement was met by gas from the Amadeus
basin fields. The use of diesel enabled PWC to generate sufficient power to meet
demand, but at a significantly higher cost.
3.21 The Commission considers that the projects completed or commenced in 2008-09 will
significantly improve security of fuel supply across the Territory by increasing the
number of fuel sources. From the December quarter 2009, fuel for electricity
generation was available, in varying quantities and quality, from the previous sources
of the Amadeus Basin fields and liquid fuels, and the new sources of the Blacktip field
and the DLNG plant.

17
2008-09 Power System Review March 2010
CHAPTER 4
Electricity Generation
4.1 This chapter examines the capacity and performance of electricity generation in the
Darwin-Katherine, Alice Springs and Tennant Creek systems.
4.2 In addition to the historical and forecast electricity supply-demand data included in
previous Reviews to meet the requirements of the Electricity Reform Act, this chapter
also reports electricity generation performance data submitted by PWC under the
Standards of Service Code. This chapter is structured as follows:
• historical electricity usage, demand and generation capacity (supply);
• forecast supply-demand balance for 2009-10 to 2018-19;
• generation standards of service performance data; and
• adequacy of the supply of fuel for electricity generation.
Historical electricity usage
4.3 The Commission is using electricity sent out to represent electricity usage in the market
systems.7 Chart 4.1 provides monthly electricity usage in the Darwin-Katherine, Alice
Springs and Tennant Creek systems between July 1999 and June 2009.
4.4 The chart shows the relative size of the Darwin-Katherine, Alice Springs and Tennant
Creek systems. The Darwin-Katherine system accounted for 84.7 per cent of total
electricity usage in the market systems in 2008-09, with the Alice Springs and Tennant
Creek systems accounting for 13.6 per cent and 1.7 per cent respectively.
7 Electricity sent out is defined as electricity generated, less electricity used in the power station. Electricity
demand can also be measured as electricity generated (by the generating sets) and electricity used (by the customer), which is electricity sent out, less system losses.

18
2008-09 Power System Review March 2010
Chart 4.1: Electricity sent out from July 1999 to June 2009 (monthly)
Source: Electricity industry participants. A linear trend line is overlaid on the data to better show the change in consumption over time.
4.5 Electricity use in 2008-09 in the Darwin-Katherine system increased by 3.0 per cent
from 2007-08. Average electricity use has increased by 2.0 per cent per year since
1999-00, and by 4.2 per cent per year since 2006-07. The highest recorded total
monthly use in the Darwin-Katherine system since June 1999 was 139 485 megawatt
hours (MWh) in October 2008. Notably, total monthly use has not fallen below
100 000 MWh since August 2007.
4.6 Electricity use in the Alice Springs system in 2008-09 increased by 1.8 per cent from
2007-08. Average electricity use has increased by 1.2 per cent per year in the Alice
Springs system since 1999-00, but has declined by an average 0.9 per cent per year
since 2006-07.
4.7 Although not obvious in Chart 4.1 due to the chart scale, electricity use in the Tennant
Creek system has varied significantly since 1999-00. Electricity use increased by
0.8 per cent in 2008-09 from the previous year, going against the average annual
decline of 0.2 per cent per year since 2001-02. Electricity use has been increasing
since 2007-08.
4.8 Electricity use in the market systems in 2008-09 was 21.7 per cent higher than in
1999-00, with electricity use 24.2 per cent higher in the Darwin-Katherine system, and
11.7 per cent higher in the Alice Springs system. Electricity use in the Tennant Creek
system was 1.3 per cent lower.
4.9 The increase in use in the past 10 years is attributed to rapid population and economic
growth in the Territory, and particularly the high levels of resource, engineering and
0
20,000
40,000
60,000
80,000
100,000
120,000
140,000
MWh
Darwin-Katherine
Alice Springs
Tennant Creek

19
2008-09 Power System Review March 2010
construction activity in the Darwin region. For example, the population of the greater
Darwin and Katherine regions increased by about 12.7 per cent between 2001 and
2008, from 115 803 to 130 564.8 The Commission recognises that increased system
losses may occur as a result of the growth in electricity use, this will be investigated
and reported in future Reviews.
4.10 Electricity use in the Tennant Creek system is likely to be closely linked to global
commodity prices and the associated fortune of a number of small mines around the
town. Population growth has been about 16.3 per cent between 2001 and 2008, but
this is from a small base of 3 002 to 3 494. However, stop start industrial and mining
activity in the region has kept average electricity use at a relatively constant level.
Residential and business usage
4.11 Average residential electricity use for each jurisdiction is compared in Chart 4.2 below.
The national average residential electricity use is 7 159 kilowatt hours (KWh) per
annum. Residential electricity customers in Tasmania have the highest average use of
jurisdictions, with 9 059 KWh per annum, while the average use of 8 859 KWh per
annum in the Territory is the second highest.
4.12 The high use in the Territory can probably be attributed to the use of air-conditioning.
For example, Darwin has the highest penetration of air-conditioner usage in Australia
of Australian capital cities, estimated at 92 per cent in 2005.9
4.13 Average residential electricity use for Australian jurisdictions is compared in Chart 4.2.
8 Northern Territory Treasury, 2009-10 Budget, Northern Territory Economy, page 31; and Australian Bureau of
Statistics (ABS) Catalogue 3218.0.
9 Ministerial Council on Energy, Cost Benefit Analysis of Smart Metering and Direct Load Control, page 125.

20
2008-09 Power System Review March 2010
Chart 4.2: Average residential electricity use for 2007-08
Source: ESAA, Electricity Gas Australia 2009, page 27, tables 3.2 and 3.3. The most recent comprehensive data set available is for 2007-08.
4.14 Average residential and business electricity use for Australian jurisdictions is compared
in Chart 4.3 below.
Chart 4.3: Average residential and business electricity use for 2007-08
Source: ESAA, Electricity Gas Australia 2009, page 27, tables 3.2 and 3.3. The most recent comprehensive data set available is for 2007-08.
7226
5624
7210
62125922
90598859
0
1000
2000
3000
4000
5000
6000
7000
8000
9000
10000
ACT&NSW VIC QLD SA WA TAS NT
KWh
7226 5624 7210 6212 59229059 8859
125567
100700
150626
83575
74920
191723
100430
0
25000
50000
75000
100000
125000
150000
175000
200000
ACT&NSW VIC QLD SA WA TAS NT
Kwh
Business customers
Residential customers

21
2008-09 Power System Review March 2010
4.15 Business electricity use comprises over 60 per cent of total residential and business
use in each jurisdiction. More recent data for 2008-09 is available for the Territory, with
business accounting for about 64 per cent of electricity use in 2008-09.
4.16 Average electricity use by businesses is likely to be affected by the range of usage
profiles, from very large industrial users to small shops. However, Chart 4.3 does
highlight the relative significance of residential and business electricity use across
jurisdictions.
Historical electricity demand
4.17 The maximum monthly peak electricity demand in the Darwin-Katherine and Alice
Springs systems for July 2006 to June 2009 is shown in Chart 4.4 below.
Chart 4.4: Electricity maximum monthly peak demand for Darwin-Katherine and Alice Springs systems for
2006-07 to 2008-09
Source: Electricity industry participants. A linear trend line is overlaid on the data to better show the change in maximum monthly demand over time.
4.18 Generation peak demand in the Darwin-Katherine system increased by 2.4 per cent
between 2007-08 and 2008-09. Peak demand has increased by 22.5 per cent between
1999-00 and 2008-09, at an average of 2.1 per cent per year.
4.19 The increase in peak demand in the Alice Springs system between 2007-08 and
2008-09 was about 0.1 per cent. The average annual rate of peak demand growth
between 2001-02 and 2008-09 is about 2.7 per cent.
4.20 Peak demand increased by 5.7 per cent in the Tennant Creek system between
2007-08 and 2008-09. The average annual rate of peak demand growth between
2001-02 and 2008-09 is 2.5 per cent.
0
50
100
150
200
250
300
MW
Darwin-Katherine
Alice Springs

22
2008-09 Power System Review March 2010
Seasonal variation in peak demand
4.21 The Darwin-Katherine and Alice Springs systems experience a significant seasonal
variation in peak demand. Chart 4.5 highlights the significant rise and fall in electricity
demand in the Darwin-Katherine system between the wet and dry seasons for
2008-09. The average percentage seasonal change over 2006-07 to 2008-09 is
24.5 per cent.10 The Alice Springs system also experiences large variation in seasonal
electricity demand, with the average percentage change in the same period being
27.6 per cent.
4.22 Chart 4.5 also illustrates the relationship between apparent temperature for Darwin and
daily peak electricity demand in the Darwin-Katherine system for 2008-09.11 Average
apparent temperature is preferred over the recorded daily temperature because this
takes into account the similar (if not greater) debilitating effect on a persons comfort of
the high humidity experienced in Darwin in the wet season compared to the often
higher summer time maximum daily temperatures in other capital cities in Australia.
Chart 4.5: Daily peak demand and apparent maximum temperature for Darwin in 2008-09
Source: Electricity industry participants and Bureau of Meteorology. Note: a trend line has been applied to the apparent maximum temperature and maximum daily demand data to smooth out the daily variation.
4.23 Bureau of Meteorology records indicate that Darwin has the highest minimum and
lowest maximum temperatures of all Australian capital cities. The relatively high and
relatively constant temperatures (typical of the sub-tropical monsoonal climate)
influence household electricity use, in particular through high use of air-conditioning.
10
Calculated as the average percentage change between July (“the dry”) and January (“the wet”) of the relevant years.
11 The apparent temperature is calculated by comparing the mean daily maximum temperature and the mean 3pm
relative humidity (Steadman Apparent Temperature Index). Refer Bureau of Meteorology website, www.bom.gov.au for methodology.
0
5
10
15
20
25
30
35
40
45
50
0
50
100
150
200
250
300
0CMW
Maximum daily demand
Apparent maximum temperature

23
2008-09 Power System Review March 2010
Generation capacity
4.24 Electricity supplied in the Darwin-Katherine, Alice Springs and Tennant Creek systems
is generated by PWC Generation and four other licensed generation suppliers with
agreements to supply PWC. Chart 4.6 shows the percentage of total registered
generation capacity at each power station operating in the Territory electricity market.
Chart 4.6: Power station capacity as percentage of registered capacity (MW), at 30 June 2009
Source: Utilities Commission licence register and electricity supply industry participants. Note: chart reports capacity data for regulated systems only.
4.25 About 82 per cent of total generation capacity in the market systems is located in the
Darwin-Katherine system, with about 48 per cent at the Channel Island power station.
The next most significant power station in the market systems is the Weddell power
station (also in the Darwin-Katherine system), with almost 18 per cent of capacity.
About 15 per cent of total generation capacity is located in the Alice Springs system
and 3 per cent in the Tennant Creek system.
4.26 More detail for each power station is given in table 4.1 below.
Channel Island
47.9%
Weddell
17.7%
Berrimah
6.2%
Katherine
4.4%
Pine Creek
5.5%
LMS Shoal Bay
0.2%
Tennant Creek
3.4%
Ron Goodin
12.9%
Brewer
1.8%

24
2008-09 Power System Review March 2010
Table 4.1: Power stations in the market systems at 30 June 2009
Region and power station Operator Capacity (MW) Fuel
Darwin Katherine
Channel Island PWC 232 Natural gas or liquid fuel
Weddell PWC 86 Natural gas or liquid fuel
Berrimah PWC 30 Natural gas or liquid fuel
Katherine PWC 21 Natural gas or liquid fuel
Pine Creek NGD(NT)
Cosmo Power 35 Natural gas or liquid fuel
LMS Shoal Bay LMS Generation 1 Waste Methanisation
Total 405
Alice Springs
Ron Goodin PWC 63 Natural gas or liquid fuel
Brewer Central Energy Power 9 Natural gas or liquid fuel
Total 72
Tennant Creek
Tennant Creek PWC 17 Natural gas or liquid fuel
Total Capacity 494
Source: Electricity industry participants. Note: Capacity figures include currently non-contracted capacity available from Cosmo Power Pty Ltd. Figures have been rounded upwards to the nearest whole number.
4.27 The sustainable installed capacity of the Channel Island power station, as reported by
PWC to the Commission in November 2009 is 232 MW, comprising five GE Frame 6
gas or diesel fuelled combustion turbines (sets 1-5) with a capacity of 31.6 MW each,
one GE LM6000 PC gas fuelled combustion turbine (set 7) with a capacity of 42 MW,
and one Mitsubishi steam turbine (set 6) with a capacity of 32 MW. The steam turbine
uses waste heat from two of the GE Frame 6 turbines (sets 4 and 5).
4.28 Each of the sets at Channel Island represents at least 7 per cent of capacity in the
Darwin-Katherine system. However, two of the GE Frame 6 turbines (sets 4 and 5) and
the steam turbine (set 6) can operate as a 95 MW block, representing about
23 per cent of capacity in the system. A shutdown of set 4 or 5 apparently reduces the
capacity of the block to about 45 MW, as the remaining combustion turbine producing
only enough heat for the steam turbine to generate about 15 MW.
4.29 The Commission understands that set 5 has been shut down for much of 2009 for
maintenance, reducing total system capacity by about 45 MW, or 11 per cent, and
effectively taking the equivalent of the largest unit of capacity out of service.
4.30 PWC reports that the Weddell power station has a sustainable installed capacity of
86 MW, comprising two GE LM6000 PD gas fuelled combustion turbines of 42 MW
(set 1) and 44 MW (set 2). These sets are the largest individual units of capacity in the
system, with each representing about 10 per cent of total capacity in the

25
2008-09 Power System Review March 2010
Darwin-Katherine system. In this context, the loss of just one set has significant
implications for system security and reliability.
4.31 PWC has power purchase agreements with NGN (NT) Pty Ltd, Cosmo Power Pty Ltd
(subsidiaries of Energy Developments Ltd), Central Energy Power Pty Ltd and LMS
Generation Pty Ltd. These four firms currently operate generation equipment with
capacity of about 44 MW, or potentially about 9 per cent of total generation capacity of
the market systems. The Commission understands that not all this capacity is currently
in use, with the contract with Cosmo Power Pty Ltd ending in 2008-09 reducing the
notional generation capacity by 7.5 MW. However, the Commission understands that
PWC has the ability to use this capacity, at this time.
4.32 PWC supplies the natural gas used by the first three firms listed as fuel for electricity
generation, and takes all their production, subject to the terms of power purchase
agreements. LMS Generation uses methane released at the Darwin City Council Shoal
Bay rubbish dump as a fuel for electricity generation.
4.33 The Ron Goodin power station in Alice Springs had a sustainable installed capacity of
63 MW as at 30 June 2009, comprising three reciprocating diesel engines (sets 1, 2
and J) with a combined capacity of 4 MW, six reciprocating dual fuel (gas and diesel)
engines (sets 3-8) with a combined capacity of 29 MW, four combustion turbines (sets
9, 10, F and G) with a combined capacity of 26 MW and a 4 MW Taurus combustion
turbine, which PWC advises has since been relocated to the Owen Springs power
station.
4.34 The sustainable installed capacity of the Tennant Creek power station is 17 MW which
comprises seven reciprocating diesel engines (sets 1-5, 16 and 17) with a combined
capacity of 8 MW, five reciprocating spark fired gas engines (sets 10-14) with a
combined capacity of 5 MW and a dual fuel (gas and diesel) combustion turbine (set
15) with a capacity of 4 MW.
Changes to capacity in 2008-09
4.35 Based on advice from PWC in November 2009, the most significant change to
generation capacity in the market systems in 2008-09 was the commissioning of the
44 MW GE LM6000 PD turbine (set 2) at the Weddell power station in November 2008.
4.36 The Weddell power station is the largest electricity generation project undertaken by
PWC in 20 years and is intended to meet increasing base load and peak demand in
the Darwin-Katherine system. The Commission has been advised of plans by PWC for
further expansion of the station, with the addition of a further generation set in the short
to medium term. The Commission has been advised that PWC has started
procurement of equipment and other requirements for this expansion, with completion
expected in 2011.
4.37 Other changes to capacity in the Darwin-Katherine system in 2008-09 compared to
2007-08 were:
• the capacity of the Channel Island power station was increased by 6 MW to 232 MW after PWC exchanged the engine on the GE LM6000 PC (set 7);
• PWC did not de-commission the 15 MW set 1 at Berrimah power station in 2008-09 as was foreshadowed in the 2007-08 Review. PWC advised in November 2009 that this set will be de-commissioned in 2009-10; and

26
2008-09 Power System Review March 2010
• the power purchase agreement with Energy Developments Pty Ltd for electricity from Pine Creek B power station (operated by Cosmo Power Pty Ltd) ended in 2008-09, removing a notional 7.5 MW from the Darwin-Katherine system. This capacity can be made available for system use when required. The Commission understands that PWC agreed to a short term supply arrangement with Energy Developments for December 2009.
4.38 In the Alice Springs system, the Owen Springs power station (to be owned and
operated by PWC) was under construction in 2008-09. The station is intended to meet
increasing peak demand and will eventually replace the ageing Ron Goodin power
station as the major power station in the Alice Springs system. A 3.9 MW Solar Taurus
60 gas or diesel combustion turbine was relocated from Ron Goodin to Owen Springs
in June 2009. The Commission has been advised that the Owen Springs power station
will be commissioned and operating in 2010-11.
4.39 In the Tennant Creek system, the capacity of the power station increased marginally to
16.7 MW after engine modifications to two of the 11 diesel and gas fuelled
reciprocating diesel/reciprocating spark fired engines at the Tennant Creek power
station.
Baseline capacity projections
4.40 Tables 4.2 to 4.4 outline the proposed changes to capacity the Commission has been
advised by PWC will occur in 2009-10 to 2011-12 in the Darwin-Katherine, Alice
Springs and Tennant Creek systems.
4.41 The baseline capacity projections take into account planned new capacity and
retirements for a system, to project the total capacity, and N-1 and N-2 capacity. N-1
and N-2 are indicators of the available capacity following the loss of the largest and
largest two units of capacity in a system, respectively.
4.42 The Commission cautions that the timing of the retirement and addition of capacity can
vary in response to commercial priorities of electricity industry participants and
changing electricity peak demand forecasts. For example, the Commission notes that
PWC postponed the de-commissioning of 15 MW of capacity at the Berrimah power
station by a year. Other proposed changes to capacity advised to the Commission for
preparation of the 2007-08 Review do not appear to be proceeding as planned (e.g.
the augmentation of Katherine power station planned for 2009-10 appears now
scheduled for 2010-11).12
4.43 Due to the uncertainty about the timing, and also the location and size, of proposed
changes to generation capacity, the Commission has chosen not to list any retirements
or augmentation advised by electricity industry participants after 2011-12 in the
baseline capacity projections.
4.44 Baseline capacity projections for the Darwin-Katherine, Alice Springs and Tennant
Creek systems for 2009-10 to 2011-12 are provided in the tables below.
12
Refer Utilities Commission, 2007-08 Power System Review, March 2009, pages 27-29, tables 5.2, 5.3 and 5.4.

27
2008-09 Power System Review March 2010
Table 4.2: Darwin-Katherine baseline capacity projection (MW), 2009-10 to 2011-12
Financial Year Retirements New Capacity Total Capacity N-1 N-2
2009-10 15 382 334.4 286.8
2010-11 12.1 394.1 346.5 298.9
2011-12 15 30 409.1 361.5 313.9
Source: Electricity industry participants.
4.45 The capacity projection for the Darwin-Katherine system for 2009-10 to 2011-12 takes
into account advice to the Commission from PWC in November 2009 that capacity will
be added at the Katherine and Weddell power stations in 2010-11 and 2011-12,
respectively, and that the two units at Berrimah power station will be retired from
service by 2011-12. There is a net increase of 27.1 MW between 2010-11 and
2011-12.
Table 4.3: Alice Springs baseline capacity projection (MW), 2009-10 to 2011-12
Financial Year Retirements New Capacity Total Capacity N-1 N-2
2009-10 71 59.3 49.2
2010-11 14 32.1 89 77.3 66.6
2011-12 89 77.3 66.6
Source: Electricity industry participants.
4.46 The capacity projection for the Alice Springs system takes into account advice to the
Commission from PWC that 32.1 MW will be added with the commissioning of the
Owen Springs power station in 2010-11, and that 14 MW at the Ron Goodin power
station will be relocated or retired in the same year. There is a net increase of 18 MW
by the end of 2010-11. The Commission is advised that a 10 MW turbine from Ron
Goodin is to be relocated to the Katherine power station in 2010-11.
Table 4.4: Tennant Creek baseline capacity projection (MW), 2009-10 to 2011-12
Financial Year Retirements New Capacity Total Capacity N-1 N-2
2009-10 16.7 12.8 11.3
2010-11 16.7 12.8 11.3
2011-12 16.7 12.8 11.3
Source: Electricity industry participants.
4.47 PWC has advised the Commission that there are no changes to capacity in the
Tennant Creek system planned for the period 2009-10 to 2011-12.
4.48 The Commission is not aware of any other committed projects that will change
generation capacity in the market systems capacity in the period 2009-10 to 2011-12.

28
2008-09 Power System Review March 2010
Indicators of system capacity
4.49 In previous Reviews, the Commission has compared three indicators of generation
capacity against forecast electricity peak demand to estimate the future supply-demand
balance for the market systems. These indicators are:
• total capacity in MW, which is the capacity of all units of generation in the power system;
• N-1 capacity in MW, which excludes the largest unit of generation in the system from the total capacity; and
• N-2 capacity in MW, which excludes the largest two units of generation in the system from the total capacity.
4.50 The Commission considers that the N-1 and N-2 standard for assessing the
appropriate reserve capacity that should be maintained in a system is a basic indicator
of the potential risks to system security. An N-2 standard means that peak demand
can be met even if the largest two generators are not in service. However, scheduled
maintenance outages and network outages reduce the ability of the system to meet
peak load in the event of unscheduled loss of generation. Environmental factors such
as prolonged high temperatures may also reduce the available generation capacity, as
increased temperatures adversely affect a generator’s production.
4.51 Additionally, an informed assessment of the adequacy of system capacity should take
account of the maintenance history and condition of generating plant, the potential for
major equipment failure with extended replacement times, the duration and timing of
planned overhauls and maintenance, the frequency of unplanned outages and the level
of redundancy in supporting systems.
4.52 For example, the Commission notes system performance data provided by the System
Controller indicating reliability problems at the Weddell and Channel Island power
stations that resulted in a number of unplanned outages during 2009, and particularly
with the onset of the wet season. The Commission understands that initial operating
problems at Weddell led to a number of unplanned outages, and that the effect of
these problems on overall system reliability appears to have been exacerbated by the
unplanned shutdowns (with the exact cause or extent of any potential problems not yet
known to the Commission) at Channel Island.
4.53 The Commission understands that unplanned maintenance was occurring at Channel
Island during 2009 that may have extended the time needed to bring reserve capacity
into service to meet demand when there was an unplanned outage. This suggests that
during a period of peak seasonal demand the Darwin-Katherine system was operating
at significantly lower levels of reserve capacity than would be considered desirable.
4.54 The Commission notes that there is no statutory definition of security of supply or the
methodology for determining the reserve capacity needed to maintain an acceptable
level of security of supply, or any obligation for the Commission to use the N-1 and N-2
standard.
4.55 PWC’s Statement of Corporate Intent (SCI), which is a contract between the
shareholding Minister and PWC about technical and financial performance, has been
developed using the N-2 criterion for generation. As such, there is a case for accepting
that the N-2 standard is a reasonable measure. However, the Commission will be
assessing the suitability of the standard as part of the upcoming System Planning
Monitoring and Reporting Review to be conducted under terms of reference from the

29
2008-09 Power System Review March 2010
Treasurer. As part of this review, the Commission will assess the feasibility of aligning
security and reliability of supply standards used in the Territory with National Electricity
Market (NEM) equivalents, which will assist with cross jurisdictional comparisons.
4.56 The Commission also notes that high system loads occur over long periods, with the
implication that load may be at risk for long periods when generation is not available.
4.57 The Commission intends examining the type and detail of information that should be
available from, and for, electricity industry participants and others during 2010. For
example, the Commission notes that detailed information on the planned augmentation
and retirement of generation capacity is reported in the annual Statement of
Opportunities released by the AEMO.13 The Commission will be examining this issue in
2010, and expects to provide a more comprehensive analysis of baseline capacity
projections and the appropriate reserve capacity that should be maintained for each
power system in future Reviews.
Demand forecasts
4.58 The 2008-09 Review examines prospects for electricity demand in the market systems
for the 10 years to 2018-19, focusing on demand forecasts for the medium term, for the
four years 2009-10 to 2012-13, and for the long term, for the period 2013-14 to
2018-19.
4.59 In a break with the approach in previous Reviews, the Commission has not
independently tested the accuracy of the demand forecasts, opting instead to develop
forecasts by testing the sensitivity of forecasts by electricity industry participants. In
future years, the Commission will revert to adopting its own forecasts, based on
forecasts of economic activity and other indicators. The nature of generation in the
Territory is such that additional capacity can be procured relatively quickly should high
growth emerge. The Commission will also test in future Reviews electricity industry
participant’s preparation, by way of environmental and other approvals, for
augmentation.
Methodology and assumptions for demand forecasts
4.60 To assist the Commission in preparing the 2008-09 Review, PWC provided the
Commission with information on methodology and assumptions used to forecast
demand. Based on this data, the Commission understands that PWC used a baseline
generation peak demand growth rate of 2.4 per cent per year for the Darwin-Katherine
system, and one per cent per year for the Alice Springs and Tennant Creek systems.14
PWC has advised that these growth rates are consistent with the forecast growth in
electricity sales used in the 2009-10 SCI prepared by PWC for the shareholding
13
Refer Australian Energy Market Operator website, www.aemo.com.au for this report.
14 Data response provided to the Commission by the Power and Water Corporation on 23 November 2009.

30
2008-09 Power System Review March 2010
Minister.15 PWC also appears to assume an equivalent growth rate for electricity use
and generation peak demand.16
4.61 PWC has advised the Commission that the main assumptions being used to prepare
the demand forecasts for developing the 2010-11 SCI are:
• customer number and consumption data is that reported for 2008-09;
• the customer growth rate is consistent with Australian Bureau of Statistics projections of population growth; and
• energy consumption growth rates are based on a ‘medium’ growth rate scenario that is supported by historical trend analysis. The average annual consumption growth rate is 1.99 per cent for Darwin-Katherine, 0.97 per cent for Alice Springs and 0.65 per cent for Tennant Creek.
4.62 The relatively small size of market systems means that major industrial or mining
projects can have a significant effect on electricity demand. As such, demand forecasts
must take into account the likelihood and timing of major projects. For the 2008-09
Review, PWC has advised that although a number of major projects are mooted, the
respective proponents have not provided sufficiently firm demand projections or
otherwise signaled a firm timeframe for requiring an electricity supply. On this basis,
PWC has not considered demand from any major projects in forecasting demand and
generation capacity requirements.
Baseline demand forecast
4.63 The Commission is adopting the PWC forecast for baseline demand growth of
2.4 per cent per year for the Darwin-Katherine system, and 1 per cent per year for the
Alice Springs and Tennant Creek systems.
4.64 These baseline demand growth rates are used to provide medium and long term
baseline demand growth scenarios for each system.
High and low demand growth scenarios
4.65 In addition to the baseline forecast, the Commission is adopting the average annual
demand growth rates in table 4.5 to provide high and low demand growth scenarios.
4.66 These scenarios are used to assess the possible effect on demand of stronger and
weaker demand growth, which could reflect different economic or population growth
rates. For example, the high growth demand scenario represents the assumed affect
on the supply demand balance of major projects, such as the proposed construction of
an LNG plant at Blaydin Point on Darwin harbour or the construction of a significant
residential development.
15
The SCI is a public document tabled in the Assembly and represents in effect a performance agreement between the shareholding Minister and PWC.
16 Demand growth is the important indicator to consider for generator capacity. Energy production is an important
further consideration for adequacy of fuel supply.

31
2008-09 Power System Review March 2010
Table 4.5: Long term peak demand growth rates, 2013-14 to 2018-19 (average annual percentage change)
System Baseline growth
scenario
Low growth
scenario
High growth
scenario
Darwin-Katherine 2.4 1.0 4.0
Alice Springs 1.0 0.1 2.5
Tennant Creek 1.0 0.1 2.5
Source: Utilities Commission.
4.67 The high and low growth rates have been derived to test the sensitivity of the
supply-demand balance to varying demand conditions. A broad analysis of
consumption in the Darwin-Katherine system undertaken by the Commission for
previous Reviews indicates an average annual growth rate of approximately 3 per cent
over the period from 1990-91 to 2007-08. The Commission has used this average to
inform the high and low demand growth scenarios for the Darwin-Katherine system.
4.68 The 2007-08 Review discussed the assumed additional demand associated with
construction of the proposed LNG plant at Blaydin Point. The proponent had then
indicated that about 10 to 15 MW of capacity would be required during construction,
representing between 3.6 and 5.5 per cent of total capacity in 2009-10. The
Commission estimated the following demand profile for the life of the project:
• 7.5 MW in year one;
• 15 MW in years two to five; and
• 7.5 MW in year six.
4.69 In addition to these local loads, the strong economic activity which would be stimulated
by such a major project could add to underlying demand. In the 2007-08 Review, the
Commission adopted an assumption of demand growth of 3.3 per cent per year for
2008-09 to 2011-12, including the indirect impact of the Blaydin Point LNG project.
Taking account of the direct effect, the Commission estimated an average compound
growth rate of 4.6 per cent per year.
4.70 After construction, the Commission understands that the LNG plant would most likely
generate its own electricity and not be a source of electricity demand or supply into the
Darwin-Katherine system.
Forecast supply-demand balance
4.71 The adequacy of generation capacity relative to forecast demand is assessed by
comparing the baseline capacity projection with medium term and long term demand
forecast scenarios.
4.72 The following sections outline the forecast-supply demand balance for the
Darwin-Katherine, Alice Springs and Tennant Creek systems in the medium term
(2009-10 to 2012-13) and long term (2013-14 to 2018-19).
4.73 The Commission has assumed demand growth for the baseline, high and low growth
scenarios for 2009-10 to 2018-19 are the demand growth scenarios specified in table
4.5 above.

32
2008-09 Power System Review March 2010
4.74 As noted above, the Commission has chosen not to include capacity additions or
retirements advised to occur after 2011-12. However, this does not mean that a
capacity shortfall is to be expected, or will occur. Rather, the Commission considers
that this approach effectively represents the prospective trend for capacity by
demonstrating when available and committed capacity could prove insufficient to meet
forecast maximum demand with adequate reserves, and highlights the size and timing
of opportunities to invest in the generation sector.
Supply demand balance – Darwin-Katherine system
4.75 Chart 4.7 provides a summary of the historical and forecast supply-demand balance for
the Darwin-Katherine system. Further detail on the supply-demand balance for each
year from 2009-10 is available in tables below.
Chart 4.7 Supply demand balance with baseline, high and low demand growth scenarios, Darwin-Katherine,
2005-06 to 2018-19
Source: Electricity industry participants. Note: Dotted vertical line represents cessation of capacity adjustments.
4.76 Overall, based on the assumed demand growth rates, projected capacity in the
Darwin-Katherine system is adequate at the more conservative N-2 standard until
2014-15, under the baseline demand scenario, and until 2012-13 under the high
demand scenario. Projected capacity is adequate at the N-1 standard until 2015-16
under the high demand scenario.
4.77 The capacity projection for the Darwin-Katherine system for 2009-10 to 2011-12 takes
into account the addition of 12.1 MW of capacity to the Katherine power station in
2010-11, the addition of 30 MW to the Weddell power station in 2011-12, and the
retirement of the 30 MW Berrimah power station by 2011-12 (15 MW in 2009-10 and
15 MW in 2011-12).
0
50
100
150
200
250
300
350
400
450
2005-06 2006-07 2007-08 2008-09 2009-10 2010-11 2011-12 2012-13 2013-14 2014-15 2015-16 2016-17 2017-18 2018-19
MW
Maximum demand (MW)
N-2 Capacity (MW)
N-1 Capacity (MW)
Total Capacity (MW)
Low Growth Scenario
High Growth Scenario

33
2008-09 Power System Review March 2010
Table 4.6: Supply demand balance, baseline demand growth scenario, Darwin-Katherine, 2009-10 to
2018-19
Financial Year Total Capacity N-1 N-2 Peak Demand
Reserve
Margin over
N-1
Reserve
Margin over
N-2
2009-10 382 334.4 286.8 273.4 61 13.4
2010-11 394.1 346.5 298.9 280 66.5 18.9
2011-12 409.1 361.5 313.9 286.7 74.8 27.2
2012-13 409.1 361.5 313.9 293.6 67.9 20.3
2013-14 409.1 361.5 313.9 300.6 60.9 13.3
2014-15 409.1 361.5 313.9 307.8 53.7 6.1
2015-16 409.1 361.5 313.9 315.2 46.3 -1.3
2016-17 409.1 361.5 313.9 322.8 38.7 -8.9
2017-18 409.1 361.5 313.9 330.5 31.0 -16.6
2018-19 409.1 361.5 313.9 338.5 23.0 -24.6
4.78 For the Darwin-Katherine system, demand is met for the medium term at the N-1 and
N-2 standard, with a reserve margin of at least 61 MW over N-1 and at least 13.4 MW
over N-2 in the period to 2012-13. The reserve margin over N-1 and N-2 in the period
2009-10 to 2012-13 is subject to the planned addition of new capacity at Katherine and
Weddell power stations.
4.79 At the N-2 standard, reserve conditions are adequate through to 2014-15. Based on
the baseline demand forecasts provided by PWC, additional capacity is required before
2015-16 to satisfy the N-2 reserve standard. Proposed capacity additions or
retirements beyond 2011-12 are not factored into the projected assessment of system
adequacy.

34
2008-09 Power System Review March 2010
Table 4.7: Supply demand balance, low growth demand scenario, Darwin-Katherine, 2009-10 to 2018-19
Financial Year Total Capacity N-1 N-2 Peak Demand
Reserve
Margin over
N-1
Reserve
Margin over
N-2
2009-10 382 334.4 286.8 269.7 64.7 17.1
2010-11 394.1 346.5 298.9 272.4 74.1 26.5
2011-12 409.1 361.5 313.9 275.1 86.4 38.8
2012-13 409.1 361.5 313.9 277.8 83.7 36.1
2013-14 409.1 361.5 313.9 280.6 80.9 33.3
2014-15 409.1 361.5 313.9 283.4 78.1 30.5
2015-16 409.1 361.5 313.9 286.3 75.2 27.6
2016-17 409.1 361.5 313.9 289.1 72.4 24.8
2017-18 409.1 361.5 313.9 292 69.5 21.9
2018-19 409.1 361.5 313.9 294.9 66.6 19
4.80 Assuming the low growth scenario for the Darwin-Katherine system, capacity remains
adequate at both the N-1 and N-2 reserve standards over the medium term to 2012-13
if planned additional capacity is installed. N-1 and N-2 standards are met in the longer
term to 2018-19.
Table 4.8: Supply demand balance, high growth demand scenario, Darwin-Katherine, 2009-10 to 2018-19
Financial Year Total Capacity N-1 N-2 Peak Demand
Reserve
Margin over
N-1
Reserve
Margin over
N-2
2009-10 382 334.4 286.8 277.7 56.7 9.1
2010-11 394.1 346.5 298.9 288.8 57.7 10.1
2011-12 409.1 361.5 313.9 300.3 61.2 13.6
2012-13 409.1 361.5 313.9 312.4 49.1 1.5
2013-14 409.1 361.5 313.9 324.8 36.7 -10.9
2014-15 409.1 361.5 313.9 337.8 23.7 -23.9
2015-16 409.1 361.5 313.9 351.4 10.1 -37.5
2016-17 409.1 361.5 313.9 365.4 -3.9 -51.5
2017-18 409.1 361.5 313.9 380 -18.5 -66.1
2018-19 409.1 361.5 313.9 395.2 -33.7 -81.3
4.81 The reserve margin over N-1 and N-2 in the period to 2012-13 is adequate in the
medium term to 2012-13 if planned additional capacity is installed at Katherine and
Weddell power stations.
4.82 The effect of a high growth scenario (4 per cent per year) from 2009-10 is illustrated in
Table 4.8 and Chart 4.7 above. It shows that anticipation of high rates of growth, which

35
2008-09 Power System Review March 2010
could arise from strong economic recovery and from discrete addition to industrial load,
could bring forward the need for augmentation to meet the N-2 criteria to before
2013-14.
4.83 At the N-1 standard reserve conditions are adequate through to 2015-16. Based on the
high growth demand scenario, additional capacity is required before 2016-17 to satisfy
the N-1 reserve standard. Proposed capacity additions or retirements beyond 2011-12
are not factored into the projected assessment of system adequacy.
Supply demand balance – Alice Springs
4.84 Chart 4.8 provides a summary of the historical and forecast supply-demand balance for
the Alice Springs system. Further detail on the supply-demand balance for each year
from 2009-10 is available in tables below.
Chart 4.8: Supply demand balance with baseline, high and low demand growth scenarios Alice Springs,
2005-06 to 2018-19
Source: Electricity industry participants. Note: Dotted vertical line represents cessation of capacity adjustments.
4.85 For the Alice Springs system, projected generation capacity is adequate at the N-1
standard for the period 2009-10 to 2018-19 under the low, baseline and high demand
growth scenarios. The capacity projection for the Alice Springs system for 2009-10 to
2011-12 takes into account the addition of 32.1 MW of capacity to the Owen Springs
power station, and the retirement or relocation of 14 MW at the Ron Goodin power
station in 2010-11 (10.1 MW is to be moved to Katherine power station).
4.86 At N-2, projected capacity is below the reserve standard in 2009-10, but is adequate
until 2018-19 under the baseline and low demand growth scenarios, and until 2016-17
under the high demand growth scenario. Proposed capacity additions or retirements
beyond 2011-12 are not factored into the projected assessment of system adequacy.
0
10
20
30
40
50
60
70
80
90
100
2005-06 2006-07 2007-08 2008-09 2009-10 2010-11 2011-12 2012-13 2013-14 2014-15 2015-16 2016-17 2017-18 2018-19
MW
Maximum demand (MW)
N-2 Capacity (MW)
N-1 Capacity (MW)
Total Capacity (MW)
High Growth
Low Growth

36
2008-09 Power System Review March 2010
Table 4.9: Supply demand balance, baseline demand growth scenario, Alice Springs, 2009-10 to 2018-19
Financial Year Total Capacity N-1 N-2 Peak Demand
Reserve
Margin over
N-1
Reserve
Margin over
N-2
2009-10 71 59.3 49.2 54.9 4.4 -5.7
2010-11 89 77.3 66.6 55.5 21.8 11.1
2011-12 89 77.3 66.6 56 21.3 10.6
2012-13 89 77.3 66.6 56.6 20.7 10
2013-14 89 77.3 66.6 57.2 20.1 9.4
2014-15 89 77.3 66.6 57.7 19.6 8.9
2015-16 89 77.3 66.6 58.3 19 8.3
2016-17 89 77.3 66.6 58.9 18.4 7.7
2017-18 89 77.3 66.6 59.5 17.8 7.1
2018-19 89 77.3 66.6 60.1 17.2 6.5
4.87 Under the baseline demand growth scenario of 1 per cent per year, reserve conditions
are adequate at the N-1 for the period 2009-10 to 2018-19, and at the N-2 standard
after 2009-10. An additional 18 MW of capacity is to be added to the Alice Springs
system when the Owen Springs power station begins operating in 2010-11.
Table 4.10: Supply demand balance, low growth demand scenario, Alice Springs, 2009-10 to 2018-19
Financial Year Total Capacity N-1 N-2 Peak Demand
Reserve
Margin over
N-1
Reserve
Margin over
N-2
2009-10 71 59.3 49.2 54.5 4.8 -5.3
2010-11 89 77.3 66.6 54.5 22.8 12.1
2011-12 89 77.3 66.6 54.6 22.7 12
2012-13 89 77.3 66.6 54.6 22.7 12
2013-14 89 77.3 66.6 54.7 22.6 11.9
2014-15 89 77.3 66.6 54.7 22.6 11.9
2015-16 89 77.3 66.6 54.8 22.5 11.8
2016-17 89 77.3 66.6 54.8 22.5 11.8
2017-18 89 77.3 66.6 54.9 22.4 11.7
2018-19 89 77.3 66.6 54.9 22.4 11.7
4.88 If demand increased by an average rate of 0.1 per cent per year over 2009-10 to
2018-19, capacity will be adequate at both the N-1 and the N-2 standard after 2009-10.
The reserve margin over N-2 is not sufficient to meet forecast demand in 2009-10, but
is adequate thereafter with the planned addition of new capacity at the Owen Springs
power station.

37
2008-09 Power System Review March 2010
Table 4.11: Supply demand balance, high growth demand scenario, Alice Springs, 2009-10 to 2018-19
Financial Year Total Capacity N-1 N-2 Peak Demand
Reserve
Margin over
N-1
Reserve
Margin over
N-2
2009-10 71 59.3 49.2 55.8 3.5 -6.6
2010-11 89 77.3 66.6 57.2 20.1 9.4
2011-12 89 77.3 66.6 58.6 18.7 8
2012-13 89 77.3 66.6 60 17.3 6.6
2013-14 89 77.3 66.6 61.5 15.8 5.1
2014-15 89 77.3 66.6 63.1 14.2 3.5
2015-16 89 77.3 66.6 64.7 12.6 1.9
2016-17 89 77.3 66.6 66.3 11 0.3
2017-18 89 77.3 66.6 67.9 9.4 -1.3
2018-19 89 77.3 66.6 69.6 7.7 -3.0
4.89 As indicated by Table 4.11, if demand growth averages 2.5 per cent per year, projected
generation capacity is adequate at the N-1 standard for the period 2009-10 to 2018-19.
However, additional capacity will be needed by 2016-17, as the reserve margin over
N-2 is not sufficient to meet forecast demand by 2017-18.
Supply demand balance – Tennant Creek
4.90 Chart 4.9 provides a summary of the historical and forecast supply-demand balance for
the Tennant Creek system. Further detail on the supply-demand balance for each year
from 2009-10 is available in tables below.
4.91 No additional capacity, or capacity retirements, are planned for the Tennant Creek
system for the period 2009-10 to 2011-12.

38
2008-09 Power System Review March 2010
Chart 4.9: Supply demand balance with baseline, high and low demand growth scenarios, Tennant Creek,
2005-06 to 2018-19
Source: Electricity industry participants. Note: Dotted vertical line represents cessation of capacity adjustments.
4.92 The reserve margin in the Tennant Creek system appears adequate to meet the
expected future maximum demand under all demand growth forecast scenarios.
Table 4.12: Supply demand balance, baseline demand growth scenario, Tennant Creek, 2009-10 to
2018-19
Financial Year Total Capacity N-1 N-2 Peak Demand
Reserve
Margin over
N-1
Reserve
Margin over
N-2
2009-10 16.7 12.8 11.3 7.4 5.4 3.9
2010-11 16.7 12.8 11.3 7.4 5.4 3.9
2011-12 16.7 12.8 11.3 7.5 5.3 3.8
2012-13 16.7 12.8 11.3 7.6 5.2 3.7
2013-14 16.7 12.8 11.3 7.7 5.1 3.6
2014-15 16.7 12.8 11.3 7.7 5.1 3.6
2015-16 16.7 12.8 11.3 7.8 5.0 3.5
2016-17 16.7 12.8 11.3 7.9 4.9 3.4
2017-18 16.7 12.8 11.3 8 4.8 3.3
2018-19 16.7 12.8 11.3 8.1 4.7 3.2
0
2
4
6
8
10
12
14
16
18
20
2005-06 2006-07 2007-08 2008-09 2009-10 2010-11 2011-12 2012-13 2013-14 2014-15 2015-16 2016-17 2017-18 2018-19
MW
Maximum demand (MW)
N-2 Capacity (MW)
N-1 Capacity (MW)
Total Capacity (MW)
High Growth
Low Growth

39
2008-09 Power System Review March 2010
4.93 At both the N-1 and the N-2 reserve standards, projected capacity in Tennant Creek
remains adequate over the medium to 2012-13 and long term to 2018-19 under the
baseline demand growth scenario of 1 per cent per year.
Table 4.13: Supply demand balance, low demand growth scenario, Tennant Creek, 2009-10 to 2018-19
Financial Year Total Capacity N-1 N-2 Peak Demand
Reserve
Margin over
N-1
Reserve
Margin over
N-2
2009-10 16.7 12.8 11.3 7.3 5.5 4
2010-11 16.7 12.8 11.3 7.3 5.5 4
2011-12 16.7 12.8 11.3 7.3 5.5 4
2012-13 16.7 12.8 11.3 7.3 5.5 4
2013-14 16.7 12.8 11.3 7.3 5.5 4
2014-15 16.7 12.8 11.3 7.3 5.5 4
2015-16 16.7 12.8 11.3 7.4 5.4 3.9
2016-17 16.7 12.8 11.3 7.4 5.4 3.9
2017-18 16.7 12.8 11.3 7.4 5.4 3.9
2018-19 16.7 12.8 11.3 7.4 5.4 3.9
4.94 Under the low demand growth scenario of 0.1 per cent per year, the projected capacity
is sufficient to meet both the N-1 and N-2 reserve standards for the period 2009-10 to
2018-19.
Table 4.14: Supply demand balance, high demand growth scenario, Tennant Creek, 2009-10 to 2018-19
Financial Year Total Capacity N-1 N-2 Peak Demand
Reserve
Margin over
N-1
Reserve
Margin over
N-2
2009-10 16.7 12.8 11.3 7.5 5.3 3.8
2010-11 16.7 12.8 11.3 7.7 5.1 3.6
2011-12 16.7 12.8 11.3 7.9 4.9 3.4
2012-13 16.7 12.8 11.3 8.1 4.7 3.2
2013-14 16.7 12.8 11.3 8.3 4.5 3
2014-15 16.7 12.8 11.3 8.5 4.3 2.8
2015-16 16.7 12.8 11.3 8.7 4.1 2.6
2016-17 16.7 12.8 11.3 8.9 3.9 2.4
2017-18 16.7 12.8 11.3 9.1 3.7 2.2
2018-19 16.7 12.8 11.3 9.3 3.5 2
4.95 Under the high growth demand scenario of 2.5 per cent per year, projected capacity is
adequate at both the N-1 and N-2 reserve standards for the period 2009-10 to
2018-19.

40
2008-09 Power System Review March 2010
Electricity generation performance
4.96 This section reports on generation performance in the Darwin-Katherine, Alice Springs
and Tennant Creek systems in 2008-09 against the indicators specified in the
Electricity Standards of Service Code, and compares this to historical results and the
relevant standard.
4.97 The Electricity Standards of Service Code requires PWC to report annually on actual
generation performance against the defined standards. The performance indicators for
generation are:
• system average interruption duration index (SAIDI), which is the average minutes of off supply per customer;
• system average interruption frequency index (SAIFI), which is the average number of interruptions per customer; and
• customer average interruption duration index (CAIDI), which is the average interruption duration per customer.
4.98 According to the information reported by PWC for 2008-09, PWC’s generation
performance breached three of the agreed standards in 2008-09. Additionally, PWC
reported that these were consecutive breaches of the standard. The breaches were for:
• Darwin Generation CAIDI. The standard of an average interruption duration per customer of 10.9 minutes was exceeded in 2008-09 (11.3 minutes) and 2007-08 (17.7 minutes);
• Katherine Generation SAIFI. The standard of an average 1.1 interruptions per customer was exceeded in 2008-09 (1.5 interruptions) and 2007-08 (4.3 interruptions); and
• Tennant Creek Generation CAIDI. The standard of an average interruption duration per customer of 10 minutes was exceeded in 2008-09 (28.5 minutes) and every year since 1999-00.
4.99 Table 4.15 sets out the major generation related incidents in the Darwin-Katherine
system for January to June 2009, as reported by the System Controller.
Table 4.15: Major generation power system incidents, Darwin-Katherine, January to June 2009
Date Power Station Description
15 January Channel Island Generator trip and loadshed
25 January Channel Island Generator trip and loadshed
23 March Pine Creek Generator trip and loadshed
1 April Channel Island Manual loadshed, partial voltage collapse around CIPS
20 April Channel Island Generator trip and loadshed
21 April Weddell Generator trip and loadshed
30 April Channel Island Generator trip and loadshed
22 May Channel Island Generator trip and loadshed
8 June Channel Island Generator trip and loadshed
Source: Power and Water Corporation, System Controller Half Year Report, January to June 2009.

41
2008-09 Power System Review March 2010
4.100 PWC System Control will be providing the Commission with information on major
power system incidents, including the date, location and a brief description of each
event, such as cause, duration and action taken. Future Reviews will provide more
comprehensive reporting and analysis of power system incidents for the
Darwin-Katherine, Alice Springs and Tennant Creek systems for the year under review.
Darwin region generation performance
4.101 This section reports performance against the SAIDI, SAIFI and CAIDI indicators for the
Darwin region for 1999-00 to 2008-09. Although they are part of the same system,
performance is reported separately for the Darwin region and Katherine.
Chart 4.10: SAIDI, Darwin, 1999-2000 to 2008-09
4.102 The agreed standard for SAIDI in the Darwin region is 42.7 minutes. This standard has
been breached in three of the past five years. However, SAIDI performance for
2008-09 of 33.4 minutes is better than the agreed standard, and better the average for
the past decade of 40.5 minutes.
4.103 PWC advises that the breach of the standard in 2007-08 was due to initial operating
problems with the commissioning of the Weddell power station. Further load shedding
occurred in the second quarter of 2008 as a result of work at Weddell power station.
Chart 4.11: SAIFI, Darwin, 1999-2000 to 2008-09
4.104 The Darwin region SAIFI has never breached the agreed standard of an average 3.9
interruptions per customer. Although the average number of interruptions has declined
from the decade high of 3.6 in 2006-07 to 3.0 in 2008-09, performance is above the
average for the decade of 2.8 interruptions.
9.5 12.7
22.6
32.927.0
98.1
71.4
37.2
59.8
33.4
0
20
40
60
80
100
120
99-00 00-01 01-02 02-03 03-04 04-05 05-06 06-07 07-08 08-09
42.7 Minutes
Minutes
1.3
1.7
3.0 3.0
2.5
3.6
2.9
3.63.4
3.0
0
1
2
3
4
5
99-00 00-01 01-02 02-03 03-04 04-05 05-06 06-07 07-08 08-09
3.9 Interruptions
Interruptions

42
2008-09 Power System Review March 2010
Chart 4.12: CAIDI, Darwin, 1999-2000 to 2008-09
4.105 The Darwin region CAIDI of 11.3 minutes for 2008-09 was above the agreed standard
of an average 10.9 minutes per customer. PWC advises that this is most likely a result
of generation disruptions towards the end of 2008. The Darwin region CAIDI has been
above the agreed standard in four of the past five years.
Katherine region generation performance
4.106 This section reports performance against the SAIDI, SAIFI and CAIDI indicators for the
Katherine region for 1999-00 to 2008-09.
Chart 4.13: SAIDI, Katherine, 1999-2000 to 2008-09
4.107 The agreed standard for SAIDI in the Katherine region is 25.7 minutes. SAIDI
performance for 2008-09 of 24.1 minutes is better than the agreed standard, and a
significant improvement on the 93.4 minutes reported for 2007-08. The average for the
past decade is 24.8 minutes, although this includes the outlier of 2007-08.
4.108 PWC attributed the poor performance in 2007-08 to several power system incidents in
the Darwin region which had a flow on effect to the Katherine system.
7.6 7.5 7.6
10.9 10.6
27.5
24.5
10.3
17.7
11.3
0
5
10
15
20
25
30
99-00 00-01 01-02 02-03 03-04 04-05 05-06 06-07 07-08 08-09
10.9 Minutes
Minutes
7.02.4 0.5 1.2
24.1
51.1
39.4
4.9
93.4
24.1
0
20
40
60
80
100
99-00 00-01 01-02 02-03 03-04 04-05 05-06 06-07 07-08 08-09
25.7 Minutes
Minutes

43
2008-09 Power System Review March 2010
Chart 4.14: SAIFI, Katherine, 1999-2000 to 2008-09
4.109 The Katherine region SAIFI exceeded the agreed standard of an average
1.1 interruptions per customer in 2007-08 and 2008-09, recording an average 4.3 and
1.5 interruptions respectively. PWC attributes the 2008-09 outcome to bushfires
affecting the Manton-Pine Creek 132 kV line and causing a subsequent loss of
generation at the Pine Creek power station.
4.110 The average number of interruptions has declined from the decade high of 4.3 in
2007-08, but remains above the average for the decade of 1.0 interruptions.
Chart 4.15: CAIDI, Katherine, 1999-2000 to 2008-09
4.111 The Katherine region CAIDI of 16.2 minutes in 2008-09 was better than the agreed
standard of 24.5 minutes. The average CAIDI for the decade is 23.4 minutes.
0.2 0.2 0.1 0.1
1.10.7
1.20.9
4.3
1.5
0
1
2
3
4
5
99-00 00-01 01-02 02-03 03-04 04-05 05-06 06-07 07-08 08-09
1.1 Interruptions
Interruptions
32.8
13.38.6
11.3
21.3
70.2
32.5
5.6
21.716.2
0
10
20
30
40
50
60
70
80
99-00 00-01 01-02 02-03 03-04 04-05 05-06 06-07 07-08 08-09
24.5 Minutes
Minutes

44
2008-09 Power System Review March 2010
Tennant Creek generation performance
4.112 This section reports performance against the SAIDI, SAIFI and CAIDI indicators for the
Tennant Creek system for 1999-00 to 2008-09.
Chart 4.16: SAIDI, Tennant Creek, 1999-2000 to 2008-09
4.113 The agreed standard for SAIDI in the Tennant Creek system is 125 minutes, compared
to SAIDI performance in 2008-09 of 49.6 minutes. The average for the past decade is
68.9 minutes. However, performance in the past five years has been much improved
relative to earlier in the decade, with an average for the past five years of 41.2 minutes.
Chart 4.17: SAIFI, Tennant Creek, 1999-2000 to 2008-09
4.114 The Tennant Creek SAIFI has not exceeded the agreed standard of an average 12.5
interruptions per customer in the past decade. Performance in 2008-09 of 1.7
interruptions is below the average for the past decade of 5.1 interruptions, but the
average for the past five years is 2.1 interruptions.
125.0 129.2
68.5
51.5
109.1
58.2
22.3
62.7
13.4
49.6
0
20
40
60
80
100
120
140
99-00 00-01 01-02 02-03 03-04 04-05 05-06 06-07 07-08 08-09
125 Minutes
Minutes
12.5
11.0
6.5
4.7
6.3
2.1
1.1
4.6
0.91.7
0
2
4
6
8
10
12
14
99-00 00-01 01-02 02-03 03-04 04-05 05-06 06-07 07-08 08-09
12.5 Interruptions
Interruptions

45
2008-09 Power System Review March 2010
Chart 4.18: CAIDI, Tennant Creek, 1999-2000 to 2008-09
4.115 The Tennant Creek CAIDI in 2008-09 of 28.5 minutes was above the agreed standard
of 10 minutes, and the highest recorded outcome in the past decade. PWC attributes
the performance in 2008-09 to an increase in the duration of interruptions, as the
frequency of interruptions has remained relatively constant.
4.116 The Tennant Creek CAIDI has exceeded the agreed standard in every year since
2000-01, and the average performance for the decade is 16.5 minutes.
Alice Springs system generation performance
4.117 This section reports performance against the SAIDI, SAIFI and CAIDI indicators for the
Alice Springs system for 1999-00 to 2008-09.
Chart 4.19: SAIDI, Alice Springs, 1999-2000 to 2008-09
4.118 The agreed standard for SAIDI in the Alice Springs system is 122.5 minutes, compared
to SAIDI performance of 3.6 minutes in 2008-09. Average SAIDI in the past decade is
35.7 minutes.
13.0
48.6
83.0
28.4
46.3
89.8
17.5 13.513.1
3.6
0
20
40
60
80
100
120
140
99-00 00-01 01-02 02-03 03-04 04-05 05-06 06-07 07-08 08-09
122.5 Minutes
Minutes
10.011.8
10.6 11.1
17.4
27.5
19.8
13.6 14.9
28.5
0
5
10
15
20
25
30
99-00 00-01 01-02 02-03 03-04 04-05 05-06 06-07 07-08 08-09
10 Minutes
Minutes

46
2008-09 Power System Review March 2010
Chart 4.20: SAIFI, Alice Springs, 1999-2000 to 2008-09
4.119 The Alice Springs system SAIFI has not exceeded the agreed standard of an average
of 3.6 interruptions per customer in the past decade. Performance in 2008-09 was
0.5 interruptions, and the average performance for the decade is 1.8 interruptions per
customer.
Chart 4.21: CAIDI, Alice Springs, 1999-2000 to 2008-09
4.120 The Alice Springs CAIDI in 2008-09 of an average interruption duration of 7.2 minutes
a customer is below the agreed standard of 34.2 minutes. Average performance in the
past five years is 14.6 minutes.
Adequacy of fuel supplies
4.121 Natural gas is the main fuel for electricity generation in the Darwin-Katherine, Alice
Springs and Tennant Creek systems. With the exception of the LMS Shoal Bay power
station and peaking/standby generation at Berrimah, almost all electricity in these
systems is generated by burning gas in gas turbines and reciprocating engines, or by
the production of steam through the recovery of waste heat from the gas turbines.
However, most power stations can use liquid fuels (i.e. diesel) as an alternative fuel
source if required.
4.122 The supply of gas in the Territory to generators has been very reliable, with only four
occasions since 1987 when gas has not been supplied to a power station in the
Darwin-Katherine system, with:
• a failed pressure transmitter at Channel Island on 16 May 1999;
• a lightning strike on the Channel Island meter station on 17 December 2004;
1.7
2.6
2.1
1.4
2.0
2.5
1.5
2.6
1.0
0.5
0
1
2
3
4
99-00 00-01 01-02 02-03 03-04 04-05 05-06 06-07 07-08 08-09
3.6 Interruptions
Interruptions
7.6
18.7
39.3
19.8
23.4
35.5
11.8
5.3
13.1
7.2
0
5
10
15
20
25
30
35
40
45
99-00 00-01 01-02 02-03 03-04 04-05 05-06 06-07 07-08 08-09
34.2 Minutes
Minutes

47
2008-09 Power System Review March 2010
• gas supply issues to Channel Island power station on 10 December 2009; and
• gas supply issues to Weddell power station on 23 November 2009.
4.123 An earthquake in the Tennant Creek region in January 1988 led to a need to interrupt
supply to the Tennant Creek power station so that pipeline repairs could be made, but
there was no interruption to the gas supply in the Darwin-Katherine system.
Amadeus Basin gas fields
4.124 Gas from the Palm Valley and Mereenie fields in the Amadeus Basin in central
Australia has been used for electricity generation in Alice Springs since 1983, and in
Darwin-Katherine and Tennant Creek systems since 1987. The Amadeus Basin to
Darwin gas pipeline (ABDP) was commissioned in December 1986 to transport gas
from central Australia to Darwin, with the first gas supplied in January 1987.
4.125 The Palm Valley field is operated by Magellan Petroleum Australia Ltd and the
Mereenie field by Santos Ltd. Both operators have a significant interest in each field.
4.126 In 1985, Gasgo Pty Ltd contracted to purchase 200 petajoules (PJ) of gas in the period
to 2012 from the Palm Valley field, and 66 PJ of gas in the period to 2009 from the
Mereenie field. 17 However, the Palm Valley field did not meet expected gas volumes,
despite further field development to arrest the decline in gas production.
4.127 The lower than expected gas volumes from Palm Valley, and greater than expected
energy demand resulted in supplementary contracts to purchase 113 PJ in the period
to 2009 from the Mereenie field. A fourth supplementary contract to supply a minimum
of 5.2 PJ from March 2006 to December 2008, and additional gas from January 2008
to December 2010 was agreed in 2005-06. However, the additional gas supplied was
on a reasonable endeavours basis, as the Mereenie field was also experiencing
declining production.
Blacktip gas field
4.128 In response to the declining gas reserves in the Amadeus Basin fields, in 2006 PWC
entered agreements for the supply and transport of 740 PJ of gas until 2034. The
Commission understands that the field has estimated reserves of 1.1 trillion cubic feet,
and there could be additional gas available.
4.129 The Blacktip field is located in the Bonaparte Gulf about 100 km west of Wadeye, and
is operated by Eni. The gas comes onshore to a processing plant near Wadeye, and is
transported by the 286 km Bonaparte gas pipeline to join the ABDP near Ban Ban
Springs.
4.130 Gas from the Blacktip field was to replace gas from the Amadeus Basin fields as the
primary fuel for electricity generation in the Territory’s power systems from
1 January 2009. However, supply was delayed, apparently due to difficulties
experienced by Eni sourcing components on time and extreme weather conditions.
4.131 Gas for electricity generation was supplied from the Blacktip field from October 2009,
after PWC reached agreements with Eni and the pipeline companies involved in
17
Gasgo Pty Ltd is a subsidiary of PWC.

48
2008-09 Power System Review March 2010
transporting Blacktip gas to supply gas, despite the gas not being fully processed to
specifications agreed between Eni and PWC.
4.132 The Commission understands that full specification gas was being supplied from
mid January 2010 at volumes sufficient to meet electricity generation requirements.
Alternate fuel sources
4.133 The declining volumes of gas supplied from the Palm Valley and Mereenie fields and
rising energy demand has required PWC to use distillate as an alternate fuel source for
electricity generation since 2006-07. PWC advises that about 0.05 PJ of diesel was
used in 2006-07, 0.8 PJ in 2007-08 and 1.1 PJ in 2008-09. The Commission expects
that the use of distillate will reduce significantly from the second half of 2009-10 as
Blacktip gas is now available.
4.134 PWC was able to mitigate the risk of a potential shortfall in fuel for electricity generation
during 2008-09 due to the delay in availability of Blacktip gas by using about
1.1 petajoules of liquid fuels. In the second half of 2009 PWC purchased gas from the
DLNG plant. This gas was available from July 2009 after construction of a pipeline
connecting DLNG plant to the Darwin city gate gas hub.
4.135 The Commission considers that security of fuel supply improved during 2008-09. From
the December quarter 2009, fuel for electricity generation, at varying quantities, quality
and cost, was available from the Amadeus Basin fields (the Commission understands
these fields may have remaining reserves of about 100 PJ of gas); the DLNG plant; the
Blacktip field and liquid fuels.
Fuel supply-demand in the medium term
4.136 The Commission understands that the gas supply-demand balance in the medium term
to 2012-13 is adequate, although with some potential for a shortfall in contracted gas
supply relative to forecast gas demand in the first half of 2009-10 due to the delays in
the supply of full specification gas from the Blacktip field.
4.137 PWC has advised the Commission that contracts for gas supply from the Palm Valley,
Mereenie and Blacktip fields, and from the DLNG plant are adequate to meet forecast
gas demand in 2009-10.
4.138 The data available to the Commission suggests that any increase in energy demand
over PWC’s forecasts over the next five years or more is unlikely to require PWC to
acquire gas in addition to contract, or to use liquid fuels. However, the Commission
intends to examine the robustness of the underlying gas demand forecasts during 2010
to better understand the adequacy of the long term gas supply volumes relative to
energy demand.
Fuel supply-demand in the longer term
4.139 Based on the data available to the Commission, projected gas requirements for
2013-14 to 2018-19 are met under existing gas contracts. Nonetheless, as noted
above, the Commission will examine the robustness of the underlying gas demand
forecasts during 2010 to better understand the adequacy of the long term gas supply
volumes relative to energy demand.
4.140 The Commission notes that gas reserves in the Blacktip field mean gas in excess of
contract quantities is likely to be available. Additionally, the Commission notes that the

49
2008-09 Power System Review March 2010
gas supply-demand balance could change as more modern and efficient generation
equipment is installed in the Darwin-Katherine and Alice Springs systems.
4.141 The Commission also considers that the diversification of fuel sources through
contingency supply arrangements (e.g. the contract with DLNG to supply
supplementary gas and its diesel fuel stocks) improves the security of fuel supplies in
the medium and long terms.

50
2008-09 Power System Review March 2010
CHAPTER 5
Electricity Networks
5.1 This chapter examines the capacity and performance of electricity networks in the
Darwin-Katherine, Alice Springs and Tennant Creek systems.
5.2 In the 2004-05 Review, the Commission undertook a broad assessment of the
arrangements used to manage power system planning and reliability, including for
electricity transmission and distribution networks. Previous Reviews had mainly
focused on capacity and reliability of the electricity generation sector. At the time, the
Commission noted there were deficiencies in the approach to power system planning
and that this meant the Commission was unable to provide an assessment of the
prospective capacity and reliability of the power system as a whole, including electricity
transmission and distribution networks.18
5.3 The equipment failures in and around Casuarina zone substation in late 2008
highlighted the risks associated with inadequate oversight of the reliability of the whole
power system, including electricity network assets.
5.4 In response to concerns raised first in the 2004-05 Review, the Commission asked
PWC Networks to respond to a supplementary data request on network planning and
reliability, for inclusion in the 2007-08 Review. The request was based on requirements
in other Australian jurisdictions, where electricity network operators are subject to
statutory obligations to report on network planning methods and asset capacity. No
similar obligation exists in the Territory.
5.5 The Commission replicated the network planning and reliability report information
request to PWC Networks in preparing the 2008-09 Review. Additionally, the 2008-09
Review includes network performance data that PWC is obliged to report by the
Electricity Standards of Service Code and System Control Technical Code.
5.6 In this context, this chapter includes the following sections:
• overview of the Darwin-Katherine, Alice Springs and Tennant Creek electricity networks;
• network planning arrangements and criteria;
• forecast electricity demand and network capacity-demand balance; and
• network performance against the indicators specified in the Electricity Standards of Service Code.
18
Utilities Commission, December 2005, Annual Power System Review, page 5.

51
2008-09 Power System Review March 2010
Electricity networks overview
5.7 The electricity industry reforms introduced by the Territory Government in April 2000
established a third party access regime for the Darwin-Katherine, Alice Springs and
Tennant Creek electricity networks. Access charges and conditions are regulated by
the Commission, with the most recent determination made in March 2009 for the period
1 July 2009 to 30 June 2014.19
5.8 The Darwin-Katherine, Alice Springs and Tennant Creek networks are stand alone
networks for what were the main population centres of the Territory at the turn of the
millennium.20
5.9 Chart 3.1 (page 11) shows the location of the three main networks, and also some of
the electricity networks in regional and remote areas of the Territory.21 The map
highlights the substantial distance between the networks that makes interconnection an
unlikely prospect in the foreseeable future.
Electricity network assets
5.10 Electricity networks comprise the poles, underground pipes and wires that carry
electricity from the generator to the customer, as well as the substations, transformers,
switching equipment, and monitoring and signaling equipment.
5.11 Table 5.1 provides relevant electricity network information for 2008-09. The
Commission intends to provide additional detail in future Reviews, including a more
detailed description of line capacity and function in each network, and substation
capacity.
Table 5.1: Electricity network asset information 2008-09
Darwin Katherine Alice Springs Tennant Creek
Connections (customer numbers) 58 319 12 109 1 709
Electricity use (gigawatt hours) 1 341 216 26
Network line length (circuit kilometres) 4 773 603 373
Substations 26 3 1
Source: Power and Water Corporation 2008-09 Retail Licence compliance return; and Power and Water Corporation Network Planning and Reliability Report, November 2009.
5.12 Elsewhere in Australia, there is a distinction between the transmission and distribution
sections of an electricity network. Transmission networks carry electricity at high
19
Utilities Commission, March 2009, Final Determination Networks Pricing: 2009 Regulatory Reset.
20 However, there are now a number of towns with a population size similar to that of Tennant Creek, for example,
Wadeye.
21 Regional and remote networks comprise the electricity networks used to supply electricity to 72 communities
and about 600 outstations (operated under the Territory Government Indigenous Essential Services program), three mining towns and nine remote towns. These networks are not subject to the institutional and regulatory framework established by the Electricity Reform Act, Electricity Networks (Third Party Access) Act and Code and associated instruments.

52
2008-09 Power System Review March 2010
voltage from the generator to the distribution network, where electricity is converted to
a lower voltage and taken to customers.
5.13 A transmission network overlay exists in the Darwin area to transport electricity
produced at three power station locations (Channel Island; Weddell and
Berrimah) to primary load centres via two 132 kV transmission lines and seven 66 kV
zone substations. This network is also connected with power stations and loads at
Katherine and Pine Creek via a single 132 kV line from Channel Island.
5.14 The design of this transmission network is largely radial, from power stations to load
centres, with only a limited number of alternative flow paths. The Commission
anticipates that future reviews will examine plans for the development of this
transmission overlay to align practices with those of other jurisdictions. Relevant
practices might include plans for alternative flow paths and arrangements to minimise
the risk of network collapse and maximise the ability of the network to manage major
incidents without the collapse of the network.
5.15 The Commission considers that effective monitoring of power system performance
requires reporting on the performance of those network assets that have the
transmission like characteristic of linking generation and zone substations. The
Commission will examine the information that could be reported as part of the Review
of Electricity System Planning, Monitoring and Reporting.
Network planning and reliability
5.16 The Commission has reported on electricity network planning arrangements and
reliability since the 2004-05 Review, focusing on the effectiveness of arrangements
determining network performance standards and reliability.
5.17 At the time, the Commission noted:
For all practical purposes, power system planning and reliability (including that for
transmission and distribution networks) continues to be managed…as an internal
matter by Power and Water.
This is inconsistent with generally accepted industry practice. Among a number of
disadvantages, it blurs the distinction between commercial interests and the public
interest, makes the planning and investment process opaque and increases the risk
that investment decisions may be sub-optimal from a power system perspective.
While acknowledging that Power and Water may have achieved relatively good system
reliability outcomes to date in a harsh environment (as evidenced in the most recent
industry statistics), the Commission is not in a position to provide an assessment of the
prospective capacity and reliability of the power system as a whole in the Territory
(including that for transmission and distribution networks) while differences with
industry practice in other jurisdictions continue.22
22
Utilities Commission, December 2005, Annual Power System Review, page 5.
53
2008-09 Power System Review March 2010
5.18 In the 2007-08 Review, the Commission noted that the management of power system
reliability had been given specific focus by the supply interruptions customers
experienced in September and October 2008 as a result of events at the Casuarina
zone substation, and the subsequent findings and conclusions of the Davies Enquiry.
In particular, the Commission noted that the Davies Enquiry found that procedures for
monitoring and reporting the condition of key assets were deficient and the resulting
level of equipment maintenance was assessed as below the standard required to meet
good industry practice.23
5.19 For the 2007-08 Review, the Commission requested that PWC Networks provide
information on network planning methods and network asset capacity. This information
request was similar to that reported by network operators elsewhere in Australia to
meet regulatory reporting obligations. PWC Networks provided the Commission with a
Network Planning and Reliability Report that was released along with the 2007-08
Review, but was not subject to analysis or comment by the Commission.
5.20 The Commission requested that PWC Networks update the Network Planning and
Reliability Report for this Review. The Commission has undertaken some analysis of
the data, but notes that more comprehensive assessment is planned for future
Reviews.
5.21 Some of the key points of the November 2009 Network Planning and Reliability Report
are:
• PWC Networks is investing $287 million over the period 2009-10 to 2013-14 (2009-10 SCI) to improve reliability and meet projected demand growth;
• the Network Planning Criteria, established under the Electricity Networks (Third Party Access) Code, are being reviewed with the intention of ensuring the associated arrangements are robust, prescriptive and more closely aligned with the planning criteria used in the NEM; and
• PWC Networks is working toward extending measurement of network reliability from the feeder level to an asset class level to better identify the source of electricity interruptions and target maintenance programs accordingly.24
5.22 The Commission is aware that PWC is putting significant effort into improving planning
and asset management practices, including through the RAMP and the Asset
Management Capability project. The Commission will also examine network planning
and reliability during 2010 in response to a request by the Treasurer to review and
report on:
• the adequacy of current system performance monitoring and reporting arrangements under the Electricity Reform Act, and appropriate network and generation reliability standards for performance monitoring; and
• the efficiency of system planning and market operation arrangements, including the role and structure of the PWC system control unit.
5.23 PWC Networks assesses the adequacy of network assets by comparing forecast peak
demand with the firm capacity of the network, which is set using the N-1 standard. The
23
Utilities Commission, March 2009, Annual Power System Review, page 12.
24 Power and Water Corporation, November 2009, Power Networks Network Planning and Reliability Report.

54
2008-09 Power System Review March 2010
N-1 planning standard means that supply should be maintained to all customers
following the loss of any single item of plant such as transmission line, zone substation
transformer or feeder circuit breaker. If forecast demand (MVA) is greater than the
minimum firm capacity (MVA), there is a risk of loss of load, and augmentation of the
network may be required. However, PWC Networks notes that the N-1 standard cannot
be met in some situations, such as rural areas that are supplied by a single radial
distribution line.
5.24 PWC Networks notes in the November 2009 Network Planning and Reliability Report
that there is not a consistent methodology applied by network operators for measuring
load at risk and asks the Commission for guidance on a preferred methodology. The
Commission is likely to consider this issue as part of the Review of Electricity System
Planning, Monitoring and Reporting during 2010.
5.25 In light of the anticipated changes to network planning and reliability criteria due to
work planned for 2010, the Commission does not consider a detailed overview of
existing arrangements is necessary as part of the 2008-09 Review. The Commission
expects that future Reviews (or other Commission papers) will report more
comprehensive information on network planning and reliability outcomes.
Forecast electricity demand and network capacity-demand balance
5.26 The Network Planning and Reliability Report indicated that PWC Networks is
forecasting peak demand growth of 2.5 per cent per year on average across the
Territory, with higher than average load growth forecast in areas such as the Darwin
central business district, Palmerston and East Arm peninsula. The specific demand
growth rates for these areas and underlying assumptions are not provided.
5.27 The Network Planning and Reliability Report included details of the historical (2005-06
to 2008-09) and forecast (2009-10 to 2013-14) demand from, and capacity of the
30 zone substations in the Darwin-Katherine, Alice Springs and Tennant Creek
systems. This data is provided in full in Appendix A.
5.28 The Commission has not independently tested the PWC Networks peak demand
forecasts, and cannot assess the capacity of network assets relative to forecast
demand. In particular, the Commission does not have sufficient data on the condition of
network assets, and the associated capability of these assets to maintain security of
supply. The Commission will review local load forecasts and the implications for the
capital and operating program as part of the next network pricing determination
process.

55
2008-09 Power System Review March 2010
5.29 Table 5.2 below provides a summary of the data in Appendix A, focusing on the 8 zone
substations where peak demand is forecast to be greater than the minimum firm
capacity using the N-1 standard in the period 2008-09 to 2013-14.
Table 5.2: Selected zone substation reserve margin at N-1 capacity (MW), 2008-09 to 2013-14
Substation 2008-09 2009-10 2010-11 2011-12 2012-13 2013-14
Palmerston 11/22 kV -5.3 -5.6 -6.0 -6.3 -6.7 -7.0
Weddell 66/22 kV 1.1 -4.7 -4.9 -5.2 -5.4 -5.7
Mary River 66/22 kV -1.3 -1.3 -1.4 -1.4 -1.4 -1.5
Manton 132/22 kV -3.3 -3.3 -3.4 -3.4 -3.4 -3.5
Batchelor 132/22 kV -11.3 -11.6 -11.8 -12.1 -12.4 -12.6
Katherine 132/22 kV -1.2 -1.9 -2.6 -3.4 -4.1 -4.6
Frances Bay 66/11 kV 0.0 -17.2 -18.1 -19.0 -20.0 -20.4
Union Reef 66/11 kV -5.4 -5.5 -5.7 -5.8 -5.9 -6.0
Source: Power and Water Corporation, November 2009, Power Networks Network Planning and Reliability Report
5.30 Using the minimum firm capacity based on the ratings of the substation transformers,
the reserve margin of these 8 substations could be insufficient at times of forecast peak
demand. As these substations have one transformer, N-1 is effectively zero, and the
loss of the transformer, at times of high demand, would result in some load shedding,
unless load can be shared between substations through the network. The Commission
expects to examine the planning criteria and decision making processes for
determining adequate reserve margin during 2010.
Response to forecast demand growth
5.31 PWC Networks has advised that the Archer zone substation is currently being
constructed at a forecast cost of $29.8 million between 2009-10 and 2010-11. This
substation will provide an alternative power supply to the Palmerston zone substation
at 11 kV, and will act as a reserve power supply to the Palmerston area in the event of
a failure at the Palmerston zone substation.
5.32 The Weddell-Archer-Hudson Creek 66 kV line began construction in 2008-09 and is
expected to cost $13.5 million between 2008-09 and 2010-11. The construction of the
66 kV overhead line between the Weddell 66 kV Switching Station, the Archer zone
substation and the Hudson Creek Terminal Station was considered the only effective
way to ensure full output from Weddell power station is maintained at N-1 capacity.
5.33 PWC Networks has advised that installation of a second zone transformer and 66 kV
lines to the Frances Bay zone substation will commence in 2011-12 at a forecast cost
of $13.7 million. The project has been commissioned to improve the security of power
supply for both the zone substation and the CBD area.
5.34 PWC has not provided any information to the Commission outlining its plans to meet
the expected supply shortfalls for the Mary River, Manton, Batchelor, Katherine or
Union Reef substations. The Commission will investigate this further and findings will
be reported in future reviews. The Commission notes that conventional industry

56
2008-09 Power System Review March 2010
practice means the N-1 security criteria is not met in all circumstances, particularly in
those locations where the loss of load is not critical and where the cost of providing
redundant capacity is relatively high.
5.35 PWC has developed a masterplan for the implementation of new zone substations to
meet Darwin-Katherine and Alice Springs system requirements.25 The following
considerations are taken into account in determining the timing and location of new
substations:
• the need to maintain a secure and reliable electricity supply;
• national and international economic conditions;
• likely connection of significant new customers;
• increase in load from existing customers; and
• prospective new large commercial, industrial and residential developments.
5.36 PWC Networks indicates that the response to forecast demand growth will involve a
combination of network and non-network solutions:
• the PWC Networks demand management strategy is in a formative stage, and is to be developed over the coming years. Key areas identified for demand management include energy conservation, tariff structure, power factor correction, load shifting and embedded generation;
• PWC Networks will consider embedded generation as part of the broader demand management strategy, and notes that the power purchase agreements with Pine Creek, Shoal Bay and Brewer Estate power stations provide additional capacity. PWC continues to investigate if there is other capacity that might be available from commercial customers with standby generation in the Darwin-Katherine system. The Commission understands that PWC can make arrangements for the Department of Defence to self generate if necessary; and
• PWC Networks is spending an estimated $287 million from 2009-10 to 2013-14 augmenting and maintaining existing assets, and constructing new network assets.26
25
Power and Water Corporation, Energy and Demand Forecasting and Planning Framework, Assumptions and Methodology.
26 Power and Water Corporation, November 2009, Power Networks Network Planning and Reliability Report, page
6-7.

57
2008-09 Power System Review March 2010
Network performance
5.37 This section reports on network performance for the Darwin-Katherine, Alice Springs
and Tennant Creek systems in 2008-09 against the indicators specified in the
Electricity Standards of Service Code, and compares this to historical results and the
relevant standard.
5.38 This section also includes network related incidents reported by the System Controller
for January to June 2009.
5.39 The Electricity Standards of Service Code requires PWC to report annually on actual
network performance against the defined standards. The performance indicators for
electricity networks are:
• system average interruption duration index (SAIDI), which is the average minutes of off supply per customer;
• system average interruption frequency index (SAIFI), which is the average number of interruptions per customer;
• customer average interruption duration index (CAIDI), which is the average interruption duration per customer;
• number of and percentage of customers on feeders on interconnected networks that experience more than 15 interruptions a year, and the percentage of customers affected;
• number of feeders on interconnected networks that experience more than 1500 minutes of interruptions a year;
• number of and percentage of customers on feeders on radial networks that experience more than 27 interruptions a year, and the percentage of customers affected; and
• number of feeders on radial networks that experience more than 2500 minutes of interruptions a year.
5.40 PWC reports that the agreed standard was breached for the following indicators in
2008-09:
• Darwin network SAIDI;
• Darwin network SAIFI;
• Tennant Creek network CAIDI;
• Alice Springs network SAIDI;
• Alice Springs network SAIFI;
• Alice Springs network CAIDI;
5.41 According to the information reported by PWC for 2008-09, PWC’s network
performance recorded one consecutive breach (based on adjusted data). The breach
was for Alice Springs Network CAIDI. The standard average interruption duration per
customer of 37 minutes was exceeded in 2008-09 (50 minutes) and in
2007-08 (47 minutes).
5.42 Overall, the majority of customers in the Territory experienced worse network
performance in 2008-09 compared to 2007-08, mainly due to events at Casuarina zone
substation in September and October 2008 and a severe storm in Alice Springs in
September 2008. Although the reporting may conceal pockets of very poor

58
2008-09 Power System Review March 2010
performance, the reliability of the worst performing feeders, in each region has
improved in recent years (between 2006-07 and 2008-09) compared with previous
years.
Network incidents
5.43 To provide some context to the network performance in the Darwin-Katherine system
during 2008-09, table 5.3 briefly describes the major network related incidents in the
Darwin-Katherine system reported by the System Controller for January to June
2009.27
Table 5.3: Major network power system incidents, January to June 2009
Date Description
1 January Manton zone substation outage due to CB Fail protection
17 January HC-CZ 66 kV Feeder trip and reclose
25 February WD-MM 66 kV Feeder trip *2
13 March BE-CA 66 kV Feeder trip and reclose
2 April 11 kV Bus outage at Berrimah zone substation
27 April 11 kV Bus outage at Casuarina zone substation
11 June Trip of City Zone Transformer 1 and bus outage of 11 kV Bus
Source: Power and Water Corporation, System Controller Half Year Report, January to June 2009.
5.44 As discussed in the Generation chapter, the Commission will be seeking further
information related to power system incidents, including the date, location and cause of
each event. This information will be provided in future reviews.
Excluded events
5.45 The Electricity Standards of Service Code allows PWC to adjust network performance
data to exclude days where there is a major interruption to reliability. The intention is to
remove events that are beyond the control of the network operator. Specifically:
The Regulated Electricity Entity may remove the effect of severe interruptions to supply
on its key reliability indicators, based on the “2.5 Beta method”28, in order to determine
the underlying network-related reliability performance. Such severe interruptions are
referred to as “network exclusion events”. When an interruption meets the definition of
a network exclusion event, the Regulated Electricity Entity must state the date the
event occurred and provide a satisfactory description of the reasons for the excluded
27
Power and Water Corporation: Half Year Report (January to June 2009). Page 4
28 The “2.5 Beta method” excludes natural events which are more than 2.5 standard deviations greater than the
mean of the log normal distribution of five regulatory years. On average, 3 to 4 days would be expected to be excluded each year.

59
2008-09 Power System Review March 2010
event. The values of the relevant system-wide reliability indicators must nevertheless
be reported in both unadjusted and adjusted terms.29
5.46 The 2.5 beta method is an objective statistics based methodology for identifying
outlying performance. Instances may arise where an event may not be a statistical
outlier, but is still an event that a network service provider cannot reasonably be
expected to prevent or avoid. Because of this, some regulators take the approach of
specifying a comprehensive list of events.30
5.47 Charts 5.1 to 5.16 show adjusted and unadjusted data. Where the information has
been provided, the Commission has noted the event that has been excluded.
Darwin region network performance
5.48 This section reports performance against the SAIDI, SAIFI and CAIDI indicators, as
well as feeder results for the Darwin region for 1999-00 to 2008-09. Although they are
part of the same system, network performance is reported separately for the Darwin
region and Katherine.
5.49 A major event day was recorded for Darwin on 2 October 2008 following a failure at the
Casuarina zone substation. SAIDI was adjusted downwards by 75 minutes.
Chart 5.1: SAIDI, Darwin, 1999-2000 to 2008-09
Source: Power and Water Corporation, Standards of Service, 2008-09
5.50 The agreed standard for the Darwin SAIDI is 220 minutes. This standard was breached
by the adjusted result in 2008-09 by 91 minutes.
5.51 In 2007-08 network reliability in the Darwin region was affected by Cyclone Helen,
which passed close by Darwin on 4 January 2008. PWC has indicated that this
accounted for 394 SAIDI minutes being added to the 2007-08 result.
5.52 PWC has advised that average minutes off supply (SAIDI) was greater than the
standard in 2008-09 primarily due to equipment failure in and around the Casuarina
66/11 kv zone substation in September and October 2008.
29 Electricity Standards of Service Code, Schedule 1, clause 1.6. 30
Refer Institute of Electrical and Electronic Engineers, Working Group on System Design, January 2003, Classification of Major Event Days.
220 213 209
133 149
209 231 225
611
386
217
311
0
100
200
300
400
500
600
700
99-00 00-01 01-02 02-03 03-04 04-05 05-06 06-07 07-08 08-09
220 Minutes
Minutes

60
2008-09 Power System Review March 2010
Chart 5.2: SAIFI, Darwin, 1999-2000 to 2008-09
Source: Power and Water Corporation, Standards of Service, 2008-09
5.53 The Darwin region average frequency of interruptions (SAIFI) of 6.2 interruptions
breached the agreed standard of an average of 4.2 interruptions in 2008-09. The
Darwin network SAIFI was adjusted downwards by 0.1 interruptions due to the major
event day on 2 October 2008. The adjusted 2008-09 result of 6.1 interruptions is the
highest in the decade, and is 45 per cent higher than the decade average of
4.2 interruptions. PWC attributes the high frequency of interruptions to the power
outages associated with problems at the Casuarina zone substation, and subsequent
outages to allow maintenance.
Chart 5.3: CAIDI, Darwin, 1999-2000 to 2008-09
Source: Power and Water Corporation, Standards of Service, 2008-09
5.54 The Darwin region CAIDI of 51 minutes in 2008-09 was 1 minute below the agreed
standard of 52 minutes. The average CAIDI for the decade was 51 minutes.
4.2
3.6
4.5
2.93.2
4.65.0
3.94.3
6.2
3.7
6.1
0
2
4
6
99-00 00-01 01-02 02-03 03-04 04-05 05-06 06-07 07-08 08-09
4.2 Interruptions
Interruptions
5260
47 47 47 46 4657
142
625951
0
50
100
150
99-00 00-01 01-02 02-03 03-04 04-05 05-06 06-07 07-08 08-09
52 Minutes
Minutes

61
2008-09 Power System Review March 2010
Chart 5.4: Percentage of consumers supplied by feeders that experience more than 15 interruptions per
year, Darwin Urban, 1999-2000 to 2008-09
5.55 The percentage of consumers in the Darwin urban region supplied by feeders that
experience more than 15 interruptions per year was 6 per cent in 2008-09, which is
better than the agreed standard of 27 per cent, as well as the decade average of
15 per cent.
Chart 5.5: Percentage of consumers supplied by feeders that experience more than 27 interruptions per
year, Darwin Rural, 1999-2000 to 2008-09
Source: Power and Water Corporation, Standards of Service, 2008-09
5.56 The percentage of consumers in the Darwin rural region supplied by feeders that
experience more than 27 interruptions per year was 17 per cent in 2008-09. The
average for the decade was 50 per cent.
34
27
19
7
1310
1614
5 6
0
10
20
30
40
99-00 00-01 01-02 02-03 03-04 04-05 05-06 06-07 07-08 08-09
27 per cent
%
50
75
88
3642 39
86
52
1017
0
20
40
60
80
100
99-00 00-01 01-02 02-03 03-04 04-05 05-06 06-07 07-08 08-09
50 per cent
%

62
2008-09 Power System Review March 2010
Katherine region network performance
5.57 This section reports performance against the SAIDI, SAIFI and CAIDI indicators, as
well as feeder results for the Katherine region for 1999-00 to 2008-09.
5.58 A major event day was recorded for the Katherine region on 12 May 2009 due to an
outage caused by a flashover on the 22 kV distribution board. This affected about
1 400 customers for 125 minutes, and SAIDI was adjusted by 53 minutes.
Chart 5.6: SAIDI, Katherine, 1999-2000 to 2008-09
Source: Power and Water Corporation, Standards of Service, 2008-09
5.59 The agreed standard for SAIDI performance in Katherine is 401 minutes. The SAIDI
performance in 2008-09 of 182 minutes is better than the agreed standard and an
improvement on the 222 minutes reported in 2007-08. The average SAIDI result for the
decade is 259 minutes.
5.60 PWC has indicated that a significant percentage of the feeder outages in the Katherine
region can be attributed to local bat colonies clustering on the poles. PWC has
responded by continuing the insulation of feeders in at risk areas. The Commission will
be monitoring the progress of this task and will report findings in future reviews.
Chart 5.7: SAIFI, Katherine, 1999-2000 to 2008-09
Source: Power and Water Corporation, Standards of Service, 2008-09
401
590
290
164209
253 271
104
315
235
178222
182
0
100
200
300
400
500
600
99-00 00-01 01-02 02-03 03-04 04-05 05-06 06-07 07-08 08-09
401 Minutes
Minutes
9.6
20.4
9.4
5.0 4.8
8.7
5.9
3.3
5.8 5.25.1 4.7 4.7
0
5
10
15
20
25
99-00 00-01 01-02 02-03 03-04 04-05 05-06 06-07 07-08 08-09
9.6 Interruptions
Interruptions

63
2008-09 Power System Review March 2010
5.61 The agreed standard for the Katherine SAIFI is an average of 9.6 interruptions per
customer. The 2008-09 adjusted result of 4.7 interruptions was better than the agreed
standard and the decade average of 7.6 interruptions. Katherine network SAIFI was
adjusted downwards by 0.5 interruptions due to the major event day on 12 May 2009.
5.62 PWC has reported that ongoing network upgrades and continuation of maintenance
programs in the Katherine region have contributed to the decrease in the number of
interruptions.
Chart 5.8: CAIDI, Katherine, 1999-2000 to 2008-09
Source: Power and Water Corporation, Standards of Service, 2008-09
5.63 The Katherine region CAIDI of 39 minutes in 2008-09 was better than the agreed
standard of 42 minutes, however was worse than the average CAIDI for the decade of
37 minutes.
Chart 5.9: Percentage of consumers supplied by feeders that experience more than 27 interruptions per
year, Katherine, 1999-2000 to 2008-09
Source: Power and Water Corporation, Standards of Service, 2008-09
5.64 The percentage of consumers in the Katherine region supplied by feeders that
experience more than 27 interruptions per year was 4 per cent in 2008-09, which is
better than the minimum agreed standard of 50 per cent, as well as the decade
average of 24 per cent, which includes the outlier in 2000-01.
42
2931
33
44
29
46
31
54
45
40
47
39
0
10
20
30
40
50
60
99-00 00-01 01-02 02-03 03-04 04-05 05-06 06-07 07-08 08-09
42 Minutes
Minutes
14
83
41 42
19 19
9
05 4
0
20
40
60
80
100
99-00 00-01 01-02 02-03 03-04 04-05 05-06 06-07 07-08 08-09
50 per cent
%

64
2008-09 Power System Review March 2010
Tennant Creek network performance
5.65 This section reports performance against the SAIDI, SAIFI and CAIDI indicators for
Tennant Creek for 1999-00 to 2008-09.
Chart 5.10: SAIDI, Tennant Creek, 1999-2000 to 2008-09
Source: Power and Water Corporation, Standards of Service, 2008-09
5.66 The minimum agreed standard for SAIDI in Tennant Creek is 411 minutes. The SAIDI
performance in 2008-09 of 245 minutes is better than the agreed standard, however
was worse than the decade average of 148 minutes.
5.67 PWC has indicated that the standard for Tennant Creek may no longer reflect the
operating environment of the region.
Chart 5.11: SAIFI, Tennant Creek, 1999-2000 to 2008-09
Source: Power and Water Corporation, Standards of Service, 2008-09
5.68 The agreed standard for the Tennant Creek SAIFI is an average of 9.8 interruptions
per customer. The 2008-09 result of 4.2 interruptions is better than the agreed
standard, as well as the decade average of 4.6 interruptions.
5.69 PWC advise that ongoing network upgrades and the continuation of maintenance
programs in Tennant Creek have contributed to the decrease in the number of
interruptions.
411
304
155
32
7241
331
181
245
0
100
200
300
400
500
99-00 00-01 01-02 02-03 03-04 04-05 05-06 06-07 07-08 08-09
411 Minutes
Minutes
9.8
14.2
2.73.2
2.6
1.20.1
1.3
6.6
4.2
0
5
10
15
99-00 00-01 01-02 02-03 03-04 04-05 05-06 06-07 07-08 08-09
9.8 Interruptions
Interruptions

65
2008-09 Power System Review March 2010
Chart 5.12: CAIDI, Tennant Creek, 1999-2000 to 2008-09
Source: Power and Water Corporation, Standards of Service, 2008-09
5.70 The Tennant Creek CAIDI in 2008-09 of 58 minutes was worse than the agreed
standard of 41.8 minutes, as well as the decade average of 33 minutes.
42
21
58
10
27
3330
2427
58
0
10
20
30
40
50
60
70
99-00 00-01 01-02 02-03 03-04 04-05 05-06 06-07 07-08 08-09
42 Minutes
Minutes

66
2008-09 Power System Review March 2010
Alice Springs network performance
5.71 This section reports performance against the SAIDI, SAIFI and CAIDI indicators, as
well as feeder results for Alice Springs for 1999-00 to 2008-09
5.72 A major event day was recorded for Alice Springs on 22 September 2008 when strong
wind and flying debris caused by a severe storm caused power outages on a number
of feeders. SAIDI was adjusted downwards by 439 minutes.
Chart 5.13: SAIDI, Alice Springs, 1999-2000 to 2008-09
Source: Power and Water Corporation, Standards of Service, 2008-09
5.73 The agreed standard for the Alice Springs SAIDI is an average of 108 minutes per
customer. The 2008-09 result of 154 minutes is worse than the agreed standard, as
well as the decade average of 95 minutes.
Chart 5.14: SAIFI, Alice Springs, 1999-2000 to 2008-09
Source: Power and Water Corporation, Standards of Service, 2008-09
5.74 The Alice Springs SAIFI exceeded the agreed minimum standard of an average
2.9 interruptions per customer in 2008-09, recording an average of 3.1 interruptions.
The 2008-09 result was also higher than the decade average of 2.5 interruptions. The
major event day on 22 September 2008 meant that Alice Springs network SAIFI was
adjusted downwards by 0.6 interruptions.
108
59 7148
79123 107 111
90
593
154
0
100
200
300
400
500
600
99-00 00-01 01-02 02-03 03-04 04-05 05-06 06-07 07-08 08-09
108 Minutes
Minutes
2.9
2.4 2.5
1.1
1.7
3.23.0 3.0
1.9
3.7
3.1
0
1
2
3
4
99-00 00-01 01-02 02-03 03-04 04-05 05-06 06-07 07-08 08-09
2.9 Interruptions
Interruptions

67
2008-09 Power System Review March 2010
Chart 5.15: CAIDI, Alice Springs, 1999-2000 to 2008-09
Source: Power and Water Corporation, Standards of Service, 2008-09
5.75 The Alice Springs CAIDI in 2008-09 of 50 minutes was above the agreed standard of
37.2 minutes, and the highest recorded performance of the past decade.
5.76 The Alice Springs CAIDI has exceeded the agreed standard in five of the past seven
years, with the average performance for the decade being 39 minutes.
Chart 5.16: Percentage of consumers supplied by feeders that experience more than 15 interruptions per
year, Alice Springs, 1999-2000 to 2008-09
Source: Power and Water Corporation, Standards of Service, 2008-09
5.77 The percentage of consumers in Alice Springs supplied by feeders that experience
more than 15 interruptions per year was 4 per cent in 2008-09, which is better than the
agreed standard of 10 per cent, as well as the decade average of 5 per cent.
3724 28
42 4739 36 37
47
160
50
0
50
100
150
200
99-00 00-01 01-02 02-03 03-04 04-05 05-06 06-07 07-08 08-09
37 Minutes
Minutes
4
65
4
6
1
4
13
4 4
0
2
4
6
8
10
12
14
99-00 00-01 01-02 02-03 03-04 04-05 05-06 06-07 07-08 08-09
10 per cent
%
68
2008-09 Power System Review March 2010
CHAPTER 6
Customer Service Indicators
6.1 This chapter reports on customer service performance for the Darwin-Katherine, Alice
Springs and Tennant Creek systems in 2008-09, and reviews this against the agreed
standards specified in the Electricity Standards of Service Code.
Table 6.1: New connections not provided to existing supply properties within 24 hours
NT wide (%) Agreed Standard 2005-06 2006-07 2007-08 2008-09
All Customers 2 0 1 1 0.8
Source: Power and Water Corporation, Standards of Service, 2008-09
6.2 The agreed standard for the percentage of new connections not provided to existing
supply properties within 24 hours is 2 per cent. In 2008-09 there were 5 166 new
connections, of which 40 were not made within the required timeframe, this equates to
0.77 per cent, which is better than the agreed standard.
Table 6.2: New connections not provided to new subdivisions in urban areas within 5 working days
NT wide (%) Agreed Standard 2005-06 2006-07 2007-08 2008-09
All Customers 10 7 19.3 16 8.7
Source: Power and Water Corporation, Standards of Service, 2008-09
6.3 In 2008-09 the percentage of new connections not provided to new subdivisions in
urban areas within five working days was 8.7 per cent, which is better than the agreed
standard of 10 per cent, as well as the reporting period average of 12.8 per cent. In
2008-09 there were a total of 1 828 new connections to new subdivisions, of which 159
were not completed within the specified timeframe.
6.4 During the 2006-07 and 2007-08 reporting periods the agreed standard for the number
of new subdivision connections was breached, with PWC attributing this to a significant
increase in the total number of new connections required.
Table 6.3: New connections not provided to new subdivisions where minor extensions or augmentation is
required in urban areas within 10 weeks
NT wide (%) Agreed Standard 2005-06 2006-07 2007-08 2008-09
All Customers 35 30 32 32 66.5
Source: Power and Water Corporation, Standards of Service, 2008-09
6.5 The agreed standard for new connections not provided to new subdivisions where
minor extensions or augmentation is required in urban areas within 10 weeks is
35 per cent. In 2008-09, 66.5 per cent of new connections took more than 10 weeks to
provide where minor extension or augmentation was required. In 2008-09 there were a
total of 158 new connections, with 105 of these connections not completed within the
specified 10 week period.

69
2008-09 Power System Review March 2010
6.6 PWC has indicated that failure to meet the agreed standard for 2008-09 breach is due
to maintenance commitments within RAMP and the associated resource shortages.
Table 6.4: The number and percentage of telephone calls responded to within 20 seconds from when the
customer selects to speak to a human operator
NT wide (%) Agreed Standard 2005-06 2006-07 2007-08 2008-09
All Customers 58 679 NA 96 562 78 453 87 013
All Customers 63 76 69 58 62
Source: Power and Water Corporation, Standards of Service, 2008-09
6.7 In 2008-09 the percentage of telephone calls responded to within 20 seconds from
when the customer selects to speak to a human operator was 62 per cent, which is
slightly worse than the agreed standard which requires 63 percent of calls to be
answered within the specified time limit.
6.8 All calls to PWC concerning electricity are recorded, including retail enquiries about
accounts and other matters, as well as network related calls, e.g. regarding
connections and interruptions to supply.
6.9 PWC advises that the failure to meet the agreed standard in 2008-09 was due to
system and resource constraints as well as an increase in total volume of telephone
calls received. The Commission is advised that several process changes were
implemented by PWC in the second half of 2008-09 to address this standard, including
software upgrades, staff relocation and expanded training for new staff.
Table 6.5: Total customer complaints
NT Wide Agreed Standard 2005-06 2006-07 2007-08 2008-09
Darwin 1 778 1 718
Katherine 121 160
Tennant Creek 42 39
Alice Springs 391 318
All Customers 5 146 3 000 1 917 2 332 2 235
Source: Power and Water Corporation, Standards of Service, 2008-09
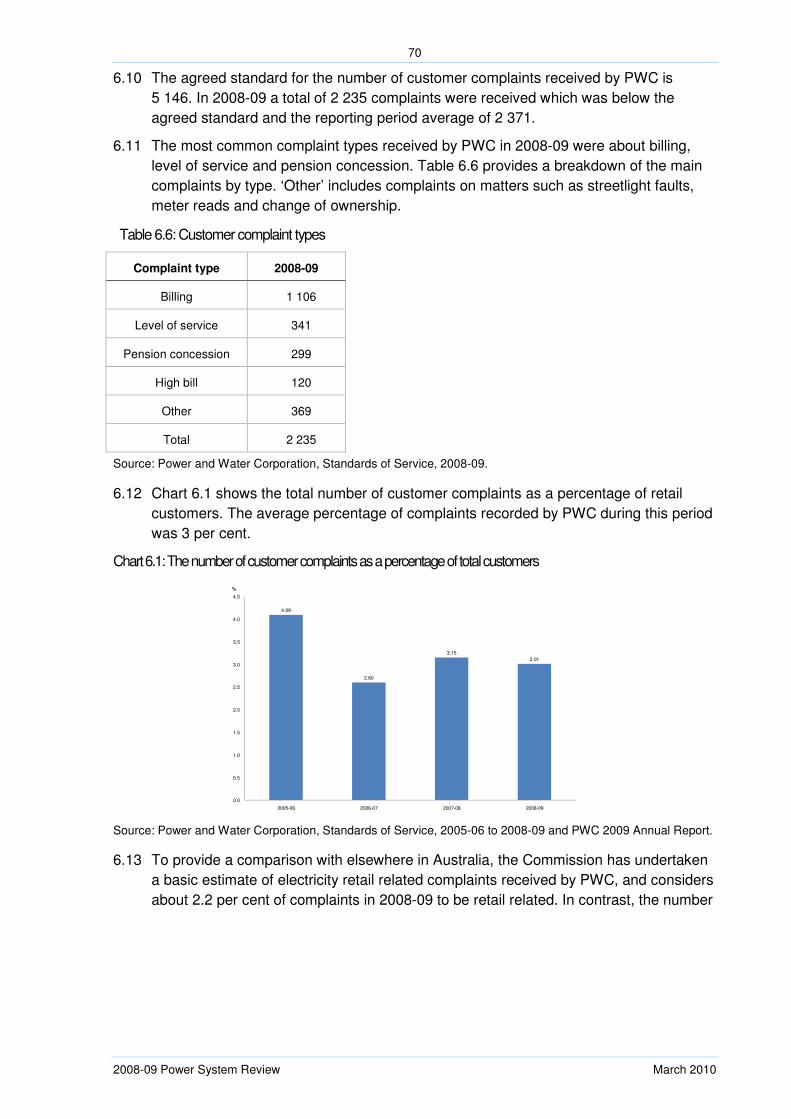
70
2008-09 Power System Review March 2010
6.10 The agreed standard for the number of customer complaints received by PWC is
5 146. In 2008-09 a total of 2 235 complaints were received which was below the
agreed standard and the reporting period average of 2 371.
6.11 The most common complaint types received by PWC in 2008-09 were about billing,
level of service and pension concession. Table 6.6 provides a breakdown of the main
complaints by type. ‘Other’ includes complaints on matters such as streetlight faults,
meter reads and change of ownership.
Table 6.6: Customer complaint types
Complaint type 2008-09
Billing 1 106
Level of service 341
Pension concession 299
High bill 120
Other 369
Total 2 235
Source: Power and Water Corporation, Standards of Service, 2008-09.
6.12 Chart 6.1 shows the total number of customer complaints as a percentage of retail
customers. The average percentage of complaints recorded by PWC during this period
was 3 per cent.
Chart 6.1: The number of customer complaints as a percentage of total customers
Source: Power and Water Corporation, Standards of Service, 2005-06 to 2008-09 and PWC 2009 Annual Report.
6.13 To provide a comparison with elsewhere in Australia, the Commission has undertaken
a basic estimate of electricity retail related complaints received by PWC, and considers
about 2.2 per cent of complaints in 2008-09 to be retail related. In contrast, the number
4.09
2.60
3.15
3.01
0.0
0.5
1.0
1.5
2.0
2.5
3.0
3.5
4.0
4.5
2005-06 2006-07 2007-08 2008-09
%

71
2008-09 Power System Review March 2010
of customer complaints received by retailers in the NEM in 2008-09 as a percentage of
customers was less than one percent.31
31
Australian Energy Regulator, State of the Energy Market 2008, page 194

72
2008-09 Power System Review March 2010
Appendix A: Substation capacity 2008-09
Actual Forecast
Zone Substations - Number Max. Min. Max. Firm Min. Firm
Northern & Southern Regions of Capacity Capacity Capacity Capacity Demand Demand Demand Demand Demand Demand Demand Demand Demand
Transformers MVA1
MVA1
MVA2
MVA2 MVA MVA MVA MVA MVA MVA MVA MVA MVA
Palmerston 11/22kV 1 7.5 7.5 0.0 0.0 4.5 4.7 5.0 5.3 5.6 6.0 6.3 6.7 7.0
McMinns 66/22kV 3 40.5 30.0 27.0 20.0 16.3 16.7 17.2 17.7 18.1 18.6 19.1 19.6 20.1
Weddell 66/22kV 2 10.0 10.0 5.0 5.0 3.6 3.7 3.8 3.9 9.7 9.9 10.2 10.4 10.7
Humpty Doo 66/22kV 3 7.5 7.5 5.0 5.0 1.4 1.5 1.5 1.5 1.6 1.6 1.7 1.7 1.7
Mary River 66/22kV 1 5.0 5.0 0.0 0.0 1.2 1.2 1.3 1.3 1.3 1.4 1.4 1.4 1.5
Marrakai 66/22kV 2 5.0 5.0 2.5 2.5 - - - - 1.0 1.5 1.5 1.6 1.6
Manton 132/22kV 1 27.0 20.0 0.0 0.0 3.2 3.2 3.3 3.3 3.3 3.4 3.4 3.4 3.5
Batchelor 132/22kV 1 27.0 20.0 0.0 0.0 10.5 10.7 11.0 11.3 11.6 11.8 12.1 12.4 12.6
Pine Creek 11/66kV 2 40.0 40.0 20.0 20.0 3.5 3.6 3.7 3.8 3.9 4.0 4.1 4.2 4.3
Katherine 132/22kV 2 54.0 40.0 27.0 20.0 26.2 26.8 27.5 28.2 28.9 29.6 30.4 31.1 31.6
Berrimah 66/11kV 2 76.0 50.0 38.0 25.0 30.3 30.9 31.6 32.2 32.9 33.4 23.3 15.0 16.0
Leanyer 66/11kV3 2 54.0 40.0 27.0 20.0 - - - - - - 10.1 10.3 10.5
Casuarina 66/11kV 3 114.0 75.0 76.0 50.0 37.4 38.0 38.6 39.2 44.8 45.6 26.0 26.7 27.1
Snell Street 66/11kV 4 47.0 40.0 35.0 30.0 31.0 31.5 31.9 32.4 32.9 33.4 33.9 34.4 34.9
East Arm 66/11kV3 2 54.0 40.0 27.0 20.0 - - - - - - - 11.3 11.5
City Zone 66/11kV 3 120.0 90.0 80.0 60.0 49.4 51.9 54.4 56.1 43.6 45.8 42.0 43.0 44.0
Frances Bay 66/11kV3 1 40.0 30.0 0.0 0.0 - - - - 17.2 18.1 19.0 20.0 20.4
66/11kV tx 2 (2012) 2 80.0 60.0 40.0 30.0 - - - - - - 25.0 26.0 27.0
Centre Yard 66/11kV 2 1.0 1.0 0.5 0.5 0.4 0.5 0.5 0.5 0.5 0.5 0.5 0.5 0.5
Radio Australia 66/11kV 2 9.0 7.0 4.5 3.5 0.5 0.6 0.6 0.6 0.6 0.6 0.6 0.6 0.6
Palmerston 66/11kV 2 80.0 60.0 40.0 30.0 31.3 33.2 35.1 37.2 22.5 23.8 25.2 26.7 27.8
Archer 66/11kV3 2 54.0 40.0 27.0 20.0 - - - - 16.9 17.9 18.9 20.1 20.9
Pine Creek 11/22kV 4 10.0 10.0 7.5 7.5 0.6 0.7 0.7 0.7 0.7 0.7 0.7 0.8 0.8
Union Reef 66/11kV 1 12.5 10.0 0.0 0.0 5.0 5.1 5.3 5.4 5.5 5.7 5.8 5.9 6.0
Brocks Creek 66/11kV 2 7.0 7.0 3.5 3.5 1.5 1.5 1.6 1.6 1.7 1.7 1.7 1.8 1.8
Cosmo Howley 66/11kV 2 15.0 15.0 7.5 7.5 0.2 0.2 0.2 0.2 0.2 0.3 0.3 0.3 0.3 Alice Springs - Lovegrove 22/11kV 3 35.0 25.0 20.0 15.0 14.6 14.9 15.1 15.1 15.5 15.9 16.3 16.7 17.1
Alice Springs - Sadadeen 22/11kV4 2 38.0 30.0 19.0 15.0 n/a n/a n/a n/a n/a n/a n/a n/a n/a
Alice Springs - Ron Goodin4 n/a n/a n/a n/a n/a n/a n/a n/a n/a n/a n/a n/a n/a n/a
Tennant Creek4 2 15.0 15.0 7.5 7.5 n/a n/a n/a n/a n/a n/a n/a n/a n/a
Network - Substation Totals 61 1085.0 830.0 546.5 417.5 272.8 281.2 289.8 297.5 320.7 331.2 339.7 352.9 361.8
Notes:
1. Maximum and minimum capacity are based on the ratings of the substation transformers.
2. Based on N-1 contingency criteria (i.e. the loss of one transformer). Example: Pine Creek Zone Substation consists of 2 transformers rated at 20 MVA; if one transformer fails the minimum firm capacity is 20 MVA.
3. Actual and forecast demand commences from completion of construction of the zone substation.
4. Sadadeen, Ron Goodin and Tennant Creek are stations with generators. Loading on the transformers depends on the generators dispatched.
2006 2007 2012 2013 20142008 2009 2010 2011