ch 6 biomass - recinto universitario de mayagüezuprm.edu/aret/docs/ch_6_biomass.pdf · 6-6 table...
TRANSCRIPT

6-1
Chapter 6 Biomass Energy Resource Chapter 6 Biomass Energy Resource .......................................................... 6-1
6.1 Introduction ................................................................................. 6-3 6.2 Agricultural Biomass Energy Resource ............................................ 6-4
6.2.1 Availability of the Resource ..................................................... 6-4 6.2.2 Variability of the Resource .................................................... 6-11 6.2.3 Available commercial and prototype conversion technology to produce electricity using the resource ................................................. 6-11 6.2.4 Conversion Technology footprint ........................................... 6-15 6.2.5 Estimate of capital cost ......................................................... 6-15 6.2.6 Estimate of potential electric energy contribution .................... 6-20
6.3 Solid Waste Biomass Energy Resource .......................................... 6-22 6.3.1 Availability of the Resource ................................................... 6-22 6.3.2 Variability of the Resource .................................................... 6-26 6.3.3 Available commercial and prototype conversion technology to produce electricity using the resource ................................................. 6-26 6.3.4 Conversion Technology footprint ........................................... 6-31 6.3.5 Estimate of capital cost ......................................................... 6-32 6.3.6 Estimate of potential electric energy contribution .................... 6-33 6.3.7 References for Solid Waste Biomass Energy Resource ............. 6-35
Appendix A .............................................................................................. 6-36

6-2
Index of Figures Figure 6.2.1-1. Zones with agricultural potential in Puerto Rico. ------------------ 6-5 Figure 6.2.1-2. Agricultural Land use by region. ------------------------------------- 6-7 Figure 6.2.1-3. Biodiesel town requirements. -------------------------------------- 6-11 Figure 6.2.3-1. Fischer Tropsch Fermentation. ------------------------------------- 6-12 Figure 6.2.3-2. Racetrack for growing microalgae. -------------------------------- 6-13 Figure 6.2.3-3. Comparizon of photobioreactor and raceway production methods.
-------------------------------------------------------------------------------------- 6-14 Figure 6.2.3-4. Biorefinery Model. --------------------------------------------------- 6-15 Figure 6.2.5-1. Microalgae Economic Studies Summary. ------------------------- 6-18 Figure 6.2.5-2. Total costs for producing oils in larger ponds (>1,000 acres) 6-18 Figure 6.2.5-3. Carbon Market, PREPA ---------------------------------------------- 6-19 Figure 6.3.1-1. Potential of landfills for electricity generation ------------------ 6-24 Figure 6.3.1-2. Energy generation potential of these landfills ------------------- 6-25 Figure 6.3.3-1. Production of jet fuel using either gasification combined with
Fisher Tropsch or Pyrolysis with hydroprocessing. --------------------------- 6-28 Figure 6.3.5-1. Operating income lines required to recover the capital investment
of different facilities --------------------------------------------------------------- 6-33
Index of Tables Table 6.2.1-1. Land use for Puerto Rico, 2006. ............................................. 6-6 Table 6.2.1-2. Potential agricultural land, 2002. ............................................ 6-6 Table 6.2.1-3. Ethanol production by products. ............................................ 6-8 Table 6.2.1-4. Ethanol production by zone. .................................................. 6-9 Table 6.2.1-5. Productivity of different crops. ............................................. 6-10 Table 6.2.5-1. Investments in Biorefineries By DOE. ................................... 6-16 Table 6.2.5-2. Costs for biofuel production from microalgae. ....................... 6-17 Table 6.3.1-1. Municipal solid waste profile and projections in Puerto Rico, 2006.
....................................................................................................... 6-22 Table 6.3.1-2. Composting facilities for Puerto Rico. ................................... 6-25 Table 6.3.3-1. Biochemical conversion technologies .................................... 6-30 Table 6.3.3-2. Technology Supplier. .......................................................... 6-31 Table 6.3.6-1. Potential electric energy generation. .................................... 6-34
6-3
6.1 Introduction The Biomass Research and Development Act of 2000 (P.L. 106-224; Title III) defines biomass as “any organic matter that is available on a renewable or recurring basis, including agricultural crops and trees, wood and wood wastes and residues, plants (including aquatic plants), grasses, residues, fibers, and animal wastes, municipal wastes, and other waste materials.” [Schnepf] Biomass is the single renewable resource that has the potential to supplant the US liquid transportation fuels now and help create a more stable energy future. It should also result in new economic opportunities across the US nation. It is unique among renewable energy resources in that it can be converted to carbon-based fuels and chemicals, in addition to electric power. In his 2007 State of the Union address, President Bush challenged the nation to support a goal to reduce gasoline consumption by 20 percent in the next 10 years (20 in 10) to “reduce our addiction to oil.” Meeting these goals will require significant and rapid advances in biomass feedstock and conversion technologies; availability of large volumes of sustainable biomass feedstock; demonstration and deployment of large-scale, integrated biofuels production facilities; and development of an adequate biofuels infrastructure. Biofuels are liquid fuels produced from biomass. Types of biofuels include ethanol, biodiesel, methanol, and reformulated gasoline components. They are primarily used as transportation fuels for cars, trucks, buses, airplanes, and trains. As a result, their principal competitors are gasoline and diesel fuel. Unlike fossil fuels, which have a fixed resource base that declines with use, biofuels are produced from renewable feedstocks. Furthermore, under most circumstances biofuels are more environmentally friendly (in terms of emissions of toxins, volatile organic compounds, and greenhouse gases) than petroleum products. Supporters of biofuels emphasize that biofuel conversion plants generate value-added economic activity that increases demand for local feedstocks, which raises commodity prices, farm incomes, and rural employment. The conversion technologies refer to a wide array of biological, chemical, thermal (excluding incineration) and mechanical technologies capable of converting post-recycled residual solid waste into useful products and chemicals, green fuels such as hydrogen, natural gas, ethanol and biodiesel, and clean, renewable energy such as electricity. [Schnepf]
6-4
6.2 Agricultural Biomass Energy Resource As mentioned in the previous section biomass is defined as “any organic matter
that is available on a renewable or recurring basis, including agricultural crops
and trees, wood and wood wastes and residues, plants (including aquatic
plants), grasses, residues, fibers, and animal wastes, municipal wastes, and
other waste materials.” In this section waste (municipal, animal and other) will
not be considered. In section 6.3, municipal solid waste will be discussed in
detail.
6.2.1 Availability of the Resource According to PUTPR (Plan de Uso de Terrenos de Puerto Rico) there are several
categories assigned to the potential land usage in Puerto Rico that is not
available for urban developments. The two major categories are:
Suelo Rustico Especialmente Protegido (SREP): Suelo no contemplado
como urbano por su valor estético, arqueológico, ecológico, agrícola y natural.
These are protected due to their archeological, ecological, agricultural and/or
natural value.
Suelo Rustico Común (SRC): Suelo no contemplado para uso urbano ya que
hay suelo destinado para el uso urbano esperado. Different to SREP these lands
are not protected even though they can not be used for urban development.
In addition, there are two additional categories related to the agricultural
potential of a particular zone. These are referred to as:
Zonas de Alta Productividad Agrícola (ZAPA-1): ZAE’s (Zonas Agras
Ecológicas) que por la fertilidad, profundidad e historial de rendimiento agrícola

6-5
se consideran áreas de alto valor para la producción agrícola. These are
considered of high productivity potential given their historic performance.
Zonas de Alto Potencial Agrícola (ZAPA-2): ZAE’s con suelos de alto
potencial agrícola que bajo buenas practicas de manejo y conservación pueden
alcanzar rendimientos similares a ZAPA-1. Contrary to the previous category
these zones could become of high productivity if excellent agricultural practices
are implemented.
The following map shows all the zones according to PUTPR. In general, they
have identified approximately 570,000 and 465,000 cuerdas as ZAPA 1 & 2,
respectively. These correspond to approximately 650,000 and 530,000 acres.
Figure 6.2.1-1. Zones with agricultural potential in Puerto Rico.
Regarding the lands that are protected as of February 2006 they are given in the
following table:
6-6
Table 6.2.1-1. Land use for Puerto Rico, 2006.
Uso de Suelos # de Cuerdas% Total de Puerto Rico
% Total de la Categoria
Area de Valor Natural 701,992 32.276% Protegidas 238,149 10.950% 33.92%Sin porteccion 463,843 21.326% 66.08%
Areas de Valor Agricola 1,065,481 48.988% Protegidas 86,083 3.958% 8.08%Sin porteccion 979,398 45.030% 91.92%
Fuente: Plan de Uso de Terrenos - Febrero 2006
Notice that only 4% (86,000 cuerdas) of the agricultural land is protected. In
another relevant classification, the Department of Agriculture in 2002 determined
that there were approximately 690,000 cuerdas of potential agricultural land
without including the agricultural central region. This is shown in the following
table. We believe this was their last inventory study.
Table 6.2.1-2. Potential agricultural land, 2002. Region Cuerdas % Arecibo 160,552 23.25% San Juan 96,868 14.02% Caguas 99,141 14.35% Mayaguez 160,169 23.19% Ponce 173,963 25.19% Total 690,693 100% Fuente: Anotaciones sobre la agricultura de Puerto Rico, Censo de Agricultura, Puerto Rico 2002
Another interesting study was presented by agronomist Jessica Medina Muñiz
from the Guaynabo Experimental Station and Colegio de Ciencias Agrícolas from
UPRM on November 28, 2007 at the 1er Conversatorio Agrícola - Cumbre Social,
Inc.. She included the central region and her other regions were different than
those mentioned by the Department of Agriculture shown above. Notice,
however, that overall they identified over 500,000 cuerdas as agricultural soil
around the island.

6-7
Figure 6.2.1-2. Agricultural Land use by region.
On a related presentation, agronomist Luis Conte, on January 25, 2008 gave a
presentation to the UPRM Biorefinery team where he discussed the agricultural
lands from the west region that has immediate potential for agricultural use. He
proposed the following:
• EUREKA 11,000 CUERDAS
• IGUALDAD 2,500 CUERDAS
• COLOSO 1,800 CUERDAS
• LAJAS 12,000 CUERDAS
• TOTAL 27,300 CUERDAS
It should be mentioned that agronomist Conti has been working very closely with
the Department of Agriculture and Land Authority identifying alternatives for the

6-8
agricultural land in the west region especially in Aguada. Their focus, however,
has been towards sugar cane production.
Based on the above data, estimates were made regarding the potential
production of crops in those areas. For example, notice in the next table that the
maximum ethanol production from sugar cane is approximately 1,250
gallons/cuerda-year. This only considers the glucose or sugar component of the
sugar cane.
Table 6.2.1-3. Ethanol production by products.
Min (kL/(hec*año)) Max
(kL/(hec*año)) Min
(gal/(cuerda*año)) Max
(gal/(cuerda*año))Caña de Azucar 3.8 12 395 1,246 Yuca 0.5 4 52 415 Sorgo 1 5 104 519 Fuente:Biofuels Refining and Performance
Those productivities were used in the next table to calculate the ethanol
production potential for both ZAPA regions. Also, on this table the lignocellulosic
component of the sugar cane was included in the calculation of potential ethanol
conversion. This results in an overall production of 3.9 billion gallons per year
assuming a 3:1 conversion factor in order to include the lignocellulose versus
sugars alone.
6-9
Table 6.2.1-4. Ethanol production by zone.
Zona y potencial para Caña de Azucar
Zonas de Alta Productividad
Agrícola (ZAPA-1)
Zonas de Alto Potencial Agrícola
(ZAPA-2) Total Zonas
agricolas # de Cuerdas 569,342 466,656 1,035,998
Potencial de produccion con azucares y
almidones (MM galones) 710 582 1,291
Potencial de produccion con Lignocelulosa (MM galones)***
2,128 1,744 3,873
*** Lignocelulosa = Azucar / Almidon * 3
Another potential resource are microalgae derived products. Microalgae
represent a novel and effective source of biomass and oil for the manufacture of
bioethanol and C10+ biofuels. These are microscopic photosynthetic organisms
found in marine and freshwater environments. Microalgae are known to
accumulate high levels of natural oils and use CO2 as their sole carbon source [1-
4]. Algal biodiesel is one of the only avenues available for high-volume re-use of
CO2. The algae are classified according to their pigmentation, life cycle and basic
cellular structure. The four most abundant are Bacillariophyceae, Chlorophyceae,
Cyanophyceae and Chrysophyceae. They are also referred to as diatoms, green
algae, blue-green algae and golden algae. Microalgae biomass contains three
main components: protein, carbohydrates and natural oils. In addition, these
organisms are more efficient than higher plants utilizing solar energy because of
their simple cellular structure. Because the cells grow in aqueous suspension,
they have more efficient access to water, CO2, and other nutrients and are
capable of producing 30 times the amount oil per unit area of land, compared to
terrestrial oilseed crops. This is shown in the next table. According to National
Renewable Energy Laboratory (NREL), two hundred thousand hectares (less than
0.1% of climatically suitable land areas in the U.S.) could produce one quad of
fuel. Microalgae systems also use far less water than traditional oilseed crops.

6-10
Table 6.2.1-5. Productivity of different crops. Crop Kg oil/ha Litres oil/ha Lbs oil/acre US gal/acre
Avocado 2,217 2,638 1,980 282 Coconut 2,260 2,689 2,018 287 Oil palm 5,000 5,950 4,465 635
Chinese tallow 5,500 6,545 4,912 699 Algae 79,832 95,000 71,226 10,000
The characteristics of the algae to be used include the ability of the strains to
grow rapidly and have high C10+ productivity when growing under high light
intensity, high temperature, and in freshwater or saline waters, indigenous to the
area in which the commercial production facility could be located. In addition,
because it is not possible to control the weather in pond facilities, the best
strains should have good productivity under fluctuation of all of these factors.
Algae technology provides a means for recycling waste carbon from fossil fuel
combustion.
On a related topic diesel consumption in Puerto Rico is approximately 500 million
gallons per year. The following graph shows the extensions of land in terms of
municipalities that would be required to meet that demand. For example,
assuming 1.4 million gallons/year-1000 hectare (~600 gallons/acre-yr, palm oil)
would require approximately 11 municipalities. A topography factor of 2.5 was
assumed which is very aggressive regarding land availability. With microalgae
the land requirements would decrease to 1/15 of that area or less than a
municipality.
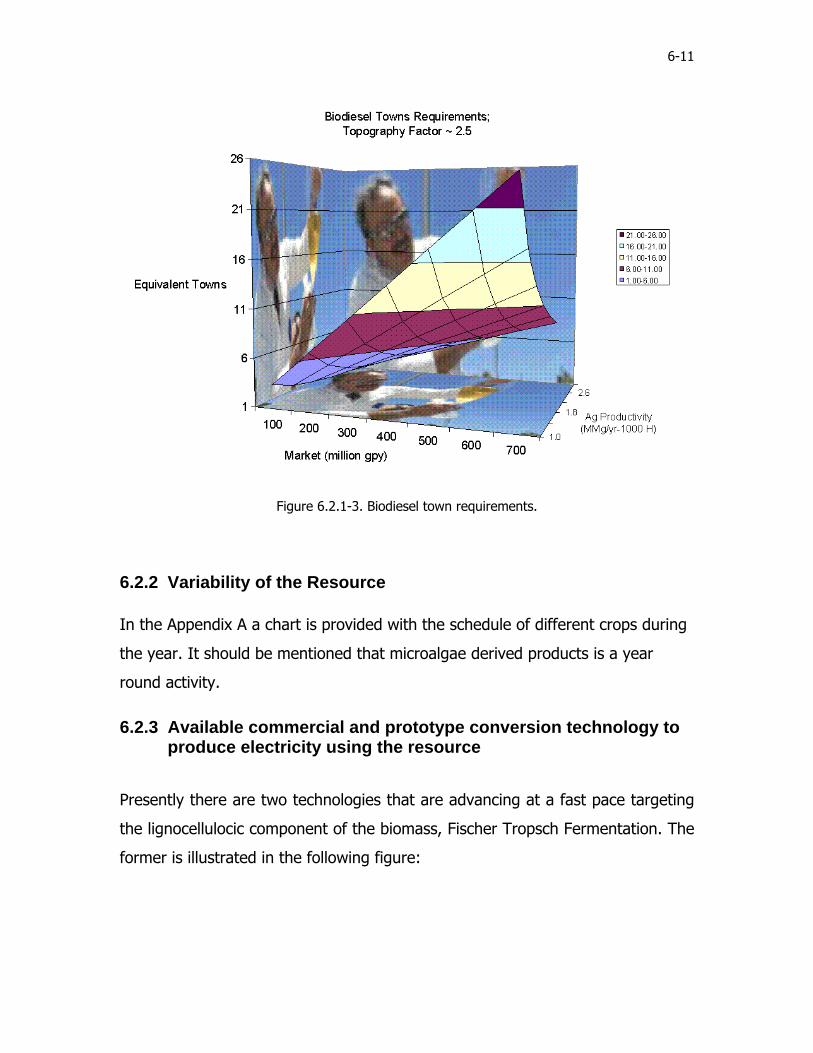
6-11
Figure 6.2.1-3. Biodiesel town requirements.
6.2.2 Variability of the Resource In the Appendix A a chart is provided with the schedule of different crops during
the year. It should be mentioned that microalgae derived products is a year
round activity.
6.2.3 Available commercial and prototype conversion technology to produce electricity using the resource
Presently there are two technologies that are advancing at a fast pace targeting
the lignocellulocic component of the biomass, Fischer Tropsch Fermentation. The
former is illustrated in the following figure:
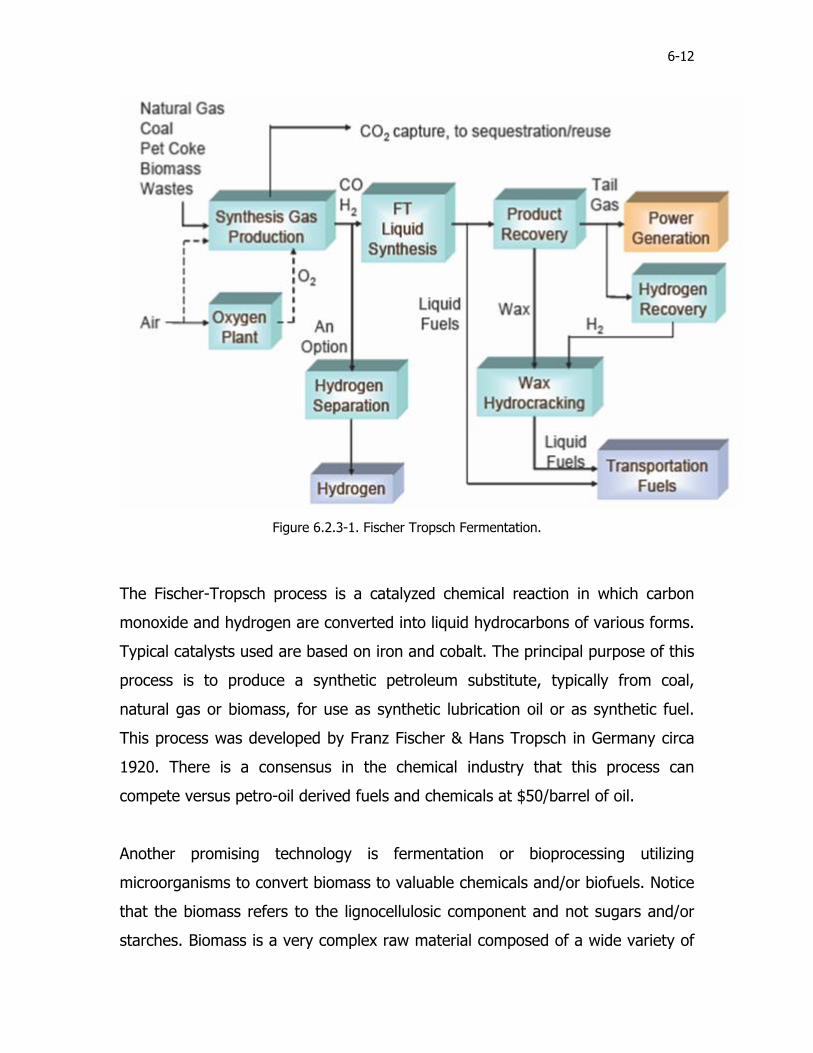
6-12
Figure 6.2.3-1. Fischer Tropsch Fermentation.
The Fischer-Tropsch process is a catalyzed chemical reaction in which carbon
monoxide and hydrogen are converted into liquid hydrocarbons of various forms.
Typical catalysts used are based on iron and cobalt. The principal purpose of this
process is to produce a synthetic petroleum substitute, typically from coal,
natural gas or biomass, for use as synthetic lubrication oil or as synthetic fuel.
This process was developed by Franz Fischer & Hans Tropsch in Germany circa
1920. There is a consensus in the chemical industry that this process can
compete versus petro-oil derived fuels and chemicals at $50/barrel of oil.
Another promising technology is fermentation or bioprocessing utilizing
microorganisms to convert biomass to valuable chemicals and/or biofuels. Notice
that the biomass refers to the lignocellulosic component and not sugars and/or
starches. Biomass is a very complex raw material composed of a wide variety of

6-13
compounds with C5 and C6 sugars and phenolics building blocks. This variety
has made it very difficult in identifying microorganisms capable of processing
these materials. In the Solid Waste Biomass Energy Resource section these and
other technologies are discussed in more detail.
The technology for growing and harvesting microalgae is obviously very different
than their soil counterparts. Typically, Algae, water and nutrients circulate
around a racetrack as shown in the figure. Paddlewheels provide the flow.
Figure 6.2.3-2. Racetrack for growing microalgae.
The algae are thus kept suspended in water. Algae are circulated back up to the
surface on a regular frequency. The ponds are kept shallow because of the need
to keep the algae exposed to sunlight and the limited depth to which sunlight
can penetrate the pond water. The ponds are operated continuously; that is,
water and nutrients are constantly fed to the pond, while algae-containing water
is removed at the other end. Some kind of harvesting system is required to
recover the algae, which contains substantial amounts of natural oil”. Another
alternative is using biophotoreactors which in theory could result in higher
productivities and better control. A comparison between raceway ponds and
biophotoreactors is shown in the next figure.

6-14
Figure 6.2.3-3. Comparizon of photobioreactor and raceway production methods.
It is important to mention that both biophotoreactors and racetrack ponds are
still in the development sage especially for production facilities in the hundreds
and thousands land requirements. Presently, commercial microalgae facilities are
used for producing specialty chemicals such as nutraceuticals, nutriceuticals, β-
carotene, vitamins, amino acids, omega acids, etc. These are typically in the 50 –
100 acre range. Notice that nutriceuticals are defined as one of a class of agents
advertised as having nutritional value as well as having an effect on biologic
functions. Also, nutraceuticals is a chemical substance or group of substances
that for legal purposes is defined as a nutrient but that is marketed and used for
the prevention or treatment of disease.
Based on the above discussion it is recommended that an integrated approach is
used for production and conversion of biomass to value added chemicals and
products including energy. This is known as a biorefinery. It is defined by the

6-15
National Renewable (NREL) as a facility that integrates biomass conversion
processes and equipment to produce fuels, power or chemicals from biomass.
UPRM in collaboration with Sustainable AgroBiotech Inc is proposing the model
below for Puerto Rico which integrates land crops with microalgae developments
for producing a wide variety of fuels and chemicals.
Figure 6.2.3-4. Biorefinery Model.
6.2.4 Conversion Technology footprint The major component of the footprint regarding Biomass Energy Resource is by
far the land and area requirements for the production of the biomass. This
applies to both soil crops and microalgae. These area requirements were
discussed in the previous section.
6.2.5 Estimate of capital cost As mentioned above, the production of biofuels and/or chemicals from biomass is
being considered using a biorefinery strategy. These developments have

6-16
advanced rapidly in the last three to five years given the increase and instability
of crude oil. However, they are in the development/scale up stage. For example,
DOE announced on recently (February 2008) that it will invest $114 million in
four small-scale biorefinery projects over four years. These small-scale
biorefineries will use a wide range of feedstocks to test conversion technologies
for the production of cellulosic ethanol. The new biorefineries—to be built in
Colorado, Missouri, Oregon, and Wisconsin—are expected to produce about 2.5
million gallons a year of ethanol, as compared to the 20-30 million gallons that a
full-sized facility can produce. The news follows the February 2007
announcement that DOE was investing $385 million for the development of six
commercial-scale biorefineries. The six full-scale biorefineries are employing
near-term commercial processes, while the four small-scale facilities will
experiment with diverse feedstocks and novel processing technologies. A
summary of these investments is provided in the table below.
Table 6.2.5-1. Investments in Biorefineries By DOE.
Biorefineria
Inversión en Millones Plantas Millones por
planta
Producción en millones de galones
por año Costo por galón
A pequeña escala 114 4 28.50 2.50 11.40 A gran escala 385 6 64.17 30.00 2.14
Another area where capital and operating costs require further studies are
microalgae. In the following table the results from several cost estimate studies
for biofuel production from microalgae are summarized. Notice that the capital
costs are divided in three main components; growth ponds, system wide costs
and other capital. The latter applies standard percentages based on the former
two costs. Notice the wide range in total cost calculated based on $/gallon of oil.
This includes both capital and operating costs.

6-17
Table 6.2.5-2. Costs for biofuel production from microalgae.
This is better summarized in the following figure. Notice that there is no
consensus whether operating or capital expenditures dominate the cost structure
of this business. In addition, all the cases were analyzed for 1,000 acres or less.

6-18
Figure 6.2.5-1. Microalgae Economic Studies Summary.
The previous data was used to estimate the total costs for producing oils in
larger ponds (>1,000 acres). This is shown in the following figure. Notice that
the $2/gallon threshold apparently will require microalgae plantations that
exceed 1,000 hectare.
Figure 6.2.5-2. Total costs for producing oils in larger ponds (>1,000 acres)

6-19
On a related topic, carbon credits should be considered as a potential source of
income for microalgae and other biobased fuels. In the following figure estimates
are shown regarding the income that could be generated by a utility by selling
their flue gas for these developments. Notice that a 400 MW facility could
generate 50 million dollars per year at $15/ton of CO2. In Europe the carbon
credit trading market already exceeds this value.
Figure 6.2.5-3. Carbon Market, PREPA
6-20
6.2.6 Estimate of potential electric energy contribution Biomass is unique among renewable energy resources in that it can be converted
to carbon-based fuels and chemicals, in addition to electric power. The previous
discussion focused mainly on the conversion to carbon-based fuels and
chemicals. However, biomass could be combusted directly and used for
producing electric power. For example, using the two ZAPA zones as a basis,
they would generate approximately 4.0 billion gallons per year of fuel. This
translates into 4.5 GW generation potential. This is a very optimistic estimate
that would require 1 million cuerdas in addition to assuming total utilization of
the biomass generated. Utilizing biodiesel as an example, approximately 20% of
the energy would be required for the harvesting and conversion. It must me
emphasized that this analysis is very preliminary and required further
elaboration.
6.2.6.1 References for Biomass Energy Resource and Technologies
• Schnepf, R., Agricultural-Based Renewable Energy Production, Congressional
Research Service, Updated May 18, 2006, Order Code RL32712.
• Biodiesel from Microalgae, Research review paper, Chisti, Y., Biotechnology
Advances, 2007, 25, 294-306.
• A Look Back at the U.S. Department of Energy’s Aquatic Species
Program:Biodiesel from Algae, Sheehan, J., Dunahay, T., Benemann, J.,
Roessler, P., NREL/TP-580-24190, 1998.
• http://www.energy.gov/news/5903.htm
• http://www.biogasol.dk/2me2.htm
• Biofuels Refining and Performance
• Anotaciones sobre la agricultura de Puerto Rico, Censo de Agricultura, Puerto
Rico 2002

6-21
• Plan de Uso de Terrenos - Febrero 2006
• J.A. Colucci, F.A. Alape and E. Borrero, “Biodiesel from Alkaline
Transesterification Reaction of Soybean Oil Using Ultrasound Mixing,”, JAOCS,
82(7), 465-542, 2005.
• J.A. Colucci, F.A. Alape and E. Borrero, “Biodiesel for Puerto Rico,” Green
Chemistry & Engineering Proceedings, 2003, 37 – 40.
• J. C. Sáez, D. J. Schell, A. Tholudur, J. Farmer, J. Hamilton, José A. Colucci
and James D. McMillan “Carbon Mass Balance Evaluation of Cellulase
Production on Soluble and Insoluble Substrates,” Biotechnology Progress,
2002, 18, 1400 – 1407.

6-22
6.3 Solid Waste Biomass Energy Resource
6.3.1 Availability of the Resource Most of the information provided here was obtained from the Itinerario Dinámico
that was developed by the Puerto Rico Solid Waste Management Authority. For
example, the next table shows the municipal solid waste profile in Puerto Rico in
2006 and projections thereafter. In addition to this resource Puerto Rico also has
the municipal solid waste that is already buried in the landfills and agricultural
waste.
Table 6.3.1-1. Municipal solid waste profile and projections in Puerto Rico, 2006.
Proyecciones de generación de desperdicio sólidos
(Toneladas/día) 2006 2010 2015 2020 2025 2030
Categoría % del peso 10,998 11,204 11,427 11,599 11,716 11,833
Platico
Polietileno tipo 1 1.1 121 123 126 128 129 130 Polietileno de alta densidad (HDPE) tipo 2 2.9 319 325 331 336 340 343 Tipo 3-7 (PVC, LDPE, PP, PS, Mezclado) 6.5 715 728 743 754 762 769
Papel-Cartón
Papel de alta calidad 1.3 143 146 149 151 152 154 Papel de baja calidad 8.7 957 975 994 1,009 1,019 1,029 Cartón Ondulado 9.3 1,023 1,042 1,063 1,079 1,090 1,100
Metal Metal ferrosos 9.4 1,034 1,053 1,074 1,090 1,101 1,112 Metales no-ferrosos 1.1 121 123 126 128 129 130
Jardinería Material vegetal 20.4 2,244 2,286 2,331 2,366 2,390 2,414 Orgánico Material orgánico 12.9 1,419 1,445 1,474 1,496 1,511 1,526
C&D
Escombro de contracción y demolición 17.1 1,881 1,916 1,954 1,983 2,003 2,023
Vidrio Todo tipo de vidrio 2.4 264 269 274 278 281 284
HHW Desperdicio peligroso caseros 0.5 55 56 57 58 59 59
Otros No definido de otra manera 6.4 704 717 731 742 750 757
Total 100% 10,998 11,204 11,427 11,599 11,716 11,833 Fuente: Itinerario Dinámico, 2007

6-23
Based on the table, above it is estimated that approximately 11,000 tons/day of
municipal solid waste is generated in Puerto Rico. On a per capita basis this
translates into approximately 5.8 lbs/day-person which is one of the highest in
the world. As will be discussed in the next sections only certain portions of this
waste can be converted into energy directly and/or into fuels. The agricultural
sector is another source of waste with energy/fuels potential possibilities. This
was mentioned in the Biomass Resource section. Mainly the focus was that a
biorefinery philosophy must be adopted in order to utilize all the biomass
generated by crops. One interesting example of the pineapple industry. In 2004,
they produce approximately 25,000 tons of Red Spanish variety pineapples per
year. The total annual sales revenue was approximately six million dollars.
However, the trees and processing produce approximately 170,000 and 10,000
tons per year of solid waste, respectively. This agricultural industry has a critical
need for sound and efficient green approaches to minimize its inherent
environmental impact especially in a small island like Puerto Rico. Again, a
biorefinery operating philosophy should be seriously considered.
Regarding the material already deposited in the landfills, Dr. Colucci’s group
performed a preliminary study in 2001 estimating the potential of this resource
for generating and recovering methane for electricity generation. The next pie
chart shows that as of 2001 approximately 81.7 million tons were deposited.

6-24
PR Landfills Total Estimated Capacity Total Tons - 81.7 Millions Tons
Top 10 - 57.8 Million Tons2001
Toa Baja16%
San Juan13%
Ponce10%
Carolina8%Humacao
7%
Guaynabo4%
Bayamón4%
Mayagüez3%
Arecibo3%
MOCA3%
Otros29%
Figure 6.3.1-1. Potential of landfills for electricity generation
Using 10,000 tons/day and extrapolating forward from 2001 to 2008 will increase
the capacity to 110 million tons. In this analysis the Energy Project Landfill Gas
Utilization Software (E-Plus) from the Environmental Protection Agency was used
to estimate the energy (via methane processing) generation potential of these
landfills. The next figure shows a typical output if this program for the San Juan
Landfill. In general, the generated methane is used to calculate the electric
capacity potential of the landfills. In the overall analysis, a top ten approach was
used, which are the ones shown in the chart and the following table. Notice that
the top ten accounts for 70% of the total capacity. In the table also notice that
peak electric capacity barely reaches 40 MW for all the landfills (28 MW for the
top 10). Notice that this electric generation capacity corresponds to
approximately 10 MW/1,000 tons/day, which is lower than the proposed 30
MW/1,000 tons/day for a fresh feed facility. For this comparison a 15 year

6-25
lifetime was assumed for the operation of an energy generation facility in the
landfill and only 30% was considered as digested to methane.
Figure 6.3.1-2. Energy generation potential of these landfills
It should be mentioned that in the Itinerario Dinámico it is assumed that some of
the material will be utilized for other applications such as compostas. This was
taken into consideration in the analysis that was performed and discussed in
future sections. PRSWMA proposes that three composting facilities are operated
in the north, south and east zones. It is estimated that they will have a combined
capacity of 500 tons/day.
Table 6.3.1-2. Composting facilities for Puerto Rico.
Toneladas por día Entra en operación Planta Norte 200 2008 Planta Sur 200 2010 Planta Este 100 2010 Total 500*** Fuente: Itinerario Dinámico, 2007

6-26
6.3.2 Variability of the Resource In the early 1990’s Eco Futures performed a solid waste characterization study in
Puerto Rico where they considered “wet and dry” season. Most likely they
suspected that differences will be observed especially regarding the biomass
component or material vegetal. The data that was readily available was from the
former. The assessment study classified the garbage generated in Puerto Rico
under ten major items: (1) paper, (2) cardboard, (3) yard waste, (4)
putrescibles, (5) grit, (6) plastics, (7) ferrous metals, (8) non-ferrous metals, (9)
glass, and (10) other (unclassified waste). The study quantified the amounts of
garbage as classified in the ten items above for the municipalities of Aguadilla,
Arecibo, Guayama, Guaynabo, Humacao, Jayuya, Mayagüez, Ponce, San
Germán, Toa Alta, San Juan and Aibonito. The study also quantified the total
MSW generated in 56 municipalities of the island, including the islands of
Vieques and Culebra. It is not clear whether substantial differences were
observed or even if the comparison was made between the wet and dry
seansons. It should be mentioned, however, that based on conversations with
Induchem personnel there are significant differences in the content of the scum
of wastewater treatment plants between weekends and week days. Similar
behavior is probably expected for solid waste generation.
6.3.3 Available commercial and prototype conversion technology to produce electricity using the resource
The conversion technologies available for Solid Waste Biomass Resource are very
similar to the generic Biomass resource. This is part due to their similarities,
solids, carbon containing materials, heterogeneity, etc. As mentioned earlier
certain states even considered solid waste as a biomass. In general, Conversion
technologies refer to a wide array of biological, chemical, thermal (excluding
incineration) and mechanical technologies capable of converting post-recycled
residual solid waste into useful products and chemicals, green fuels such as

6-27
hydrogen, natural gas, ethanol and biodiesel, and clean, renewable energy such
as electricity. They could effectively enhance recycling and beneficial use of
waste, reduce pollution such as greenhouse gas emissions, and reduce
dependence on landfilling and imported and domestic fossil fuels. The following
provide a brief description of these technologies divided into Thermochemical
and Biochemical conversion processes:
Thermochemical conversion technologies Gasification and Pyrolysis are
technologies that use high heat that can treat nearly the entire organic fraction
of municipal solid waste. Thermochemical processes can convert potentially all
the organic portion of the waste stream that is currently going to landfill into
heat and other useful products.
Gasification is a process that converts solid or liquid carbon-based
materials by direct or indirect heating at high temperatures, typically
above 1300oF. For direct heating, partial oxidation occurs where the
gasification medium is steam and air or oxygen. Indirect heating uses an
external heat source such as a hot circulating medium and steam as the
gasification medium. Gasification produces a fuel gas (synthesis gas,
producer gas), which is principally carbon monoxide, hydrogen, methane,
and lighter hydrocarbons in association with carbon dioxide and nitrogen
depending on the process used. It offers the capability of producing a
broader array of products such as electricity, alternative fuels such as
ethanol and diesel, and chemical precursors.
Pyrolysis is also a high heat technology but differs from gasification in
that there is no oxygen employed in the process. Temperatures for
pyrolysis processes range from 750oF to 1500oF.

6-28
The following is a schematic from the Air Force Research Laboratory
illustrating the production of jet fuel using either gasification combined with
Fisher Tropsch or Pyrolysis with hydroprocessing.
Figure 6.3.3-1. Production of jet fuel using either gasification combined with Fisher Tropsch or
Pyrolysis with hydroprocessing.
Biochemical conversion technologies such as anaerobic digestion and
fermentation operate at lower temperatures than thermochemical
technologies. They are more limited in their application since they can only
process biodegradable feedstocks.
Anaerobic digestion is the bacterial breakdown of organic material in the
absence of oxygen and can occur over a wide temperature range from 50o
to 160oF. The reaction temperature has a very strong influence on the
anaerobic activity, but there are two optimal temperature ranges in which
microbial activity and biogas production rate are highest, mesophilic and
thermophilic temperature ranges. Mesophilic systems operate at
6-29
temperatures around 95ºF and the thermophilic systems operate at a
temperature around 130ºF. Operation at thermophilic temperatures allows
for shorter retention time and a higher biogas production rate, however,
maintaining the high temperature generally requires an outside heat
source because anaerobic bacteria do not generate sufficient heat. These
biological processes produces a gas principally composed of methane
(CH4) and carbon dioxide (CO2) but also has impurities such as hydrogen
sulfide (H2S).
Fermentation is also an anaerobic process and is used to produce
alcohols and other chemicals. Feedstocks containing cellulose, a long-
chain molecule made up of linked glucose sugar, need a treatment step
called hydrolysis to break up the larger chain of sugars into basic sugars
so yeasts and bacteria can process the sugars to make an alcohol such as
ethanol. Cellulose and hemicellulose (a 5-carbon sugar) can be hydrolyzed
using acids, enzymes, or a hydrothermal method called steam explosion.
The following table summarizes are typical products from the above processes:

6-30
Table 6.3.3-1. Biochemical conversion technologies Conversion Technology
Primary Product
Secondary Products
Solid Residues
Value of secondary products
Feedstocks Processed
Complete gasification
Synthesis gas
Fuels, chemicals
and electricity
Ash metals
recycle or landfill
Very high and flexible
All organics low moisture
Incomplete gasification
(See pyrolysis)
Fuel and synthesis gas
Electricity, some
marketable fuels
Char ash
metals recycle
Moderate may need refining at additional
expense
All organics low moisture
Indirectly fired
pyrolysis with drier & gasifier
Fuel and synthesis gas
Electricity, some
marketable fuels
Char ash
metals recycle or
landfill
Moderate may need refining at additional
expense
All organics low moisture
Anaerobic Digestion
Fuel Gas (CH4 and
CO2)
Heat, Power, Fuels,
Chemicals, Soil
Amendment
Inorganics, metals, glass,undegraded
biomass
Moderate to High
Biodegradable Components
Fermentation Ethanol
Ethanol, Chemicals, Heat, Soil
Amendment
Inorganics, metals, glass,undegraded
biomass
Moderate to High
Biodegradable Components
It should be mentioned that the Los Angeles County in California recently
evaluated several technologies to convert their solid waste into value added
products. They narrowed down their search to five companies/technologies.
These are shown in the following table. Notice that four out of the five are
thermal conversion technologies. Also notice that the processing rage is between
200 to 400 tons per day per unit. In addition, the emphasis was on producing
electricity. The anaerobic digestion system also produces composting material.
One of the technologies produces renewable diesel.

6-31
Table 6.3.3-2. Technology Supplier. Technology Supplier
Technology Type
Proposed Capacity
Major Products
Arrow Ecology and Engineering (Arrow)
Anaerobic Digestion 300 tpd
Biogas (Electricity) Digestate (Compost) Recyclables
Changing World Technologies (CWT)
Thermal Depolymerization 200 tpd
Renewable Diesel Carbon Fuel Metals
International Environmental Solutions (IES) Pyrolysis
242.5 tpd @ 58.9% moisture 125 tpd@ 20% moisture Syngas (Electricity)
Interstate Waste Technologies (IWT)
Pyrolysis / High Temperature Gasification
312 tpd (1 unit)624 tpd (2 units) 935 tpd (3 units)
Syngas (Electricity) Mixed Metals Aggregate
Ntech Environmental (NTech)
Low TemperatureGasification 413 tpd Syngas (Electricity)
6.3.4 Conversion Technology footprint Centralized waste conversion processing facilities only required 10-50 acres
depending on the buffering zone that is required and capacity. In general foot
print is a lesser issue for these centralized units than the location. Depending on
the technology, they can generate strong opposition from nearby communities as
well as environmental groups. Concerns can vary from odors to health effects
related to the formation of pathogens (digestors), dioxins and furans. The latter
two are associated with thermal processing units such as gasification and
incinerators.
“Local” conversion units such as those proposed for existing landfills require
much less area than centralized facilities. This would include a building where the
gas purification system and energy generation units will be located. It is
suspected that the foot print of these local units is a minor issue given the large
extensions of land available at landfills.

6-32
6.3.5 Estimate of capital cost In general, waste to energy/products facilities are relatively expensive when
compared to their chemical and/or petrochemical facilities. This is based on their
raw material processing capacity. For example, a biodiesel production facility
capital investment is approximately $0.05 – $0.15/pound versus $2.5 -
$3.0/pound for a waste to energy facility. Operating costs are also much higher
for the latter. This difference can be attributed in part to the stricter controls
required for waste to energy facilities.
As a rule of thumb the investment for waste to energy facilities is approximately
$200 - 250 Million per 100 TPD capacity. As with other large volume processing
technologies they have benefit of scale although not as much as other processes.
Preliminary estimates indicate that their scale up index is between 0.8-0.9 versus
0.6–0.7 for other chemically based processes. This is part due to the modularity
of their line processing units. Notice in the previous section that processing lines
are in the rage 200-400 tons per day. Additional capacity is obtained by adding
processing lines with their respective down stream units.
Another important component of the cost structure of waste to energy facilities is
the nature of their income. This is better explained with the next figure that
shows the operating income lines required to recover the capital investment of
different facilities. Most of the income of these facilities result either from tipping
fees and electricity. In the graph the line TF=EI shows when both are equivalent.
This is the case for $70/ton and approximately $0.10/kwhr. Above this line the
facility would receive more income from electricity than tipping fees and vice
versa below the line. Obviously as the capacity of the facilities are increased
lower incomes on a unit per basis would be required to recover the investment.

6-33
Figure 6.3.5-1. Operating income lines required to recover the capital investment of different
facilities
6.3.6 Estimate of potential electric energy contribution A modified version of the table shown in section 6.3.1 Availability of the
Resource will be used here. Specifically the 2010 projections will be used. Notice
the three columns that were added to the right, Generación Eléctrica & Químicos
(25 and 50%). For all the rows these columns were calculated except for those
components that are not carbon based and thus can not be oxidized. This
includes metals, glass and construction debris. Overall, the potential electric
energy generation is approximately 235 MW. This assumes 30 MW per 1,000
tons per day for conversion purposes. However, a highly successful recycling
program would only leave gardening and organic material for energy generation.
This decreases the energy generation potential to approximately 110 MW. In the
productos químicos column two cases were considered, 25 and 50% yields. It is

6-34
expected that the former is more realistic. Notice that 60 million gallons per year
is equivalent to approximately 70 MW of electrical energy at 10 kW per 1 gallon
per hour of feed. However, the energy necessary to convert the biomass to these
compounds should be included in the analysis. Overall, if all the carbon based
solid waste is considered for producing chemicals this will result in approximately
200 and 400 million gallons per year of organic compounds at 25 and 50% yield,
respectively. With effective recycling programs this drops to 100 and 200 million
gallons per year, respectively.
Table 6.3.6-1. Potential electric energy generation.
Proyeccion de generación de desperdicios
sólidos (Toneladas/dia)
Productos Quimicos MMGPY
Categoría % del peso 2010 Generacion
electrica MW*** 25% 50%
Platico
Polietileno tipo 1 1.1123 4 3 6 Polietileno de alta densidad (HDPE) tipo 2 2.9325 10 8 17
Tipo 3-7 (PVC, LDPE, PP, PS, Mezclado) 6.5728 22 19 38
Papel-Cartón
Papel de alta calidad 1.3146 4 4 8 Papel de baja calidad 8.7975 29 25 51 Cartón Ondulado 9.31,042 31 27 54
Metal Metal ferrosos 9.41,053 Metales no-ferrosos 1.1123
Jardinería Material vegetal 20.42,286 69 60 119 Orgánico Material orgánico 12.91,445 43 38 75
C&D
Escombro de contracción y demolición 17.11,916
Vidrio Todo tipo de vidrio 2.4269
HHW Desperdicio peligroso caseros 0.556 2 1 3
Otros No definido de otra manera 6.4717 22 19 37
Total 100%11,204 235 204 409 Fuente: Itinerario Dinámico, 2007 *** 1000 Toneladas al dia de desperdicio equivale a 30 MW

6-35
6.3.7 References for Solid Waste Biomass Energy Resource • PRSWMA Itinerario Dinámico, 2007
• ECO Futures Caribe. “Assessment of Municipal Solid Waste Generation in
Puerto Rico” (1994).
• Saliceti_Piazza, L. & Colucci, J., Technoeconomical Analysis for Gasification of
Solid Municipal Waste Generated in Puerto Rico, Report for Task 3 STEP
Project, NREL, PREAA, January 15, 1998
• Puerto Rico Solid Waste Management Authority. “ADSM en Marcha,” Year 6,
Number 4 (1995).
• Los Angeles County Waste Conversion Technologies Evaluation Report and
Presentation, September 2007.
• Energy Project Landfill Gas Utilization Software (E-Plus) version 1.0; EPA;
January 1997
• Turning a Liability into Asset: A Landfill Gas-to-Energy Project Development
Handbook; Landfill methane Outreach Program; EPA; September 1996;
Chapters 1-4
• INFORME FINAL COMITÉ EVALUADOR PLANTA TERMÓLISIS-GASIFICACIÓN
MUNICIPIO AUTÓNOMO DE CAGUAS,Dr. Carlos Padín, presidente del comité,
Marzo 2007
• Turton, R., Bailie, R.C., Whiting, W.B., and Shaeiwitz, J.A., Analysis, Synthesis
and Design of Chemical Processes, 2nd edition, Prentice Hall, 2003

6-36
Appendix A