centre for new and emerging markets number 29 why
TRANSCRIPT

CENTRE FOR NEW AND EMERGING MARKETS
Discussion Paper Series Number 29
WHY TRANSITION PATHS DIFFER:
RUSSIAN AND CHINESE ENTERPRISE PERFORMANCE COMPARED1
Saul Estrin, London Business School
Sumon Bhaumik, London Business School
March 2005
Contact details: Anna M Malaczynska Tel: +44 (0)20 7706 6964 Fax: +44 (0)20 7724 8060 www.london.edu/cnem © London Business School, 2005
=================================================1 The authors would like to thank Maria Bytchkova for research assistance, and Alan Tlusty Sheen, Kanliang Wang, Yuan Li and Boris Kutznetsov for provision of the data, as well as Simon Commander, Chenggang Xu and participants in seminars at the Centre for New and Emerging Markets of London Business School; University College, London; the New Economic School, Moscow; the School of Oriental and African Studies, London; and St. Anthony’s College, Oxford University for comments and discussion. Any remaining errors are our own.

2
Abstract
We use enterprise data to analyse and contrast the determinants of enterprise performance in
China and Russia. We find that in China, enterprise growth and efficiency is associated with
rapid increases in factor inputs, but not correlated with ownership or institutional factors.
However, in Russia, enterprise growth is not associated with increases in factor quantity
(except for labor) or quality. The main determinants of company performance are instead
demand and institutional factors at a regional level. We explore possible interpretations of
these results, including the impact of institutional and managerial quality.
JEL Classification Codes: D23, L22, O12, P31
Keywords: enterprise performance; privatization in Russia and China.

3
1. Introduction
There has been a marked contrast in national economic performance between Russia and
China since each embarked on the path of transition from socialist planning. China’s GDP
per capita has increased by 8% per annum between 1978 and 2000, while Russian GDP had
fallen to 64% of its 1990 level by 2000, with output declining in seven years of the ten,
though there has been fast growth in the past four years (see EBRD (2004)). When
comparing the explanations offered by different analysts, we note that they have cited
preconditions, notably the low level of industrialization in China (see Sachs and Woo, 2000);
policy frameworks – gradualism in China as against “big bang” policies in Russia (see
Jefferson and Rawski, 1994); and policy sequencing i.e. delayed rather than immediate
privatization in China but not Russia (see Stiglitz, 1999, Nellis, 2000). In this paper, we use
two broadly comparable surveys of enterprise data to analyse the determinants of company
performance in China and Russia, in a manner that throws light on these broader issues.
There are a number of factors likely to contribute to growth in relatively less developed
economies transforming from central planning to markets. The first is the transfer of factor
inputs from lower to higher productivity uses. In the case of less industrialised economies,
such as China, much of that transfer might take the form of labor shifts from agriculture to
industry and industrial capital accumulation. In Russia, with “over-industrialization” and a
pre-transition domestic relative price structure inconsistent with world prices (see Ellman,
1989), factor reallocation could take the form of capital and labor flows to sectors of
international comparative advantage (see World Bank, 1996, Svejnar, 2002). At the same
time, the price and foreign trade liberalisation elements of a transition program are likely to
lead to enhanced competition, which, as Nickell (1996) has argued, might act to increase total
factor productivity (TFP). Ownership changes could also enhance enterprise performance
(see Vickers and Yarrow, 1988; Megginson and Netter, 2001), though, as Djankov and
Murrell (2002) report, the results for the transition economies are not so clear cut because the
ownership forms which emerged post-privatization were too dispersed, and because the legal
and institutional environment was not always sufficiently well developed to guarantee that
private ownership enhanced performance (see also Estrin, 2002). This latter finding suggests
that institutional factors – political, legal, regional and industrial – may also play a significant
role in determining company performance, especially in countries as regionally diverse as
Russia or China (see Granick, 1990, Tsui, 1996, Qian, 2003).
In this paper, we explore the impact of these determinants of enterprise growth in random
panels of firms in Russia and China. The study is based on a largely common survey
instrument with the questionnaire designed to yield information about competition,

4
technology, ownership and managerial activity, as well as concerning institutions and factor
inputs. The strength of the study is that it permits us to contrast the determinants of enterprise
growth in these very different economies. Our findings are for the most part consistent with
those in the separate large literatures on enterprise performance in Russia2 and China,3 but we
obtain additional insight from the estimation of similar equations, and the resulting
comparisons of growth determinants.3 We find that, in China, enterprise performance is
associated with rapid increases in factor inputs but is not significantly affected by ownership
or institutional factors. In contrast, sales growth in Russia is not driven by improvements in
factor quantity (except for labor) or quality and privatization to outsiders is not found to
improve performance relative to insider owned firms. Though our equations are based on
similar data sets and provide an equivalent level of fit in Russia and China, the main
determinants of sales growth is found to be increases of factor inputs in China but demand
and region-specific factors in Russia.
The remainder of the paper is structured as follows. In the next section we outline our
hypotheses, taking into account both economic theory and the particular institutional
environment of Russia and China. The resulting estimation framework is presented in third
section, along with the datasets. The basic findings are presented in the fourth section and
some simple attempts to deepen our interpretation of the findings is contained are in the fifth,
before moving on to conclusions.
2. The Determinants of Enterprise Growth in Russia and China
In this section, we outline the conceptual framework and outline the hypotheses implied by
the Chinese and Russian historical and institutional environments. Our approach is based on
estimation of augmented production functions using data from Russian and Chinese firms.
We assume that the technology of each firm, i, can be represented by,
KLAY iiiiβα= (1)
where Y measures output, L is labor, K is capital, and A is the “technology” parameter.
Output (value added) data is scarce and typically of poor quality in transition economies, so,
=================================================2 See for example Blasi, Kroumova and Kruse (1997), Earle, Estrin and Leschenko (1996), Estrin and Wright (1999). 3 See for example Jefferson and Rawski (1994), Li (1999), Jefferson, Rawski and Zheng (1996), Woo (1994), and Jefferson, Rawski and Zheng. (2000).

5
with other analysts in the field, (see e.g. Frydman, Gay, Hessel and Rapaczynski, 1999), we
have used sales (S), where
KLPAYPS iiiiiβα=≡ (2)
and P is the product price of the good being produced. The price is determined by net
demand in the relevant market and the competitive structure of that market, i.e.
P = P(Q, C) (3)
where Q is net demand in the industry and C is a measure of competition.
Because the transition process is essentially one of change, our analysis is focused towards
growth of sales; levels of output or input in transition economies are often determined by
historical or institutional factors of limited relevance in the new market environment. Hence,
denoting time differences by a dot,
( )βα
iiii KLAPS..... .
= (4)
This framework categorises the determinants of sales growth into three groups: changes in
product price (itself a function of net demand and market structure changes); changes in
factor inputs (L and K) including changes in factor quality; changes in A- total factor
productivity - which, in the transition context, may be particularly affected by ownership
structures (see Frydman, Gray, Hessel and Rapaczynski, 1999, Djankov and Murrell, 2002).
To sharpen the hypotheses, we must briefly compare the two economies at the point of
transition (1978 and 1991 respectively) and beyond, to establish points of similarity and
difference.4 China and Russia both embarked on their transition paths from more or less
unreformed systems of central planning,5 though Chinese planning was never so complete as
Russian, and operated through regional structures rather than industrial ministries (see Qian,
=================================================4 This discussion is necessarily brief and summarises two large literatures (see e.g. Byrd, 1991 World Bank, 1996, Boycko, Shleifer and Vishny, 1995, EBRD, 1999, Groves, Hong, McMillan and Naughton, 1994, 1995, Granick, 1990, Jefferson and Rawski, 1994, Lau, Qian and Roland, 2000). 5 In contrast, for example, to Hungary or Yugoslavia (see Fischer and Gelb, 1991).

6
Roland and Xu, 1999). The Chinese economy therefore suffered, within the almost entirely
state owned industrial sector, from similar problems of incentives, soft budget constraints and
inadequate information, with well-known negative implications for company efficiency,
innovation, and growth (see e.g. Ellman, 1989). Indeed, in Russia at the time when transition
began, there was an almost total absence of the institutional and legal infrastructure necessary
for the operation of competitive markets (see Commander, Fan, Schaffer, 1996, Blanchard
and Kremer, 1997).
However, there were also very marked differences in initial conditions. China was a much
less developed economy in 1978 than Russia in 1991; for example in GNP per capita (US$
285 as against US$ 3783); share of industrial employment, (13.3% as against 39%) and share
of agricultural employment (75% as against 13.5%).6 In particular, the stock of human capital
was markedly lower in China, with a literacy rate in 1980 of 66% as against 98% in Russia,
1998; secondary school enrolment rates of 63% as against 91% and tertiary education
enrolments of 1.7%, (1980) as against 50%. This meant that the two countries faced
fundamentally different resource reallocation challenges. In China, it was necessary to raise
national income by transferring labor from low productivity activities (primarily agriculture)
to higher productivity ones (largely in industry) (see Qian, 2000, Granick, 1990). In Russia,
the structure of output needed to be rebalanced from a concentration on the pattern preferred
by central planners (heavy industry, defence) towards domestic consumer demand (light
industry, services) and activities of international comparative advantage at world prices (see
Granville and Oppenheimer, 2001).
The two countries also followed very different transition paths. In China, reforms were
gradual, experimental, and partial, with the authorities taking a flexible approach to policy
making (see Qian, Roland and Xu, 1999). In Russia, the reforms were intended to be rapid
and comprehensive (see Hanson, 2002), though there were major differences between the
objectives and actual implementation of reforms. The sequence of transition in the two
countries was therefore also very different. In China, markets were liberalised first, and they
have gradually become more competitive and efficient in resource allocation (see Jefferson
and Rawski, 1994) while the process of privatization has been much slower and more limited
(see Jefferson, Rawski and Zheng, 2000, Cao, Qian and Weingast, 1999). Hence, strong
market-based incentives were provided to state owned firms and semi-private ones such as the
town-village enterprises (TVEs). In contrast, Russia attempted virtually simultaneous
introduction of markets and private ownership, with much of the intended enhancement to

7
company performance presumed to derive from the latter (see Boycko, Shleifer and Vishny,
1995). The implementation of Russian reforms, however, proved harder than expected (see
Hanson, 2002), leaving enterprises to operate initially in only a quasi-market environment
(see Commander, Dolinskaya and Mumssen, 2002), during what proved to be a prolonged
recession (see EBRD, 1999).
Therefore in China, one can hypothesise that growth in the industrial sector has resulted from
strong demand (domestic and international) and derives from factor transfers (labor and
capital) and TFP growth driven by competition (see Wang and Yao, 2001). Once might also
expect some contribution from enhanced factor quality, though a limited one given the level
of development and the transition path (but see Huang and Duncan, 1997). Given that a
relatively competitive market system had been established by the time of our study in 1999,
specific institutional factors related to industry or regions might be expected to be of less
significance (see Parker, 1997). Chinese reforms have not fully addressed the ownership issue
(see Qian, 2003); hence privatisation might not yet show any decisive influence on
performance.
One would predict similar factors as being relevant for enterprise growth in Russia, though
the balance of importance might be different. One would expect the change in sales to be
correlated with changes in factor inputs; this is a corollary of cost minimisation. Given
Russia’s more advanced level of technological and educational development, one might also
predict a strong influence of factor quality on sales growth. If Russia’s reform programme
had been effective, one would also expect to see an impact from ownership changes and
competition.
3. Specification and Data
3.1. Specification of the Estimating Equations
Equation (4) is a reduced form relationship that is commonly estimated log-linearly and in
rate of change form (∆) to remove firm-specific effects so, with error term εi;
∆lnSi = ∆lnAi + α ∆ln Li + β∆ln Ki + φ∆lnQi + σ∆lnCi + εi (5)
In this section, we outline the dataset, and the ways that the variables in equation (5) have
been specified for empirical estimation. It is often difficult to obtain direct measures of A, Q
and C as continuous variables, especially in transition economics, so (5) can be modified in
=========================================================================================================================================6 Sources: World Bank, IMF and State Statistical Bureau. GNP per capita in Russia refers to 1988 and the share of industrial and agricultural employment refers to 1980.

8
such a way that while the factor inputs are included in logarithmic form, the other variables
are proxied by indirect measures and fixed effects.
The variable A is associated with total factor productivity and may be influence by a number
of factors. In the literature on privatization, TFP is found to vary with ownership, being
higher in private than state owned firms (see Megginson and Netter, 2001). The transition
literature additionally argues that TFP is a function of the type of private ownership, with
outsider ownership expected to generate higher productivity than insider or state (Blanchard
and Aghion, 1996). Because the institutional frameworks are different in this respect in the
two countries, we use different ownership dummies in our estimating equations. In China,
reforms have allowed the emergence of a de novo private sector, including through the
development of TVEs (town-village enterprises). Hence the important distinction for
performance may be between firms in which the state has the controlling interest and those in
which non-state entities have the controlling stake, as in the standard literature (e.g.
Megginson and Netter, 2001). Insider ownership as has emerged in much of Central and
Eastern Europe is not a significant issue. In Russia, however, though privatisation was
widespread (almost all firms in our sample are private) the dominant owners are often not
outsiders (see Earle, Estrin and Leschenko, 1996). Hence it is useful in the Russian context to
distinguish between firms in which insiders have a controlling stake and firms that are
controlled by outsiders (see Djankov and Murrell, 2002). Further, in Russia, the government
retained 25 percent or more shares in some privatised firms, thereby giving them a significant
say in the decision making process (see Bennett, Estrin and Maw, 2005). This factor too
should be taken into account in considering for the quality of corporate governance in Russian
enterprises. Hence the control for ownership in our estimating equations is defined differently
in the Russian and Chinese contexts.
We have also attempted to control in our equations for the quality of factor inputs7, but the
only successful variable concerns capital quality, which we proxy with the proportion of
productive capital in the enterprise that is less than 5 years old. Turning to competition, the
data set provides only qualitative indicators of changes in competitive pressures, derived from
management responses in the survey and subdivided into domestic and international
competition. However these proved not to be significant in any equation, so we report
regressions in which they are excluded. This implies that we have only been able to control
=================================================7 We also had data to control for the quality of the labor force by using the ratio of managerial to blue-collar workers. This is a rather poor indicator of labor quality and it was never even nearly significant in the estimations. We therefore report regressions in which it was not included. Its exclusion does not alter in any way the pattern of results.

9
for competition factors indirectly through industry dummy variables, which also control for
(net) demand. Regional dummy variables are included to control for region-specific factors
that might influence enterprise performance. To the extent that the markets in China and
Russia are not fully integrated, the regional dummies may pick up local demand effects, as
well as inter-regional differences in institutional factors like the legal environment and
governance. We attempt to distinguish between the impact of local net demand and
institutional factors later in our analysis.
In keeping with the earlier discussion, α, and β and the coefficient on factor quality are expected
to be positive, reflecting the relationships between growth in sales and in factor inputs and
technological advance. As we have seen, the predicted impact of ownership on sales growth is
more complicated. In principle, government control in China and Russia can be expected to have
an adverse impact on sales growth relative to outsider ownership (see Vickers and Yarrow, 1988,
Nellis, 2000), either through the state ownership dummy (China) or the variable indicating that
the government is a significant shareholder (Russia). But, in the light of the relevant literature, it
is not clear whether privatization to insiders would generate similar improvements in
performance relative to state ownership. The literature suggests that, at the very least, outsider
ownership will be more efficient than insider or state, but that insider ownership may not yield
significantly superior performance to state ownership. Empirical evidence however suggests that
insider private owners do enhance enterprise performance relative to that of state owned firms
(see Estrin and Wright, 1999).
3.2 The Chinese and Russian Data Sets
The Chinese survey was conducted to explore the depth of structural reform among Chinese
manufacturing firms and therefore focuses on less well-known industrial centres. The data on
Chinese firms were collected through a random survey with retrospective questions conducted
in 2000. The focus was on manufacturing firms in the Sha’anxi, Hunan and Shanxi provinces
of China, and the survey yielded data on 274 firms over five years (see Tlusty-Sheen, 2001).
A significant proportion of equity of most of the firms in the sample in 1999 was in the hands
of various administrative organs of the state, thereby suggesting that we have a mix of fully
state-owned firms, corporatised state-owned enterprises, and a few TVEs. Ownership did not
change in any of the sampled firms during the sample period. The firms belong to five mining
and manufacturing industries,8 and the sample includes about 20% of the firms in the
population. The responses to the survey questionnaire provide information about, among
=================================================8 The industries are mining, light industries, engineering products, chemicals and utilities.

10
other things, ownership of the firms, volume of sales, stock and quality of factor inputs, the
extent of competition faced by the firms in the product market, and the extent of restructuring.
The Russian survey was designed to provide a snapshot of the consequences of reforms in the
manufacturing sector in the major industrial centres of Russia. The dataset contains
information on 437 firms surveyed in 2000, operating in 13 provinces9 and six industries.10
The survey contains retrospective questions to provide data for three years, 1997-1999 (see
Estrin, 2003 for further information). As with the Chinese data, the stratified random survey
of Russian manufacturing firms provides information about the volume of sales, stock of
inputs the nature of competition faced by firms in the product market, and the extent of
restructuring.11 The data for these firms, almost all of which had been privatised before 1997,
also provide information about the proportion of equity owned by the insiders and the
government in 1999. Again, there were no ownership changes in the sample over the period.12
The main differences between the Russian and Chinese datasets are fourfold. First, the
measures of some qualitative variables differ between the two samples. Second, unlike the
Russian data, the Chinese data do not include firms in the energy sector. Third, as we have
seen, differences in reform paths indicate that different controls should be used for ownership
structure. Finally, the samples compare privatised Russian firms in some of the main
=================================================9 The regions are Moscow, Moscow oblast, St. Petersburg, St. Petersburg oblast, Nizny Novgorod, Samari, Ekaterinburg, Perm, Novosibirik, Kiasnayovsk, Volgograd, Chelyabirsk, and Omsk. 10 The industrial categories are somewhat more disaggregated than in China; chemicals, machinery, wood and paper, construction material, light industry, and food processing. 18 “special” firms, which did not wholly belong to any of these six industries, were placed in an ‘other’ category. 11 The survey was based on random sampling from a population list from Goskomstat Enterprise Registry, for the six Russian Industries Classification’s (OKONH) two-digit sector. The sampling was done in 2000, with retrospective questions for earlier data. The size of the sampled firms was restricted to between 100 and 5000 employees, so as to rule out both small and medium enterprises and the huge Russian resource companies, which, though important economically, are atypical. The sample was stratified to distribute firms more or less evenly across three size classes: 100-500 employees, 501-1000 employees, and 1001-5000 employees. The stratification process led to certain biases in the sample relative to the Goskomstat data for industrial enterprises, e.g., over-representation of chemicals relative to machine building. Estrin (2003) also reports some bias in favor of more profitable firms. None of these biases seem likely to explain the estimation results. NO=The data sets both contain some missing values. In particular, a number of firms did not provide full breakdown of equity stakes, and/or information about capital stock. Since ownership and capital stock are important determinants of a firm’s performance, observations with incomplete information about these variables had to be dropped. There was no obvious pattern by sector, region, size and sales growth and formal tests do not suggest bias arising from omitted variables. We use 138 firm level observations for China and 279 for Russia.=

11
industrial regions of the country with largely state owned firms in some of the less central and
more internally oriented provinces of China. However, the measures of the quantitative
variables (e.g., sales, labor and capital) are comparable across the samples. Further, the
samples are representative within the respective economies, and hence while we cannot
compare the performance of similar firms in China and Russia, the data allows us to contrast
the performance of an average manufacturing Russian firm with the performance of an
average Chinese manufacturing firm in those regions during roughly the same time period.
While the choice of non-coastal and non-southern Chinese firms a priori biases the
comparison in favour of the Russian firms, as we explain later, this bias strengthens our
conclusions rather than weakens them.
The descriptive statistics in Table 1 highlight the patterns of evolution of the Russian and the
Chinese firms over the period and are consistent with the macro-economic data (see, e.g.,
EBRD, 2001). First, as one would expect, collectively the state had the controlling stake in
most Chinese firms in our sample, while in Russia, the majority of firms were controlled by
insiders (see Qian, 2000, Earle and Estrin, 1997). Second, even though the real sales of an
average Chinese firm in our sample grew between 1995 and 1999, while the real sales of an
average Russian firm in our sample declined, sales per laborer in Russian firms remained
higher that that in Chinese firms, even after the recession in 1998 and the adverse impact of
the sharp depreciation of the rouble on the US dollar value of the sales of the former. Further,
there was real sales growth in a large minority of Russian firms. Third, the size of the labor
force for both Russian and Chinese firms declined over time, indicating some degree of
restructuring in both countries that involved laying off surplus laborers. Fourth, while the real
capital stock (valued at historic cost) of an average Chinese firm grew substantially over the
1995-99 period, an average Russian firm experienced severe real decapitalisation during
1997-99, rather more markedly than the decline in demand. This decapitalisation can be found
in the population data as well, and is probably the consequence of Russian firms selling assets
and writing off unproductive capital in the aftermath of the 1998 crisis. Interestingly,
however, despite the significant capitalisation of the Chinese firms, the average of the
proportion of new (i.e., less than five years old) capital stock in Chinese firms remained less
than 20%, suggesting that investment was concentrated in the large firms.
4. Regression Results
The basic regression results are presented in Tables (2) and (3). In both tables, we report the
coefficient estimates of a model based on equation (5) using the Chinese and Russian data
respectively. The use of first differences also helps to take account of firm-specific fixed
effects. For each country, we first report the basic model (Spec 1), and then add controls for

12
initial conditions (Spec 2) and industry- and firm-specific factors (Spec 3 and Spec 4,
respectively) that might potentially influence the growth of sales. We control for initial
conditions to capture potential firm specific heterogeneity in adjustment to new market
circumstances. Moreover, while the model would suggest that first differencing would
eliminate fixed effects, there are reasons to believe that there may also be time variant
industry and regional effects in the transition economies. These could include for example
sectoral differences in technical progress, differences in the regional development of
infrastructure or in the sectoral and regional pattern of foreign direct investment. The correct
specification is therefore an empirical question, which we address by comparing
specifications 3 and 4 against 1.
As mentioned earlier, the specifications for China and Russia are slightly different, on
account of the difference in the nature of ownership and impact of ownership on firm
performance in the two countries. The specification estimated with the Chinese data includes
one ownership variable: a dummy variable indicating whether or not the state collectively had
controlling shares in a firm. The specification estimated using the Russian data, on the other
hand, has two variables capturing the impact of insider ownership and residual government
control: a dummy variable indicating whether or not insiders – managers and laborers – hold a
majority stake in a firm during 1997-99, and another dummy variable indicating whether the
government controls 25% or more of its equity during the same period, a stake which we
could have given the government significant influence over strategic and operational
decisions of the firm.
The regression results for China are presented in Table 2. The equations are based on samples
of 138 firms over five years, which in first difference specification yields 552 firm year
observations. The coefficient estimates for the basic model, which attempts to explain inter-
firm variation in sales growth using ownership, technology and growth of factor inputs, are
reported under Spec 1. In Spec 2, we introduce into the model the value of (log) sales in 1995,
to control for the initial conditions that might have affected sales growth during the relevant
time period. In Spec 3, we add controls for the industries to which the firms belong, and
controls for the regions of operation are introduced in Spec 4. All four specifications yield a
reasonable level of fit and indicate that, in China, growth of sales is positively correlated with
changes in factor inputs (i.e., α, β > 0). The quality of the capital stock is weakly significant,
at the 9% level, for specification 2 and around the 12-14% level for all other specifications.
Neither initial conditions nor industry and region-specific factors contribute significantly
towards an explanation of inter-firm variation in sales growth. Further, state ownership does
not affect the sales growth of Chinese firms. Note that the signs of the significant variables

13
are robust to the choice of the specifications, and the magnitudes of the coefficient estimates
are not significantly different across specifications.
The coefficient estimates for the Russian model are reported in Table 3. The equations are
based on 275 firms over three years, yielding in first difference form 550 firm year
observations. As with the Chinese model, we report coefficient estimates for four different
specifications.. In Russia, change in labour input is the only economic variable that has a
significant coefficient, albeit with the predicted sign (i.e., α > 0). Neither changes in capital
stock nor technology contribute significantly to an explanation of variations in sales growth.
Further, neither privatisation to insiders nor government ownership of a significant proportion
of the equity has any impact on the sales growth of the Russian firms. Indeed, inter-firm
variations in sales growth are largely explained by industry-specific and region-specific
factors. The goodness of fit, as measured by the adjusted R-square, rises steeply from below
0.3 to 0.41 after the inclusion of the regional dummy variables. Finally, unlike in the Chinese
case, initial conditions matter, albeit marginally, with the coefficient on (log) sales in 1997
being significant at the 10% level for Spec 4, and at the 12-15% in the other specifications. As
in the Chinese case, the results for the Russian sample are robust across specifications, with
respect to both the signs and the magnitudes of the significant coefficients.
The regressions suggest that the marginal product of capital in Russia is approximately zero.
This is likely to reflect the conditions of serious excess capacity in the Russian economy
following the post-reform recession, in which measured real GDP fell by around 40%. There
is also likely to be some measurement error in the capital series, which is based on a historic
valuation often derived from the pre-reform era.13
The differences in the specifications and samples across China and Russia do not allow us to
directly compare the goodness of fit of the regression models estimated for the two countries.
However, the R-square values – 0.24 and 0.41 for China and Russia, respectively, for the full
specification – and the F-statistic indicate that our specification explains variations in sales
growth across fairly well within each country. The contrast lies in the fact that the Chinese
data yield a fairly well specified conventional sales function, with sales growth explained
largely by changes in factor inputs and marginally by technology (see e.g. Jefferson, Rawski
and Zheng, 1996), while, as in other studies (see e.g. Estrin and Wright, 1999), the Russian
data yield an equation with much more limited economic interpretation.
=================================================13 The marginal product of capital is estimated to be positive and significant but very small when a simple sales function (change of sales against employment and capital) is estimated on Russian data.

14
5. Interpreting the Results
In this section, we offer some tentative explanations for the findings reported in tables 2 and
3. We first consider whether managerial quality may explain the differences in performance
in the two countries. Transition involved the decentralisation of the enterprise sector, giving
autonomy to managers so that variance in their quality or effectiveness could become an
important determinant of performance (see Claessens and Djankov, 1999). Indeed, it has been
argued that managerial quality and effort could be a major independent factor influencing
enterprise performance (see Barberis, Shleifer and Vishny, 1996). Since our datasets provide
information on this issue, with some similarity across the two countries, we test the impact on
enterprise performance in each country, and examine the results in more details for China. We
go on to explore possible interpretations for the significance of regional and industry factors
in the Russian regressions.
To analyse the impact of managerial input empirically, we must alter equation (1) to allow for
managerial input on the right hand side. After some manipulation, this would lead to the
inclusion of M in the rate of change form in equation (5). However, it is difficult to measure
managerial performance directly. Estrin, Gelb and Singh (1995) propose that changes in
managerial input can be measured in transition economies by the extent of restructuring
activity, using qualitative data from the responses of managers about what actions they have
taken. The survey instruments used to collect data in both China and Russia allow us to
generate such a measure of managerial input for use in the regression specification.
As mentioned earlier, the data regarding restructuring of Chinese and Russian firms are not
strictly comparable. The Russian questionnaire elicits a binary (i.e., yes-no) response about 15
different types of restructuring during the 1997-99 period, while the Chinese questionnaire
records the extent of 32 different types of restructuring on a 1-5 Likert scale. However, the 15
types of restructuring reported by the Russian firms are a subset of the 32 types of
restructuring reported by the Chinese firms, and hence we can generate a comparable measure
of restructuring for the Chinese firms, under the assumption that a measure of 4 or 5 on the 5-
point scale corresponds to a “yes” on the Russian scale. In Table 4, we report the regression
results for the Russian sample, after including the 0-15 point measure of restructuring in
Russian firms, and the results for the Chinese firms involving both the 32-160 point measure
(Spec A) and the comparable 0-15 point measure (Spec B).
It can be that the basic results mirror those reported in section 4; sales growth in China is
explained by changes in both labour and capital inputs, while that in Russia is explained

15
partly by change in labour input, but mostly by industry-specific and region-specific factors.
Managerial input is not a determinant of performance in either China or Russia, when
measured on the restricted 0-15 scale (Spec B for China). However, when we measure
managerial input in Chinese firms on the finer 32-160 scale (Spec A), it contributes to the
explanation of inter-firm variation in sales growth in China. The weakness of the 32-160 scale
lies with the fact that, in the absence of explicit knowledge about the relative importance of
the different types of restructuring activities across the firms, we weight all 32 activities
equally, leading to significant measurement error for the relevant variable. However, while
the results reported in Table 4 are merely suggestive of the potential impact of managerial
input on firm performance, there is prima facie evidence to suggest that more careful
collection of data on this intangible input is required to allow a more complete analysis of
firm performance in transition economies.
A very significant part of the inter-firm variation in sales growth in Russia is explained by
regional dummy variables that were included in the specification to capture the impact of
institutions – or the cross-regional difference thereof – on the growth of the firms. Indeed,
almost none of the explanatory variables that owe their inclusion in equation (5) to economic
theory have coefficients that are significantly different from zero. Since the data for the
Russian firms span the 1997-99 period, and given that the debt and currency crises in Russia
in 1998 may have affected the performance of the firms in a way that is not adequately
captured by the specification, we estimate equation (5) using data on Russian firms separately
for the 1997-98 and 1998-99 periods. If the results for the Russian firms presented in Table 3
had been driven by the events in 1998, the factors determining the growth of sales of firms
might be noticeably different in 1998-99 as compared with 1997-98, though any findings
must be interpreted cautiously because of the reduction in degrees of freedom required to
undertake the experiment.
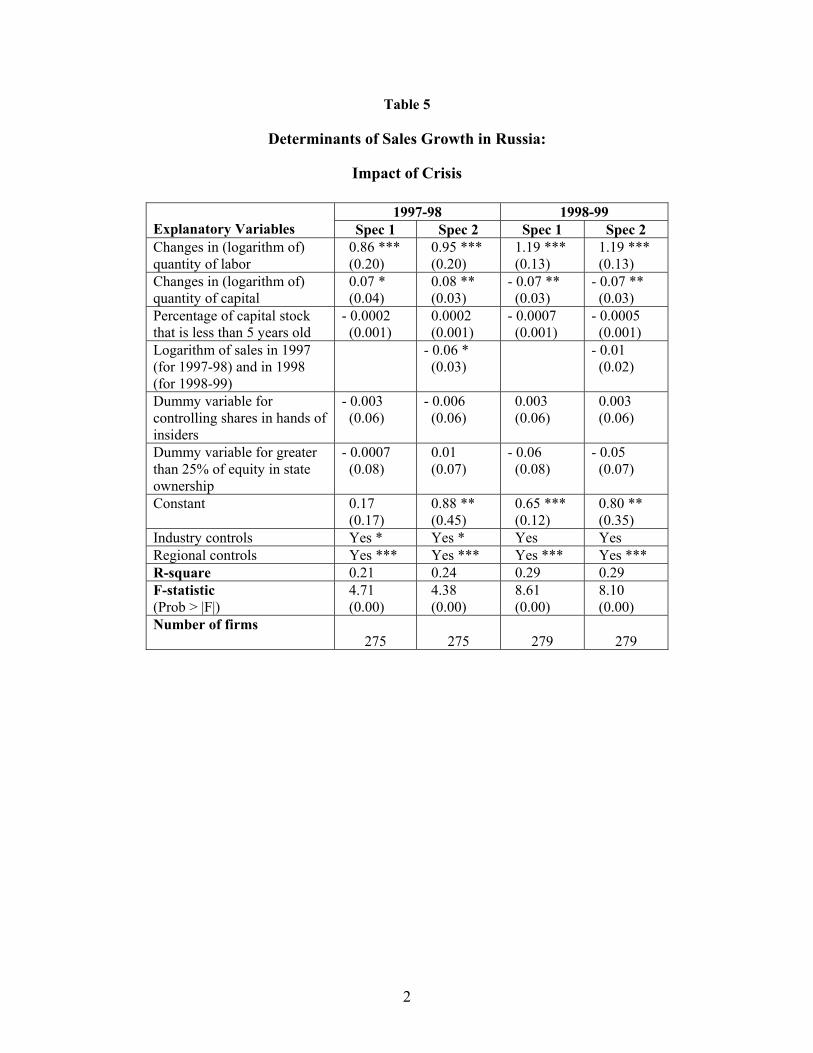
Table 5 presents the regression estimates for the two specifications – one including and the
other excluding a measure for the initial conditions – for Russia, for the 1997-98 and 1998-99
time periods. They indicate that in each of these two sub-periods – 1997-98 and 1998-99 –
changes in both factor inputs, labour and capital were correlated with growth of sales (i.e., α,
β ≠ 0). While the significance of capital, absent in the results presented in Table 3, is a
welcome improvement, the coefficient is actually found to be negative in the 1998-99 period,
probably reflecting a slow adjustment of the capital stock to the output shock. Capital quality
and ownership continue to play no role in explaining Russian enterprise performance in either

16
year. Thus we find that, even before the 1998 recession, much of the variation in sales growth
across firms in Russia is explained by region-specific factors.
What inference can we draw from the fact that in China, economic factors like changes in
labor and capital and, to a limited extent, the level of technology, explain inter-firm variation
in sales growth, while in Russia most of this variation is explained by region-specific factors?
The first and the most obvious implication is that, unlike in China, the Russian market
remains fragmented both in the geographical and institutional sense, an observation that is
consistent with our knowledge about the political economy of economic governance in Russia
and China (see e.g. Hanson, 2002, Mau, 2000, Granick, 1990). Since institutional factors
seem to have played such an important role in determining firm performance in Russia, and
since dummy variables by themselves do not indicate the relative importance of the different
types of institutions, we have re-estimated equation (5) substituting for the regional dummy
variables with variables that capture the characteristics of the regions. Specifically, we used
the Berkowitz and DeJong (2005) variables capturing inter-regional economic and
institutional differences in Russia.14 We also estimated specifications in which sectoral
relative prices were used instead of industry dummies, but these regressions were found to be
inferior in terms of goodness of fit and are therefore not reported.
Which institutional variables might have a significant impact on enterprise performance,
Berkowitz and DeJong (2005) have explored in detail the determinants of differential growth
rates across regions in Russia, and provide a useful source of information about inter-regional
differences in demand, infrastructure, legal arrangements, political orientation and corruption.
Most of these variables are highly correlated with each other, and hence one has to be careful
about the choice of variables to be included in a regression specification. After some
experimentation, we selected the variables that had the greatest impact on enterprise
performance (on the basis of goodness of fit) and yet were not highly correlated with each
other. Table 6 reports results from regressions on the entire Russian dataset and using
specifications I and II the results indicate that regional unemployment rate, a proxy for
regional demand, is the region-specific variable that has most significant impact on enterprise
=================================================14 Berkowitz and DeJong (2005) have a number of variables highlighting the differences among the regions of Russia. However, predictably, the variables are highly correlated, and after taking into consideration the possible multicollinearity problems we were able to use five of the variables: industrial growth during 1997-99, unemployment in 1998, per capita gross regional product in 1997, proportion of debt that was overdue in 1998, and index of legislative quality in 1997. The first three variables are proxies for regional demand, while the fourth and fifth variables are proxies for the strength of market institutions and enforceability of contracts in the regions.

17
performance as measured by growth of sales.15 The proportion of enterprise level debt that
was overdue at the time of the crisis and the regional index for legislative quality, proxies for
the quality of regional institutions, are significant in specification I, but unsurprisingly their
significance is lost once initial conditions are introduced in specification II. The use of
regional dummy variables and the Berkowitz and DeJong variables provide an equivalent
explanation for the inter-firm variation in performance.
5. Conclusions
In this paper, we have estimated similar equations across enterprise samples in China and
Russia, seeking to understand the factor driving of changing enterprise performance. China
commenced the transition more than twenty years ago, and has embraced a path of gradual
change, with liberalisation of domestic and international markets first and, more recently,
privatisation and capital market development. Russian reforms began only a decade ago, from
a much longer heritage of industrialisation and central planning, and with an almost
simultaneous and instantaneous liberalisation of markets and mass privatisation. The results
show that in the late 1990s economic factors had a much greater impact on enterprise
performance in China than in Russia, even though we have contrasted samples of firms from
more isolated inland regions in China with companies from across Russia, including leading
centres such as Moscow and St Petersburg.
In China, enterprises appear to be responsive to market and supply phenomena – managerial
effort, technology and investment. We find little or no significant impact from competition,
the extent of privatisation or from local or individual institutional factors in any of our
equations. In contrast, Russian firms are unresponsive to almost all the normal economic
drivers – outsider versus insider privatisation, competition, management effort, or
technological factors - though we identify a positive relationship between changes in sales
and in employment. The determinants of enterprise performance in Russia prove to be largely
region-specific and our later regressions suggest that these findings may be explained by
difference in managerial quality between Russia and China and inter-regional variation in the
quality of institutions.
These findings cast some light on several important policy debates. They suggest that there
may have been serious flaws in the reform strategy adapted in Russia, in either the design or
the implementation of policy. The null hypothesis is not well specified, because it is not clear
that alternative, more gradual and partial, strategies were a realistic option in Russia in the
=================================================15 The index accorded a value of 1-6 to each of the regions, 1 being the best and 6 the worst.

18
early 1990s (see Boycko, Shleifer and Vishny, 1995). Further, it is not evident whether the
Chinese reform process itself is optimal, given the concerns about the health of the Chinese
public sector banks and the resultant quasi-fiscal obligations of the government. However, the
effectiveness of reforms that liberalise markets while leaving ownership unchanged or only
partially adjusted seems to be strongly supported by our Chinese findings. We confirm that
state owned and corporatised firms in China are responding to market signals and improving
performance along the same lines as privately owned firms in market economies (see
Jefferson and Rawski, 1994). This suggests that, in certain contexts, such as the one of
modern China, market incentives are sufficient to ensure some degree of efficiency in
enterprise activity without immediate full privatisation. This is not to say that performance
cannot be further improved by private ownership; indeed the evidence is strong that
privatization improves enterprise performance (see Megginson and Netter, 2001). But it is
consistent with the view (see e.g. Stiglitz, 1999) that neither “big bang” reform policies nor
early privatisation are the sine qua non for successful transition.
=========================================================================================================================================Hence the negative sign of the coefficient.

19
REFERENCES
Barberis, N., Shleifer, A., Vishny, R., 1996. How Does Privatization Work? Evidence from
the Russian Shops. Journal of Political Economy, 104 (4), 764-790.
Bennett, J., Estrin, S., Maw, J., 2005. Mass Privatisation and Partial State Ownership of Firms
in Transition Economics. Journal of the European Economic Association, forthcoming
Berkowitz, D., DeJong, D., 2005. Entrepreneurship and Post-Socialist Growth. Oxford
Bulletin of Economics and Statistics, 67, 1, 25-47.
Blanchard, O., Aghion, P., 1996. On Insider Privatization. European Economic Review, 40
(3-5), 759-766.
Blanchard, O., Kremer, M., 1997. Disorganization. Quarterly Journal of Economics, 112 (4),
1091-1126.
Blasi, J., Kroumova, M., Kruse, D., 1997. Kremlin Capitalism, Privatizing the Russian
Economy. Cornell University Press, Ithaca.
Boycko, M., Shleifer, A., and Vishny, R., 1995. Privatizing Russia. MIT Press, Cambridge,
Mass.
Byrd, William, 1991,The Market Mechanism and Economic Reform in China, New York:
M.E. Sharpe.
Cao, Y., Qian, Y., Weingast, B., 1999. From Federalism, Chinese style to Privatization,
Chinese style. Economics of Transition, 7 (1), 103-131.
Claessens, S., Djankov, S., 1999. Enterprise Performance and Management Turnover in the
Czech Republic. European Economic Review, 43 (4-6), 1115-1124.
Commander, S., Dolinskaya, I., Mumssen, C., 2002. Determinants of Barter in Russia: An
Empirical Analysis. Journal of Development Economics, 67 (2), 275-307.
Commander, S., Fan, Q., Schaffer, M., 1996. Enterprise Restructuring and Economic Policy
in Russia. World Bank, Washington.
Djankov, S., Murrell, P., 2002. Enterprise Restructuring in Transition: A Quantitative Survey.
Journal of Economic Literature, 40(3), 739-793.

20
Earle, J., Estrin, S., Leschenko, L., 1996. Ownership Structures, Patters of Control and
Enterprise Behaviour in Russia, in Commander, S., Fan, Q., Schaffer, M. (Eds), Enterprise
Restructuring and Economic Policy in Russia, Washington DC:EDI and World Bank.
Earle, J., Estrin, S., 2003. Privatization, Competition and Budget Constraints: Disciplining
Enterprises in Russia. Economics of Planning, 36, 1-22.
EBRD Transition Report 1999, 2001, 2004;
Ellman, M., 1989. Socialist Planning. Cambridge, Cambridge University Press.
Estrin, S., 2002. Competition and Corporate Governance in Transition. Journal of Economic
Perspectives, 16 (1), 101-124.
Estrin, S., 2003. Measuring the impact of Russian Privatisation at the Turn of the Century: An
Introduction to the Symposium. Comparative Economic Studies 45 (2), 109-116 and
Appendix, 204-212.
Estrin, S., Gelb, A., Singh, I., 1995. Shocks and Adjustment by Firms in Transition, A
Comparative Study. Journal of Comparative Economics, 21 (2), 131-153.
Estrin, S., Wright, M., 1999. Corporate Governance in the Former Soviet Union, An
Overview. Journal of Comparative Economics, 27 (3), 398-421.
Fischer, S., Gelb, A., 1991. The Process of Socialist Economic Transformation. Journal of
Economic Perspectives, 5 (4), 91-105.
Frydman, R., Gray, C., Hessel, M., Rapaczynski, A., 1999. When Does Privatization Work?
The Impact of Private Ownership on Corporate Performance in the Transition Economies.
Quarterly Journal of Economics, 114 (4), 1153-1191.
Granick, D., 1990. Chinese State Enterprises, A Regional Property Rights Analysis.
University of Chicago Press, Chicago and London.
Granville, B., Oppenheimer, P., (Eds.), 2001. Russia’s Post-Communist Economy. Oxford
University Press, New York.
Groves, T., Hong, Y., McMillan, J., Naughton, B., 1994. Autonomy and Incentives in
Chinese State Enterprises. Quarterly Journal of Economics, 109 (1), 183-209.

21
Groves, T., Hong, Y., McMillan, J., Naughton, B., 1995. China's Evolving Managerial Labor
Market. Journal of Political Economy, 103 (4), 873-892.
Hanson, P., 2002. Barriers to long-term growth in Russia. Economy and Society, 31 (1), 62-
84.
Huang, Y., Duncan, R., 1997. How Successful Were China’s State Sector Reforms? Journal
of Comparative Economics, 24 (1), 65-78.
Jefferson, G., Rawski, T., 1994. Enterprise Reform in Chinese Industry. The Journal of
Economic Perspectives, 8 (2), 47-70.
Jefferson, G., Rawski, T., Zheng, Y., 1996. Chinese Industrial Productivity, Trends,
Measurement Issues, and Recent Developments. Journal of Comparative Economics, 23 (2),
146-180.
Jefferson, G., Rawski, T., Zheng, Y., 2000. Ownership, Productivity Change, and Financial
Performance in Chinese Industry. Journal of Comparative Economics, 28 (4), 786-813.
Lau, L., Qian, Y. and Roland, G.,2000, Reform Without Losers: An Interpretation of China’s
Dual-Track Approach to Transition, Journal of Political Economy, 108,120-143.
Li, H., 1999. State Factories in Transition – Openness, Competition, and Productivity. Journal
of Development Economics, 58 (2), 429-462.
Mau, V., 2000. Russian Economic Reform as Seen by an Insider, Success or Failure? Royal
Institute of International Affairs, London.
Megginson, W., Netter, J., 2001. From State to Market, A Survey of Empirical Studies on
Privatization. Journal of Economic Literature, 39 (2), 321-389.
Nellis, J., 2000. Privatization in Transition Economies, What Happened? What’s Next?
Mimeo, World Bank, Washington.
Nickell, S., 1996. Competition and Corporate Performance. Journal of Political Economy, 104
(4), 724-746.
Parker, E., 1997. The Effect of Scale on the Response to Reform by Chinese State-Owned
Construction Units. Journal of Development Economics, 52 (2), 331-353.

22
Qian, Y., Roland, G., Xu, C., 1999. Why Is China Different from Eastern Europe?
Perspectives from Organization Theory. European Economic Review, 43 (4-6), 1085-1094.
Qian, Y., 2000. The Process of China’s Market Transition (1978-1998), The Evolutionary,
Historical, and Comparative Perspectives. Journal of International and Theoretical
Economics, 156 (1), 151-171.
Qian, Y., 2003, How Reform Worked in China, in D. Rodrik (ed), In Search of Prosperity,
Princeton: Princeton University Press.
Sachs, J., Woo, W., 2000. The Debate on Understanding China’s Economic Growth. In Eric
Maskin, Andras Simonovits (eds.), Planning, Shortage, and Transformation: Essays in Honor
of Janos Kornai, MIT, 2000.
Stiglitz, J., 1999. Whither Reform? Ten Years of Transition. Keynote address at the Annual
Bank Conference on Development Economics, World Bank, Washington.
Svejnar, J., 2002. Transition Economies, Performance and Challenges. Journal of Economic
Perspectives, 16 (1), 3-28.
Tlusty-Sheen, A., 2001. Restructuring of State Owned Enterprises in Sha’anxi, Henan and
Shanxi provinces in the People’s Republic of China, mimeo London Business School, Centre
for New and Emerging Markets, London.
Tsui, K., 1996. Economic Reform and Interprovincial Inequalities in China. Journal of
Development Economics, 50 (2), 353-368.
Vickers, J., Yarrow, G., 1988. Privatization, An Economic Analysis. MIT Press, Cambridge,
Massachusetts.
Wang, Y., Yao, Y., 2001. Sources of China’s Economic Growth, 1952-99, Incorporating
Human Capital Accumulation. Mimeo, World Bank, Washington.
Woo, W., 1994. The Art of Reforming Centrally Planned Economies, Comparing China,
Poland and Russia. Journal of Comparative Economics, 18 (3), 276-308.
World Bank, 1996. From Plan to Market World Development Report. Washington, DC,
Oxford University Press.

23
Table 1
Descriptive Statistics
China Russia Variables 1995 1999 1997 1999 Percentage of firms state owned 79 66Percentage of equity owned by government a
12 7
Percentage of equity owned by insiders
73 62
Sales Yuan/Rouble (thousands) US dollars (thousands)
26006.873114.60
28369.57 3430.42
102694.20
17705.90
166151.20
6754.11Labor force 4279 3889 971 887Stock of capital Yuan/Rouble (thousands) US dollars (thousands)
22393.55 2681.86
33604.21 4063.39
157665.40
27183.69
78234.78 3180.28
Average proportion of capital stock that is less than 5 years old
18 7
Notes: a) Almost all Russian firms in the sample had been privatised by 1999. b) Measured as the ratio of temporary laborers to laborers with permanent/long term contracts. c) The scale for Chinese data is 32-160, while the range for the Russian data set is 0-15.

24
Table 2
Determinants of Sales Growth in China
Explanatory Variables Spec 1 Spec 2 Spec 3 Spec 4 Changes in (logarithm of) quantity of labor
0.83 *** (0.28)
0.83 *** (0.27)
0.78 *** (0.38)
0.78 *** (0.26)
Changes in (logarithm of) quantity of capital
0.43 *** (0.13)
0.42 *** (0.13)
0.43 *** (0.13)
0.42 *** (0.14)
Percentage of capital stock that is less than 5 years old
0.006 (0.003)
0.006 * (0.003)
0.006 (0.004)
0.006 (0.004)
Logarithm of sales in 1995 - 0.01 (0.01)
- 0.02 (0.04)
- 0.02 (0.04)
Dummy variable for state ownership in 1999
0.01 (0.15)
0.02 (0.15)
0.03 (0.16)
0.005 (0.172)
Constant - 0.56 *** (0.14)
- 0.42 (0.38)
- 0.34 (0.44)
- 0.32 (0.44)
Industry controls No No Yes Yes Regional controls No No No Yes R-square 0.23 0.23 0.23 0.24 F-statistic (Prob > |F|)
9.90 (0.00)
8.37 (0.00)
5.44 (0.00)
4.57 (0.00)
Number of firms Number of firm years
138
552
138
552
138
552
138
552

25
Table 3
Determinants of Sales Growth in Russia
Explanatory Variables Spec 1 Spec 2 Spec 3 Spec 4 Changes in (logarithm of) quantity of labor
1.29 *** (0.18)
1.31 *** (0.18)
1.33 *** (0.18)
1.34 *** (0.18)
Changes in (logarithm of) quantity of capital
0.02 (0.03)
0.04 (0.03)
0.04 (0.03)
0.03 (0.03)
Percentage of capital stock that is less than 5 years old
0.0007 (0.001)
0.001 (0.002)
0.001 (0.002)
- 0.001 (0.002)
Logarithm of sales in 1995 - 0.06 (0.03)
- 0.05 (0.03)
- 0.06 * (0.03)
Dummy variable for controlling shares in hands of insiders
- 0.02 (0.08)
- 0.03 (0.08)
- 0.009 (0.08)
0.007 (0.07)
Dummy variable for greater than 25% of equity in state ownership
- 0.03 (0.08)
0.0003 (0.07)
- 0.005 (0.08)
- 0.02 (0.07)
Constant 0.64 *** (0.07)
1.29 *** (0.36)
1.16 *** (0.38)
1.52 *** (0.45)
Industry controls No No Yes *** Yes ** Regional controls No No No Yes *** R-square 0.22 0.24 0.28 0.41 F-statistic (Prob > |F|)
13.30 (0.00)
11.76 (0.00)
7.65 (0.00)
8.88 (0.00)
Number of firms Number of firm years
275 550
275 550
275 550
275 550

Table 4
Determinants of Sales Growth in Russia and China: Impact of Restructuring
China Explanatory Variables
Russia Spec A Spec B Changes in (logarithm of) quantity of labor
1.35 *** (0.19)
0.74 *** (0.27)
0.78 *** (0.28)
Changes in (logarithm of) quantity of capital
0.03 (0.03)
0.44 *** (0.13)
0.42 *** (0.13)
Percentage of capital stock that is less than 5 years old
- 0.001 (0.002)
0.006 (0.004)
0.006 (0.004)
Restructuring achieved by firm since 1995 (China) and since 1997 (Russia)
0.006 (0.01)
0.008 * (0.005)
0.006 (0.004)
Logarithm of sales in 1995 (China) and in 1997 (Russia)
- 0.06 * (0.03)
- 0.04 (0.04)
- 0.02 (0.04)
Dummy variable for state ownership in 1999
- 0.006 (0.17)
0.005 (0.16)
Dummy variable for controlling shares in hands of insiders
0.009 (0.09)
Dummy variable for greater than 25% of equity in state ownership
- 0.01 (0.07)
Constant 1.49 *** (0.46)
- 0.70 * (0.43)
- 0.32 (0.42)
Industry controls Yes ** Yes Yes Regional controls Yes *** Yes Yes R-square 0.42 0.25 0.24 F-statistic (Prob > |F|)
8.49 (0.00)
4.81 (0.00)
4.40 (0.00)
Number of firms Number of firm years
275 550
137 548
138 552
2
Table 5
Determinants of Sales Growth in Russia:
Impact of Crisis
1997-98 1998-99 Explanatory Variables Spec 1 Spec 2 Spec 1 Spec 2 Changes in (logarithm of) quantity of labor
0.86 *** (0.20)
0.95 *** (0.20)
1.19 *** (0.13)
1.19 *** (0.13)
Changes in (logarithm of) quantity of capital
0.07 * (0.04)
0.08 ** (0.03)
- 0.07 ** (0.03)
- 0.07 ** (0.03)
Percentage of capital stock that is less than 5 years old
- 0.0002 (0.001)
0.0002 (0.001)
- 0.0007 (0.001)
- 0.0005 (0.001)
Logarithm of sales in 1997 (for 1997-98) and in 1998 (for 1998-99)
- 0.06 * (0.03)
- 0.01 (0.02)
Dummy variable for controlling shares in hands of insiders
- 0.003 (0.06)
- 0.006 (0.06)
0.003 (0.06)
0.003 (0.06)
Dummy variable for greater than 25% of equity in state ownership
- 0.0007 (0.08)
0.01 (0.07)
- 0.06 (0.08)
- 0.05 (0.07)
Constant 0.17 (0.17)
0.88 ** (0.45)
0.65 *** (0.12)
0.80 ** (0.35)
Industry controls Yes * Yes * Yes Yes Regional controls Yes *** Yes *** Yes *** Yes *** R-square 0.21 0.24 0.29 0.29 F-statistic (Prob > |F|)
4.71 (0.00)
4.38 (0.00)
8.61 (0.00)
8.10 (0.00)
Number of firms 275
275
279
279

3
Table 6
Determinants of Sales Growth in Russia and China: Impact of Regional Factors
Explanatory Variables
Spec I
Spec II Changes in (logarithm of) quantity of labor
1.19 *** (0.16)
1.20 *** (0.16)
Changes in (logarithm of) quantity of capital
0.009 (0.04)
0.03 (0.03)
Percentage of capital stock that is less than 5 years old
- 0.002 (0.002)
- 0.001 (0.002)
Industrial growth during 1997-99
0.003 (0.002)
0.004 (0.003)
Proportion of debt that was overdue in 1998
- 0.008 * (0.004)
- 0.006 (0.004)
Unemployment rate in 1998 - 0.06 *** (0.01)
- 0.07 *** (0.01)
Per capita gross regional product in 1997
- 0.007 (0.008)
- 0.009 (0.008)
Index of legislative quality in 1997
- 0.03 * (0.01)
- 0.028 (0.018)
Logarithm of sales in 1997 - 0.08 ** (0.03)
Dummy variable for controlling shares in hands of insiders
0.01 (0.08)
0.01 (0.07)
Dummy variable for greater than 25% of equity in state ownership
- 0.08 (0.08)
- 0.05 (0.07)
Constant 1.52 *** (0.22)
2.49 *** (0.50)
Industry controls Yes ** Yes ** R-square 0.42 0.45 F-statistic (Prob > |F|)
11.07 (0.00)
10.68 (0.00)
Number of firms Number of firm years=
223 446
223 446