centre for geographical economic research · spatially unbalanced growth ... no sooner had the idea...
TRANSCRIPT

Spatially Unbalanced Growth in the British Economy
Ben Gardiner*, Ron Martin** and Peter Tyler***
* Cambridge Econometrics, UK, and the Institute of Prospective Technological Studies (JRC-IPTS), Seville, Spain.
** Department of Geography, University of Cambridge, UK *** Department of Land Economy, University of Cambridge, UK
June 2012
Working Paper CGER No. 1 The views expressed in this research paper are those of the authors alone.
Centre for Geographical Economic Research

1
The Centre for Geographical Economic Research is based in the Department of Geography and the Department of Land Economy, in the University of Cambridge. It carries out research concerned with several aspects of regional and local economic growth and development. It is currently undertaking a programme of research on how regions react to recession: resilience, recovery and long run-impacts. The research is funded by the Economic and Social Research Council Grant number ES/1035811/1. The views expressed in this paper are those of the authors alone. The ESRC Recession and Resilience Project has three Principal Investigators: Professor Ron Martin (Geography, Cambridge), Professor Peter Tyler (Land Economy, Cambridge), and Professor Peter Sunley (Geography, Southampton). Working alongside them are Professor Hashem Pesaran (Economics, Cambridge), Ben Gardiner (from Cambridge Econometrics) and Alice Clarke. They are also being assisted by Terry Bevan and Anna Morgan (from Trends Business Research, Newcastle). This working paper falls within the ‘Spatial Rebalancing of the Economy’ theme
Local and Regional Economic Resilience and Adaptability
Spatial Rebalancing of the Economy
Local Cluster Dynamics and Evolution
Local and Regional Competitiveness
Enterprise, Creativity and Place
Unlocking the Potential for Local Economic Growth

2
Spatially Unbalanced Growth in the British Economy
Abstract The financial crisis and consequential recession that brought the UK’s long economic boom of 1993-2008 to a dramatic end have generated considerable debate about the need to ‘rebalance’ the economy, both sectorally and spatially. In this paper we examine the scale and nature of imbalance in the UK economy. We first review what different theories of regional growth have to say about the issue of spatial and sectoral imbalance. Next, against this background, the stylised facts of sectoral and spatial imbalance, particularly as between the South and North of the United Kingdom, are identified. We then use dynamic multi-factor partitioning methods to determine the relative contribution that sectoral composition has made to North-South regional imbalance. In the light of our findings we argue that there is an urgent need for a clearly identified industrial policy that is coordinated with a regional policy that seriously begins to address the North-South imbalance in the UK’s economy that has become so deep-seated over recent decades. Key Words: Unbalanced economic growth, Spatial imbalance, Sectoral imbalance, Agglomeration, Regional policy JEL Classification: R10 R11 R12 R58

3
1. Introduction: The New-Found Concern to ‘Rebalance’ the British Economy A major economic recession inevitably provokes a search for causes and explanations, as well as a rethink of policy agendas and models. The recent recession in the UK, USA and across many of the advanced economies more generally, has been no exception. The causes of the recession resided in the nature of the economic boom that preceded it. In the UK, as late as March 2007, the Chancellor of the Exchequer, Gordon Brown, had celebrated what he claimed was the ‘longest period of non-inflationary continued expansion in Britain’s history’ (Brown, 2007). However, what was evident to some observers even at the time, and as events themselves unfolded, was that the boom had been based not on firm foundations and fiscal prudence as Chancellor Brown claimed, but on a highly ‘unbalanced’ or skewed economy, on a mode of growth that was inherently unsustainable, and also highly vulnerable to external shocks (Martin, 2010a). The most glaring aspect of that imbalance was the role played by the financial sector. The economic growth that took place in the UK between 1993 and 2007, though certainly high by historical standards, had been driven by an expansion of mortgage finance, bank lending and private debt of epic proportions. In 1993 personal debt stood at £400bn; by 2007, just before the financial bubble burst, it had reached £1.4tn, more than the UK economy produced in that year. Over 1993-2008, the debt of the UK financial sector increased two and a half fold, to reach more than 125 percent of GDP. A similar process had taken place in the USA. The collapse of the mortgage debt bubble, first in the US, and then in the UK and elsewhere, triggered the banking crisis and credit crunch, which in turn triggered the recession (see Martin 2010b). In this sense, the crisis and ensuing recession were the direct consequence of an unbalanced mode of economic growth far too dependent on the financial sector. Yet, even if the US financial crisis had not happened, it is questionable whether the UK’s ‘long boom’ would have been sustainable. What the crisis and recession have done is to open up a wider debate about the unbalanced nature of the British economy. The problem is seen not just as one of sectoral imbalance – an overdependence on financial activity and a need to boost the importance and role of other sectors, such as advanced manufacturing and the so-called ‘creative’ industries - but also one of an imbalance between the private and public spheres of the economy. The argument is that the public sector has become too large relative to, and at the expense of, the private sector. Growth, in other words, had become too reliant on ever-increasing government spending. The upshot of the growth of public spending under New Labour after 1997, the huge publicly-funded bail-out of the

4
British banking system during the financial crisis of 2008-2009, and the increase in spending on welfare support because of the recession, has left the UK with a level of net public debt not seen since the Second World War, and under the new Coalition Government has provoked a programme of severe fiscal austerity (public spending cuts) to restore the public finances. A further aspect of imbalance that became evident during the boom was that economic growth was spatially uneven, particularly as between the North and South of the country. A ‘North-South divide’ has long been a feature of the British economy (see Martin, 1988, 2004; Martin and Tyler, 1991, 1994), but traditionally the problem has been viewed as one of addressing the lagging growth performance of the country’s old industrial and peripheral regions. This time around, however, the focus seems to have shifted more towards the problems that have emanated from the marked concentration of economic activity and growth in the ‘greater’ South East of England. This part of the UK, which includes London, is where the financial boom and house price bubble of the 1992-2007 period were primarily located. In broad terms, the problem has been that the sectoral and private-public imbalances in the economy have also had a distinctive regional dimension. While the boom in knowledge-intensive services, and especially financial and business services, was concentrated mainly in London and the South East, the growth of public sector activity had been disproportionately concentrated in Northern cities and regions. ‘Rebalancing’ the UK economy has thus become a central component of Government policy statements about recovery and restoring stable and sustained economic growth. The idea of ‘rebalancing’ is projected as a means of rebuilding new economic structures and policy models that somehow correct the problematic and disruptive imbalances that generated the crisis. ‘Rebalancing’ the economy has become the new mantra:
The Government’s ambition is to create a fairer and more balanced economy – one that is not so dependent on a narrow range of sectors, is driven by private sector growth and has new business opportunities that are more evenly balanced across the country and between industries (Department for Business, Innovation and Skills, 2010a, p. 5; emphasis added).
Government attention has focused particularly on the sectoral, public-private, and spatial aspects of national economic imbalance. Our focus here is on the spatial and sectoral dimensions of economic imbalance, since the widely held view across Government is that these two aspects have been inextricably related. Thus according to the Government:

5
For years, our prosperity has been pinned on financial wizardry in London’s Square Mile, with other sectors and other regions left behind. That imbalance left us hugely exposed when the banking crisis hit. And now Britain has a budget deficit higher than at any time since the Second World War. It is time to correct that imbalance. We need to spread growth across the whole country and across all sectors. We need to rediscover our talent for building and making things again (Nick Clegg, Deputy Prime Minister, 2010).
Yet this focus on ‘rebalancing’ - on ‘spreading growth more evenly across the country and between industries’ and the possible relation between spatial and industrial imbalance - raises a number of key questions. Firstly, what do the various theories of regional growth and developments have to say about regional imbalance and in particular its relationship to national growth? Secondly, what influence do these theories assign to ‘sectoral’ factors relative to other drivers of regional growth and competitiveness? Thirdly, what is the scale of spatial economic imbalance in the UK and what historically has been the impact that sectoral factors have made? And, finally, what sort of policies might achieve greater spatial and sectoral balance? These questions provide the focus for this paper. We begin in the next section by reviewing what regional development theories have to say about spatial imbalance in economic growth and the relative emphasis they give to its relationship to the national growth of an economy and its sectoral composition. We then examine the stylised facts as to the scale and nature of spatial imbalance in the growth of the UK economy, not just over the ‘long boom’ of 1992-2007, but also over the whole period since the beginning of the 1970s and examine the extent to which this imbalance has been affected by how the national economy has performed. We then apply different shift-share approaches to regional data over the period 1971-2010 to provide some broad insight into how far spatial differences in sectoral structure have been related to the degree of spatial imbalance in regional economic growth in the UK, compared to other regional-specific factors, and whether there is evidence for interactive effects between the latter and regional economic structure. We conclude by reflecting on the policy challenge involved in seeking to ‘spatially rebalance’ the UK economy and whether the recently announced policies of the Coalition Government are likely to secure this goal. 2. Regional Economic Imbalance: Theoretical Issues Although discussions over the meaning and promotion of ‘balanced growth’ date back eighty years or so, the definition of the notion has always been elusive and contentious, and remains so today (Ohlin, 1959; Danino-Pastore, 1963; Temple,

6
2008). In development economics, for example, the issues of sectoral imbalance and spatial imbalance, and the relationship between the two, have long attracted debate. No sooner had the idea of ‘balanced growth’, defined as the simultaneous and coordinated expansion of several sectors – i.e. sectoral diversification – been proposed in the 1940s and 1950s (for example, Rosenstein-Rodan, 1943; Nurske, 1956, 1958), than it was countered by those advocating ‘unbalanced growth’, that is a model of growth based on sectoral specialization (Fleming, 1955; Sheahan, 1958; Hirschman, 1958, Streeten, 1959). Thus according to Hirschman (1958), unbalanced growth generates external economies in the fast-growing sectors, which in their turn open up opportunities for and stimulate growth, via both backward and forward linkages, in other sectors: “If an economy is to be kept moving ahead, the task of development policy is to maintain tensions, disproportions and disequilibria”. This is claimed to hold for all societies, developed or underdeveloped. This debate, over sectoral diversification versus specialization, was also linked to the issue of spatially or regionally balanced growth, not just whether diversification or specialization is the best strategy to promote growth in lagging or less developed regions, but whether the spatial agglomeration of certain sectors in particular regions was not only an inevitable product of the national economic growth process, but also maximized that growth (for example, Myrdal, 1958; Hirschman, 1958, Alonso, 1968, Gardiner, et al, 2011). Most modern regional growth theories also incorporate a role for regional economic structure. Under the simplest version of the neoclassical regional growth model, if initially some regions grow faster than others and regional per capita incomes diverge as a consequence, the claim is that various self-correcting processes, combined with the assumptions of diminishing returns to factor inputs and constant returns to scale, will sooner or later lead to a shift of growth dynamic to the lagging regions, and to a consequential catch-up of their per capita incomes with those in the initially leading regions. Low per capita GDP regions should thus show faster rates of growth than richer, high per capita regions. In reality, measured rates of regional convergence are often much less than predicted by this model, and in some instances – such as the UK studied here – regional per capita incomes are found to diverge rather than converge. But this outcome can be subsumed under the neoclassical model if the latter is extended to take account of different structural conditions in the various regions in question, including different sectoral specialisations. Such models can then predict conditional regional convergence or even regional divergence. Most regional growth theories predict regionally imbalanced growth as an inherent feature of the economic system. Spatial differences in economic performance, rather than setting off automatic self-correcting processes, are likely instead to be self-reinforcing: spatial economic imbalance, in the sense of regional disparities in growth

7
and incomes, may not only be persistent but may in fact intensify over time. Most of these ‘imbalance’ theories predict that spatial agglomeration of economic activity is an inevitable result of increasing returns effects. This was, of course, the basis of Myrdal’s (1958) and Kaldor’s (1970, 1981) models of circular and cumulative causation. In both models, the spatial agglomeration of economic activity in one particular region of an economy - call this area the South - creates various external economies that confer competitive advantage on the firms located there, and this competitive advantage - especially in export–orientated sectors - not only promotes the growth of those firms, and stimulates innovation, but also attracts yet more firms to the spatial agglomeration. Growth in productivity and growth in output interact in a cumulative manner and the imbalance between the South and other regions – the North - increases. Both authors recognized that there may be limits to such cumulative regional imbalance arising from the emergence of ‘push’ factors (such as congestion and rising costs) in the high growth South, and various ‘built-in stabilisers’ associated with automatic income transfers (such as unemployment benefits and low-income supplements) or public works that aid the North. But both also acknowledged that such centrifugal and ‘backwash’ effects may not be enough to achieve a significant spatial rebalancing of the economy as between the North and South, and that there was therefore a case for state intervention to assist that process. In Kaldor’s model especially, it is the competitiveness of a region’s export base – and he put particular stress on manufacturing export industries – that drives the process of self-reinforcing growth. A somewhat similar focus on the competitiveness of a region’s tradeables is found in Rowthorn’s (2010) model of uneven and combined regional development. His model highlights the central role played by economic structure, and especially export-orientated activities (the ‘economic base’) in the evolution of regional economies. In his model, the long-run prosperity of a regional economy is determined primarily by the strength of its export base; hence if a region’s export base contracts this will have negative multiplier effects on the regional economy as a whole. In the short run there are a variety of mechanisms that serve to limit the scale of such negative effects – for example, the operation of the welfare state. But what happens in the long run, according to Rowthorn, depends on migration. If out-migration is easy then a fall in a region’s export base will set off an exodus of workers to other regions. Not only are the more skilled and educated more likely to move out, with implications for the region’s skill base, the exodus of population will itself mean further negative multiplier effects on local business and employment. Thus the initial decline will set in train a long-run multiplier as emigration leads to a downward spiral of shrinking population and falling employment. Rowthorn argues that this is what has happened in Northern Britain over the past 40 years or so, and why a ‘North-South’ divide in economic growth became established.

8
Rowthorn’s model in turn bears some resemblance to a much earlier theory of unbalanced regional development advanced some years ago by Holland (1976). Holland’s basic argument is that factor flows - of labour and capital – serve not to correct regional imbalances in growth and prosperity, but operate to accentuate such imbalances. The basic assumption is that initially, each region - say a North and a South - has the same, upward sloping ‘full employment growth ceiling’, that is a growth path corresponding to the full utilization of its human and capital resources, the rate of technological change, and so on (see Figure 1). Initially, both the North and South regions grow at rates below this ceiling. Assume that the South now experiences an autonomous increases in investment, and hence an increase in growth. If the two regions were isolated economies without inter-regional factor mobility, then as the South approached the full employment ceiling it would experience the onset of supply constraints and inflationary pressures (in wage, land and other costs) which would work to slow down the rate of growth. But freedom of factor movement between regions enables the growth region to raise its full employment growth ceiling by attracting in labour and capital, and thus to sustain an upward growth path over and above what it would be if it were an isolated economy. At the same time, this region’s gain is the North's loss. The flows of labour and capital out of the North into the more prosperous and faster South, serve to lower the full employment growth ceilings of the North. Thus factor flows result in shift in the growth ceilings and growth paths of regions, and hence in long-run regional imbalance, and potentially increasing divergence in regional per capita incomes (Figure 6). Holland also suggests that the raising of the full employment growth ceiling in the faster growing region will be reinforced by the externalities arising from the increased agglomeration of economic activity in that region. The recognition that increasing returns effects arising from spatial agglomeration, combined with factor flows, can lead to spatially unbalanced development has also formed the basis of the influential ‘new economic geography’ (NEG) models (see Krugman, 1991a, 1991b; Fujita, Krugman and Venables, 1999; Fujita and Thisse, 2002; Baldwin et al, 2003; Brakman, Garretsen and van Marrewijk, 2009). Although these models have gone through several generations of development (see Martin, 2011), and are highly restricted in terms of their assumptions and treatment of space and time (see Garretsen and Martin, 2010), the core argument is that if labour and

9
Figure 1: Regional Growth Trends with and without Factor Mobility capital are geographically mobile whilst knowledge spillovers are spatially localized, then - under conditions of free trade and low transport costs - the development of a core-periphery pattern of economic activity and growth is a likely equilibrium outcome. Firms and workers will tend to agglomerate in a particular region, which gives rise to localized increasing returns effects, which in turn raise the productivity of firm and workers located there, which in turn attracts still more firms and workers into the region. These models bear an affinity with Hirschman’s earlier unbalanced growth model in that they too emphasise the role of forward and backward linkages in promoting faster growth in spatially agglomerated regions. A high-productivity, high-growth core region thus emerges, in which per capita incomes are also higher than in other (‘peripheral’) regions. Further, under the assumptions of the typical NEG model, the core region will tend to attract and become specialized in the more productive sectors of economic activity, so that there is regional imbalance not only in growth rates but also in sectoral structure. Also in common with the earlier unbalanced growth models, these NEG models predict a positive relationship between regional agglomeration or imbalance and national growth, at least up to some level of regional imbalance at which congestion effects, market crowding effects

10
and other diseconomies in the core region outweigh the positive increasing returns effects of spatial agglomeration of economic activity there. On the basis of the NEG framework, some have argued that rather than national growth being conducive for and necessary for regional balance, spatial imbalance is in fact conducive for national growth, provided the positive externalities and increasing returns effects associated with the spatial agglomeration of economic activity outweigh the negative externalities and diseconomies (see Baldwin, et al 2003; P. Martin, 2005). It is also a view that has found adherents inside the UK Treasury:
Theory and empirical evidence suggests that allowing regional concentration of economic activity will increase national growth. As long as economies of scale , knowledge spillovers and a local pool of skilled labour result in productivity gains that outweigh congestion costs, the economy will benefit from agglomeration, in efficiency and growth terms at least…. Policies that aim to spread growth amongst regions are running counter to the natural growth process and are difficult to justify on efficiency grounds, unless significant congestion costs exist (Lees, 2006, p. 24; emphasis added).
Some observers have taken this argument to extremes by recommending the active promotion of greater regional imbalance by encouraging the movement of population out of Northern cities into London and the South East, in effect abandoning much of the North:
There is no realistic prospect that our [Northern] regeneration towns can converge with London and the South East. There is, however, a very real prospect of encouraging significant numbers of people to move from those towns to London and the South East…. The implication of economic geography for the South and particularly South East are clear: Britain will be unambiguously richer if we allow more people to live in London and its hinterland (Leunig and Swafield, 2008, pp. 5-6).
A major shift of population from North to South may possibly benefit London and the South East, but whether it would make Britain as a whole ‘unambiguously richer’ is very doubtful. As Rowthorn (op cit) has shown, the net drift of population from North to South has been a distinctive feature of Britain’s economic landscape for several decades, and as is well known, it tends to be the more skilled and enterprising workers who move. This may swell the skilled workforce, and increase the producivity of the economy of London and the South East, but it would merely further suppress entrepreneurship and economic growth in the Northern parts of the country. To add to this problem there is is the question of whether ever-increasing in-migration into the South is sustainable from an environmental point of view, let alone from an inflationary standpoint. The assumed (or presumed) ‘trade-off’ between national growth and greater spatial economic balance contained in these anti-regional policy

11
arguments is neither well supported empirically nor compellingly persuasive theoretically (see for example, Martin, 2008; Gardiner, Martin and Tyler, 2011). NEG theorists argue that in devising policies aimed at simultaneously reducing spatial imbalance and increasing national growth, it is important to identify the market failures at work and to act directly on the source of these failures. In terms of the models, the two key failures are localized technological spillovers and congestion costs, so policies should be directed at fostering the diffusion of technology and reducing congestion. The more localized are technological spillovers the more regionally uneven economic growth will be, so that if technological advances can be promoted in slow growing regions this should raise their growth rate without hindering that in the fast growing regions. Interestingly, these models also suggest that measures (including infrastructural investments) aimed at reducing transport costs between core and peripheral regions may actually end up fostering more growth in the former than in the latter (see Baldwin et al, 2003). What all of the above theoretical perspectives stress is the interaction between sectoral structure – especially a region’s export base – and the productivity and competitiveness raising effects that accrue from the spatial agglomeration of economic activity. Whether in Kaldorian models or NEG models, the focus is on manufacturing as the driver of economic growth, and its importance in a region’s export base. None of the models says much about services. Yet it is quite clear that services – and of course financial services – have taken over from manufacturing as the leading source of economic growth, albeit as it turns out, just as cyclically prone as manufacturing. Further, it is also clear, again as finance shows only too starkly, services are just as subject to agglomeration economies as are manufacturing activities. One of the few models to link the structure and evolution of financial system with uneven regional development is that by Chick and Dow (1988, see also Dow, 1999). These authors combine a stages-of-banking model (from pure intermediation through to securitisation) with a centre-periphery characterisation of regional economies. As the banking system evolves over time, these authors argue, it tends to become increasingly institutionally concentrated and in many instances also increasingly spatially agglomerated, into one or just a few major financial centres or city-regions, which also are often a nation’s high growth regions. These centre-regional economies often also tend to be dominated by high-level (research-intensive) manufacturing and services, a concentration of head offices, in the financial as well as production sectors, and relatively high levels of per capita incomes. Peripheral (or slow growing) regions, on the other hand are characterised by a relative dependence on primary and low-level manufacturing and production, a

12
high dependence on outside ownership and low relative per capita incomes. Assuming an integrated financial system, centre-regional capital will be made available to peripheral regions to finance investment. But should a weakening in economic conditions occur in the periphery, which generally involves weakening exports, a withdrawal of capital could well arise, creating problems in the capital account as well as the current account. Unless there are significant mechanisms in place for fiscal redistribution, or access to preferential public sector sources of finance, there will be downward income adjustment in the periphery to reduce imports. The greater the degree of financial integration, the greater the dependence of the peripheral regions on outside sources of finance, given the financial domination of the centre. According to Chick and Dow, the vulnerability of the periphery’s capital account is exacerbated by the attraction of the centre’s financial markets to the periphery’s savers. The financial centre enjoys a competitive advantage, in being able to offer higher returns than small local institutions. In addition, long experience of economic vulnerability in the periphery tends to generate endemic liquidity preference there that is a preference for low-risk assets and reluctance to borrow. The financial centre will tend to offer the most attractive low-risk assets, so that there will be a further inducement for capital outflow from the peripheral regions to the centre, which will be greatest when economic conditions in the periphery weaken. Falling export receipts reduced inward investment and capital flight will thus ted to coincide, requiring income adjustment. Each experience reinforces the perceptions that led to the tendency for the capital to flow out (credit not to be made available) at the first sign of weakening economic conditions. In the Chick-Dow model, then, the evolution of the financial system can reinforce regional economic imbalance, and the dependency of slow-growing regions on banking and financial institutions and markets in the centre region. The spatial concentration of a nation’s financial system into one major centre can undoubtedly be a source of wealth creation, some of which may well flow out to other regions. But, as Tobin (1984) pointed out, that same localised wealth creation can be parasitic, diverting valuable capital and human resources from other branches of activity and other regions. Further, the localised wealth creation in the financial centre can be a source of a source of inflation (of wages, and land and house prices) that then diffuses through other regions. And if, for some reason, the financial centre experiences a financial shock - which may well originate elsewhere in the global financial system – the resulting reductions in liquidity and credit in the centre will have depressing effects on the economies of the periphery. A major financial centre may even compromise domestic monetary policy, possibly again to the detriment of economic prospects in peripheral regions. This model of financial spatial agglomeration and regional unbalanced growth would seem
13
particularly relevant for the debate over unbalanced growth and crisis in the contemporary UK economy. A number of key points emerge from this brief survey of different theoretical perspectives. There is a tendency to regionally unbalanced economic growth is inherent in the market process, and once established need not be corrected by market forces, as assumed in conventional (neoclassical) economic theory. The theories also differ as to whether they believe that spatial imbalance might eventually constrain national growth (as in the more Kaldorian Keynesian models that emphasis the impact of inflationary pressure in the leading region) or might actually be conducive to economic growth (as found in some of the NEG interpretations). In a similar vein the theories differ considerably in the extent to which it is argued that national growth per se might trickle down to enhance the growth of lagging regions and eventually bring about some degree of spatial rebalance (with neoclassical theories being far more positive in this respect compared with the more neo-Keynesian approaches). The argument is that national growth ‘pulls all regions up’, that national growth ‘trickles down to all regions’. This argument may have had some validity during the post-war long boom years, when relatively stable national growth did seem to benefit all regions and certainly provided a macro-economic environment in which active regional policies could achieve some success in boosting investment and employment in the lagging regions of Northern Britain. However, this argument carries much less conviction in relation to the scale and nature of spatial economic imbalance today. National growth of itsef may be necessary but it is certainly not sufficient for spatially rebalancing the economy. Afterall, since the beginning of the 1980s both of the major periods of national growth (1982-1990 and 1992-2008) have been accompanied by increasing spatial economic imbalance, rather than a reduction in regional disparities. A common theme in the different theories is that the role that industrial structure – and especially the presence of competitive export sectors – plays a critical role in the relative economic performance of a region. According to most of the models sectorally unbalanced growth and regionally unbalanced growth are likely to be mutually self-reinforcing, especially if there are strong region-specific economies of agglomeration at work. In the next section we explore how sectoral structure effects have underpinned the spatial imbalance in economic growth between the South and North’ of the UK, how the two have come together to reinforce tendencies towards spatial imbalance in the United Kingdom and how this has been reinforced by the resurgence in the growth of the London agglomeration.

14
3. Regionally Unbalanced Growth in the UK: the Stylised Facts The issue of spatial imbalance in the UK economy is not in fact a new one. In the early-1980s, for example, Fothergill and Gudgin (1982) had drawn attention to the emergence of marked disparities in employment growth across the nation’s regions and cities over the course of the 1960s and 1970s. But it was during the 1980s that a major debate surfaced over what many claimed to be a major ‘North-South’ divide in economic performance and welfare, a debate that rumbled on into the 1990s. The current crisis has therefore reignited a long-standing issue (see Martin, 1988, 1993, 2004; Lewis and Townsend, 1989; Smith, 1989; Jackman and Savouri, 1999; Baker and Billinge, 2004). In what follows, we focus on this ‘North-South’ dimension of spatial economic imbalance in the UK. Even at this broad spatial scale, the differences in economic performance have been substantial (Figure 2).1 In terms of GVA per capita, the South of the country began to pull further ahead of the North during the 1980s, achieving a cumulative output growth advantage of 6 percent over this period (Figure 3).2
But it was from the early-1990s onwards that the gap really widened. Between 1992 and 2007, the South’s cumulative growth advantage of the over the North increased to 20 percent (Figure 2). Over this ‘longest period of non-inflationary continuous expansion on historical record’ the cumulative growth gap between the South and North increased more than threefold. It had been claimed by some commentators at the end of the 1990s that the ‘North-South Divide’ was no longer an issue, and that the economy had become much more spatially balanced (Jackman and Savouri, 1999). It is clear that this claim was incorrect at the time it was made, and events since then have merely rendered it even less accurate as a description of the geographical pattern of economic growth in the UK.
London’s role in this pulling away of the South stands out sharply (Figure 4). Between 1971 and 1992, London’s growth in output lagged substantially behind that of UK economy as a whole, not only seriously behind the remainder of the South, but also even behind that of the North throughout the whole period up until the early 1990s. From 1992 onwards, however, an abrupt change occurred, and London became the fastest growing region in the country, with a growth rate ahead of that in
1 The regions constituting the South as defined here are London, the South East, the East of England and the South West. The North comprises the East Midlands, the West Midlands, Yorkshire-Humberside, the North East the North West, Wales, Scotland and Northern Ireland. 2 We use cumulative differential growth (around the UK average) in Figure 2 since this method not only reveals the true extent of growth gaps, but also helps identify significant changes in a region’s comparative performance (see Blanchard and Katz, 1992, for an application of this method in analysing regional growth evolutions in the US).

15
Figure 2: Divergence in per capita GDP as between the South and North of the
UK, 1971-2010. (South and North defined as in Footnote 1)
Source of Data: Cambridge Econometrics
Figure 3: Cumulative Imbalance in Output Growth as between the South and
North of the UK (Relative to the UK Average), 1972-2010 (South and North defined as in Footnote 1)
Source of Data: Cambridge Econometrics

16
Figure 4: Cumulative Output Growth in the South and London
(Relative to UK Average), 1972-2010 Source of Data: Cambridge Econometrics
Table 1: How London’s Economy Led the 1992-2007 ‘Long Boom’
Annual Percent Growth
Employment Output
(GVA)
South
1.2
4.5
London 1.3 5.6
South Excluding London 1.0 3.9
North 0.6 2.9
(Average annual percentage change in Gross Value Added, 2006 prices) Source of Data: Cambridge Econometrics
the rest of the South, and twice that of the economy of the North (Table 1). Thus whereas between 1971-1992 it had been the South outside of London that had been the driver of the rapid growth of the South economy as a whole, in the following ‘long boom’ of 1992-2007 it was London itself that powered the growth of the economy of the South, and to a large extent the national economy as a whole.

17
4. The Contribution of Sectoral Structure and Regional-Specific Effects to Spatially Unbalanced Growth In order to understand more about the relationship between sectoral factors and regional spatial imbalance in the United Kingdom we applied a dynamic version of the shift share technique to the growth of output (gross value-added) for the UK regions for the period 1971-2010. We grouped the regions into the broad spatial groups of North and South, with the Southern grouping then further disaggregated into London and Rest of the South. We used a 27-sector disaggregation.3
We chose this degree of disaggregation because it allowed us to identify particular sectors of interest, e.g. financial services, whilst also ensuring that the coverage of each sector across the regions was sufficiently dense to make the application of the shift-share methodologies robust.
The shift-share technique is typically applied to either regional output or employment, although there are also trade-related applications (e.g. Chern et al, 2002). Most shift-share analysis is comparative-static in nature, in that it only considers growth between the beginning and end years of the period under study, or sometimes multiple time periods (e.g. 5-year bands of growth). Conventional shift-share decomposes a region’s growth (of employment or output) over a given period into three parts, as shown in Box 1. This approach usually implies that the level of the variable used to weight each shift share component (Xij, where i refers to economic sector and j to region) is taken as the level in the first period, and this opens the method to criticism on two main fronts. Firstly that an in-built bias is introduced to the method as industrial structure changes over time and if the weights are fixed the method does not take account of this – such a bias most likely occurs in rapidly changing regions, and/or where the time period being measured is a large number of years (i.e. such that would allow significant structural change to occur even in relatively mature countries). Secondly that if regional growth differs from national growth for the period of study the weights used will under-estimate the national share effect (and vice versa).
3 The sector GVA and employment data are sourced from Cambridge Econometrics' UK Regional database, for which the detail and sources are shown in the Appendix. Alternative sector groupings were investigated and ultimately a relatively large disaggregation was chosen because it allowed us to identify specific region-sector interactions of interest, e.g. financial services, whilst also ensuring that the resulting regional sectoral output and employment totals were large enough to make the application of the shift-share methodologies sufficiently robust.

18
For this reason we also employed a dynamic version of the shift-share method, which allows both growth rates and industry mixes to vary over time (see Barff and Knight,
1988; Selting and Loveridge, 1990; Chern et al, 2002) and thus removes the potential for this kind of bias to occur, as well as providing additional information on dynamic transition which could not be obtained from the static method. More specifically, regional total growth differentials and their various components were estimated on a year-to-year basis, and these growth rates were cumulated through time. This provided a continuous picture of the evolution of regional growth differentials, and helped to reveal any structural breaks or changes in the industrial structure of
Box 1: Traditional Shift-Share and Multi-Factor Partitioning

19
regions, rather than simply identifying the direction of the net shift of regions between the two-end points of the study period. Given that there have been profound shifts in the structure of the UK economy over the past four decades and these shifts have played out differently across the country, a dynamic version of shift–share provided a useful enhancement to the comparative-static version.

20
In addition to the ‘static versus dynamic’ criticism of traditional shift-share analysis, there is another line of research which has argued that the decomposition itself is fundamentally flawed because it ignores the possibility of industry-region interaction effects and how this can affect both the industry-mix and regional share components. This technique is commonly known as Multi-Factor Partitioning (MFP) and has been developed by Ray and Srinath (see, for example, Ray (1990) and Lamarche et al (2003)). Box 1 outlines the main decomposition of the technique, but essentially the national share is the same as previously, and is usually taken to the left-hand side of the expression to only show a regional growth differential. The two other previous components (industry-mix and regional share) are re-calculated on the basis of so-called ‘standardised’ growth rates, whereby common sets of regional and industry weights are used to establish growth components which are free of the influence of each other, i.e. that use a common (national) set of rates. The additional components relate to the interaction between industry and region effects, and an allocation effect which amounts to the difference between the standardised national growth rate and the actual national growth rate. The results from a dynamic version of the MFP approach on GVA are shown in Figs 5a – 5d, although as a precursor to this we undertook both static and dynamic shift-share analysis of both GVA and employment. We focus in what follows on output.4
The ‘national growth component’ assumes a region’s economy grows at the same rate as the national economy as a whole. Figure 5a shows the cumulative difference between the actual change in each region’s GVA growth and the change that would have occurred had the region grown at the rate of the national economy as a whole. Two striking features are evident: first, the widening gap between the Rest of the South on the one hand and the North on the other that begins to open-up at the beginning of the 1980s; and second, the extraordinary turnaround in growth performance of the London economy from the early-1990s onwards. Up until then, London’s economy had been growing more slowly than the nation, so that this region, like the North, fell progressively behind the economy of the Rest of the South. From around 1992 onwards, however, London grew much faster than the national economy. In contrast, the North continued to fall further behind in terms of output growth, suggesting that industrial structure and/or regional competitiveness effects in this part of the country have deteriorated over time.
4 The results from these analyses are available on request from the authors. We confine our discussion here to output (GVA) growth, both to keep the presentation of results manageable and because it is this aspect of spatial and sectoral imbalance that has attracted the most attention in political statements about ‘rebalancing’ the UK economy.

21
Figure 5 a: Dynamic Multi-Factor Partitioning: Cumulative National Component
of Growth in GVA, 1972-2010
Figure 5 b: Dynamic Multi-Factor Partitioning: Cumulative Industry Mix
Component of Growth in GVA, 1972-2010

22
Figure 5 c: Dynamic Multi-Factor Partitioning: Cumulative Region-Specific Component of Growth in GVA, 1972-2010
Figure 5 d: Dynamic Multi-Factor Partitioning: Cumulative Industry –Region Interaction Component of Growth in GVA, 1972-2010

23
To investigate these effects, Figures 5b and 5c decompose these cumulative regional differential growth paths into their industry-mix and region-specific elements respectively. The industry-mix or sectoral structure effects (Figure 5b) are emphatically clear. Over the period since the early-1970s, the North has experienced a progressively adverse industrial structure in terms of its contribution to the region’s growth performance relative to the national economy. Moreover this adverse industrial structure effect accelerated after the early-1990s, and – particularly significant - throughout the ‘long boom’ years up to 2008. By contrast, the trend in London’s industrial mix effect have been almost the mirror image of that of the North, being positive throughout the period, but becoming increasingly more favourable from the early-1990s onwards. In the Rest of South, industrial composition seems to have had a positive but very small impact on growth performance, indicating that the varied and mixed economic structure of this region has kept broadly in line with that of the national economy taken as a whole. The contribution of regional specific factors is shown in Figure 5c. Since this component measures the extent to which a region’s industries are growing faster or slower than those same industries nationally, it is often referred to as the ‘regional competitiveness’ effect (though the meaning of regional ‘competitiveness’ is not straightforward - see Kitson, Martin and Tyler, 2004). As such, it may be capturing a range of locally-specific factors that influence, either positively or negatively, a region’s firms across its industries. These might include the existence of positive (or negative) externalities of various kinds, including the skill level of a region’s workforce, local market size effects, knowledge spillovers, comparative advantages in access to capital, and, as shown extensively elsewhere (Moore, et al, 1986), the effects of regional policies. In the North the competitiveness effect on the growth of GVA was broadly neutral over the period up until the early 1980s and as shown elsewhere regional policy measures made a significant contribution to this partly through the impact that they had in attracting new inward investment into these regions that would not otherwise of gone there (Moore et al, 1986). The competitiveness effect deteriorated in the early 1980s recession before recovering by 1994. It subsequently deteriorated continuously up until 2010. London has had an adverse competitiveness effect throughout the whole period with strong deterioration over the period up until 1992. Thereafter there was some relative attenuation and then improvement from 2005 onwards. In the Rest of the South, the role of region-specific or competitiveness effects has been strongly positive throughout and has far outweighed the effects of industrial structure in contributing to this region’s favourable growth performance relative to the national economy.

24
Finally, the industry-region interaction effect (Figure 5d) picks up the turnaround in London’s GVA performance from the late-1980s onwards, coinciding well with the reforms to the financial services sector that came to dominate the performance of the City and thus a strong resurgence in the contribution that the London economy makes to economic growth in the South of the UK. To summarise, the above analysis indicates that sectoral imbalance in the UK has indeed made a contribution to the North-South spatial imbalance that has become such an entrenched and enduring feature of the United Kingdom economy. Table 2 reveals the extent of this contribution over the period 1972-2010. Had the Northern economy grown at the national rate, it would have been £43bn richer in output terms. Or expressed another way, between 1972 and 2010, a cumulative growth gap of over £80bn had opened up between the North and the South, including London. The differential trends in economic structure as between the North and London have accounted for around 60 percent of this imbalance, competiveness factors around 36% and interactive effects a small residual. The North seems to have been hampered by both an adverse industrial structure and by a relative lack of competitiveness in its industries with the relative contribution being roughly two thirds and one third respectively. Table 2: The Components of Cumulative Differential Output Growth, 1972-2010
(£bn, GVA): Based on the Multi-Factor Partitioning Analysis £billion
Total Differential (National Component)
Industry-Mix Component
Region-Specific Component
Industry-Region Interaction Component
London 20.5
24.2 -9.4 5.4
South minus London 22.8
2.2 25.1 -4.0
North -43.4
-26.4 -15.7 -1.4
Note: The residual ‘allocation’ component from the shift-share calculations (see Box 1) is not shown,
since it is small: hence the industry-mix, region-specific, and industry-region interaction components do not necessarily sum to the total differential (national component). Likewise column sums do not necessarily equal zero because of rounding.
The dramatic turnaround in London’s comparative growth performance after 1992 relates to the other major aspect of the ‘long boom’, namely its sectorally unbalanced nature. The roots of the increasingly unbalanced nature of the UK economy can be traced back to the late-1970s and early-1980s, when a process of rapid deindustrialisation set in. Although other advanced economies also began to de-industrialise at this time, the absolute decline in manufacturing employment and the relative decline in the contribution of manufacturing to national output and export

25
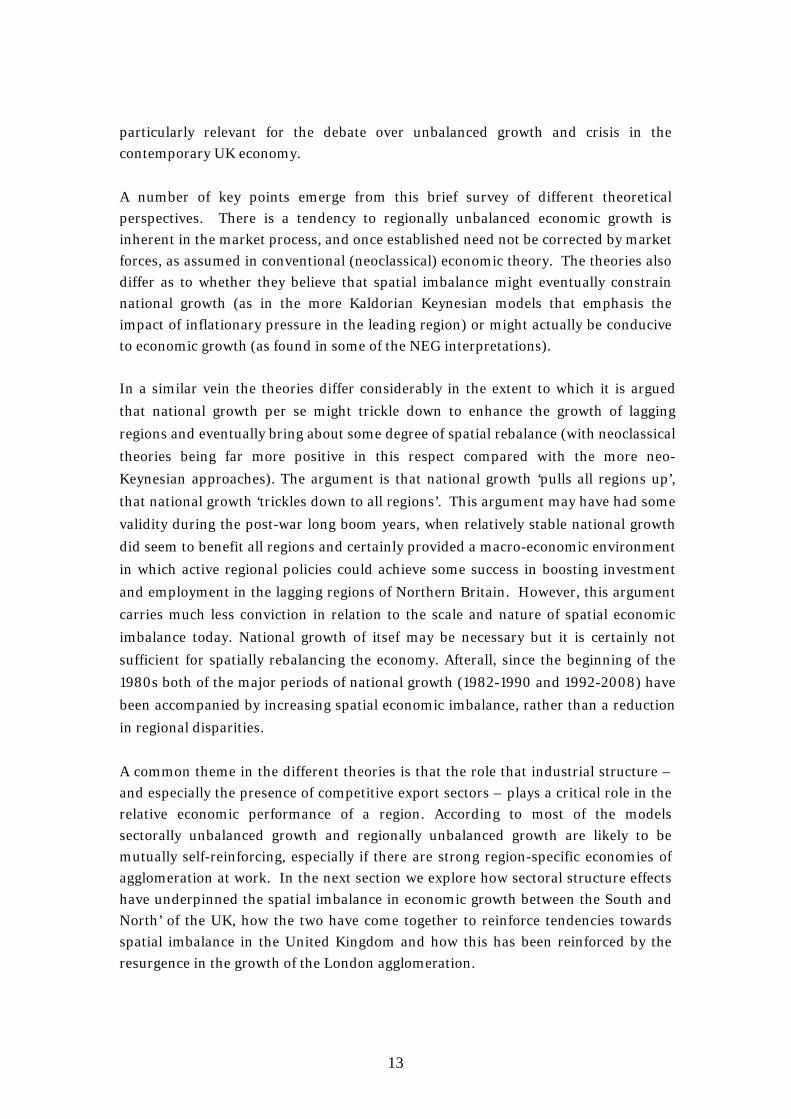
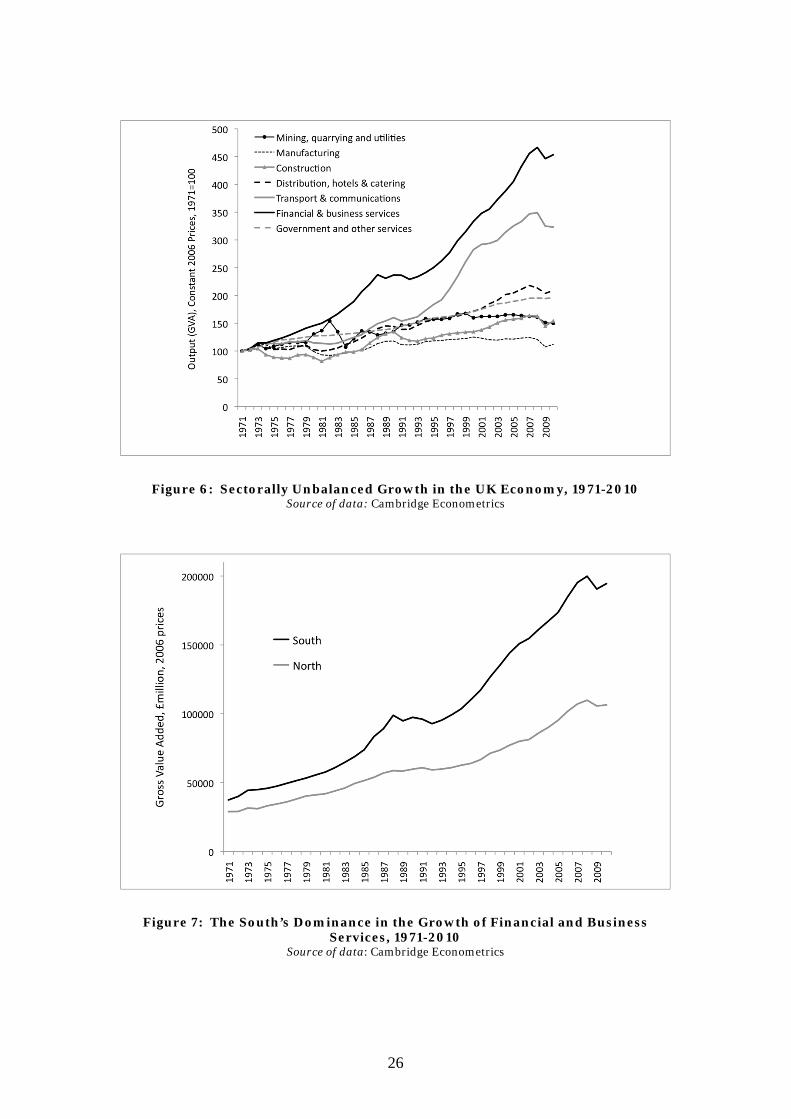
were much more intense in the UK than in most other countries. At the same time, from the mid-1980s onwards, unleashed by an historic wave of deregulation, especially the so-called ‘Big Bang’ in 1986, financial, banking and insurance activities began an unprecedented phase of expansion. Between 1970 and 2008, output in financial and business services in the UK grew by some 350 percent in real terms, doubling in the 1982-1990 boom, and again in the ‘long boom’ of 1992-2008. The only other major sector that came anywhere near this rate of growth was transport and communications (see Figure 6; see the Appendix for the definition of sectors). The performance of manufacturing, however, stands in stark contrast. Real output in manufacturing grew by only around 25 percent between 1971 and 2008, and much of that increase took place before the late-1990s (Figure 6). Employment has fallen steeply over the past four decades, by more than 60 percent. In 1990, though having shrunk, manufacturing still accounted for around 24 percent of national output, and 18 percent of total employment; by 2007, manufacturing’s share of output had declined to 12 percent, and it accounted for only 10 percent of jobs. Whether the declining contribution of manufacturing to the national economy can be reversed, as part of the Government’s desire to ‘rebalance’ the economy and its mode of growth, is a considerable challenge, to put it mildly. The challenge, as the UK Government has acknowledged, is not just that national growth has became far too dependent on financial and related services, but that the expansion of these sectors has itself been spatially skewed. Whilst financial services have grown in every region over the past four decades, the South has witnessed by far the most rapid rate of increase, more than quadrupling real output from this part of its economy over this period (Figure 7). Growth accelerated sharply following the deregulation of financial markets in 1986, and though dampened by the recession of the early-1990s, resumed sharply thereafter right up to the banking crisis that began in late-2007. Whereas in 1971, the South accounted for 56 percent of national output in financial and business services, by 2008 this had risen to 67 percent. Of course, in one sense it is not surprising that the South should have led this historic expansion of the UK’s financial sector, given the presence of the country’s major financial institutions and money markets in London, itself a global financial centre. But what the banking crisis and the economic recession this triggered have done is to throw this sectorally and spatially imbalanced mode of national economic growth into serious doubt. In fact, what these events have done is to expose a fundamental problem of uneven regional development. It shows quite clearly that if a nation becomes relatively sectorally unbalanced that this process will perhaps inevitably exacerbate its regional imbalance, as suggested by most of the theories discussed in Section 2.
26
Figure 6: Sectorally Unbalanced Growth in the UK Economy, 1971-2010
Source of data: Cambridge Econometrics
Figure 7: The South’s Dominance in the Growth of Financial and Business
Services, 1971-2010 Source of data: Cambridge Econometrics

27
A closer inspection of how sectoral and competitiveness factors play out in terms of regional experiences, particularly as between the growth trends of manufacturing and financial and business services, is insightful (Figures 8 and 9). Comparison of these two key broad sectors reveals that London has undergone a profound adaptive shift away from manufacturing into financial and business activities over the past four decades, and especially since the late-1980s. There can be little doubt that the deregulation of the City and its financial markets (s0-called ‘Big Bang’) in 1986 unleashed a major phase of expansion of London’s financial institutions, an expansion that continued to gain momentum and eventually turned into the bubble
Figure 8: Cumulative Output Growth in Manufacturing (Relative to the UK
Average), 1972-2010 Source of Data: Cambridge Econometrics
that burst in late-2007 and 2008. The South outside of London seems to have generated above average growth in finance and related sectors from as early as the end of the 1970s and this probably partly reflects the effect of office dispersal policy from London. What is also striking is that the North failed to shift its growth into these sectors. Indeed, although manufacturing and production more generally now account for a much smaller proportion of employment across all of the regions of the UK, much of the North remains considerably more dependent on these sectors than does the South (Table 3), and London and the South East especially. But it has been precisely these sectors that have lagged far behind in the growth of output.

28
Figure 9: Cumulative Output Growth in Financial and Business Services
(Relative to the UK Average), 1972-2010 Source of Data: Cambridge Econometrics
Two key messages would seem to stand out from the analysis that we have been able to undertake in this paper. Firstly, there does not appear any evidence to support the view that faster growth at the national level necessarily leads to a reduction in the degree of spatial imbalance in the United Kingdom, in fact the opposite. Secondly, structural factors are important influences on the degree of regional imbalance and the United Kingdom perhaps presents one of the most dramatic examples of where a significant change in the structure of the national economy over a relatively short space of time has a considerable impact on the degree of spatial imbalance. In that sense successive post-war British governments have been right to see regional and structural imbalances to be closely related. Both the North and the South, and in particular London, have suffered from the adverse effects of deindustrialisation. A relative dramatic turnaround in the London economy occurs when this process has probably run its course and from the mid 1990s in particular there is a significant contribution from the growth of business and financial services which London has been uniquely positioned to exploit particular following the Big Bang and the onset of the Single European Market in 1992. In a very real sense this paper has perhaps helped to make clearer that given the North’s continued dependence on manufacturing any substantial degree of spatial re-balancing in the UK is only going to be achieved if the United Kingdom manages to secure more sectoral rebalancing

29
and thus ensure that sufficient attention is given to how investment in new growth sectors, particularly in manufacturing and increasing knowledge based industries can be achieved. We move in the next section to examine how government policies might help in this process.
Table 3: Regional Dependence on Production Industries (Percent of Total Employment and Location Quotient)
1979
% LQ 1990
% LQ 2008
% LQ South
South East 30.6 0.84 24.8 0.75 15.6 0.66
Greater London 24.3 0.66 17.7 0.53 10.3 0.47
Eastern 34.9 1.01 27.5 0.91 18.9 0.90
South West 29.6 0.83 25.3 0.80 17.4 0.95
North
East Midlands 43.3 1.27 34.3 1.26 23.0 1.43
West Midlands 44.6 1.41 33.9 1.32 20.9 1.34
Yorks-Humber 40.9 1.16 30.7 1.08 20.8 1.15
North West 38.1 1.15 29.5 1.08 18.7 1.14
North East 40.7 1.09 30.5 1.04 20.0 1.17
Wales 36.3 1.15 28.1 0.97 20.4 1.20
Scotland 34.5 0.92 26.6 0.85 17.6 0.91
N. Ireland 33.0 0.91 26.2 0.86 19.9 1.09
UK
34.9 1.00
27.0 1.00
17.6 1.00 Source of Data: Cambridge Econometrics. The data are mid-year estimates.
Note: Production industries include: manufacturing, mining, energy, water and construction 5. Spatially Rebalancing the Economy? The Scale of the Policy Challenge As the evidence in the previous section showed sectoral and spatial re-balancing on the United Kingdom are intimately related. In this section we focus on a particular feature of policy intervention that could help in this re-balancing process; namely how policy might help to secure an increased presence of the UK in sectors like Advanced Manufacturing, especially in the Northern regions.

30
To identify what form this support might usefully take it is helpful to reflect on the various factors that have been invoked at various times to account for the relative decline of manufacturing. These range from the disruptive effects of over-powerful unions, through poor management and a lack of entrepreneurship, a lack of innovation, a lack of finance capital and a banking system too geared to short-term profit rather than long-term investment, to crowding out by public sector spending and high taxation, to mention just some. To this list should be added the relative neglect that manufacturing has received from successive Governments, which instead have accorded praise and adulation on London’s financial sector. For at least the past three decades, manufacturing had no Governmental champion. Somehow, it has become conventional wisdom that much of the UK’s manufacturing base is fated to grow only slowly at best in coming decades, that the locus growth of global manufacturing production has permanently shifted to the BRIC group of nations, which can more than satisfy global demand. But as Fingleton (1999) argues
the gloomsters could hardly be more wrong… it is absurd to suggest that the world’s manufacturing industries are suffering from a general glut of capacity. In the twenty-first century, as in the past, the world’s consumers will be more than happy to increase their consumption as fast as their budgets will allow, and that they will provide a ready market for all the merchandisable goods that can be made, Moreover, they will increasingly insist that these goods be made in the most environmentally friendly ways possible. All of this adds up to a historic challenge for the world’s leading manufacturers – and an historic opportunity (op cit, p.165).
While it is true that UK manufacturing cannot compete with the cheap producers of many mass consumptions goods, there is surely scope for producing high-value, high quality advanced manufacturing goods for world markets. What is sorely needed, if the present Government’s aim to promote an advanced manufacturing led spatial rebalancing of the economy is to be achieved, is not only a coherent developmental strategy but also a policy that ensures a greatly increased level of investment in the sector, including a much increased expenditure on innovation. Since around 1997 there has been steady fall in real investment in manufacturing across the UK, but especially in the North, where manufacturing is concentrated (see Table 3) and where the hoped-for revival of manufacturing is supposed to take place: by 2010 real investment in the North had fallen back to what it had been in 1993 (see Figure 10). A recent study of British industry, commissioned by the UK Prime Minister, has set out a nine-point plan to strengthen the role of manufacturing in the economy, and argues amongst other things for tax incentives and tax cuts to boost investment, as well as the establishment of more technology centres (Bamford, 2012). The study argues that the UK should learn from Germany, which had a manufacturing trade surplus of 9.7 percent in 2010 compared to a trade deficit in the UK of 4.7 percent. The Trades

31
Figure 10: Manufacturing Investment Trends by Region, 1971-2010
Source of Data: Cambridge Econometrics
Union Congress’s Report German Lessons: Developing Industrial Policy in the UK (2012) also argues that the German approach to manufacturing holds key pointers to what is needed in the UK. The different nature of of the relationship between finance and industry as between the two countries has often been highlighted: the UK’s ‘Anglo-Saxon’ model of virtually unrestrained capital ownership, aided by and dependent on a strong stock market, and the German model based on debt financing by banks of a ‘social market’ where the ownership of property is more closely regulated with the intention (set out in the German constitution) of ensuring benefits to the wider society, not shareholders alone. In the UK, stock market capitalisation is around 90-100 percent compared to only 10 percent in Germany. The rebalancing of the economy to give a greater role for manufacturing may well require a systemic rebalancing of the nature of the nature of the relationship between finance and industry. The Government has urged the banks to increase lending to the small business sector, but exortation without real incentives or concessions is unlikely to result in any dramatic expansion of bank lending to industry. There have been calls for a new national investment bank for industry, with appropriate tax incentives to

32
attract private funds (Skidelsky, 2011). But there needs to be a regional dimension built into such a scheme.5
If Government is to assist the North to restructure particularly in advanced manufaturing then it is important to be clear as to the sort of regional policy required to achieve this. Much of post-war regional policy was diversionary, aimed at redirecting new investment and jobs, mainly in manufacturing but more latterly also in services, away from the faster growing South of Britain to Northern regions. There were opportunities to operate a policy of this sort because of the substantial volume of multinational investment that seeking location to etsablish new production facilities. Some estimates put the number of net new jobs created in the assisted areas over the period 1961 to 1981 at some 600,000 jobs, equivalent to about 30,000 jobs per annum in the assisted regions (Moore et al, 1986). But since the early-1980s successive governments have shifted the emphasis of regional policy progressively away from spatially redistributing industry from South to North, partly because the effectiveness of that form of policy seemed to be waning (not least because of de-industrialisation), but also on ideological grounds. The focus instead has been on the promotion of the ‘indigenous potential’ of regions, on fostering new business, skills and innovation from within each region (Ball and Healey, 2000). The Regional Development Agencies, established by the Labour Government in 1998, were intended to be the main strategic bodies to accomplish this, and were funded to the level of £2 bn per annum accordingly. Some ten years on, the nine RDAs were judged to have generated over £23bn in economic benefits in their regions (equating to a return of £4.50 in economic terms for every £1 spent), assisted over 35,000 net businesses, and created or safeguarded nearly 213,000 net jobs (Pricewaterhouse Coopers, 2010a). A further independent review by the National Audit Office (2010) concluded that the eight RDAs outside London “have been performing to a ‘strong’ or ‘good’ standard”. These assessmemts suggested this was a regional policy model that could potentially make a measurable impact on regional economic imbalance over the longer run if given considerably greater resources and linked to other enhanced national policies to boost innovation and investment across the economy. However, this model has now been emphatically rejected by the Coalition Government. The official rationale for abolishing the RDAs is revealing:
5 Vince Cable, the Business Secretary, has himself now argued for a state investment bank British to support export and other strategic sectors in the economy (7 March, 2012). His suggestion that such a bank could be carved out of the state-saved and largely state-owned Royal Bank of Scotland is certainly radical, and for that reason was quickly denounced by RBS itself.

33
The previous approach to sub-national economic development was based on a centrally driven target which sought to narrow the growth rates between different regions. Not only did this approach lead to policies which worked against the market, it was also based on regions, an artificial representation of functional economies…This therefore missed the opportunities that come from local economic development activity focused on functional economical areas… Regional and other strategies stifled natural and healthy competition between places and inhibited growth as a consequence” (Local Growth White Paper, BIS , 2010a)
Thus the RDAs are criticised for pursuing what the new Government itself at the same time claims is needed: a greater balance of economic growth across the regions! Moreover, this goal, it is alleged, works ‘against the market’, which seems to suggest an underlying belief in the ‘national growth versus greater regional balance trade-off’ still haunts the Government’s stated commitment to spatial rebalancing. Further, whether the 37 new Local Enterprise Partnerships (LEPs) which have replaced the RDAs, and which have to compete for grants from the new Regional Growth Fund, are more meaningful functional economies and more effective policy delivery bodies to redress spatial imbalance in the economy, is open to debate (see, for example, the various discussions in Ward and Hardy, 2012). And in any case, the LEPs are not backed by, or explicitly linked to, any obvious national growth strategy. Indeed, it seems that the task of rebalancing the UK economy and restoring national economic growth is to be left to the vagaries of the (inevitably variable) efforts of the under-resourced LEPs:
We are determined to rebalance the economy towards the private sector, so it's important we create a more effective structure to drive economic growth and development across the country. We want a structure that reflects the real interest of enterprise and local councils - local enterprise partnerships will provide that vision and then take on the task of renewing local economies (Vince Cable, Business Secretary, June 29, 2010).
Whether this does indeed add up to “a more effective structure to drive economic growth and development across the country” is questionable. Moreover, the introduction of the new Localism Agenda is taking place against a harsh economic background. There is much reduced economic growth compared with the earlier part of this century. Public expenditure is under severe restraint and some have argued that the Government’s fiscal austerity programme could add to the scale of the re-balancing problem across the English regions. It is estimated that 200,000-300,000 public sector jobs could be lost over next four years and since the Northern regions are now relatively more dependent on public sector they can be expected to be significantly affected (Pricewaterhouse Cooper, 2010b). It has also been suggested that the impact of the 2011/2012 Local Government Finance settlement will also further disadvantage the Northern regions in this respect (Ward, 2011).

34
Against this backdrop, and the degree of spatial imbalance highlighted in this paper, it would seem that resources available in the Regional Growth Fund are woefully inadequate. At £2.4 bn over two years, it represents a funding level of only half the support that was received annually by the RDAs and has already been massivley oversubscribed: bids worth more than £6bn had been received against the from the initial £1.4 bn tranche in the Fund before another £1 bn was added recently. According to the Government, the focus of the Regional Growth Fund will be on promoting investment and jobs in manufacturing. But the Fund does not appear to be linked to or driven by any explicit central Government industrial or growth policy. The LEPs are one component of a new ‘localism’ which also includes the designation of 24 Enterprise Zones, and the creation of six to eight Technology and Innovation Centres (TICs). Enterprise Zones were tried in the 1980s and 1990s, and whilst they had some success, they need to be implemented very carefully to ensure success (see, Tyler, 2011). Moreover, the new Enterprise Zones are mainly focused on stimulating growth in just a few, very localised areas. The planned TICs are intended to be elite clusters of highly innovative, high-tech firms, linked to local universities and research institutions, and orientated towards advanced manufacturing (House of Commons, 2011). These look to be a very good idea but it is to be remembered that the RDAs funded over 60 innovation and high-technology centres, aimed at promoting regional economic growth. How many of these will survive now that the RDAs have been wound up is unknown. Evidence from other countries on these sorts of centre indicates that sustained core funding is essential. The Government has committed £200m to the new TICs over its term in office. Some of the RDA funded centres will become TICs, but most will not. So the future of these is open. The obvious question these various local interventions pose is: do they add up to a sufficiently coherent, convincing and financially-committed policy framework for securing a more spatially balanced model of UK economic growth? It seems doubtful. The policy landscape has become fragmented, uncoordinated and, when compared to the scale of the task it confronts, grossly under-resourced. The stated aim is that spatial rebalancing the economy should go hand in hand with reviving the role played by manufacturing. The call to build an advanced British manufacturing sector comes against a background of a sustained process of ‘deindustrialisation’ which has been underway since the late-1960s, if not earlier. Back in 1970, UK manufacturing still employed more than 7 million workers, some 30 percent of total employment; by 2010 this had fallen to a mere 2.5 million, or barely

35
10 percent of national employment. Over the same period, the share of manufacturing in total national output fell from 27 percent to around 12 percent. From being in surplus in 1982, the trade balance in manufacturing then deteriorated, especially after 1997, to reach a deficit of more than £60 billion (in nominal prices) by 2010. These absolute and relative declines of UK manufacturing are amongst the steepest of any major OECD country. The UK’s share of world manufacturing output is now less than half that of Germany, where manufacturing still accounts for 20 percent of total output. A radical rethink of regional policy is needed because although some form of regional policy has been followed in the UK for more than 80 years, this long history of spatial intervention has not had a lasting impact in reducing the South’s leadership in economic growth and activity that first developed in the inter-war years. As Scott (2007) documents, it was London and the South East that triumphed in the growth of the new industrial economy of that period (especially motor vehicles, mass production consumer goods, office machinery, and related equipment). Since the mid-1980s it has been London and the South East that have once more ‘triumphed’, in this case in the growth of the new post-industrial, finance and business services-led economy. The plethora of regional policy schemes and measures followed in the post-1945 period may have contained the extent of the economic imbalnce between the South and the North of the UK during the long ‘post-war boom’ up until the mid-1970s. But with the increasing spatial imbalance in economic growth that has characterised the UK over the past three decades, the whole issue of regional policy has resurfaced with a vengeance. At the present time, existing initiatives like the Regional Growth Fund are simply not funded at the level required to make much of an impact given what we know about the relative effectiveness of previous investment incentives targeted on the manufacturing industry. Moreover, simply giving grants to industry does not tackle what has been a severe limitation of previous initiatives, namely an inability to ensure that there is a continuing flow of funds available to maintain momentum and allow new investment opportunities to be financed as they emerge. One promising way of achieving this could be to develop a new class of Impact Investment Funds, essentially special purpose vehicles that manage revolving holding funds, targeted specifically for use in stimulating investment in advanced manufacturing in the regions. Innovative financial instruments of this sort are currently being used in EU Cohesion Policy, as in the case of JEREMIE in providing regional funds to SMEs and JESSICA in relation to the financing of urban and city development (see European

36
Investment Fund, 2009).6
Similar financial vehicles could be established in the UK regions, perhaps empowered with favourable tax incentives, in order to provide a very real and productive alternative to investors who might otherwise have invested in UK property in the South of the United Kingdom rather than advanced manufacturing in the North. In its 2012 Budget statement, the Government reduced corporation tax, from 26 percent to 22 percent by 2014, making the UK’s rate the fourth lowest in the G20, in an effort to improve Britain’s competitive standing in the world and stimulate economic growth. But the UK corporate sector has for some time been sitting on a surfeit of funds, yet has been reluctant to use these to invest. Rather than a reduction in corporation tax, tax incentives to encourage the private sector of the UK economy to invest would arguably have been far more beneficial. And, crucially, the Budget included nothing to give particular incentives for such investment to be focussed on advanced manufacturing specifically in the northern regions of the country.
The evidence presented in this paper suggests that spatial and sectoral ‘rebalancing’ will not happen automatically. If the United Kingdom is serious about re-balancing sectorally and spatially then attention has to be given as to how a quantum change can be secured in the volume of investment occurring in the North of the United Kingdom in new and growing sectors like those encompassed within advanced manufacturing or knowledge-intensive service activities. Also, the economic fortunes of the UK’s Northern regions are also intimately tied into the ability of their large urban centres to be competitive locations. If the growth inducing force of large scale spatial agglomeration of economic activity is key – and London suggests it is – then policy should focus on enhancing the agglomerative externalities and pull of the major urban centres in the North: the North needs its own London, or Londons. However, the economic renaissance of the Northern conurbations also requires much new investment in land reclamation, transformational infrastructure, and skills to overcome the legacies of the past that are currently constraining their growth (see Fenton et al, 2010; Tyler, 2011). Ways also have to be found to coordinate a wide range of policies across their respective local authorities particularly in relation to infrastructure and the economic policies. Interestingly, this ability to coordinate developmental strategies and expenditures is precisely what the Devolved Administrations of Scotland, Wales and Northern Ireland, created by New Labour, now have. If the North of England is not given similar powers, not only will the
6 JEREMIE stands for Joint European Resources for Micro to Medium Enterprises. It is a joint initiative of the European Commission with the EIF and European Investment Bank (EIB) to promote SME access to finance and financial engineering products in regions. JESSICA stands for Joint European Support for Sustainable Investment in City Areas, and consists of a similar type of special investment vehicles for funding urban development projects.

37
United Kingdom continue to experience the pronounced broad North-South imbalance highlighted in this paper, it may also see a widening economic divide between the devolved and non-devolved regions of its North. There is thus an urgent need for a clearly identified industrial policy that is coordinated with a regional policy that seriously begins to address the North-South imbalance in the UK’s economy that has become so deep-seated over recent decades. 6. References Alsonso, W. (1968) Urban and Regional Imbalances in Economic Development,
Economic Development and Cultural Change, 17, 1, pp. 1-14. Baker, A.R.H. and Billinge, M.D. (Eds) (2004) Geographies of England: The North-
South Divide – Imagined and Material, Cambridge: Cambridge University press.
Baldwin, R., Forslid, R., Martin, P., Ottaviano, G. and Robert-Nicoud, F. (2003)
Economic Geography and Public Policy, Princeton, New Jersey: Princeton University Press.
Ball, E. and Healey, J. (2000) Towards a New Regional Policy: Delivering Growth
and Full Employment, London: The Smith Institute. Bamford, A. (2012) UK Manufacturing: Time to Make it Count, Report to the UK
Prime Minister. Barff, R.A. and Knight, P. L. (1998) Dynamic Shift Share Analysis, Growth and
Change, 19, pp. 1-10. Blanchard, O and Katz, L (1992) Regional Evolutions, Brookings Papers on
Economic Affairs, 1, pp. 1-61. Brakman, S., Garretsen, H., and van Marrewijk, C. (2009) Economic Geography
Within And Between European Nations: The Role Of Market Potential And Density Across Space And Time, Journal of Regional Science, 49, pp. 777-800.
Brown, G. (2007). Budget Statement to the House of Commons Delivered by the Rt
Hon Gordon Brown MP, Chancellor of the Exchequer. 2007. Available online at: http://www.harddowdy.com/budget/21_03_07_budget_speech.pdf.
Cable, V. (2010) Councils and Business to Rebalance Local Economy, London:
Department of Communities and Local Government. (http://www.communities.gov.uk/newsstories/localgovernment/1626435).

38
Chern T.S., Ping, T.S., Robinson, E. and Wilson, P. (2002) Assessing Singapore’s Export Competitiveness: A Dynamic Shift-Share Analysis, Occasional Paper 23, Economic Policy Department, Monetary Authority of Singapore.
Chick, V. and Dow, S. (1988) A Post-Keynesian Perspective on Banking and Regional
Development, in Arestis, P. (Ed) Post-Keynesian Monetary Economics, Aldershot: Edward Elgar, pp. 219-250.
Clegg, N. (2010) Fair Shares, The Northern Echo, 29 June. (htttp://www.theNorthernecho.co.uk/features/leader/8244486.Fair_shares/) Danino-Pastore, J.M. (1963) Balanced Growth: An Interpretation, Oxford Economic
Papers, 15, pp. 164-176. Department for Business Innovation and Skills (2010a) Local Growth: Realising
Every Place’s Potential, White Paper Cm 7961, TSO, Belfast. Department for Communities and Local Government (2010) Local Enterprise
Partnerships: Letter to Local Authority Leaders and Business Leaders, London: DCLG.
(http://www.communities.gov.uk/documents/localgovernment/pdf/1626854.pdf) Department for Communities and Local Government (2011a) Enterprise Zone Prospectus, London: DCLG. (http://www.communities.gov.uk/documents/localgovernment/pdf/1872724 .pdf) Department for Communities and Local Government (2011b) Local Government
Finance Bill: Business Rates Retention Scheme-Impact Assessment. (http://www.communities.gov.uk/publications/localgovernment/lgfbbusinessra teassessment) Dow, S. (1999) The Stages of Banking Development and the Spatial Evolution of
Financial systems, in Martin, R.L. (Ed) Money and the Space Economy, Chichester: Wiley, pp. 31-48.
European Investment Fund (2009) Regional Business Development Division http://www.eib.org/attachments/thematic/jeremie_leaflet_2012_en.pdf Fenton, A., Tyler, P., Markenen, S., Clarke, A and Whitehead, C. (2010) The Ward
Penalty: Race, Place and Poverty in Birmingham. Cadbury Trust, Barrow. Fingleton, E. (1999) In Praise of Hard Industry: Why Manufacturing, Not the New
Economy is Key to Future Prosperity, London: Orion Press. Fleming, J.M. (1955) External Economies and the Doctrine of Balanced Growth,
Economic Journal, LXV, pp. 241-256. Fothergill, S. and Gudgin, G. (1982) Unequal Growth: Urban and Regional
Employment in the United Kingdom, London: Heinemann.
39
Fujita, M., Krugman, PP. and Venables, A.J. (1999) The Spatial Economy: Cities, Regions and International Trade, Cambridge, Massachusetts: MIT Press.
Fujita, M. and Thisse, J-F. (2002) Economics of Agglomeration: Cities, Industrial
Location and Regional Growth, Cambridge: Cambridge University Press. Gardiner, B, Martin, R and Tyler, P (2011) Does Spatial Agglomeration Increase
National Growth? Journal of Economic Geography, pp. 979-1006. Garretsen, H. and Martin, R.L. (2010) Rethinking (New) Economic Geography:
Taking Geography and History More Seriously, Spatial Economic Analysis, 5, pp. 127-160.
Hirschman, A.O. (1958) The Strategy of Economic Development, New Haven, Conn:
Yale University Press. Holland, S. (1976) Capital Versus the Regions, London: Macmillan. House of Commons Science and Technology Committee (2011) Technology and
Innovation Centres, London: House of Commons. Jackman, R. and Savouri, S. (1999) Has Britain Solved the ‘Regional Problem’? In
Gregg, P. and Wadsworth, J. (Eds) The State of Working Britain, Manchester: Manchester University Press.
Kaldor, N. (1970) The Case for Regional Policies, Scottish Journal of Political
Economy, 18, pp. 337-348. Kaldor, N. (1981) The role of increasing returns, technical progress and cumulative
causation in the theory of international trade and economic growth, Économic Appliquée, 34, pp. 593-617.
Kitson, M., Martin, R.L. and Tyler, P. (2004) Regional Competitiveness: An Elusive
yet Key Concept? Regional Studies, 38, pp. 991-999. Krugman, P. (1991a) Increasing Returns and Economic Geography, Journal of
Political Economy, 99, pp. 483-499. Krugman, (1991b) Geography and trade. Cambridge, Massachusetts, MIT Press. Lamarche, R. H., K. P. Srinath and D. M. Ray. (2003) Correct Partitioning of
Regional Growth Rates: Improvements in Shift-Share Theory, Canadian Journal of Regional Science, XXVI, 1, pp. 121-141.
Lees, C. (2006) Regional Disparities and Growth in Europe, Mimeo, HM Treasury,
London. Lewis, J. and Townsend., A. (Eds) (1989) The North-South Divide: Regional Change in Britain in the 1980s, London: Paul Chapman Publishers, pp. 16-42. Leunig, T. and Swafield, J. (2008) Cities Unlimited: Making Urban Regeneration
Work, London: Policy Exchange.

40
Martin, P (2005) The Geography of Inequalities in Europe, Swedish Economic
Policy Review, 12, pp. 85-108. Martin, R.L. (1988) The Political Economy of Britain’s North-South Divide,
Transactions of the Institute of British Geographers, Martin, R.L. (1993) Remapping Regional Policy: The End of the North-South Divide? Regional Studies, 27, 8, pp. 797-805. Martin, R.L. (2004) The Contemporary Debate over the North-South Divide: Images,
and Realities of Regional Inequality in Late-Twentieth Century Britain, in Baker, A.R.H. and Billinge, M.D. (Eds) Geographies of England: The North-South Divide – Imagined and Material, Cambridge: Cambridge University Press, pp. 15-43.
Martin, R.L. (2008) National Growth Versus Spatial Equality? A Cautionary Note on
the New ‘Trade-off’ Thinking in Regional Policy Discourse, Regional Science, Policy and Practice, 1, pp. 3-13.
Martin, R.L. (2010a) Uneven Regional Growth: The Geographies of Boom and Bust
under New Labour, in Coe, N. and Jones, A. (Eds) The Economic Geography of the UK, London, Sage, pp. 29-46.
Martin, R.L. (2010b) The Local Geographies of the Crisis: From Housing Bubble to Mortgage Meltdown and Beyond, Journal of Economic Geography, 10, pp. 587-618. Martin, R.L. (2011) Regional Economic Resilience, Hysteresis and Recessionary
Shocks, Journal of Economic Geography, 12, pp. 1-32. Martin, R.L. and Tyler, P. (1991) The Regional Legacy of the Thatcher Years, in Michie, J. (Ed) The Economic Legacy, 1979-1992, London: Academic Press, pp 140-167. Martin, R.L. and Tyler, P. (1994) Real Wage Rigidity at the Local Level in Great Britain
Regional Studies, 28, pp. 833-842. Moore, B., Rhodes, J and Tyler, P (1986) The Effects of Government Regional Policy
London: HMSO. Myrdal, G. (1958) Economic Theory and Underdeveloped Regions, London:
Methuen. National Audit Office (2010) Independent Supplementary Review of Regional
Development Agencies, NAO (http://www.nao.org.uk/publications/1011/rda_reviews.aspx). Nurske, R. (1956) Balanced Growth on Static Assumptions, Economic Journal,
LXVI, pp. 365-367.

41
Nurske, R. (1958) The Conflict Between ‘Balanced Growth’ and International Specialisation, Lectures on Economic Development, Faculty of Economics, Istanbul University (Reprinted in Meier, G.M. (Ed), 1976, Leading Issues in Economic Development, Oxford University Press, pp. 640-643).
Ohlin, G. (1959) Balanced Economic Growth in History, American Economic Review,
49, pp. 338-353. Pricewaterhouse Coopers (2010a) Impact of RDA Spending, Vols 1 and 2, London:
Department for Business Enterprise and Regulatory Reform. Pricewaterhouse Coopers (2010b) Sectoral and Regional Impact of the Fiscal
Squeeze, London. Ray, D. M. (1990) Standardizing Employment Growth Rates of Foreign
Multinationals and Domestic Firms in Canada: From Shift-Share to Multifactor Partitioning, Working Paper No 62, International Labour Office, Multinational Enterprises Programme, Geneva.
Rosenstein-Rodan, P.N. (1943) Problems of Industrialisation in Eastern and
Southern Europe, Economic Journal, LVIII, pp. 202-211. Rowthorn, R.E. (2010) Combined and Uneven Development: Reflections on the
North-South Divide, Spatial Economic Analysis, 5, pp. 355-362. Selting, A. and Loveridge, S. (1990) Testing Dynamic Shift-Share, http://www.jrap-
journal.org/pastvolumes/1990/v24/24-1-2.pdf (Accessed 8 August 2011). Scott, P. (2007) Triumph of the South: A Regional History of Early Twentieth
Century Britain, Farnham: Ashgate. Sheahan, P.J. (1958) International Specialisation and the Concept of ‘Balanced
Growth’, Quarterly Journal of Economics, LXXII, pp. 183-197. Sissons, A. and Brown, C. (2011) Do Enterprise Zones Work? London: The Work
Foundation. Skidelsky, R. (2011) Plan B: Start a National Investment Bank, New Statesman,
October http://www.newstatesman.com/economy/2011/10/investment-bank-capital).
Smith, D. (1989) North-South: Britain’s Economic, Social and Political Divide,
London: Penguin Books. Streeten, P. P. (1959) Unbalanced growth, Oxford Economic Papers, 11, pp. 167-90. Temple, J. (2008) Balanced Growth, in Durlauf, S. and Blume, L. (Eds) The New
Palgrave Dictionary of Economics, London: Macmillan. Tobin, J. (1984) On the Efficiency of the Financial System, Lloyds Bank Review,
June.

42
Trades Union Congress (2012) German Lessons: Developing Industrial Policy in the UK, London: TUC.
Tyler, P. (2011) Strategies for Underperforming Places, Policy Paper 6, Spatial
Economics Research Centre, London. Tyler, P . (2011). Making Enterprise Zones Work: Lessons from Previous Enterprise
Zone Policy in the United Kingdom. Unpublished paper for DCLG. Available at http://www.landecon.cam.ac.uk/staff/publications/ptyler/EZs-
Making%20Enterprise%20Zones%20Work2nd%20Dec.pdf Ward, M (2011) Rebalancing the Economy: Prospects for the North - Report of the ‘Fair Deal for the North’ Inquiry, London: The Smith Institute. Ward, M. and Hardy, S. (Eds) (2012) Changing Gear – Is Localism the New
Regionalism? London: The Smith Institute. Appendix: Industrial sectors and data sources The GVA and employment data used in the analysis for this paper come from the UK Office of National Statistics, Regional Accounts. The GVA data are originally in current basic prices and are residence based. UK sector deflators are applied to obtain constant price series: i.e. any given sector is assumed to have the same price developments for every UK region. Data for 27 industries were used, based on the 2-digit industrial level, aggregated in certain cases as shown in the Table below
Industry Name 2-Digit Industry Codes (SIC 2003)
Agriculture etc 01, 02, 05 Mining & Quarrying 10, 11, 12, 13, 14 Food, drink & tobacco 15, 16 Textiles, clothing & leather 17, 18, 19 Wood & paper 20, 21 Printing & publishing 22 Fuels and Chemicals 23, 24 Rubber & plastic products 25 Non-metal & mineral products 26 Basic metals & metal products 27 Mechanical engineering 28, 29 Electron., elec., inst. Engineering 30, 31, 32, 33 Motor vehicles 34 Other transport equipment 35 Other manufacturing 36, 37 Electricity, gas & water 40, 41

43
Construction 45 Distribution 50, 51 Retailing 52 Hotels & catering 53 Transport & communications 60, 61, 62, 63, 64 Banking & finance 65 Insurance 66 Other business services 67, 68, 70, 71, 72, 73, 74 Public admin. & defence 75 Education & health 80, 85 Other services 90, 91, 92, 93, 95, 96, 97, 99
In the discussion in Section 2, on the stylised facts of imbalance, the broad sectors used there (for example in Figure 4) are defined in terms of the 2-digit industries as follows: Mining, Quarrying and Utilities – SIC 10- 14, 40-41 Manufacturing – SIC 15-37 Construction – SIC 45 Distribution, Retailing, Hotels and Catering – SIC 50-53 Transport and Communications –SIC 60-64 Financial and Business Services – SIC 65-68, 70-74 Government and Other Services – SIC 75, 80, 85, 90-93, 95-97, 99