information and communication technologies in a multi ...fm · information and communication...
TRANSCRIPT

Information and CommunicationTechnologies in a Multi-Sector Endogenous
Growth Model�
Evangelia Vourvachakiy
London School of Economics
July 27, 2005
Abstract
This paper aims to account for the potential e¤ect of the Informa-tion and Communication Technologies (ICT) upon growth. It studiesa three sector economy, where one sector produces ICT, one uses ICTand one does not use ICT. The bene�ts from the ICT goods come interms of falling prices of the ICT using sector�s good. This good isused for the production of all types of intermediate capital varieties.Their falling prices provide incentives for investment in all sectors us-ing these capital varieties. Therefore, the non ICT using sector willexperience sustained growth driven by capital accumulation, despitethe fact that it does not use directly the ICT goods. Although thereis unbalanced growth across the three sectors, there exists a balancedgrowth steady-state path for the aggregate economy. Along this paththere is no structural change.JEL Classi�cation: O40, O41Keywords: multi-sector economy, endogenous growth, balanced
growth path, Information and Communication Technologies
�Preliminary and incomplete. First draft in January, 2005. I am grateful to RachelNgai and Chris Pissarides, my supervisors, and Francesco Caselli. I would also like tothank Nick Oulton, Danny Quah, Silvana Tenreyro, Katrin Tinn and participants in theMoney/Macro work in progress seminar at LSE for their comments and suggestions.
ye-mail address: [email protected]
1

1 Introduction
Current research on economic growth puts more emphasis on examining thesources of growth at the industry level. The advantage of this perspectiveis that it allows the identi�cation of both the growth generating industriesand the mechanism through which growth is delivered at the aggregate level.Figure 1 in Appendix D shows the employment shares (in terms of totalhours worked) for three sectors that add up into the private economy of theUSA, over the period 1979-2001. These correspond to the sector producingICT goods, the sector using ICT capital goods intensively (ICT using) andthe sector that uses ICT capital non intensively (non ICT using). Thereare two interesting features in these data. The employment shares appearconstant along time. The share of the ICT producing sector is very small(3%), while this sector is suspected to be the main source of current USAgrowth. Further to this, the size of the ICT sector in the economy (ICT usingand ICT producing) is much smaller compared to that of the non ICT sec-tor. Hence, there is no straightforward explanation about how ICT progressdelivers higher output growth for the aggregate economy. The objective ofthe model below is to illustrate the importance of the interaction amongindustries for the aggregate economic performance. The interest lies in un-derstanding the conditions for the existence of a balanced growth steady-statepath and examining whether they allow for any systematic shifts of resourcesacross di¤erent sectors.The motivation for this paper comes from the empirical literature that
studies the USA economy over the past thirty years (Jorgenson et al., 2004,Oliner and Sichel, 2002). These studies use data from the USA at the three-digit ISIC level and perform a detailed growth accounting exercise that iden-ti�es the ICT producing sector as the source of growth, in spite of its smallvalue added and employment shares. Complementary growth accountingexercises (ECB Working Paper, 2002, GGDC report, 2003) investigate thesources of USA and EU growth by looking at three aggregate sectors: onethat produces ICT, one that uses ICT and one that does not use ICT (thedi¤erence between an ICT using and a non ICT using industry is the de-gree of ICT capital use out of total capital use). These studies con�rm thehigh productivity growth in the ICT producing sector and point out the im-portant gains in productivity for all sectors, and in particular for the ICTusing industries. The most important source of USA growth has been theaccumulation of ICT and non ICT capital. The incentives for ICT capitalaccumulation come from the dramatic price declines of the ICT goods.In order to develop intuition about how the price declines of ICT goods
can have an impact on aggregate labour productivity, one may think of the
2

following example: In the USA economy, intensive ICT users are mainlythe services� industries and industries producing equipment. Suppose thatan ICT producing industry develops a new microprocessor. This chip willbe used in the production of new o¢ ce equipment that will be of higherquality and available at a lower price. The o¢ ce chairs that will be partof this production will become available for �nancial institutions, as well asfor hairdressers. Hence, despite the fact that the hairdressers do not usedirectly ICT, they bene�t from every new generation of advances as longas this lowers their cost of equipment. The inter-industry transactions thatallow for such mechanism to go through is the main focus of this paper.In the model presented below, the ICT producing sector is the technology
producing sector. By construction this sector becomes the engine of growth.The economy consists of two more sectors: the ICT using and the non ICTusing. The model does not allow for intensities of ICT use other than theextreme ones. Despite being unrealistic, this assumption does not a¤ectthe main properties of the solution path. On the contrary, it underlies thelinkages through which growth is delivered from the ICT producing sector tothe entire economy.The main structure of the model is based on Romer�s (1990) model of
endogenous growth. The advantage of the latter is that it illustrates thetransactions between the sector producing technology and the sector usingit, explaining how the growth in technology is delivered to the �nal goodsector. The model below applies this framework to the economy of the ICTera. However, by retaining the main framework of Romer�s model, the modelapplies to any large-scale technological advances. At the same time, Romer�smodel is extended by introducing the non ICT using sector that is using onlytechnologically obsolete intermediate capital goods. This additional sectoraims to account for the fact that for a long period after the introduction ofnew large scale technologies, some productive industries cannot make use ofthem. Therefore, these industries cannot fully bene�t from the improvingpotentials that the new technologies are o¤ering. However, they can coexistin equilibrium with industries that use fully the new technologies and that ine¤ect have stronger growth. In the model of this paper, the most importanttransaction is that the non ICT using sector gets capital goods in terms ofthe output produced by the ICT using sector.This transaction lies in the core of the analysis, because it aims to ex-
plain the mechanism that generates growth that is based on sustained capitaldeepening in all sectors of the economy. The mechanism which is describedin the empirical literature is the following: as the prices of ICT goods godown, this creates incentives to invest in these goods. At the same time, asthe cost for the ICT using industries is driven down, this generates further
3

price declines and incentives to invest. The model below shows how thismechanism is compatible with a steady-state equilibrium at the aggregatelevel. In addition, this mechanism is e¤ective irrespectively of the size of theICT producing and using sector. Hence, there is no contradiction deliveredfrom Figure 1.The steady-state of the model economy exists under plausible restrictions
upon the resources of the economy and the intertemporal and intratempo-ral substitutability among the di¤erent consumption goods available. Theconditions on preferences are necessary due to the multiplicity of the con-sumption goods. These conditions give the hint that there is no structuralchange along the economy�s balanced growth path, which is consistent withthe picture delivered from Figure 1.In e¤ect, this model deviates from the structural change literature. In
the context of the ICT economy, the USA data do not reveal signi�cant sys-tematic shifts of resources across sectors. Therefore, the theoretical modeldoes not need to allow for any along the balanced growth path. In contrast,in Ngai and Pissarides (2004), there is exogenous growth while the sectorsare being grouped according to whether they produce capital or consumptiongoods. Thus, it is plausible that their conditions on a balanced growth pathare di¤erent to the present ones. Closer to the analysis of the model below isAcemoglu and Guerrieri (2004). This paper allows for an endogenous growthsetup and puts emphasis on capital deepening driven growth. However, theirresults on unbalanced growth are heavily dependent on the assumption ofdi¤erent factor intensities across sectors, while their objective is to deliver amodel that would encompass the existence of a steady-state balanced growthpath in the limit, with structural change and unbalanced growth at the in-dustry level. The focus of the model below is to understand how the use ofdi¤erent capital goods across sectors might still allow for aggregate growth,as long as the prices of all capital goods are driven down by technologicalprogress. The intensity of capital use is allowed to be the same across sectors.Moreover, this model deviates from the recent theoretical literature that
deals with the impact of ICT upon growth. The ICT have been associatedwith multiple puzzles from the economists� viewpoint regarding the USAeconomy (Quah, 2001). The "paradox" of the low productivity and TFPgrowth of the 1970s and 1980s attracted most of the attention. This puzzleseems to have reached its resolution, as long as ever since the 1990s, USAeconomy exhibited high labour productivity and TFP growth that acceler-ated in the mid-1990s. This cycle of the USA economy that started with theearly introduction of the ICT era in the mid 1970s has been explained atthe theoretical level mostly through the literature of General Purpose Tech-nologies (GPT). The economic historians were the �rst to draw the analogy
4

between the ICT and the great inventions of the past, such as combustionengine, electricity, railways, that pioneered the �rst and second industrialrevolutions (David, 1991, David and Wright, 1999). The features of a GPT,as given by Lipsey, Bekar, Carlaw (1998), are: "Wide scope for improvementand elaboration; Applicability across a wide range of uses; Potential for usein a wide variety of products and processes; Strong complementarities withexisting or potential new technologies". Several empirical studies �nd sup-portive evidence for the GPT hypothesis, i.e. that the use of ICT goodsinvolves important externalities for the ICT intensive industries (Jorgensonet al., 2004, Oliner and Sichel, 2002, Triplett and Bosworth, 2002, Oulton etal., 2003).Having as a starting assumption that ICT are GPT, Helpman and Tra-
jtenberg (1998) developed a model to explain how the arrival of a new GPT isexpected to generate cycles, where labour productivity �rst lowers and thenincreases as the new steady-state is reached. Their explanation relies on alearning process developed around the adoption of the new technology. Onesector after the other starts investing real resources in making its productionprocess compatible with the use of the new GPT. A critical mass of newapplications needs to take place so that a sector permanently switches to thenew technology. Until this threshold is reached, the aggregate productivitygrowth appears low, because real resources are spent in R&D rather than inthe production of consumption and capital goods. The model below does notaim to explain either the cycle involved in the introduction of a new largescale technology, or the adoption process of a new technology. Instead, itmeans to show how unbalanced growth at the disaggregate level, caused bythe lack of adoption of a new essential technology, can still be consistent withbalanced growth at the aggregate level.Despite being mostly a theoretical exercise upon a multi-sector endoge-
nous growth model, this paper still claims to capture some interesting fea-tures of the USA economy. Following the framework and the techniques instandard empirical literature, this paper presents data at the three-digit ISIClevel from the USA. The industries reported in the original database weregrouped to form the analogues of the three sectors of the model. The maindescriptive statistics of the series of interest were examined and contrasted tothe model�s implications. There is no supportive evidence towards an impor-tant structural change undergoing in the USA economy caused by the ICTera. Also, by illustrating the importance of the aggregation over di¤erentsectors in the economy, the model adds to the explanations on the puzzleregarding why TFP growth has always been very small during the ICT era.Section 2 presents the model. Section 3 analyses the conditions for the
existence of a unique steady-state and explores its properties. Section 4
5

presents some evidence from data from the USA economy over the period1979-2001 that support the predictions of the theoretical model. Section 5concludes.
2 The Model
2.1 Production Side
The model examines a three sector economy. There are two �nal goodssectors in the economy: the ICT using and the non ICT using one. Thethird sector is the ICT producing sector, which performs R&D and comes upwith new ICT goods. There is one more industry, which produces the twotypes of intermediate capital varieties. It may be considered as verticallyintegrated with the ICT producing sector. In what follows, the numeraire isthe non ICT using output.
2.1.1 ICT Producing Sector
The engine of growth is the sector which produces new ICT "ideas", _N . TheICT producing sector employs a fraction uN of the human capital resources,H. The production exhibits economies of scale. The motivation for the pro-ducing externalities is that there is learning-by-doing: as the production sizeincreases, more new production ideas and practices become available. Theexogenous productivity is given by parameter �. In order to have su¢ cientincentives to innovate, this sector operates as a monopoly1.
_N = �(uNH)N (1)
2.1.2 ICT Using Sector
The ICT using sector absorbs a fraction u1 of the total human capital re-sources and employs an array of N intermediate capital goods fx1(j)gj2[0;N ],
1The alternative more general speci�cation: _N = �(uNH)N�, implies that for constant
_NN , uN will be monotonically changing along time. This pattern is not empirically relevant.Besides, this case does not allow for the existence of a CGP altogether as it does not allowconstant ICT production growth to coexist with constant aggregate output and capitalgrowth.
6

so as to produce good Y1. By construction, this variety of intermediate goodsis expanding along time. This sector is perfectly competitive2.
Y1 = (u1H)1��Z N
0
x�1 (j)dj (2)
The �nal good is used for either consumption, or the production of capitalgoods (whether or not compatible to ICT). For simplicity, both forms ofcapital depreciate fully within every period.
Y1 = c1 +K0 +K1 (3)
2.1.3 Non ICT Using Sector
The non ICT using sector employs a fraction, u0, of the total human cap-ital resources and combines it with the sector speci�c intermediate capitalvarieties to produce �nal good, Y0. The capital varieties, fx0(i)gi2[0;A], are�xed in number along time. This stands for the assumption that this sectoris not using ICT capital. Instead, it uses capital that is compatible withtechnologies that have already ful�lled their maximum range of applications.This sector is perfectly competitive3.
Y0 = (u0H)1��Z A
0
x�0 (i)di (4)
The �nal good is used only for consumption purposes.
Y0 = c0 (5)
2.1.4 Intermediate Capital Varieties Market
There is a �xed number, A, of �rms that produce intermediate capital va-rieties that are only used by the non ICT using sector. At the same time,there is an expanding number, N , of �rms that produce intermediate capitalvarieties that are exclusively used by the ICT using sector. In both cases,the only input is a unit of the �nal output of the ICT using sector. Every�rm in this "sector" has in�nite horizon monopolistic rights that come from
2Allowing both sectors to use both ICT and non ICT capital at di¤erent intensities,would not change the main features of the equilibrium.
3Allowing for a di¤erent capital intensity in this sector would not a¤ect the features ofthe equilibrium, while complicating the analytical expressions. The simplifying assumptionof setting it equal to that of the ICT using sector is also used for the sake of stressing outmore the di¤erences across the two sectors that stem from the type of the capital used.
7

exploiting a patent. The price of every such patent equals the present dis-counted value of the �rm�s entire stream of pro�ts. The �rms operate undermonopolistic competition.In particular, a �rm that produces the non ICT using capital variety i,
has a market value at time t, V t0 (i), which equals the present discounted
value of its future stream of pro�ts. The discount factor depends on themarket interest rate, r(t). The pro�ts are given as the gap between the�rm�s revenues and costs. The unit cost of production equals the price, p1, ofthe ICT using �nal good. Given its market power, the �rm selects its pricep̂0(i), while taking into account the demand it faces from the non ICT using�nal goods producers.
V t0 (i) =
Z 1
t
e�R t0 r(�)d� (p̂0(i)x0(i)� p1x0(i)) dt (6)
A �rm that produces the ICT using capital variety j, has a market valueat time t, V t
1 (j). The output will be priced at p̂1(j) taking into account thedemand from the ICT using �nal good producers. The unit cost is again p1.
V t1 (j) =
Z 1
t
e�R t0 r(�)d� (p̂1(j)x1(j)� p1x1(j)) dt (7)
In equilibrium, the markets of the two types of capital varieties shouldclear out.
K0 =
Z A
0
x0(i)di (8)
K1 =
Z N
0
x1(j)dj (9)
2.1.5 Human Capital Market
The human capital stock is �xed along time. Its market is perfectly compet-itive. The market clearing condition requires that all resources are allocatedacross all three sectors that use human capital.
1 = u0 + u1 + uN (10)
2.2 Consumer Side
2.2.1 Households
There is a continuum of identical households of size one. The representativehousehold gains utility from its consumption of ICT using or non ICT us-
8

ing good. A general framework of joint CES and CRRA preferences allowsboth intertemporal and intratemporal substitution to come into play (the in-tratemporal and intertemporal elasticities of substitution are constant alongtime and equal to 1
1�� , and1�respectively).
u(c0; c1) =
�[�c�0 + (1� �)c�1]
1�
�1��� 1
1� �; � 2 (0; 1); � < 1; � > 0 (11)
The human capital is uniformly delegated across all agents in the econ-omy, so that each of them holds H. At every period, the households�incomecomes from the wage, wH(t), that they earn from supplying their humancapital and from the interest rate, r(t), that they receive on their total assetholdings, S(t). The only means of savings available are the assets of thecapital producing �rms. In e¤ect, their budget constraint takes the form:
_S = rS + wHH � c0 � p1c1 (12a)
3 Steady-State Analysis
3.1 Existence of Steady-State
A Constant Growth Path (CGP) is a steady-state equilibrium path alongwhich the ICT production stock, N , the aggregate value of output, Y =Y0 + p1Y1, capital, K = p1K0 + p1K1, and consumption, C = c0 + p1c1,grow at a constant rate. The conditions that allow for the existence of suchan equilibrium path will be investigated under the framework of the socialplanner�s economy, since it is more insightful regarding what drives the rel-evant results. In addition, the Pareto Optimum solution provides a usefulbenchmark for the competitive equilibrium. All proofs are given in AppendixA.
Proposition 1 The necessary and su¢ cient condition for the existence aCGP with N , Y , and K growing at constant rates is that the allocation ofhuman capital in the ICT producing sector is constant, i.e. _uN = 0. In orderfor the aggregate consumption, C, to grow at constant rate, the preferencesneed to exhibit unit intratemporal elasticity of substitution, i.e. � = 0. Alongthe unique CGP there is no reallocation of resources, _u0 = _u1 = _uN = 0.
9

The requirement on constant allocation of human capital in the ICTproducing sector is straightforward. Since the only direct input in the ICTproduction is the human capital, then the result follows immediately.The growth of aggregate output has three potential sources: capital accu-
mulation, labour and TFP growth. When considering the growth expressedin terms of the good chosen as the numeraire, the TFP growth is just ab-sorbed by the relative prices of the two �nal goods (due to the CRTS in theirproduction). Capital accumulation is itself enforced by the falling capitalprices. The latter result from the increased availability of intermediate ICTcapital varieties. Therefore, constant growth for the aggregate �nal good isdelivered, if the ICT production stock grows at a constant rate. Since thisalso implies constant allocation of human capital in the �nal goods�sectors,any reallocation between them should not a¤ect the aggregate �nal goods�sector. Because the capital stock absorbs a constant fraction of output, thesame reasoning goes through when looking at the aggregate capital growthrate.The explanation on the requirement upon the preferences is more in-
volved. The case of 11�� > 1, is the one where consumers respond a lot to
di¤erences in prices by substituting one good for the other. Within this con-text, since the relative price of the ICT using good is monotonically fallingalong time, the consumers would like to substitute their consumption of nonICT good with that of ICT using good. This implies that the expenditureshare of the non ICT using good would be decreasing along time. In orderfor the marginal rate of substitution (MRS) to be equal to the marginal rateof transformation (MRT), the share of human capital in the non ICT usingsector should be also decreasing along timeHowever, in order for the market clearing condition to be satis�ed along
time, the consumption of the non ICT using sector needs to grow at thesame rate as the production in that sector. Yet, the implied rate of growthfor the allocation of human capital in this sector would be lower than theone required from the static optimization condition. The only case thatthey would be equal is if consumers were indi¤erent regarding the timing oftheir consumption (otherwise, they would be willing to reduce by more theircurrent consumption of the non ICT using good, which would imply that partof its production would remain unavailable). That cannot be a steady-stateequilibrium. Hence, a condition is required that would put restrictions onthe consumers�intratemporal substitution patterns. The assumption of unitintratemporal elasticity of substitution implies constant expenditure shares.This allows the consumption growth rates to follow the production ones.Constant MRT along time implies that there will be no systematic shift ofresources from one sector to the other.
10

3.2 Features of the Steady-State
In what follows, the focus is back on the competitive equilibrium steady-state.Given the result from Proposition 1, the steady-state of the competitiveequilibrium is tracked down after imposing unit intratemporal elasticity ofsubstitution and constant human capital shares. The details are given underProposition 2. The most interesting static equilibrium results involve thefollowing:
p1 =
�A
N
�1��(13)
p̂0 = p̂1 =p1�
(14)
Condition (13) shows that the relative price of the ICT using good isfalling along time at a rate of growth which is proportional to the rate ofexpansion of the ICT capital. As condition (14) shows, the prices of allcapital varieties fall at the same rate as the price of the �nal ICT usinggood. Therefore, the productivity gain of the non ICT using sector comesonly indirectly. This sector is using a �xed number of capital varieties alongtime, but these varieties become cheaper and cheaper relative to the nonICT using �nal good. The falling prices generate increased demand for theexistent capital varieties. Capital deepening is the only source of growth inthis sector. At the same time, ICT using sector bene�ts from more varietiesof capital becoming available along time. The bene�ts from more varietiescomplement those from cheaper varieties delivering faster growth for thissector relative to the non ICT using one.
u0u1=
(1� �2)�
1� (1� �2)�(15)
Condition (15) comes from equating MRS to MRT and using the marketclearing conditions. It shows the relative shares of human capital in the two�nal good sectors. Given that there is no reallocation of resources along thesteady-state, the relative shares should remain constant along time. Theirratio depends on the expenditure share of the non ICT using good, as long asit a¤ects the marginal utility of consumption. It also depends on the outputelasticity of capital, �, since it a¤ects the capital-labour substitution. Thesame parameter also speci�es the size of the mark-up, 1��
�, that the capital
producers enjoy.
11

The following Proposition summarizes the dynamic equilibrium results.
Proposition 2 For preferences that satisfy: � > 0 and � = 0, along thecompetitive equilibrium CGP the following are true4:
The growth rate of every sector and of the aggregate economy is propor-tional to the endogenous growth rate of the ICT producing sector, gcN :
_Y0Y0
=_c0c0=_C
C=_Y
Y=
_K
K= �gcN
_Y1Y1
=_c1c1=
_K1
K1
=_K0
K0
= gcN
gcN = gcN(�; �; �; �; �;H)
The human capital allocations are constant and given as a function of allparameters of the model and the human capital stock:
ucz = ucz(�; �; �; �; �;H) ; z = f0; 1; Ng
Given the static optimization conditions described above, the features ofthe dynamic optimization conditions follow immediately. In particular, theICT using sector will be growing at the same rate as the ICT producing sec-tor, since this sector fully bene�ts from any advances in the ICT production,both in terms of capital deepening and in terms of TFP increase. On thecontrary, the non ICT using sector grows only due to sustained investmentdriven by the fact that non ICT capital is becoming cheaper over time.When the numeraire is the non ICT using good, the growth of the ag-
gregate economy is pinned down by the output growth of the non ICT usingsector. The e¤ect of any output growth from the ICT using sector abovethe output growth of the non ICT using sector, is completely cancelled outby the growth rate of the relative prices. The economy is along a balancedgrowth path, where the underlying sectors experience di¤erent growth rates,but the aggregate consumption to output and capital to output ratios areconstant. The consumption to output and capital to output ratios are alsoconstant within every sector, but di¤erent across sectors. The growth rate of
4The conditions for an interior solution are an endogenously determined lower bound forhuman capital resources, �H(�; �; �; �), and an upper bound for the intertemporal elasticityof substitution, 1
��(�;�;�;�;H) .
12

the economy is a function of the preference and production parameters andthe available human capital stock.The condition for positive growth ensures that human resources are suf-
�ciently high for the economy to have incentives to direct part of its realresources into R&D.The condition in order for the TVC to be satis�ed in the limit, i.e. that
real resources are still driven into the two �nal goods�sectors, requires thatthe intertemporal elasticity of substitution is not too high. The thresholddepends on the parameters of the model and the economy�s human capitalresources. Growth takes place when people substitute current consumptionwith future one. The incentives to do so depend on the gap between the realinterest rate in consumption units and the subjective discount rate. Whilethe market interest rate is constant, the real interest rate in consumptionunits changes over time as long as the consumption goods� prices changedue to the sustained growth. The level of the interest rate in consumptionunits, as well as the responsiveness of the consumers to the payo¤s in termsof interest rate predominately depend upon the intertemporal elasticity ofsubstitution. The resource constraint requires that consumption does notgrow faster or slower than the output. Hence, the elasticity should not betoo high.
Corollary 3 This economy does not exhibit transition dynamics.
This result may easily be explained and proved through the CGP equi-librium of the social planner�s economy. The production economy is drivenentirely by the externalities in the ICT producing sector. In particular, giventhe employment in this sector, there are constant returns to any additionalunit of ICT production stock. Since the ICT production stock constitutesthe unique state of the economy, there are no diminishing returns to theICT production stock that would allow for smooth transition of the economytowards the steady-state.The transition dynamics could be delivered by a slowly depreciating phys-
ical capital, since the �nal goods�production functions retain the propertyof diminishing returns to capital. Yet, that would increase the nonlinearityof the model and would require numerical solution methods. This case isdisplayed and discussed in Appendix B.
Corollary 4 The growth rate of the economy will be higher and the shares ofhuman capital in the two �nal goods�sectors will be lower, the more patient
13

the agents in the economy are (the lower � is) and the more productive theICT producing sector is (the higher � is). The e¤ect of a higher outputelasticity of capital (�), or of the expenditure share of the non ICT usinggood (�) is ambiguous and depends on the values of di¤erent parameters ofthe model.
Patient agents would be more willing to put up current consumption forfuture one. Under this framework, the savings take the form of resourcesbeing directed towards the ICT producing sector. This is because as assetholdings increase, they drive interest rates down and patent prices up. Thisenables higher growth in the long run since it provides incentives for higherICT production growth. An increased productivity in the ICT producingsector would have the same e¤ect. It would increase the marginal product ofthe human capital in this sector, and thus would attract more human capitalresources. The incentives to produce more ICT would come from higherpatent prices, that would result both from the increased productivity andthe reduced interest rate.The comparative statics following an increased preference towards the
non ICT using consumption good is more involved. On the one hand, sincethe marginal utility of consumption goes up in this sector, there are forcesto increase resources in its production. On the other hand, reducing theresources from the ICT producing sector implies that the rate of growth ofthe economy would fall. So is the rate at which the price of the non ICTusing good increases relative to the ICT good. This implies that there wouldbe a force that reduces consumption growth in the non ICT using sector,since it reduces the gap between the interest rate in consumption units andthe subjective discount rate. For unit intertemporal elasticity of substitution,this second e¤ect is eliminated because the market interest rate coincides withthe interest rate in consumption units. Hence, higher � would imply lowergrowth rate and resources being driven out of the ICT using and producingsector and into the non ICT using sector.Same reasoning applies for the case that the output elasticity of capital
would increase. On the one hand, this would reduce the mark-up that thecapital producers enjoy, and thus would increase the production of capitaland output. The e¤ect of capital accumulation process upon growth wouldbecome stronger. On the other hand, since the human capital share in outputwould fall, this would reduce the incentive for growth as it would mitigate thegap between interest rate in consumption units and the subjective discountrate. Again, for unit intertemporal elasticity of substitution, the seconde¤ect is eliminated and thus the result of the increase in the output elasticity
14

of capital would be an increase in the share of human capital in the ICTproducing sector and a decrease of it in the �nal goods�sectors.
4 Supportive Evidence
This section uses data from the "60-Industry Database", which is constructedby the Groningen Growth and Development Centre (GGDC) and providesdata on employment and value added for 57 industries in the USA economy,for the period 1979-20015. Data on personal consumption expenditures bytype of expenditure over the same period, come from the Bureau of EconomicAnalysis6. The source of the interest in the USA economy is twofold. First,this economy �ts closely the theoretical framework in terms of the struc-ture of the input/output markets and the degree of government interven-tion. Second, there are multiple empirical studies describing the behavior ofUSA economy after the mid-70s and the possible linkages between economicgrowth and the ICT production and use (Jorgenson et al. 2004, Gordon 2002,Oliner and Sichel, 2002, European Central Bank, 2002, Groningen Growthand Development Centre, 2003)7.The industries are grouped into three major sectors: ICT producing,
ICT using and non ICT using. An industry is classi�ed as ICT producingaccording to the OECD de�nition of the ICT manufacturing sector, includingalso the software producing industry. The criterion used for classifying anindustry as ICT using is its degree of ICT capital intensity. In particular,the average share of the ICT capital out of total capital compensation foran industry over the period 1979-2001 needs to exceed the average sharethat is observed in the aggregate economy over the same period8. Details on
5This dataset has been developed by the Groningen Growth and Developemnt Centreand is based on the STAN OECD database and o¢ cial USA governement sources.
6Since this dataset is for 103 industries, the appropriate mapping with the 57 industieswas made following the ISIC Rev. 3 system.
7Another bene�t from focusing on USA data is that the o¢ cial data were readilyadjusted into using a hedonic de�ator system, so as to account better for the bene�tsarising from the ICT production and use. The de�ators provided in the GGDC databasecome from o¢ cial BEA data (harmonising of the de�ators for other countries in the datasetdoes not a¤ect USA data). There is still discussion in the literature whether hedonicde�ators are adequate. For an exposition see OECD "Handbook on Hedonic Indexes andQuality Adjustments in Price Indexes: Special Application to Information TechnologyProducts", Triplett J. (2004).
8Data provided by GGDC for 26 industries. The appropriate mapping with the 57industies was made following the ISIC Rev. 3 system.
15

the industries in each major sector and the descriptive statistics of the mainseries are provided in Appendix C.According to the theoretical exercise, the ICT using sector is the sector
fueling the economy with intermediate capital varieties, while the non ICTusing sector is mainly a consumption producing sector. To check whetherthe resulting grouping of sectors supports this, the BEA "Use Table" of the"Benchmark 1997 Input-Output Table" was used to calculate the use sharesof the commodities of the three sectors. The use considered is "total interme-diates", "personal consumption" and "�xed investment", or the former twoalone. The ICT producing sector turns out as a clearly capital/intermediateproducing sector, followed by the ICT using sector. This Table 1 in AppendixC9. All the �gures discussed below are presented in Appendix D.In Figures 1 and 2 one may look at the aggregate economy from two dif-
ferent perspectives, revealing di¤erent dynamics along time. In either case,aggregate private economy is split into three sectors. Figure 2 identi�es threesectors corresponding to whether the good comes from agriculture (ISIC: 01-05), manufacturing (ISIC: 10-45) or services�(ISIC: 50-95) industries. Figure1 identi�es three sectors with respect to whether there is production, inten-sive use or non intensive use of ICT capital. In spite of the short time spanof the data, the trends reported in the structural change literature (Ngaiand Pissarides, 2004) are striking in Figure 2. In particular, over the pe-riod 1979-1995, the share of agriculture in total hours worked is relativelyconstant around 4%, that of services increases from 54% to 63% and thatof manufacturing falls from 41% to 33%10. On the contrary, over the sameperiod, the shares of the ICT producing, ICT using and non ICT using sectorremain considerably constant. The share of the ICT producing sector is fairlyconstant around 4%, that of ICT using changes from a minimum of 24% toa maximum of 26% and that of non ICT using sector changes from 73% to71%. The reason that the focus is on the period before 1995, is that theempirical literature suggests that in 1995 there has been a structural breakin most of the series of interest.Figure 3a gives the value added at current prices (millions of USA dollars
expressed in logarithmic units) of the ICT producing, ICT using and non ICTusing sectors over the period 1979-2001. The rates of growth are roughly the
9The shares are reported for the three aggregate sectors (ICT using, non ICT usingand ICT producing), as well as for the services and manufacturing industries within eachmajor sector.10The employment share for manufacturing is considerably higher than that usually
reported. The di¤erence comes from using data only for the private economy and usingtotal employment in terms of hours worked rather than in number of persons engaged inproduction.
16

same11. The non ICT using sector delivers on average 71% of total valueadded over the period 1979-1995. The ICT using and the ICT producingdeliver on average 24% and 4% respectively. The share of value added of thenon ICT using sector out of the two �nal goods�sectors is on average 75%over this period. Given the predictions of the model, this should be equal tothe share of this sector in hours out of total hours used in the two �nal goods�sectors. This is equal to 74% from the data. Also, the static optimizationcondition (15), implies that the share of the value added of the non ICTusing sector out of total �nal goods�value added, is equal to �(1��2). Fromthe BEA data, the average expenditure share of the non ICT good is 87%over the same period. Using the expenditure, hours and value added shareestimates, the implied from the model output elasticity of capital is between0.39 and 0.3812.Next, Figure 4a gives the value added at constant prices. The aggrega-
tion over the di¤erent industries within each major sector is based on usingTörnqvist weights13. In contrast to Figure 3a, it is prevalent that the growthis stronger in the ICT producing sector, followed by the two �nal goods�sectors. The ICT using sector is picking up in growth especially after 199514.Moreover, according to the model, when evaluating the growth rate of
the �nal good in terms of the non ICT using good, the aggregation shouldgive the growth rate of output of the non ICT using good. This is becausethe negative price e¤ect upon the growth rate of the value of the ICT usinggood completely cancels out the positive output e¤ect in that sector. Figure 5shows together the output and price e¤ects. Over the period 1980-1995 thesetwo e¤ects clearly move in the opposite direction and have approximately thesame size. In fact, the series that comes from their aggregation does not havea statistically di¤erent from zero mean. After 1995 though, these two e¤ectsmove together. This allows the aggregate output growth to be higher thanthe growth rate of the output in the non ICT using sector.Finally, the model delivers an implication regarding the TFP growth rate
for the aggregate economy. The TFP growth is the part of the growth rate
11The same picture is delivered from Figure 3b. The displayed series are the annual(exponential) growth rates (no �ltering).12Despite being signi�cantly di¤erent to the benchmark estimate of � = 1=3, it is a
plausible estimate for the USA capital share. The di¤erence might arise from the di¢ cultiesin mapping between ISIC Rev 3 and NAICS.13The Törnqvist aggregation method is based on weighting each industry�s exponential
annual growth rate with a two-period average of its share in aggregate value added. Aftercomputing the growth rate, the implied quantity index was derived, with the normalisationthat it is equal to 100 in 1995. This index was next used to derive the series in levels andlogarithmic levels.14Same picture is delivered by contrasting Figures 3b and 4b.
17

in aggregate output which is not explained by the contribution of labour orcapital input. Using the production functions for the two �nal goods�sectorsand the predictions of the market equilibrium of the model, the Solow residualis equal to (1��) pY1Y1
pY0Y0+pY1Y1gcN
15. This means that the TFP growth is only afraction of the growth of the ICT producing sector and this fraction dependson the output elasticity of labour and the value added share of the ICTusing sector. The former appears due to the labour augmenting role of thetechnology of expanding varieties, while the latter appears because the ICTusing sector is the only sector which bene�ts from ICT capital goods beyondcapital deepening. For a labour share of 70% and a share of ICT using sectorof 26%, only 18% of the growth of the production ICT translates into TFPgrowth16.However, all results should be treated with precaution. First, because
the mapping of the model onto the data is not straightforward17. Second,even with hedonic pricing, USA data are still susceptible to noise regardingthe derived value added de�ator. Third, Törnqvist aggregation lacks the"dual"�property, i.e. a Törnqvist price index does not imply a Törnqvistquantity index and vice versa. Fourth, given the small sample, standardtime series stationarity and structural change analysis indicates that most ofthe series of interest are non stationary and/or have multiple breaks.
5 Conclusions
This paper has developed a simple theoretical framework, which providesinsight into how multiple sectors of di¤erent growth potentials interact withinan economy in a way that allows for a CGP at the aggregate level. Along
15If real GDP, ~Y , aggregates the �nal good production, then its implied growth rate
is::~Y~Y=
pY0Y0pY0Y0+pY1Y1
_Y0Y0+�1� pY0Y0
pY0Y0+pY1Y1
�_Y1Y1. Using the results under Proposition 2:
SolowResidual �:~Y~Y� pY0Y0
pY0Y0+pY1Y1
�(1� �)
� :u0Hu0H
�+ �
_K0
K0
���1� pY0Y0
pY0Y0+pY1Y1
��(1� �)
� :u1Hu1H
�+ �
_K1
K1
�=�1� pY0Y0
pY0Y0+pY1Y1
�(1� �) _NN
16Using the implication of the model that the growth rate of the ICT using sector re�ectsthe ICT technology growth, the resulting own estimate of the TFP series is higher thanthe estimates from Jorgenson et al. (2004).17For example, the output measure is value added rather than gross output, or the
measured value added for the ICT production includes production of both old and newICT stock.
18

this path, growth is sustained endogenously. The source of growth is the ICTproduction. The market economy provides the incentives for ICT productionthrough a patent system that protects monopoly rights. Despite the fact thatonly one sector is using the capital goods which are compatible with the newtechnologies, the bene�ts from their use spread throughout the economy.This is due to capital deepening, which is caused by continuously fallingcapital prices. The source of TFP growth in the economy is the expandingvariety of potential applications of the ICT goods, which stems from theexternalities present in the ICT production.Along the steady-state CGP, there exists no reallocation of real resources
and the size of every sector is �xed along time. The growth of the ICT us-ing sector re�ects the rate of growth of the ICT producing sector, since thissector uses capital varieties that follow the advances of the ICT productionstock. The rate of growth of the non ICT using sector is equal only to afraction of the ICT production growth. This is because this sector uses ob-solete technologies that are available at falling prices, due to the advancesin their production. These are the advances associated with the use of ICTtechnologies. At the aggregate level, any positive output e¤ect is completelycancelled out by a negative price e¤ect. In e¤ect, the growth rate of theaggregate output is equal to the growth rate of the production of the goodchosen as the exchange unit. The aggregate consumption to capital and out-put to capital ratios are constant along time. These ratios are also constantfor the disaggregated sectors, but di¤erent across sectors.Data from the USA economy, when mapped to the theoretical structure,
reveal considerably constant sectoral shares out of the total hours worked.They support that the output e¤ect at every point in time and along timeis cancelled out by a negative price e¤ect. This shows up in that the growthrates of the output at current prices are the same across sectors. The volumeof the ICT using production grows faster than the non ICT using one. TheICT producing sector is the source of productivity growth, when consideringthe pervasiveness of the ICT goods and the sector�s contribution to aggregategrowth despite the small value added and employment shares of this sector.Nevertheless, the empirical literature suggests that the USA economy
does not appear to be along a balanced growth path during the past threedecades, while the interest lies mostly in understanding the acceleration ingrowth after mid-1990s and its consequences. The numerical exercise pre-sented in Appendix B of this paper provides a �avour of the out of steady-state dynamics of the social planner�s economy. Future research may involvesolving for the dynamics of the competitive equilibrium, while calibrating thebehavior of the USA economy during the 1990�s.This however implies that the productivity of the ICT sector is still to
19

be regarded exogenous. A possible extension for the model of this paper isto scrutinize the incentives to produce ICT, which will endogenize the pro-ductivity of this sector. This requires to reconcile the theory of endogenouseconomic growth with the theory of industrial organization regarding thegoods that exhibit network externalities. The di¢ culty of bridging this gapis that the expectations in a market of network goods imply a special demandfor these goods that results in multiple possible equilibria (Katz and Shapiro,1986, Economides, 1996).That framework would be more appropriate also to account for cross-
country di¤erences with respect to the use of ICT technologies and the e¤ecton their aggregate economic performance. Otherwise, it would be interestingto consider more closely the key implication of the current model, i.e. thatthe falling relative price of the ICT using goods drives capital deepeningand economic growth. An idea to be explored empirically is that the cross-country di¤erences arise mainly from di¤erences in the relative prices of theICT using goods.
References
[1] Acemoglu, D. and V. Guerrieri (2005). "Capital Deepening and Non-Balanced Economic Growth", Work in Progress
[2] Aghion, P. and P. Howitt (1998). "On the Macroeconomic E¤ectsof Major Technological Change", in Helpman, E., eds., General PurposeTechnologies and Economic Growth, MIT Press, Cambridge.
[3] Albers, R. and F. Vijselaar (2002). "New Technologies and Produc-tivity Growth in the Euro Area", ECB Working Paper, No. 122, EuropeanCentral Bank, Frankfurt.
[4] Basu, S., J. G. Femald, N. Oulton and S. Srinivasan (2003). "TheCase of the Missing Productivity Growth: Or, Does Information Technologyexplain Why Productivity Accelerated in the United States But the UnitedKingdom", NBERWorking Papers, No. 10010, National Bureau of EconomicResearch, October.
[5] David, P. A. (1991). "Computer and Dynamo: The Modern Produc-tivity Paradox in a Not-Too-Distant Mirror", in Technology and Productiv-ity, OECD, Paris.
[6] David, P. A. and G. Wright (1999). "General Purpose Technologiesand Surges in Productivity: Historical Re�ections on the Future of the ICTRevolution", Manuscript.
20

[7] Economides, N. (1996). "The Economics of Networks", InternationalJournal of Industrial Organization, Vol. 14, No. 6, 673-699.
[8] Gordon, R. J. (2002). "Technology and Economic performance in theAmerican Economy, NBER Working Papers , No. 8771, National Bureau ofEconomic Research, January.
[9] Helpman, E. and M. Trajtenberg (1998). "A Time to Sow and a Timeto Reap: Growth Based on General Purpose Technologies", in Helpman,E., eds., General Purpose Technologies and Economic Growth, MIT Press,Cambridge.
[10] Helpman, E. and M. Trajtenberg (1998). "Di¤usion of General Pur-pose Technologies", in Helpman, E., eds., General Purpose Technologies andEconomic Growth, MIT Press, Cambridge, 1998.
[11] Inkaar R., M. O�Mahony and M. Timmer (2003). "ICT and Eu-rope�s Productivity Performance. Industry-level Growth Account Compar-isons with the United States", Research Memorandum GD-68, GroningenGrowth and Development Centre.
[12] Jones, C. J. (2001). "Sources of U.S. Economic Growth in a Worldof Ideas", American Economic Review
[13] Jorgenson, D. W., C. A. Ho and K.J. Stiroh (2004). "Growth ofU.S. Industries and Investments in Information Technology and Higher Ed-ucation", forthcoming in Corrado C., Haltiwanger J. and Sichel D., eds.,Measuring Capital in a New Economy, Chicago, University of Chicago Press
[14] Katz, M. and C. Shapiro (1986). "Technology Adoption in the Pres-ence of Network Externalities", Journal of Political Economy, 94, 822-841.
[15] Lipsey, R. G., C. Bekar and K. Carlaw (1998). "What Requires Ex-planation?", in Helpman, E., eds., General Purpose Technologies and Eco-nomic Growth, MIT Press, Cambridge, 1998.
[16] Mulligan, C. B. and X. Sala-i-Martin (1993). "Transitional dynamicsin Two-Sector Models of Endogenous Growth", Quarterly Journal of Eco-nomics, 108, 737-773.
[17] Ngai, L. R. and C. A. Pissarides (2004). "Structural Change in aMulti-Sector Model of Growth", CEP/CEPR Discussion Paper
21

[18] OECD (2003). "ICT and Economic Growth, Evidence from OECDCountries, Industries and Firms", Paris.
[19] Oliner, S. D. and D. E. Sichel (2002). "Information Technology andProductivity: Where are We Now and Where are We Going?", EconomicReview, Federal Bank of Atlanta, 87(3), Quarter Three, 15-44.
[20] O�Mahony M. and B. van Ark, eds, "EU Productivity and Compet-itiveness: An Industry Perspective. Can Europe Resume the Catching-upProcess?", O¢ ce for O¢ cial Publications of the European Communities,Luxemburg, 2003.
[21] Quah, D. (2002) "Technology Dissemination and Economic Growth:Some Lessons for the New Economy", Technology and the New Economy,Chapter 3, MIT Press, Cambridge
[22] Romer, P.M. (1990). "Endogenous Technological Change", The Jour-nal of Political Economy, Vol. 98, No. 5 : S71-S102.
[23] Triplett, J. E. and B. B. Bosworth (2002). "Baumol�s Disease HasBeen Cured: IT and Multifactor Productivity in US Services Industries",paper prepared for Brookings Workshop on Services Industry Productivity,Brookings Institution, Washington DC.
22

6 Appendix A: Analytical Proofs
Proof of Proposition 1The social planner solves economy�s dynamic optimization problem, hav-
ing controls over: fc0; c1; x1(i); x0(j); u0; u1g, 8i 2 [0; A], 8j 2 [0; N ]. Theunique state variable is:N .
H = e��t
�[�c�0 + (1� �)c�1]
1=��1��
� 11� �
+ �
�(u0H)
1��Z A
0
x�0 (i)di� c0
�+�
�(u1H)
1��Z N
0
x�1 (j)dj �Z A
0
x0(i)di�Z N
0
x1(j)dj � c1
�(16)
+� [(1� u0 � u1)�HN ]
The FOCs from the maximization problem (16) are the following18:
@H@c0
= 0) e��tE1�����c��10 � � = 0 (17)
@H@c1
= 0) e��tE1����(1� �)c��11 � � = 0 (18)
@H@x0(i)
= 0;8i) ��� (u0H)
1�� x��10 (i)�� � = 0;8i (19)
@H@x1(j)
= 0;8j ) ��� (u1H)
1�� x��11 (j)� 1�= 0;8j (20)
@H@u0
= 0) �
�(1� �)
Y0u0
�� ��HN = 0 (21)
@H@u1
= 0) �
�(1� �)
Y1u1
�� ��HN = 0 (22)
� _� =@H@N
(23)
= ��(u1H)
1��x�1 (N)� x1(N)�+ �(1� u1 � u0)�H
The TVC is the following:
limT!1
[�(T )N(T )] = 0 (24)
18Let E � [�c�0 + (1� �)c�1]1=� be the composite index of consumption.
23

Equations (17) and (18) give19:
c1c0
=
�1� �
�
�
�
� 11��
(25)
_c0c0
=1
�
���� (1� (t))
_�
�� (t)
_�
�
�(26)
_c1c1
=_c0c0+
1
1� �
�_�
�� _�
�
�(27)
Equations (19) and (20) give the each sector�s demand function for in-termediate goods. The model implies symmetry across each type of capitalgood:
x0 =
��
�
� 11��
�1
1�� (u0H) (28)
x1 = �1
1�� (u1H) (29)
Equations (21) and (22) equate the value of marginal product of humancapital across all sectors:
�
�(1� �)
Y0u0
�= ��HN (30)
�
�(1� �)
Y1u1
�= ��HN (31)
Using (30) and (31), equation (23) gives the growth rate of the shadowprice of the state variable N :
� _��= �H (1� u0) (32)
Inserting equations (28) and (29) back into the production functions givesthe following implicit production functions:
Y0 =
��
�
� �1��
��
1��A(u0H) (33)
Y1 = ��
1��N(u1H) (34)
Using these into (30) and (31) while dividing by parts, gives the relativeshadow prices of the two �nal goods in levels and growth rates, given by
19Let (t) � (1��(t))(1����)1�� , where �(t) � �c�0
�c�0+(1��)c�1.
24

equations (35) and (36) respectively. Equation (37) comes from substituting(34) back into (31) and di¤erentiating both sides with respect to time.
�
�=
�N
A
�1��(35)
_�
�� _�
�= (1� �)
_N
N(36)
_�
�=
_�
�(37)
By (25) it follows that �(t) = �c�0�c�0+(1��)c�1
= c0c0+
��c1. The resource con-
straints in each sector imply c0 = Y0 and c1 = Y1 � K0 � K1, while thetechnology side of the economy implies from the demand functions for capitalvarieties that: K0 = �
�NA
�1��Y0, K1 = �Y1 and Y1
Y0=�NA
�1�� u1u0. Combining
all thses relations while equating the MRT to the MRS implies the followingrelation between human capital allocations and expenditure shares:
u0u1=
(1� �)�(t)
1� (1� �)�(t)(38)
A steady-state CGP is an equilibrium that satis�es the FOCs, the mar-ket clearing conditions and the TVC together with the CGP requirements.By the law of motion of the state variable N , the necessary and su¢ cientcondition for constant gN , is that _uN = 0. Given the resource constraint:1 = uN + u1 + u0, this condition can alternatively take the form20:
g1 = �g0u0u1
(39)
The next condition comes from the requirement that aggregate outputgrows at a constant rate. This condition coincides with the one for constantgrowth rate for the value of aggregate capital stock. The growth rates forthe production in the two sectors are derived from (33) and (34), togetherwith (35):
_Y0Y0
= �gN + g0 (40)
_Y1Y1
= gN + g1 (41)
20Let _usus= gs for s = f0; 1g
25

These will be combined with (35), (36) and (33), (34):
_Y
Y=Y0Y
_Y0Y0+
��Y1
Y
_Y1Y1+_�
�� _�
�
!= �gN
The last equation is derived by using the steady-state condition (39).Hence, along a CGP for Y , uN has to be constant.The growth rate of the aggregate consumption is:
_C
C=c0C
_c0c0+
��c1
C
�_c1c1+_�
�� _�
�
�=_c0c0+ (1� �(t)) (1� �)
�
1� �gN
Relations (26), (36) and (32) are used to get the last part of the equation.By imposing the for constant _C
Cand solving it with respect to g0:
g0 = (1� �) (1� �)2�
1� ��(t) (1� �(t))
uNu0gN (42)
Equation (42) sets a condition on the evolution of the share of humancapital in the non ICT sector along time21. The static optimization condition(38) together with the CGP condition (39) give another expression on g0:
g0 =ddt(�(t))
�(t)= � �
1� �(1� �) gN (1� �(t)) (43)
Conditions (42) and (43) should be jointly satis�ed. Equating their LHSsand using that uN = 1� u0
�(t)(1��) , gives an expression for the share of humancapital in the non ICT using sector: u0 = ��1
�(1� �) �(t). Given the solution
path for u0, (38), (36) and (32) imply a growth rate for the consumption ofthe non ICT using good:
_c0c0= 1
�
h��+ �H
���+ ��1
�(1� (1� �) �(t))
�+ (1����)
1�� (1� �)gN
i.
This candidate solution should satisfy the market clearing conditionsalong time. It should be true that: _c0
c0=
_Y0Y0= !
1���H�+ g0. This implies
a third expression on the evolution of the share of human capital in the nonICT using sector:
g0 = ��
�� �
1� �(1� �)
�H
�(1� �(t)) (44)
Equation (44) may only be reconciled with (43), if � = 0. This contradictsthe original assumptions. Therefore, there is not any CGP for preferenceswith � > 0 and � < 1.21Since an interior solution implies �(t) 2 (0; 1), us 2 (0; 1), 8s 2 f0; 1; Ng and 1�� > 0,
then sgn(g0) = sgn(1� �).
26

For unit intertemporal elasticity of substitution (� = 1, while � 6= 0), theinstantaneous utility function is: u(c0; c1) = 1
�ln [�c�0 + (1� �)c�1]. The above
analysis remains the same and the FOCs will be those derived for the generalcase, in the limit of � = 1. The FOCs with respect to the consumption goodsresult in (25) and:
_c0c0
= ��� _�
�
�1 +
�
1� �(1� �(t))
�+_�
�
�
1� �(1� �(t))
_c1c1
=_c0c0+
1
1� �
�_�
�� _�
�
�The aggregate consumption growth rate is:
_C
C= ��� _�
�
The CGP requirement boils down to ddt
�� _��
�= d
dt
�� _��
�= ��H _u0 = 0.
Thus, if there exists any CGP, it will not allow for any reallocation. At thesame time, given condition (38), (43) implies d
dt(�(t)) = � �
1��(1��)�(t)(1��(t))gN = 0. An interior solution should imply �(t) 2 (0; 1) and gN >0 in steady-state. Hence, it is necessary that the preferences exhibit alsounit intratemporal elasticity of substitution, i.e. � = 0. Unit intertemporalelasticity of substitution alone is not su¢ cient to allow for a CGP.For unit intratemporal elasticity of substitution, along with a general
intertemporal substitution pattern (� = 0 and � 6= 1), the instantaneous
utility function is: u(c0; c1) =(c�0c
1��1 )
1���11�� . The FOCs with respect to the
two consumption goods imply:
c1c0
=1� �
�
�
�(45)
_c0c0
=1
�
���� _�
�(1� (1� �)(1� �))� _�
�(1� �)(1� �)
�(46)
_c1c1
=_c0c0+
�_�
�� _�
�
�(47)
The aggregate consumption growth rate is:
_C
C=_c0c0=1
�
���� _�
�+ (1� �)(1� �)(1� �)gN
�For the same reason as above, the condition for constant aggregate con-
sumption growth rate excludes reallocation of resources along the steady-state, i.e. _u0 = _u1 = _uN = 0. In this setting, condition (43) is automatically
27

satis�ed since �(t) = �, i.e. because the expenditure share of the non ICTusing good is time invariant. Condition (42) is satis�ed because � = 0.Therefore, the only condition left in order to pin down the CGP is (44).The case of � = 1 and � = 0, which corresponds to instantaneous utility:
u(c0; c1) = � ln c0 + (1 � �) ln c1, is only a special case of the � = 0 case.Q.E.D.
Proof of Proposition 2Regarding �rst the production side: The �nal good producers are price
takers. Therefore, their demand for capital comes by equating the value ofmarginal product of every capital variety to its price:
@Y0@x0(i)
= �(u0H)1��x�0 (i) = p̂0(i);8i (48)
p1@Y1@x1(j)
= �(u1H)1��x�1 (i) = p̂1(j);8j (49)
The producers of the capital varieties are functioning under monopolisticcompetition. In the absence of dynamic decision variables, they maximisetheir pro�ts by choosing their price and production at every period.
�0 = maxp̂0(i);x0(i)
fp̂0(i)x0(i)� p1x0(i); s:t:(48)g
�1 = maxp̂1(i);x1(i)
fp̂1(i)x1(i)� p1x1(i); s:t:(49)g
The solutions to these programs are:
x0 = �2
1��
�1
p1
� 11��
(u0H) (50)
x1 = �2
1�� (u1H) (51)
p̂0 = p̂1 =p1�
The model delivers symmetry among the varieties of each type of capitalgoods. The implied pro�t �ows for every period is:
�0 =1� �
��
21��
�1
p1
� �1��
(u0H) (52)
�1 = p11� �
��
21�� (u1H) (53)
These producers enter the market upon getting a "blueprint" that makestheir products compatible with one of the old technologies, A, or one of
28

the new ones, N . With well de�ned property rights, the cost that eachproducer needs to assume in order to acquire a blueprint is equal to thepresent discounted value of his future stream of pro�ts. The guess is thatalong the steady-state the interest rate is constant. This is to be veri�edlater. In this case, the value function of each type of �rm becomes:
rV0 = �0 (54)
rV1 = �1 (55)
Since the human capital market is perfectly competitive, there exists awage,wH , that clears out the market. This wage is equal to the value ofmarginal product of human capital in all three sectors:
@Y0@(u0H)
= (1� �)
�1
p1
� �1��
A�2�1�� = wH (56)
p1@Y1
@(u1H)= p1(1� �)N�
2�1�� = wH (57)
pN@ _N
@(uNH)=
�1r�N =
1
rp11� �
��
21�� (u1H) �N = wH (58)
In (58), the price of the output of the ICT producing sector, pN , is equal tothe market value of a �rm that produces intermediate capital varieties whichare compatible to ICT. The market value is given by (55) and (53).Equating (56) and (57):
p1 =
�A
N
�1��(59)
_p1p1
= � (1� �) gN (60)
Equating (57) and (58):r = ��u1H (61)
Regarding the consumer side: The households solve the following dynamicproblem by choosing fc0; c1g:
H = e��t�c�0c
1��1
�1�� � 11� �
+ � [rS + wHH � c0 � p1c1]
The solution to this problem gives the standard conditions:
c1c0
=1� �
�
1
p1(62)
�_�
�= r (63)
29

These imply:
_c0c0
=1
�
�r � �� (1� �)(1� �)
_p1p1
�(64)
_c1c1
=_c0c0� _p1p1
(65)
Searching for a CGP, the conditions are the same as under Proposition1. Since _Y
Y=
_KK= �gN , the condition for steady-state is that the share
of human capital in the ICT production sector is constant. Also, since_CC= 1
�[r � �+ (1� �)(1� �)(1� �)gN ], the requirement for CGP for con-
sumption is that the interest rate is constant. This veri�es the original guess.From (61), the conclusion is that there exists no reallocation of real resourcesalong the steady-state path.Along the CGP the market clearing conditions need to be satis�ed at
every point in time. Together with the FOCs, this implies constant con-sumption to output ratios in every sector. Equating (64) to _Y0
Y0= �gN while
using (61) and the ICT production function:
u1 =��H+ ��� (1� �) (1� �)
�+ ��� (1� �)(1� �)� ��� (1� �)(1� �)
�+ ��� (1� �)(1� �)u0 (66)
At the same time, within every period the market clearing conditionsimpose that: c0 = Y0 and c1 = Y1 � K1 � K0, while the demand functionsfor capital varieties imply that: 1
�K1 = �Y1 and
p1�K0 = �Y0. In addition,
Y1Y0=�NA
�1�� u1u0. Therefore, the static optimization conditions imply:
u0u1=
�(1� �2)
1� �(1� �2)(67)
Solving the system of the last two equations:
uc1 =(1� �(1� �2))
���H+ ��� (1� �)(1� �)(1� �)
��(1� �(1� �2)) + ��� (1� �)(1� �)(1� �)
(68)
uc0 =�(1� �2)
���H+ ��� (1� �)(1� �)(1� �)
��(1� �(1� �2)) + ��� (1� �)(1� �)(1� �)
(69)
gcN = �H
��(1� �(1� �2))� �
�H
�(1� �(1� �2)) + ��� (1� �)(1� �)(1� �)
�(70)
In order to ensure that this is indeed an interior solution, it is su¢ cientto check that uc1 > 0 and g
cN > 022. The condition for gcN > 0 requires that
22Note that uc1 > 0 i¤ uc0 > 0 and g
cN > 0 i¤ ucN > 0
30

�(1��(1��2))� ��H
> 0 and �(1��(1��2))+���(1��)(1��)(1��) > 0.The condition for uc1 > 0 requires that
��H+ ��� (1� �)(1� �)(1� �) > 0
and �(1 � �(1 � �2)) + �� � (1 � �)(1 � �)(1 � �) > 0. These combineto provide two necessary and su¢ cient conditions: H > 1
��(1��(1��2)) and
� >(1��)(1��)� �
�H
�+(1��)(1��) .The implied intertemporal elasticity of substitution is non-negative, we
need that H > ��(1��)(1��) . If �(1 � �) [1� �(1 + �)] � 1 � 2�, then �H >
1�(1��(1��2)) �
�(1��)(1��) and it is su¢ cient that H > 1
��(1��(1��2)) . If instead�(1� �) [1� �(1 + �)] > 1� 2� then it is su¢ cient that �H > �
(1��)(1��) .Alternatively, the interior solution may be satis�ed for �(1� �(1��2))�
��H
< 0 and ��H+ �� � (1� �)(1� �)(1� �) < 0. For reasonable parame-
terisation this case is not relevant, while it generates perverse results for thecomparative statics�analysis and the comparison to the �rst best from aneconomic point of view. Q.E.D.
Proof of Corollary 1The system of the FOCs, of the two resource constraints and the TVC is
solved without imposing the steady-state CGP conditions.Along any equilibrium path, the following are true: From c0 = Y0 it
follows that _c0c0=
_Y0Y0= �gN + g0. From c1 = Y1 � K1 � K0, where K1 =
�Y1 and K0 = ��NA
�1��Y0, it follows that _c1
c1=
_Y1Y1= gN + g0. From the
static optimization: u0 =�(1��)1��(1��)u1 it follows that g0 = g1 = g. Using
the latter with the resource constraint: 1 = u0 + u1 + uN , it follows that:_uN = �g(1� uN).Given that in the steady-state ~c0 = c0
N� and ~c1 = c1Nremain constant,
it is useful to de�ne the composite consumption index: E � ~c�0~c1��1 . Its
growth rate is equal to: _EE= �
�_c0c0� �gN
�+ (1 � �)
�_c1c1� gN
�. Since _c1
c1=
_c0c0�(1��)gN , it follows that
_EE= _c0
c0��gN . Using the results above regarding
the growth rate of consumption implied by the market clearing conditions:
_E
E= g (71)
At the same time, using (46) and (47), together with (36):
_E
E=1
�
���� _�
�+ ((1� �)(1� �)� 1) (1� �)gN
�� �gN
Dynamic equation (32), and u0u1= �(1��)
1��(1��) together with 1 = u0+u1+uN :
31

_E
E= ��
�+�H
�(1� �(1� �)) (1� �uN) (72)
Equating (71) and (72):
g = ���+�H
�(1� �(1� �)) (1� �uN)
Therefore:
_uN = (1� uN)
��
�� �H
�(1� �(1� �)) (1� �uN)
�(73)
This �rst order non-linear di¤erential equation in the share of humancapital in the ICT producing sector summarizes completely the dynamics ofthe economy. Its solution is23:
t�Z uN (t) 1
�H�
���H� (1� �z) (1� �(1� �))
�(1� z)
dz +z = 0 (74)
Solved for an initial condition: uN(0) = u�N , i.e. starting from the steady-state, the solution is uN(t) = u�N . This implies that _uN = g = 0. In turn,this implies that there are no transition dynamics, as long as gN , c0Y0 ,
c1Y1, and
c0p1K0
, c1K1always remain constant in and out of steady-state. Note also that
(73) ,may be rewritten as:
_uN = (1� uN) (1� �(1� �)) (uN � u�N) (75)
From (75), if the economy deviated from steady-state position then therewould be no forces to restore the steady-state. The dynamics would implythat for uN > u�N , _uN > 0, 8t and vice-versa. Q.E.D.
Proof of Corollary 2Let � = � (1� �(1� �2)) + ��� (1� �)(1� �)(1� �) > 0.E¤ect of a change in �:
@uc1@�
=(1� �(1� �2)) �
H
�
�� 1�2
�< 0
@uc0@�
=�(1� �2)
1� �(1� �2)
@uc1@�
< 0
@gcN@�
=� (1� �(1� �2))H
�> 0
23The di¤erential equation is a quadrature. Let z be some arbitrary constant of inte-gration.
32

Change in �:
@uc1@�
=(1� �(1� �2))
�
�1
�H
�> 0
@uc0@�
=�(1� �2)
1� �(1� �2)
@uc0@�
> 0
@gcN@�
= � 1�< 0
Change in �:
@gcN@�
=�H
�2
n��(1� �2)
h �
�H+ ��� (1� �)(1� �)(1� �)
i�(1� �)(1� �)
h��1� �(1� �2)
�� �
�H
ioGiven the condition for interior solution, the �rst term is negative. The
second term will be also negative i¤ � � 1. Also:
@�u0u1
�@�
=1� �2
[1� �(1� �)]2> 0
For � = 1:
@gcN@�
=�H
�2
h��(1� �2)
� �
�H+ �
�i< 0
@uc1@�
= ��(1� �2)
�2
� �
�H+ �
�< 0
Change in �:
@gcN@�
=�H
�2
n�1� �(1� �2) + 2��2
� h �
�H+ ��� (1� �)(1� �)(1� �)
i� (1� �(1� �))
h��1� �(1� �2)
�� �
�H
ioThe �rst term is positive. The second term is always negative. The �nal
e¤ect is ambiguous. Also:
@�u0u1
�@�
=�2��
[1� �(1� �)]2< 0
33

For � = 1:
@gcN@�
=�H
�2
h �
�H
�2� �(1� �2
�+ 2�a2) + 2�3�
i> 0
@uc1@�
= ��2� �(1� �2)
�
h �
�H(1 + �2) + 2�3
i< 0
Q.E.D.
7 Appendix B: Depreciation of the capitalstock
This exercise explores the implications of the model when allowing for geo-metric depreciation of the ICT capital stock, K1
24. The ICT using sectorgood is to be used for consumption, for the production of new capital stock-ICT and non ICT, and for the depreciation needs of the ICT capital stock.In e¤ect, now the state of the economy is summarized by the ICT capitalstock (since it may be preserved along time) and the level of ICT productionstock, fK1; Ng. The optimal control problem below is solved for the thesocial planner�s equilibrium, when there is control over:fc0; c1; K0; u0; u1g25:
H =
�c�0c
1��1
�1�� � 11� �
+ ��(u0H)
1��A1��K�0 � c0
�+��(u1H)
1��N1��K�1 � c1 �K0 � �K1
�+ � [�(1� u0 � u1)HN ]
The standard FOCs of equating the MRS to the relative prices:
c1c0=1� �
�
�
�(76)
By setting the marginal product of the non ICT capital equal to its cost:
�
�=
K0
�Y0(77)
24It can be extended for the case of both ICT and non ICT capital intermediates de-preciating over time. The analytical part of the solution does not indicate that the mainfeatures of the numerical solution would change.25The advantage of solving for the social planner�s equilibrium is that it preserves the
features of the implied dynamics of the competitive equilibrium, while being more straight-forward to handle analytically (and to check that the TVCs are satis�ed).
34

By equating returns to human capital across sectors:
�
�=Y1Y0
u0u1
(78)
Finally, the implied growth rates of the shadow prices for the capital andthe ICT stock:
� _��
= �Y1K1
� � (79)
� _��= �H(1� u0) (80)
The CGP solution is de�ned again as the steady-state equilibrium pathalong which the two state variables, as well as the aggregate output, con-sumption and capital (in terms of the non ICT using good) grow at constantrates. Along this path the TVCs need to be satis�ed.The TVCs will be satis�ed, when the shadow prices, as well as the state
variables grow at constant rates. For N to grow at a constant rate thecondition is that: _u0+ _u1 = 0. For � to grow at a constant rate, the conditionis that: _u0 = 0. Therefore, the TVC on the value of ICT production in thelimit implies that there is no reallocation along the steady-state: _u0 = _u1 =_uN = 026. The condition for constant growth rate of � is: gY1 = gK1. Butthen, the production function of the ICT using sector together with therequirement of _u1 = 0, imply that: gY1 = gN . Furthermore, by (77) and (78):K0 = Y1
u1u0. Constant allocations along the steady-state imply: gK0 = gY1.
Hence, from the law of motion for ICT capital, _K1
K1= Y1
K1� c1
K1� � � K0
K1, it
follows that _K1
K1is constant only if gc1 = gK1 . Finally, the non ICT using sector
production function together with the resource constraint in this sector implythat along the steady-state: gc0 = gY0 = �gN : To conclude, the following aretrue along the steady-state time path:
gu0 = gu1 = guN = 0
gc1 = gK1 = gK0 = gY1 = gN
gc0 = gY0 = �gN
Given the features of the steady-state, the model may be rewritten interms of the variables that will remain constant along the CGP. In particular,
26This argument is only a shortcut of the the outcome outlined and proved under Propo-sition 1. Adding physical depreciation does not a¤ect the implication of this TVC.
35

following the procedure described in Mulligan and Sala-i-Martin (1993), thesystem of FOCs is rede�ned in terms of one "state-like" variable,
�k1 � K1
N
,
and �ve "control-like" variables,�k0 � K0
N; !0 � c0
N� ; !1 � c1N; u0; u1
. Nev-
ertheless, as expected from the FOCs and the interaction between the two�nal sectors, the dynamics of this economy may be entirely determined bylooking at the law of motion of the unique "state-like" variable (the ICTcapital stock adjusted by the level of technology) and the control variables ofthe ICT using (human capital share and consumption adjusted for the levelof technology). This comes from the following:The resource constraint of the non ICT using good implies !0 as a function
(k0; u0):
!0 = (u0H)1��A1��k�0 (81)
The static e¢ ciency condition that equates the MRS to the MRT deter-mines k0 and u0 as a function of (k1; u1; !1):
k0 =��
1� �!1 (82)
u0 =�
1� �!1H
��1u��1 k�1 (83)
Therefore, the di¤erential equations that completely summarize the dy-namics are the following:
_k1k1= (u1H)
1��k��11 ��1 +
��
1� �
�!1k1����H
�1� �
1� �!1H
��1u��1 k�1 � u1
�(84)
_u1u1=1� �
�
�� + �H
�1� �
1� �!1H
��1u��1 k�1
��+�Hu1�
�1 +
��
1� �
�!1k1(85)
_!1!1
=1
�
���+ �
��(u1H)
1��k��11 � ��+ (1� �)�Hu1+
+(1� �)(1� �)(1� �)��(u1H)
1��k��11 � � � �Hu1�+
+(1� �)��(u1H)
1��k��11 � � � �Hu1�� �H
�1� �
1� �!1H
��1u��1 k�1 � u1
�(86)
36

The system of (84), (85) and (86) does not allow for an analytical solution,since it is highly non-linear. The steady state and the comparative staticsare solved numerically in MATLAB for a reasonable parameterization of themodel, when using the "time elimination" algorithm, which was proposed byMulligan and Sala-i-Martin (1993). The parameter values are picked so as tomatch the data of the USA economy over the period 1995-2001 (GGDC andBEA databases; details in Appendix C). The following table summarizes:
parameters A H � � � � � �
values 1 1 0.3 0.028 2.5 1.311 0.849 0.213Regarding the choice of the parameter values: In order to normalize the
units of the model, both the original technology index and the assumed �xedhuman capital stock are set equal to one. The choice of the output elastic-ity of capital is standard in the growth accounting literature (e.g. Mankew,Romer, Weil, 1992). The choice of the time preference parameter comes frommicro data study in Attanasio et al, 1989. The inverse of the intertemporalelasticity of substitution is consistent with the estimated intertemporal elas-ticity of substitution for shareholders, from the micro data study in Attanasioet al., 2002.According to the steady-state properties of the model economy, the growth
rate of the ICT using sector should re�ect the growth rate of the ICT produc-ing sector. Hence, taking the growth rate of the ICT using sector, dividingby the employment share of the ICT producing sector and getting the aver-age over the years 1995-2001 provides the calibrated productivity of the ICTproducing sector (given the normalization for the human capital stock, thiscalibration captures the interaction of the productivity of the ICT producingsector with the human capital stock).The parameter that weights the preference towards the non ICT using
good should be equal in equilibrium to the non ICT using good expenditureshare. This can be calculated using the data on Personal Consumption Ex-penditures by Type of Expenditure, 1979-2001, available from BEA. Out ofthe private sector expenditures alone, the expenditures for ICT using goodswere distinguished from the non ICT using ones. The expenditure share iscalibrated by the average share over the period 1995-2001.Finally, the depreciation rate for the ICT capital stock is taken from
data that BEA has published in "The Survey of Current Business", 1997, ondepreciation rates of various assets. The calibrated depreciation rate is theaverage depreciation rate of the ICT capital assets27.
27These include: "O¢ ce, computing and accounting machinery", "Communicationsequipment", "Electronic components and accessories", "Computers and peripheral equip-ment", "Instruments, Photocopy and related equipment"
37

The steady-state is the �xed point of the homogeneous non-linear systemof:
_k1k1= _u1
u1= _!1
!1= 0. The implied comparative statics of the social planner�s
equilibrium are summarized in the Table below28. As was the case withfully depreciating ICT capital stock, when the agents become more patient(when the time preference rate or the intertemporal elasticity of substitutiondecrease) the direction of change of the main variables of interest is the sameto the case that the productivity of the ICT producing sector increases.In particular, the real resources are driven into the ICT producing sectorenabling higher growth. On the other hand, an increased preference for thenon ICT using goods (i.e. increased non ICT using good expenditure share)will drive resources out of the ICT producing and using sector and into thenon ICT using sector, thus delivering lower growth. An increase in the capitalintensity implies the opposite e¤ects to the case of increased preference fornon ICT using good (in all variables apart from the ICT using consumptionto ICT production stock ratio). Finally, a higher depreciation rate of the ICTcapital assets corresponds again to more resources driven into ICT producingand using sector, and thus to higher growth.
k1 k0 u1 u0 uN !1 !0Baseline 0.043 0.073 0.240 0.400 0.360 0.042 0.240� " # # " # " # #� " # # # # " # #� " # " # " # # "� " " " " " # " "� " " " " " # " "� " " # " # " # #
One step further is to solve numerically for the policy functions. Then,the entire dynamics of the social planner�s economy may be �gured out, whenthe initial condition (initial "state-like" value) is speci�ed. The three �guresbelow give the policy functions of the "control-like" variables of the modeleconomy for a range of the "state-like" variable [k1(0); k�1] (where k1(0) =
k�12,
and k�1 is the steady-state value).
28The comparative statics exercise involves increasing the baseline parameter values by10%, ceteris paribus.
38

39

40

The recent empirical literature identi�es 1995 as being a threshold yearin the USA economic experience, after which economic growth accelerated.The cause is regarded to be an increase in the productivity of the ICT pro-ducing industries. Therefore, one may consider the USA economy beingalong a transition path towards its steady-state, along which it experienceda structural change.The data that are easier to follow and compare with the predictions of
the theoretical model, are those of the employment shares. In order to avoidaccounting for the second oil shock (1979) and its aftermath, Figure 1 ofAppendix D is repeated below for the years 1985-2001. As was pointed outbefore, the shares out of hours worked of every major sector, do look constantalong time.
41

In order to investigate possible changes in the evolution of the series, eachseries is presented separately in the three �gures below, together with a �ttedline trend before and after 1995. The share in the non ICT using sector ismonotonically falling with a downward jump in 1995. The opposite is thecase for the ICT using sector, but with more moderate changes along time.The picture is less clear for the ICT producing sector, yet there is an upwardjump in 1995.
42

In terms of the model economy, higher ICT producing productivity cor-responds to an increase in parameter �29. Given the policy functions de-rived above, a trajectory of the social planner�s economy that would beclose to that of the data, is that of an economy that starts moving towardsits steady-state starting from k1(0) < k�1, and experiences the high ICTproducing productivity in period T , when the "state-like" is k1(T ), wherek1(0) < k1(T ) < k�
01 < k�1. The resulting pattern in the employment shares
is given in the graph below:
29In order to get a value for the size of � for the pre-1995 period, the same procedurewas used as above (� is the mean of the series that comes from dividing annual outputgrowth of the ICT using sector with the employment share of the ICT producing sector).The estimated value is � = 0:731. The numerical results are for � = 0:7.
43

By construction, this graph illustrates the choices of the social plannerin the hypothetical setting outlined above. It is interesting to note how theactual data compare to the choices of the social planner, and what is theimplication for the ICT production growth rate. The social planner wouldallocate a great proportion of the human capital into R&D for any level ofproductivity in ICT production. He would react to the higher ICT producingproductivity by increasing the employment in the sector even more. This,interacted with the higher productivity implies an increase of the ICT pro-duction growth rate by 23.2 pp. On the contrary, the data imply only a2.7pp increase in the ICT production growth rate as a result of the enhancedproductivity of ICT production. Also, the data indicate that human capitalis increased in both the ICT producing and using sectors after 1995, whilethe aggregate volume of reallocations in the human capital market is of theorder of 1pp, compared to 1.7pp in the social planner�s economy.
u0 u1 uN gN
social planner 1985-1994;� = 0:700 40.8 24.9 34.3 24.01995-2001; � = 1:311 40.0 24.0 36.0 47.2
change -0.8 -0.9 1.7 23.2data 1985-1994; � = 0:700 70.8 25.4 3.8 2.8
1995-2001; � = 1:311 69.8 26.0 4.2 5.5change -1.0 0.6 0.4 2.7
8 Appendix C: Data Summary
ICT producing sector30:O¢ ce machinery (30), Insulated wire (313), Electronic valves and tubes (321),
Telecommunication equipment (322), Radio and television receivers (323), Com-puter and related activities (72), Scienti�c instruments (331)
ICT using sector:Other electrical machinery and apparatus nec (31-313), Other instruments (33-
331), Mechanical engineering (29), Wholesale trade and commission trade, exceptof motor vehicles and motorcycles (51), Financial intermediation, except insuranceand pension funding (65), Insurance and pension funding, except compulsory so-cial security (66), Activities auxiliary to �nancial intermediation (67), Renting ofmachinery and equipment (71), Research and development (73), Communications(64), Other business activities (50%(741-3+749))
non ICT using:30ISIC codes, Rev.3, in the parentheses.
44

Agriculture (01), Forestry (02), Fishing (05), Mining and quarrying (10-14),Food, drink & tobacco (15-16), Textiles (17), Clothing (18), Leather and footwear(19), Wood & products of wood and cork (20), Pulp, paper & paper products (21),Printing & publishing (22), Mineral oil re�ning, coke & nuclear fuel (23), Chemi-cals (24), Rubber & plastics (25), Non-metallic mineral products (26), Basic metals(27), Fabricated metal products (28), Motor vehicles (34), Building and repairingof ships and boats (351), Aircraft and spacecraft (353), Railroad equipment andtransport equipment nec (352+359), Furniture, miscellaneous manufacturing; re-cycling (36-37), Electricity, gas and water supply (40-41), Construction (45), Sale,maintenance and repair of motor vehicles and motorcycles; retail sale of automotivefuel (50), Retail trade, except of motor vehicles and motorcycles;repair of personaland household goods (52), Hotels & catering (55), Inland transport (60), Watertransport (61), Air transport (62), Supporting and auxiliary transport activities;activities of travel agencies (63), Real estate activities (70), Private householdswith employed persons (95), Other business activities (50%(741-3+749))
45

Table1
nonICTusing
ICTusing
ICTproducing
sharesofcommodities�use
MAN
SER
TOTAL
MAN
SER
TOTAL
MAN
SER
TOTAL
Intermediates
57.0
48.7
52.8
45.4
57.3
54.1
53.2
25.4
49.8
Consumption
25.4
48.8
37.2
8.6
8.6
30.7
10.0
20.6
11.3
FixedInvestment
17.7
2.5
10.0
46.0
46.0
15.1
36.8
54.0
38.9
Intermediates
69.2
49.9
58.7
84.0
59.7
63.8
84.1
55.2
81.5
Consumption
30.8
50.1
41.3
16.0
40.3
36.2
15.9
44.8
18.5
Source:BEA,Benchmark
InputOutputTable,1997.
46
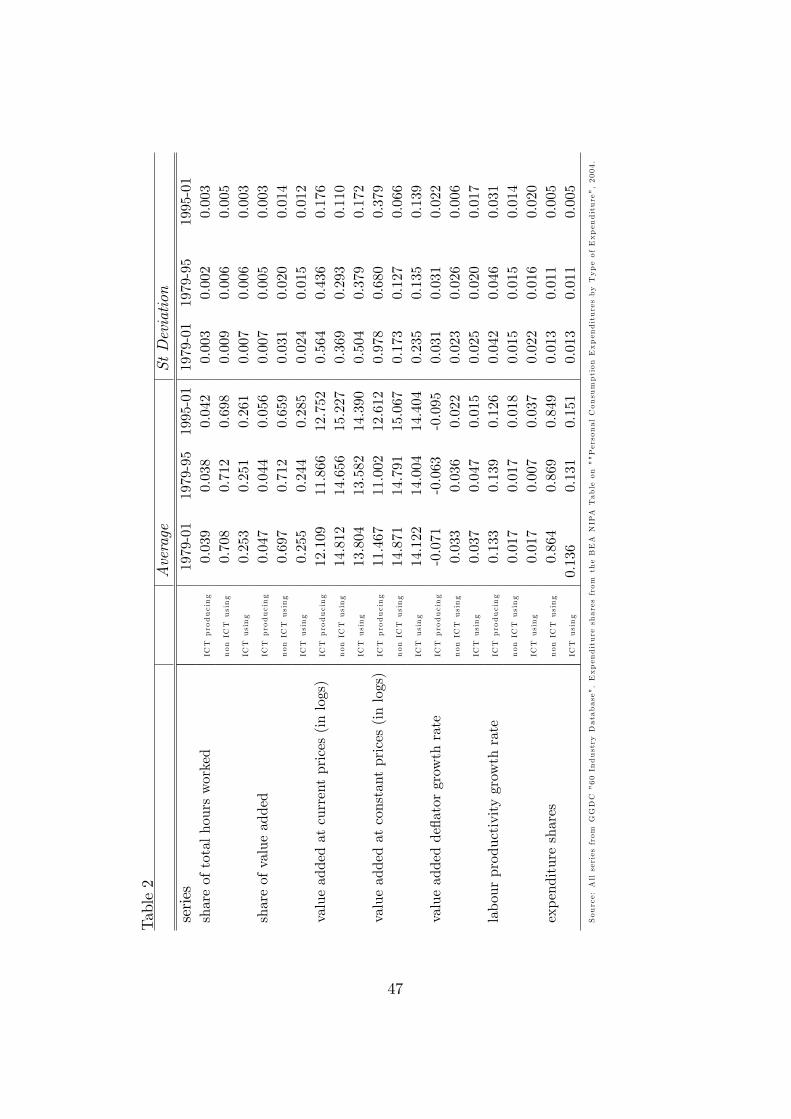
Table2
Average
StDeviation
series
1979-01
1979-95
1995-01
1979-01
1979-95
1995-01
shareoftotalhoursworked
ICTproducing
0.039
0.038
0.042
0.003
0.002
0.003
nonICTusing
0.708
0.712
0.698
0.009
0.006
0.005
ICTusing
0.253
0.251
0.261
0.007
0.006
0.003
shareofvalueadded
ICTproducing
0.047
0.044
0.056
0.007
0.005
0.003
nonICTusing
0.697
0.712
0.659
0.031
0.020
0.014
ICTusing
0.255
0.244
0.285
0.024
0.015
0.012
valueaddedatcurrentprices(inlogs)
ICTproducing
12.109
11.866
12.752
0.564
0.436
0.176
nonICTusing
14.812
14.656
15.227
0.369
0.293
0.110
ICTusing
13.804
13.582
14.390
0.504
0.379
0.172
valueaddedatconstantprices(inlogs)
ICTproducing
11.467
11.002
12.612
0.978
0.680
0.379
nonICTusing
14.871
14.791
15.067
0.173
0.127
0.066
ICTusing
14.122
14.004
14.404
0.235
0.135
0.139
valueaddedde�atorgrowthrate
ICTproducing
-0.071
-0.063
-0.095
0.031
0.031
0.022
nonICTusing
0.033
0.036
0.022
0.023
0.026
0.006
ICTusing
0.037
0.047
0.015
0.025
0.020
0.017
labourproductivitygrowthrate
ICTproducing
0.133
0.139
0.126
0.042
0.046
0.031
nonICTusing
0.017
0.017
0.018
0.015
0.015
0.014
ICTusing
0.017
0.007
0.037
0.022
0.016
0.020
expenditureshares
nonICTusing
0.864
0.869
0.849
0.013
0.011
0.005
ICTusing
0.136
0.131
0.151
0.013
0.011
0.005
Source:AllseriesfromGGDC"60Industry
Database".ExpendituresharesfromtheBEANIPATableon""PersonalConsumptionExpendituresbyTypeofExpenditure",2004.
47

9 Appendix D: Figures
Figure 1: Shares out of total hours worked
Figure 2: Shares out of total hours worked
48

Figure 3a: Value added at current prices (units in logs, millions of USA$)
Figure 3b: Growth rate in value added (current prices)
49

Figure 4a: Value added at constant prices (quantity index normalised to100 for 1995)
Figure 4b: Growth rate in value added (constant prices)
50

Figure 5: Quantity vs. price e¤ect (numeraire: non ICT using good)
51