cell biology bak/bax macropores facilitate mitochondrial...
TRANSCRIPT

RESEARCH ARTICLE SUMMARY◥
CELL BIOLOGY
BAK/BAX macropores facilitatemitochondrial herniation and mtDNAefflux during apoptosisKate McArthur,* Lachlan W. Whitehead, John M. Heddleston, Lucy Li,Benjamin S. Padman, Viola Oorschot, Niall D. Geoghegan, Stephane Chappaz,Sophia Davidson, Hui San Chin, Rachael M. Lane, Marija Dramicanin,Tahnee L. Saunders, Canny Sugiana, Romina Lessene, Laura D. Osellame,Teng-Leong Chew, Grant Dewson, Michael Lazarou, Georg Ramm, Guillaume Lessene,Michael T. Ryan, Kelly L. Rogers, Mark F. van Delft, Benjamin T. Kile*
INTRODUCTION:Therehas beenan explosionof interest in the role of cell death pathways anddamage-associatedmolecular pattern (DAMP)signaling in shaping inflammatory and immuneresponses. Mitochondria are central to the in-trinsic apoptosis pathway, the classical form ofprogrammed cell death. Severalmitochondrialconstituents have been implicated as DAMPs,includingmitochondrial DNA (mtDNA). Recentwork has shown that activation of intrinsic BAKandBAX–mediated apoptosis results inmtDNA-dependent triggering of the innate immunecGAS/STING pathway, resulting in type I inter-feron production by dying cells. The apoptoticcaspase cascade normally functions to suppressthis mtDNA-induced cGAS/STING signaling,rendering apoptosis “immunologically silent.”
RATIONALE: It is thought that during apop-tosis, mtDNA is released into the cytoplasm.In addition to apoptosis, loss of mtDNA fromthe matrix has been associated with condi-tions including HIV and dengue infection,calcium overload, irradiation, or inflammatorydiseases such as systemic lupus erythematosusor rheumatoid arthritis. However, mtDNA es-cape from themitochondria has not been docu-mented in real time.
RESULTS: Using a combination of live-celllattice light-sheet microscopy, 3D structuredillumination microscopy, correlative light elec-tron microscopy, and electron cryotomogra-phy, we found that after BAK/BAX activationand cytochrome c loss, the mitochondrial net-
work broke down and large BAK/BAX poresappeared in the outer membrane. These BAK/BAX macropores allowed the inner mem-brane an outlet through which it herniated,carrying with it mitochondrial matrix com-ponents, including the mitochondrial genome.A subset of the herniated inner membranes losttheir integrity, allowing mtDNA to be exposedto the cytoplasm.
CONCLUSION:An extensive literature suggeststhat mtDNA is found outside the mitochondria—and, indeed, outside the cell—in a wide rangeof circumstances. Our study provides a mech-anistic description of its release from themitochondria. mtDNA release from mitochon-dria during apoptosis occurs irrespective ofcaspase activity, but in normal cells, caspasesattenuate the subsequent cGAS/STING-mediated
interferon response bydriving rapid cellular col-lapse and clearance.Mito-chondrial herniationmightrepresent a general mech-anism of mtDNA escape.In addition to BAK and
BAX oligomerization, theremay be alternativetriggers—for example, other pore-forming pro-teins (host- or pathogen-derived) ormitochon-drial stresses—that lead to the occurrence ofthis phenomenon.▪
RESEARCH
McArthur et al., Science 359, 883 (2018) 23 February 2018 1 of 1
The list of author affiliations is available in the full article online.*Corresponding author. Email: [email protected](K.M.); [email protected] (B.T.K.)Cite this article as K. McArthur et al., Science 359, eaao6047(2018). DOI: 10.1126/science.aao6047
Schematic of apoptotic mitochondrial herniation. Inset images show the key stages as captured by lattice light-sheet microscopy, structuredillumination microscopy, and correlative light and electron microscopy.
ON OUR WEBSITE◥
Read the full articleat http://dx.doi.org/10.1126/science.aao6047..................................................
on March 14, 2019
http://science.sciencem
ag.org/D
ownloaded from

RESEARCH ARTICLE◥
CELL BIOLOGY
BAK/BAX macropores facilitatemitochondrial herniation and mtDNAefflux during apoptosisKate McArthur,1,2,3* Lachlan W. Whitehead,1,2 John M. Heddleston,4 Lucy Li,1
Benjamin S. Padman,5 Viola Oorschot,6 Niall D. Geoghegan,1,2 Stephane Chappaz,1,2,3
Sophia Davidson,1 Hui San Chin,1 Rachael M. Lane,3 Marija Dramicanin,1,2
Tahnee L. Saunders,3 Canny Sugiana,3 Romina Lessene,1,2 Laura D. Osellame,5
Teng-Leong Chew,4 Grant Dewson,1,2 Michael Lazarou,5 Georg Ramm,5,6
Guillaume Lessene,1,2,7 Michael T. Ryan,5 Kelly L. Rogers,1,2
Mark F. van Delft,1,2 Benjamin T. Kile1,2,3*
Mitochondrial apoptosis is mediated by BAK and BAX, two proteins that induce mitochondrialouter membrane permeabilization, leading to cytochrome c release and activation of apoptoticcaspases. In the absence of active caspases, mitochondrial DNA (mtDNA) triggers the innateimmune cGAS/STING pathway, causing dying cells to secrete type I interferon. HowcGASgainsaccess to mtDNA remains unclear.We used live-cell lattice light-sheet microscopy to examinethe mitochondrial network in mouse embryonic fibroblasts.We found that after BAK/BAXactivation and cytochrome c loss, the mitochondrial network broke down and large BAK/BAXpores appeared in the outer membrane.These BAK/BAX macropores allowed the innermitochondrial membrane to herniate into the cytosol, carrying with it mitochondrial matrixcomponents, including the mitochondrial genome. Apoptotic caspases did not preventherniation but dismantled the dying cell to suppress mtDNA-induced innate immune signaling.
The mitochondrial, or intrinsic, apoptosispathway is governed by the interplay amongmembers of the BCL-2 family of proteins,which mediate mitochondrial integrity (1, 2).At steady state, pro-survival BCL-2 members
(e.g., MCL-1 and BCL-XL) restrain the activity ofpro-death BAK and BAX. In response to develop-mental cues and stress signals, pro-survival ac-tivity is overwhelmed, permitting BAK and BAXactivation. BAK andBAX oligomerize in themito-chondrial outer membrane, causing its perme-abilization and the release of apoptogenic factors,of which the best characterized is cytochrome c(3, 4). Cytoplasmic cytochrome c forms part ofthe apoptosome complex, which successivelyactivates caspase-9 and the apoptotic effectorcaspases, caspase-3 and caspase-7. Together,these proteases efficiently cleave a multitude of
substrates within the cell to accelerate its de-mise (5).Apoptosis, unlike other forms of cell death
such as necroptosis or pyroptosis, is generallythought to be an immunologically silent pro-cess, thereby providing a mechanism for cellclearance and tissue homeostasis that does notprovoke a potentially damaging inflammatoryor immune response. Immunological silence re-quires a functional apoptotic caspase cascade(6, 7). Genetic ablation or pharmacological inhi-bition of the caspase cascade during BAK/BAX-mediated apoptosis results in the production ofthe potent antiviral cytokine interferon-b (IFN-b).This is the result of mitochondrial DNA (mtDNA)triggering the activation of the cGAS/STING(cyclic guanosine monophosphate/adenosinemonophosphate synthase/stimulator of inter-feron genes) signaling pathway, a cytosolic com-ponent of the cell’s innate immune systemdesigned to detect pathogen-derived DNA. Inthe absence of active caspases, mtDNA is recog-nized as a damage-associated molecular pattern(DAMP), and the dying cell behaves as if it werevirally infected.How cGAS gains access to the mitochondrial
genome during apoptosis remains unknown, butthe fact that mtDNA is enriched in cGAS immu-noprecipitates from cells undergoing caspase-inhibited apoptosis suggests that the two dointeract (6). The simplest explanation is thatmtDNA is released into the cytoplasm. Multiple
studies have found evidence of mtDNA releasefrom damaged mitochondria. mtDNA fragmentsare seen in the cytoplasmic fractions of cellsinduced to undergo death by calcium overloador irradiation, which has been ascribed to open-ing of the so-called mitochondrial permeabilitytransition pore (MPTP) (8, 9). Cytosolic mtDNAfragments are also found in cells experiencingmitochondrial stress (10) or inflammasome ac-tivation (11); however, the mechanism of mtDNArelease in these settings is not clear. It has beenpostulated that apoptosis is a key upstream re-quirement, because overexpression of BCL-2 at-tenuated downstream mtDNA-induced NLRP3activation (11). Despite this finding and thosein the earlier reports (6, 7), the notion that BAKand BAX might directly mediate mtDNA effluxremains controversial (12). Furthermore, althoughit is generally accepted that mtDNA would ac-tivate DNA sensors upon its release into thecytoplasm, mtDNA release itself has not beendemonstrated in real time (13).
mtDNA is released fromapoptotic mitochondria
To establish whether mtDNA is released intothe cytosol during intrinsic apoptosis, we im-aged immortalized mouse embryonic fibroblasts(MEFs) with live-cell lattice light-sheet micros-copy (LLSM) (14). Wild-type MEFs are dependenton the pro-survival proteins MCL-1 and BCL-XL
for survival. MEFs lacking MCL-1 undergo BAK/BAX-dependent apoptosis in response to theBH3 mimetic drug ABT-737, a potent inhibitorof BCL-XL and BCL-2 (15, 16) (Fig. 1A). To visu-alize mitochondria, we stably transduced Mcl1–/–
MEFs with a vector encoding the mitochondrialouter-membrane protein TOMM20 bearing aHaloTag (TOMM20-Halo), which fluoresces uponaddition of the cell-permeant HaloTag-specificdye JaneliaFluor-646 (17). mtDNA was detectedby coexpression of the mtDNA-binding proteinTFAM (transcription factor A, mitochondrial),which was tagged with the green fluorescentprotein (GFP) variant mNeonGreen (18) (Fig.1B). At steady state, mitochondria formed anelaborate network, throughout which individ-ual mtDNA nucleoids were evenly distributed(Fig. 1C). Upon addition of ABT-737, this net-work underwent an almost immediate disso-lution, breaking down within several minutes ofthe onset of apoptosis (Fig. 1D). Coincident withthis process, TFAM-positive nucleoids coalescedwithin mitochondria. As mitochondria condensedinto discrete globular structures, we observednucleoids being released into the cytoplasm(Movie 1). This phenomenon was remarkablyconsistent in its form and kinetics. Moreover, itoccurred in both the presence and absence ofthe pan-caspase inhibitor QVD-OPh (19). Whenapoptotic cells were co-incubated with QVD-OPh, they remained attached to the coverslip,allowing continuous imaging for up to 1 hour.In contrast, without caspase inhibition, cells rap-idly contracted and detached from the coverslipimmediately after nucleoid release (Fig. 1E andMovie 2).
RESEARCH
McArthur et al., Science 359, eaao6047 (2018) 23 February 2018 1 of 12
1Walter and Eliza Hall Institute of Medical Research, Parkville,Victoria, Australia. 2Department of Medical Biology, Universityof Melbourne, Parkville, Victoria, Australia. 3Anatomy andDevelopmental Biology, Monash Biomedicine DiscoveryInstitute, Monash University, Melbourne, Victoria, Australia.4Advanced Imaging Center, Howard Hughes Medical Institute,Janelia Research Campus, Ashburn, VA, USA. 5Biochemistryand Molecular Biology, Monash Biomedicine DiscoveryInstitute, Monash University, Melbourne, Victoria, Australia.6Monash Ramaciotti Centre for Cryo Electron Microscopy,Monash University, Melbourne, Victoria, Australia. 7Departmentof Pharmacology and Therapeutics, University of Melbourne,Parkville, Victoria, Australia.*Corresponding author. Email: [email protected](K.M.); [email protected] (B.T.K.)
on March 14, 2019
http://science.sciencem
ag.org/D
ownloaded from

McArthur et al., Science 359, eaao6047 (2018) 23 February 2018 2 of 12
Fig. 1. mtDNA is released from apoptotic mitochondria. (A) Apoptoticinterferon production pathway. APAF1, apoptotic protease activating factor 1;TBK1, TANK binding kinase 1; IRF3, interferon regulatory factor 3.(B) Fluorescent fusion proteins used to visualize mitochondria (TOMM20-Halo)and mtDNA (TFAM-mNeonGreen). TM, transmembrane domain; MLS,mitochondrial localization sequence; DBD1 and DBD2, DNA binding domain–1 and –2. (C) Typical staining of mitochondrial network in Mcl1–/– MEFs atsteady state, as imaged by LLSM, showing mitochondria (red,TOMM20-Halo)and mtDNA (green, TFAM-mNeonGreen). (D) Still snapshots of nucleoidefflux before and 20 min after ABT-737 (500 nM) + QVD-OPh (20 mM)treatment, as imaged by LLSM (see Movie 1). (E) Snapshots from LLSM of
Mcl1–/– MEFs undergoing apoptosis with active caspase cascades; elapsedtime after ABT-737 (500 nM) treatment is indicated (see Movie 2). The cell isoutlined by a dashed white line. Blue arrows highlight nucleoid externalizationevents. (F) Multiple examples [(i) to (iv)] of single mitochondria undergoingnucleoid efflux from LLSM movies in (D), displayed using 3D surfacereconstructions overlaid upon original data with Imaris software. (For 3Dsurface reconstructions of the full time lapse, see Movie 3.) (G) 3D-SIMimaging of nucleoid externalization under the same conditions as (D) (seeMovie 4). Insets show mitochondria during nucleoid efflux. Scale bars, 5 mm[(C) to (E)], 2 mm (G). Data in (D), (E), and (G) are representative of atleast three independent experiments.
RESEARCH | RESEARCH ARTICLEon M
arch 14, 2019
http://science.sciencemag.org/
Dow
nloaded from

Three-dimensional (3D) surface reconstruc-tion revealed that nucleoid release occurredfrom a single site on mitochondrial fragments.TFAM-positive nucleoids formed barbell-shapedstructures during the release process, suggest-ing physical constriction at the mitochondrialsurface (Fig. 1F and Movie 3). Intriguingly, nucle-oids remained in close proximity to the mitochon-dria from which they had exited. These patternsof constriction through single exit points wereconfirmed in more detail by live 3D structuredillumination microscopy (3D-SIM), which clear-ly demonstrated nucleoid release frommitochon-
dria with a “cup-like” appearance (Fig. 1G andMovie 4). Similar results were obtained in hu-man HeLa cells incubated with a combinationof ABT-737 and the MCL-1 inhibitor S63845 (20)(fig. S1A), or in MEFs when mtDNA was visu-alized with the DNA dye PicoGreen (21) (fig. S1B).Given the propensity of the latter to photobleach,we focused on the TFAM mtDNA reporter sys-tem for further investigation.
Cytochrome c loss precedesmtDNA efflux
To understand the temporal relationship be-tween mtDNA release and other events duringmitochondrial apoptosis, we used LLSM to im-age MEFs coexpressing TOMM20-Halo, TFAM-Tomato, and cytochrome c–GFP (Fig. 2A andMovie 5). Upon treatment with ABT-737 andQVD-OPh, cytochrome c loss from mitochondriawas clearly evident. Consistent with previous re-ports (22–26), it occurred rapidly in a wave-likefashion across the mitochondrial network, overa period of 30 to 90 s. Cytochrome c efflux pre-ceded mitochondrial network dissolution andsubsequent mtDNA release, the kinetics of whichwere quantified using custom automated FIJI
(27) scripts (Fig. 2, B to D, and fig. S2, A andB). This combination of visual and quantitativeanalysis clearly identified BAK/BAX-mediatedcytochrome c release as the first event, with mito-chondrial morphological rearrangement andmtDNA efflux occurring consecutively there-after. The relative timing of each event was re-markably consistent between individual cellsand across independent experiments (Fig. 2E).To further confirm that loss of cytochrome cprecedes nucleoid release, we conducted a ki-netic analysis in which cells were treated, frac-tionated, and immunoblotted to observe thetiming of cytochrome c and TFAM appearancein the cytosol of apoptotic cells. Full release ofcytochrome c was observed as early as 0.5 to1 hour (Fig. 2F). TFAM was detected in the cy-tosol after 4 and 6 hours [as was another matrixcomponent, dihydrolipoamide dehydrogenase(DLD)]—time points at which IFN-b was presentin supernatants (Fig. 2G).
Mitochondrial dynamics andmtDNA release
To maintain a healthy network, mitochondriacontinuously undergo fission and fusion (28–31).
McArthur et al., Science 359, eaao6047 (2018) 23 February 2018 3 of 12
Movie 5. Lattice light-sheet imaging ofmitochondria (red, TOMM20-Halo), mtDNA(green, TFAM-mNeonGreen), and cytochrome c(blue) from Mcl1–/– MEFs undergoing apoptosisinduced by ABT-737 and QVD-OPh. Images werecaptured at a rate of one 3D volume every 13 s.
Movie 1. Lattice light-sheet imaging ofmitochondria (red, TOMM20-Halo) and mtDNA(green, TFAM-mNeonGreen) from Mcl1–/– MEFsundergoing apoptosis induced by ABT-737 andQVD-OPh. Images were captured at a rate ofone 3D volume every 8 s.
Movie 2. Lattice light-sheet imaging ofmitochondria (red, TOMM20-Halo) and mtDNA(green, TFAM-mNeonGreen) from Mcl1–/– MEFsundergoing apoptosis with active caspasesinduced by ABT-737 treatment alone. Images werecaptured at a rate of one 3D volume every 8 s.
Movie 4. 3D SIM imaging of mitochondria (red,TOMM20-Halo) and mtDNA (green, TFAM-mNeonGreen) from Mcl1–/– MEFs undergoingapoptosis induced by ABT-737 and QVD-OPh.Images were captured at a rate of one 3Dvolume every 60 s.
Movie 3. 3D surface reconstruction generation(red, mitochondria; green, mtDNA nucleoids)using Imaris software, which highlights mtDNArelease events in Movie 1.
Movie 6. Lattice light-sheet imaging ofmitochondria (red, TOMM20-Halo) and mtDNA(green, TFAM-mNeonGreen) from DRP1-deficientMEFs undergoing apoptosis induced by ABT-737and QVD-OPh. Left: Mcl1CRISPR–/–Drp1–/– MEFsderived from Drp1 knockout mice. Right: Mcl1–/–
Drp1CRISPR–/– MEFs generated by CRISPR/Cas9targeting of Drp1. Images were captured at arate of one 3D volume every 13 s.
RESEARCH | RESEARCH ARTICLEon M
arch 14, 2019
http://science.sciencemag.org/
Dow
nloaded from

In mammals, the former is mediated by dynamin-related protein–1 (DRP1) (32, 33), the latter byoptic atrophy protein–1 (OPA1) and mitofusin-1and -2 (MFN1 and MFN2) (34, 35). Mitochon-drial fragmentation during apoptosis has beenwidely documented (36–39), and a large bodyof evidence suggests that the response to var-ious apoptotic stimuli is altered when fission orfusion are inhibited (40–43) [reviewed in (44)].However, the precise requirement for fission(in particular) in mitochondrial apoptosis andits temporal relationship to cytochrome c releaseremains controversial (45–47).To establish whether fission and/or fusion
facilitate apoptotic mtDNA release, we generatedDrp1–/– Mcl1–/–, Opa1–/– Mcl1–/–, and Mfn1–/–
Mfn2–/– Mcl1–/– MEFs and imaged these cellsby LLSM. Consistent with their established rolein fusion (48–50), loss of either OPA1 or MFN1/
MFN2 resulted in hyperfragmented mitochon-dria at steady state (fig. S3A). Opa1–/– Mcl1–/–
and Mfn1–/– Mfn2–/– Mcl1–/– cells exhibited amodest increase in sensitivity to ABT-737, read-ily undergoing cytochrome c release and nucle-oid efflux in response to ABT-737 (Fig. 3, A to D,and fig. S3, B to D). In contrast, and as previouslyreported (51, 52), fission-deficient Drp1–/– cellsat steady state exhibited a hyperfused mitochon-drial network (fig. S3A). The behavior of thisnetwork, upon induction of BAK/BAX-mediatedapoptosis, was cell line–dependent. In MEFs de-rived from knockout mice, marked mitochon-drial rearrangement was observed, but it wasincomplete, with mitochondria exhibiting a “beads-on-a-string” appearance and only a limited num-ber releasing mtDNA (Fig. 3, E and F, fig. S3F,and Movie 6). Strikingly, mtDNA release wasobserved only from discrete globular mitochon-
dria, of which there were fewer in the absenceof DRP1. In contrast, when we induced apopto-sis in independently derived CRISPR/Cas9 Drp1–targeted MEF subclones (deletion confirmedby imaging and immunoblot; fig. S3H), mito-chondrial network breakdown was equivalent tothat seen in wild-type counterparts (Fig. 3E andMovie 6). However, regardless of the disparitiesin mitochondrial dynamics, in all DRP1-deficientlines tested, we observed robust cGAS-dependentIFN-b secretion during caspase-inhibited apopto-sis (fig. S3, E and G). Thus, loss of DRP1 does notprevent mtDNA-induced DAMP signaling.
mtDNA is released through BAK/BAX foci
We thus revisited the proposed involvement ofthe MPTP in facilitating this process (8). Theexact nature and composition of the MPTP re-mains controversial; currently, it is defined by the
McArthur et al., Science 359, eaao6047 (2018) 23 February 2018 4 of 12
Fig. 2. Cytochrome c loss precedes mtDNA efflux. (A) Snapshots fromLLSM imaging of Mcl1–/– MEFs expressing TOMM20-Halo (stained withJF-646) (red), TFAM-tdTomato (green), and cytochrome c-GFP (blue), withcytochrome c loss and externalized nucleoids apparent 520 s and 780 s,respectively, after ABT-737 (500 nM) + QVD-OPh (20 mM) treatment (seeMovie 5). Scale bars, 5 mm. (B to D) Kinetic quantitation of LLSM imaging in(A), representative of three independent experiments, depicting the relativetiming between mitochondrial fragmentation and cytochrome c loss (B),mitochondrial fragmentation and nucleoid externalization (C), and cyto-chrome c loss and nucleoid externalization (D). Dashed vertical linesindicate the time at which each event begins, as determined visually fromtime-lapse movies. Parameters used to quantitate events are mitochondrialsphericity (reflective of morphology changes; values range between 0 = linear
and 1 = sphere), area of cytochrome c signal inside mitochondria (pixels)relative to mitochondrial area (pixels) (reflective of cytochrome c loss tothe cytoplasm), and number of mtDNA nucleoids outside mitochondria.(E) Graphical representation of relative timing between the initiation of eachevent (cytochrome c loss, mitochondrial fragmentation, and externalizednucleoids) across three separate imaging experiments. Data are means ± SEM.(F) Western blots of cytosolic (left) and membrane (right) fractions ofMcl1–/– MEFs pretreated with QVD-OPh (50 mM) followed by ABT-737 (1 mM)at the indicated times. DLD, dihydrolipoamide dehydrogenase (matrixprotein); VDAC1, voltage-dependent anion-selective channel 1 (OMM protein).(G) IFN-b in culture supernatants from Mcl1–/– MEFs in (F) collectedimmediately before fractionation. Blots and data in (F) and (G) are repre-sentative of two or three independent experiments. N.D, not detected.
RESEARCH | RESEARCH ARTICLEon M
arch 14, 2019
http://science.sciencemag.org/
Dow
nloaded from

ability of the drug cyclosporin A (CsA) to blockits opening (53, 54). When we pretreated MEFswith CsA and then induced apoptosis, we sawidentical patterns and amounts of nucleoid efflux(fig. S4, A and B). This indicated that apoptoticmtDNA efflux does not require MPTP opening. Toassess mitochondrial membrane potential duringherniation, we stained cells with the membranepotential dye TMRM and imaged them via LLSM.When treated with ABT-737 and QVD-OPh, allmitochondria rapidly lost TMRM staining (fig.S2, C and D). This occurred before mitochondrialmorphology rearrangement and mtDNA release.In contrast, treatment of cells with the uncou-pling agents actinomycin A and oligomycin A(A/O) triggered a drastic loss of TMRM stainingbut did not lead to mitochondrial morphologychanges or mtDNA release (fig. S2, C and D).Accordingly, A/O treatment did not induce IFN-bproduction fromMEFs (fig. S2E). Thus, althoughmitochondria lose membrane potential duringcaspase-inhibited apoptosis, loss of potential initself does not trigger mtDNA release. We there-fore considered the possibility that BAK and BAXdirectly facilitate this process.It is well established that activation of BAK and
BAX leads to their oligomerization in the outermitochondrial membrane (OMM) and its subse-quent permeabilization (40, 55–58).However, theyare not thought to rupture the inner mitochon-drial membrane (IMM) (59). We thus examinedthe localization of BAK and BAX during mtDNArelease. LLSM imaging of Bak–/– Bax–/–Mcl1–/–
MEFs reconstitutedwith a tagged variant of BAK(BAK-mRuby2), in addition toTOMM20-Halo andTFAM-mNeonGreen, revealeduniformBAKstain-ing across the mitochondria. Upon induction ofapoptosis, BAK became concentrated in brightfoci in the OMM (Fig. 4A). In cells reconstitutedwith a tagged variant of BAX (BAX-mRuby2), BAXstainingwas ubiquitous at steady state, consistentwith its reported cytoplasmic location. In responseto ABT-737, BAXwas very clearly recruited to, andalso formed bright foci in, fragmented mitochon-dria (Fig. 4B and Movie 7). In both cases, theselarge aggregates of BAK or BAX—which weresimilar in scale and topology to those previouslydescribed using stimulated emission depletionmicroscopy or single-molecule localization mi-croscopy (60, 61)—appeared 4 to 8 min after cy-tochrome c loss (Fig. 4C, top), concurrent withmitochondrial morphology changes and nucle-oid release (Fig. 4D, middle and bottom). Giventhat cytochrome c release precedes fragmenta-tion andmtDNA efflux (Fig. 2), this suggests thatcytochrome cmust exit from BAK or BAX porestoo small to be resolved by LLSM. This idea isconsistentwith amodel (62) whereby only a smallamount of BAX is required for mitochondrialoutermembrane permeabilization (MOMP) andthemajority is recruited after cytochrome c releasehas taken place. mtDNA release was observedonly after large BAK/BAX foci had appeared, andthese BAK/BAX foci were present at the samelocation from which mtDNA was released (Fig. 4,A and B, white arrows). 3D visualization clearlyshowed BAK and BAX encircling the point of
McArthur et al., Science 359, eaao6047 (2018) 23 February 2018 5 of 12
Fig. 3. Breakdown of mitochondrial network and mtDNA release during apoptosis does notrequire DRP1 or the mitochondrial fusion machinery. (A and B) Apoptotic mtDNA release fromfusion-deficient Mcl1–/– Opa1–/– MEFs (A) and Mcl1–/– Mfn1–/– Mfn2–/– MEFs (B) 30 min afterABT-737 (500 nM) + QVD-OPh (20 mM) treatment, as imaged by LLSM. (C and D) Kinetic quantitationof (A) and (B), respectively. (E) Two examples of mitochondrial fragmentation during apoptosis inMCL1/DRP1-deficient MEFs 20 min after ABT-737 (1 mM) + QVD-OPh (20 mM) treatment, asimaged by LLSM. Top: Mcl1CRISPR–/–Drp1–/– MEFs derived from Drp1 knockout mice. Bottom: Mcl1–/–
Drp1CRISPR–/– MEFs generated by CRISPR/Cas9 targeting of Drp1. mtDNA release events arehighlighted by white arrows (see Movie 6). Scale bars in (A), (B), and (E), 5 mm. (F) Kineticquantitation of apoptotic mtDNA release from fission-deficient Mcl1–/–DRP1–/– MEFs, showingthe relative timing of mitochondrial fragmentation, cytochrome c loss, and nucleoid externalization.All images and graphs are representative of three independent experiments.
RESEARCH | RESEARCH ARTICLEon M
arch 14, 2019
http://science.sciencemag.org/
Dow
nloaded from
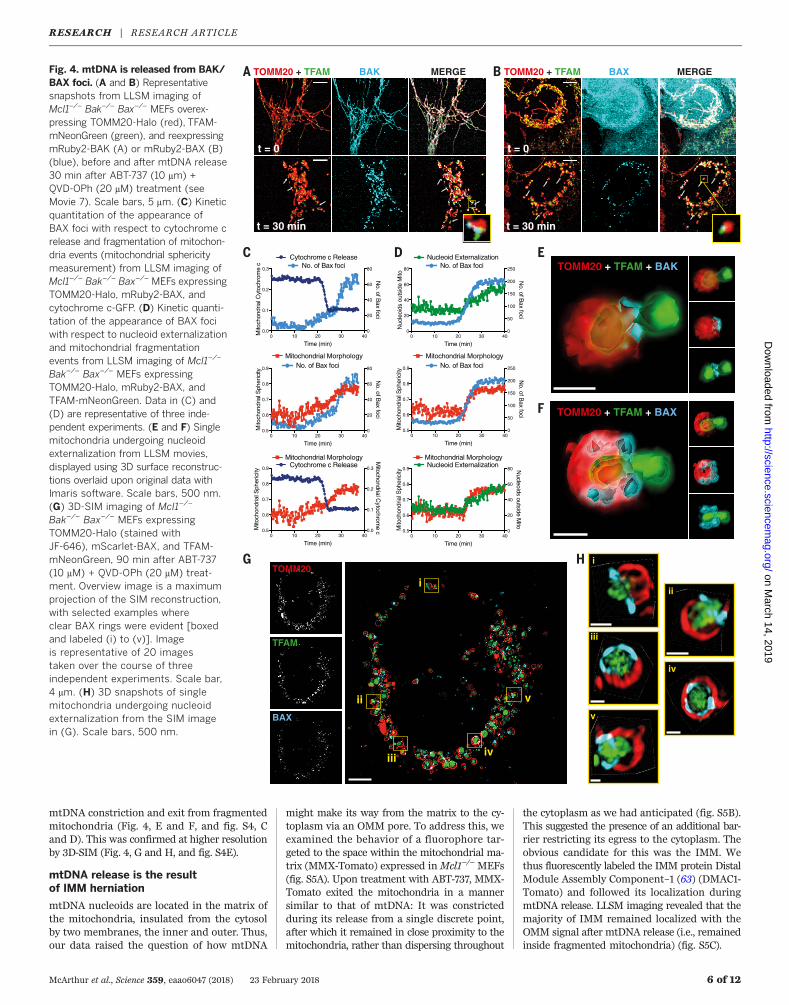
mtDNA constriction and exit from fragmentedmitochondria (Fig. 4, E and F, and fig. S4, Cand D). This was confirmed at higher resolutionby 3D-SIM (Fig. 4, G and H, and fig. S4E).
mtDNA release is the resultof IMM herniation
mtDNA nucleoids are located in the matrix ofthe mitochondria, insulated from the cytosolby two membranes, the inner and outer. Thus,our data raised the question of how mtDNA
might make its way from the matrix to the cy-toplasm via an OMM pore. To address this, weexamined the behavior of a fluorophore tar-geted to the space within the mitochondrial ma-trix (MMX-Tomato) expressed inMcl1–/– MEFs(fig. S5A). Upon treatment with ABT-737, MMX-Tomato exited the mitochondria in a mannersimilar to that of mtDNA: It was constrictedduring its release from a single discrete point,after which it remained in close proximity to themitochondria, rather than dispersing throughout
the cytoplasm as we had anticipated (fig. S5B).This suggested the presence of an additional bar-rier restricting its egress to the cytoplasm. Theobvious candidate for this was the IMM. Wethus fluorescently labeled the IMM protein DistalModule Assembly Component–1 (63) (DMAC1-Tomato) and followed its localization duringmtDNA release. LLSM imaging revealed that themajority of IMM remained localized with theOMM signal after mtDNA release (i.e., remainedinside fragmented mitochondria) (fig. S5C).
McArthur et al., Science 359, eaao6047 (2018) 23 February 2018 6 of 12
Fig. 4. mtDNA is released from BAK/BAX foci. (A and B) Representativesnapshots from LLSM imaging ofMcl1–/– Bak–/– Bax–/– MEFs overex-pressing TOMM20-Halo (red), TFAM-mNeonGreen (green), and reexpressingmRuby2-BAK (A) or mRuby2-BAX (B)(blue), before and after mtDNA release30 min after ABT-737 (10 mm) +QVD-OPh (20 mM) treatment (seeMovie 7). Scale bars, 5 mm. (C) Kineticquantitation of the appearance ofBAX foci with respect to cytochrome crelease and fragmentation of mitochon-dria events (mitochondrial sphericitymeasurement) from LLSM imaging ofMcl1–/– Bak–/– Bax–/– MEFs expressingTOMM20-Halo, mRuby2-BAX, andcytochrome c-GFP. (D) Kinetic quanti-tation of the appearance of BAX fociwith respect to nucleoid externalizationand mitochondrial fragmentationevents from LLSM imaging of Mcl1–/–
Bak–/– Bax–/– MEFs expressingTOMM20-Halo, mRuby2-BAX, andTFAM-mNeonGreen. Data in (C) and(D) are representative of three inde-pendent experiments. (E and F) Singlemitochondria undergoing nucleoidexternalization from LLSM movies,displayed using 3D surface reconstruc-tions overlaid upon original data withImaris software. Scale bars, 500 nm.(G) 3D-SIM imaging of Mcl1–/–
Bak–/– Bax–/– MEFs expressingTOMM20-Halo (stained withJF-646), mScarlet-BAX, and TFAM-mNeonGreen, 90 min after ABT-737(10 mM) + QVD-OPh (20 mM) treat-ment. Overview image is a maximumprojection of the SIM reconstruction,with selected examples whereclear BAX rings were evident [boxedand labeled (i) to (v)]. Imageis representative of 20 imagestaken over the course of threeindependent experiments. Scale bar,4 mm. (H) 3D snapshots of singlemitochondria undergoing nucleoidexternalization from the SIM imagein (G). Scale bars, 500 nm.
RESEARCH | RESEARCH ARTICLEon M
arch 14, 2019
http://science.sciencemag.org/
Dow
nloaded from

Given that the resolution of LLSM is diffraction-limited (14), we again used higher-resolutionlive 3D-SIM and imaged cells expressing DMAC1-Tomato and TOMM20-Halo [stained with JF-546(17)] to visualize both mitochondrial membranes.These studies revealed ultrathin DMAC1-containing“blisters” encapsulating mtDNA external to theOMM (Fig. 5, A and B). This suggested that theIMM herniates through macropores formed byBAK and BAX. To examine this in more detail,we conducted immunogold transmission electronmicroscopy (TEM) and electron cryotomography(ECT) studies of ABT-737–treated Mcl1–/– MEFs.For TEM, mtDNA was visualized by the expres-sion of GFP-tagged TFAM and immunogold la-
beling via an antibody to GFP. The TEM imagesrevealed multiple instances where the OMM hadpeeled away from the IMM (Fig. 5C, ii), andothers where the OMM clearly terminated whilethe IMM continued, ballooning out and encap-sulating the mtDNA-TFAM signal (Fig. 5C, iiiand iv). ECT confirmed the mitochondrial her-niation event (Fig. 5, D and E). The advantagesof ECT are enhanced resolution, elimination ofany potential for sectioning artifacts, and 3D vi-sualization (Movie 8). Thus, these data indicatethat as a consequence of BAK/BAX OMM perme-abilization, mitochondria fragment and largerBAK/BAX foci assemble. The formation of theseBAK/BAX macropores elicits IMM herniation.
Immunoprecipitation of cGAS from apoptoticcells enriches for mtDNA (6). In considering themechanism by which this interaction occurs, wewondered whether cGAS might localize to her-niated mitochondria, potentially translocatingacross the IMM. To establish whether cGAS lo-calizes to mitochondrial hernias, we initially con-ducted LLSM studies of Mcl-1–/– cGASCRISPR–/–
MEFs reconstituted with cGAS-GFP. At steadystate, cGAS staining was diffuse throughout thecytoplasm. We added ABT-737 and imaged for1 hour. Mitochondrial network breakdown andherniation occurred, but no change in cGAS lo-calization was observed. To establish whethercGAS might localize to hernias at later time
McArthur et al., Science 359, eaao6047 (2018) 23 February 2018 7 of 12
Fig. 5. mtDNA release occursvia inner mitochondrial mem-brane herniation. (A andB) 3D-SIM imaging of Mcl1–/–
MEFs expressing TOMM20-Halo (stained with JF-546) andTFAM-mNeonGreen, withadditional DMAC1-Tomato[(i) and (ii)], representative ofthree independent experi-ments. For ease of compari-son, 3D-SIM images fromFig. 1G (where only the OMMand mtDNA were stained)are included in (B). Joint IMMand OMM staining [(i), orred in (ii)] shows thin mem-brane (yellow arrows) encap-sulating mtDNA [TFAM, green,(ii)] that is not present whenOMM is stained alone [com-pare with (iii) and (iv)].Scale bars, 2 mm. (C) Electronmicroscopy imaging of un-treated (i) or apoptoticmitochondria [(ii), (iii), and(iv)] immunogold-labeled foranti–GFP-TFAM to visualizelocation of mtDNA (blackspots). Insets are annotatedwith arrows to mark areaswhere IMM (orange) andOMM (red) are clearly showntogether [(i), untreated],peeling away from oneanother (ii), or during hernia-tion where OMM clearly stops[(iii) and (iv)]. Scale bars,100 nm (main images), 50 nm(insets). (D and E) ECTimages of apoptoticmitochondria 90 min afterABT-737 (1 mM) + QVD-OPh(20 mM) treatment. Tomo-graphic 10-nm slicesare shown; arrows markareas where OMM (red)clearly stops whileIMM (orange) continues.Scale bars, 250 nm.See also Movie 8.
RESEARCH | RESEARCH ARTICLEon M
arch 14, 2019
http://science.sciencemag.org/
Dow
nloaded from

points, we conducted a 6-hour time course andimaged cells by confocal microscopy. At 4 and6 hours after the induction of apoptosis, despitethe presence of IFN-b in supernatants (indica-tive of cGAS activation), no discernible changein the pattern of cGAS staining was apparent(fig. S6, A and B).Given that cGAS did not appear within intact
hernias or accumulate at their surface, we pos-tulated that a loss of IMM integrity might facil-itate mtDNA access to cGAS or vice versa. We
used correlative light and electron microscopy(CLEM) to enable the overlay of fluorescent sig-nals and mitochondrial ultrastructure. Mcl1–/–
MEFs expressing TOMM20-Halo and TFAM-mNeonGreen were fixed 90 min after ABT-737and QVD-OPh treatment, a time at which themajority of mitochondria had undergone herni-ation. These cells were subjected to confocal andelectron microscopy, and the two images werecorrelated after acquisition (Fig. 6, A and B, andfig. S6D). Consistent with our immunogold TEM
and ECT studies (Fig. 5, C to E, and fig. S6C), weobserved many instances where the OMM haddissipated, with TFAM staining aligning to theIMM-bound structures (Fig. 6C). CLEM revealedinstances where IMM integrity had been lost(Fig. 6, D and E, black arrows), although this wasin a minority of mitochondrial hernias. The factthat this was in the minority of mitochondriais in line with the limited translocation of TFAMto the cytosolic fraction of apoptotic cells that wehad observed by immunoblot (Fig. 2F). In rarecases, TFAM-positive, single membrane–boundstructures were observed, some in close proximityto herniated mitochondria (Fig. 6E, red arrow)and some apparently isolated (Fig. 6F, red arrow).
Discussion
We have shown that BAK/BAX activation ini-tiates a series of events that culminate in mtDNArelease. Breakdown of the mitochondrial net-work follows BAK/BAX-mediated MOMP andcytochrome c efflux, and coincides with the for-mation of BAK/BAX foci large enough to be de-tected by LLSM. These BAK/BAX macroporesallow the tightly packed IMM an outlet throughwhich it herniates, carrying with it mitochon-drial matrix components, including the mito-chondrial genome. Although the elegant natureof the herniation event initially suggested a high-ly regulated process, we postulate that it is
McArthur et al., Science 359, eaao6047 (2018) 23 February 2018 8 of 12
Movie 8. Reconstructed cryo-tomogram ofan apoptotic herniating mitochondria (fromFig. 5E) moving through the z axis.
Fig. 6. Correlative light and electron microscopy of apoptotic mitochondrial herniation.(A) Confocal light microscopy imaging of Mcl1–/– MEFs expressing TOMM20-Halo (stained withJF-546) (red) and TFAM-mNeonGreen (green), fixed 90 min after ABT-737 (1 mM) + QVD-OPh(20 mM) treatment. (B) TEM imaging of the same cells as in (A). Scale bars, 10 mm. (C to F) Selectedexamples from (A) and (B) at higher resolution, displaying a light microscopy image overlaid onan aligned electron microscopy image. The example shown in (C) is representative of the majority ofherniation events observed; those in (D) and (E), where there is evidence of IMM breakdown, wereless frequent. The image in (F) is representative of the few observed examples of TFAM-positive,single-membrane walled structures. Scale bars, 500 nm.
Movie 7. Lattice light-sheet imaging ofmitochondria (red, TOMM20-Halo), mtDNA(green, TFAM-mNeonGreen), and BAX (blue)from Mcl1–/– Bak–/– Bax–/– MEFs overexpressingBAX-mRuby2 and undergoing apoptosis inducedby ABT-737 and QVD-OPh. Images were capturedat a rate of one 3D volume every 13 s.
RESEARCH | RESEARCH ARTICLEon M
arch 14, 2019
http://science.sciencemag.org/
Dow
nloaded from

simply the physical result of massive holes form-ing in the mitochondrial outer membrane (i.e.,collateral damage). Upon exposure to the cyto-plasm, IMM hernias lose integrity, facilitatingthe recognition of mtDNA by cGAS. Dissipationof the IMM appears to occur in a limited num-ber of mitochondria, but enough mtDNA reachesthe cytosol to initiate a robust cGAS/STING path-way response. This is consistent with recent re-ports highlighting the profound sensitivity ofcGAS to cytosolic TFAM-bound DNA (64).The requirement for mitochondrial fission
in apoptotic cell death is controversial. Severalstudies suggest that it is essential, because DRP1inhibition or deletion reportedly delays cyto-chrome c release and cell death [reviewed in(45, 65)]. In contrast, others have concluded thatbecause DRP1 inhibition does not confer a levelof protection equivalent to that of BCL-XL over-expression, fission and mitochondrial apoptosisare independent processes (66). Our data sup-port the latter view. The absence of DRP1 re-sulted in mitochondrial network hyperfusion inboth the original knockout mouse–derived MEFsand the newly generated CRISPR-targeted clones,but it did not inhibit apoptotic mitochondrialnetwork breakdown and herniation in the CRISPRlines. We suggest that, given the profound OMMdamage induced by BAK and BAX, apoptoticbreakdown is not a facsimile of normal mito-chondrial fission. Recent work indicates that theendoplasmic reticulum contacts mitochondrianear nucleoids engaged in replication, therebymarking points of mitochondrial division (67, 68).It will be interesting to see how these mechanismsmight influence mitochondrial collapse duringapoptosis. Even though the impairment of mito-chondrial network breakdown that was apparentduring apoptosis in the Drp1 knockout MEF cellline is likely artifactual, this system does suggestthat in any setting where fragmentation is com-promised, the frequency of mitochondrial her-niation events will be correspondingly reduced.Our work provides a mechanistic descrip-
tion of mtDNA release frommitochondria duringapoptosis. It occurs irrespective of caspase ac-tivity, but in normal cells, caspases attenuatethe subsequent cGAS/STING-mediated antiviralresponse by driving rapid cellular collapse andclearance. Previous reports have shown that ge-netic ablation of the apoptotic caspase cascadein vivo—at least in the hematopoietic system—results in mtDNA-dependent IFN production(6, 7). We thus contend that IMM herniation isa common event in normal physiology and thatit occurs in any cell whose homeostatic turnoveris governed by BAK and BAX. An extensive lit-erature suggests that mtDNA is found outsidethe mitochondria—and, indeed, outside the cell—in a wide range of circumstances (13, 69). Thisraises the question of whether BAK/BAX-mediatedmtDNA release represents a source of circulatingmtDNA at steady state, or in any of the conditionswhere increased levels of extracellular mtDNAhave been implicated in disease pathology.It is unclear whether IMM herniation repre-
sents a general mechanism of mtDNA escape.
In addition to BAK and BAX oligomerizationthere may be alternative triggers, for example,other pore-forming proteins (host- or pathogen-derived) or mitochondrial stresses. Indeed, whetherand how herniation may be triggered during HIVor dengue infection, calcium overload, irradia-tion, or during inflammatory diseases such assystemic lupus erythematosus or rheumatoidarthritis—all conditions that have been associatedwith loss of mtDNA from the matrix (13, 69, 70)—remains to be established. In some of these con-ditions cytoplasmic mtDNA is thought to be thepathological trigger, while in others, it is extra-cellular mtDNA. Our findings demonstrate thatherniation is one route to the former. It may, insome circumstances, also contribute to generationof the latter (fig. S6E). The TFAM-positive singlemembrane bound structures observed in the cyto-plasm of apoptotic cells suggest that hernias maybud off, and as such, represent an additional classof mitochondrial-derived vesicles (71).
Materials and methodsCell culture
MEFs were derived from mice on a C57BL/6 back-ground or backcrossed for more than 10 gen-erations and prepared from embryonic day 13–14embryos. After removal of the head, thoraciccavity, and fetal liver, a single-cell suspensionwas prepared in Dulbecco’s modified Eagle’s(DME) medium (GIBCO, ThermoFisher 11965092)supplemented with 4 mM L-glutamine, glucose(4.5 g/liter), and 10% heat-inactivated fetal bo-vine serum (FBS; Sigma 12003C) and culturedat 37°C, 5% CO2 on tissue culture plates coatedwith 0.1% gelatin. Immortalization of MEFs wasperformed by transfection (Amaxa Nucleofector)of an expression plasmid encoding the SV40 Tantigen (gift from D. C. S. Huang). ImmortalizedMEF lines were routinely maintained at 37°C,5% CO2 in DME-KELSO medium [prepared in-house from DMEM (GIBCO 31600083) sup-plemented with 40 mM sodium bicarbonate,1 mM HEPEs, 0.0135 mM folic acid, 0.24 mML-asparagine, 0.55 mM L-arginine, 1× Pen/Strep,and 22.2 mM D-glucose] supplemented with 10%heat-inactivated FBS, penicillin/streptomycin(Pen/Strep) (Sigma P0781, 10 ml/ml), and 100 mML-asparagine (Sigma A4159). HeLa cells weremaintained at 37°C, 5% CO2 in DME mediumsupplemented with 10% heat-inactivated FBS andPen/Strep. mtDNA depletion and assessment ofmtDNA content was carried out as described (6).Drp1–/–, Opa1–/–, andMfn1–/– Mfn2–/– MEF lineswere a gift from M. Ryan. To generate knockoutMEFs, we used transient CRISPR/Cas9-mediatedgene targeting. Targeting guide sequences weredesigned using Benchling software, cloned intothe px458 vector (containing Cas9 and GFPmarker)[gift from F. Zhang (72): Addgene plasmid 48138]and were transfected into MEFs using Fugene 6(Roche) at a 3:1 ratio. GFP-positive cells weresorted by flow cytometry (InFlux) and clonesderived from single cells were expanded. Thetargeted gene locus was sequenced and clonesbearing indels predicted to disrupt gene func-tion on both alleles were selected for further ex-
perimentation. Additionally, Mcl1CRISPR–/– cloneswere functionally tested by assessing their sen-sitivity to ABT-737 and immunoblotted for proteinexpression. Drp1CRISPR–/– clones were generatedas described (72) on aMcl1–/– Bak–/– Bax–/– back-ground, reexpressing fluorescently tagged BAX,and clones were selected based on mitochondrialand peroxisomal morphology (assessed by confocalimaging) and immunoblot of protein expression.The targeting guide sequences were as follows:Mcl1#1, GATCATCTCGCGCTACTTGC; Mcl1#2, GG-AGCAGGCGACCGGCTCCA; cGAS#1, GATTCTTG-TAGCTCAATCCTG; cGAS#2, GAAATTCAAAAGA-ATTCCACG; Drp1, GCAGGACGTCTTCAACACAG.
Constructs and reagents
Imaging constructs were generated using PCRamplification of sequences encoding the fluo-rescent proteins mNeonGreen (Allele Biotechnol-ogy), pBabe (LTR)-cytochrome c-GFP [gift fromD. Green (25): Addgene plasmid 41183], pTRIP-CMV-GFP-FLAG-cGAS [gift from N. Manel (73):Addgene plasmid 86675], mRuby2-NT-C1 [giftfrom M. Davidson (74): Addgene plasmid 54561],pCytERM-mScarlet-N1 [gift from D. Gadella (75):Addgene plasmid 85066] mCherry, tdTomato (giftfrom D. C. S. Huang), or the HaloTag (Promega).These were cloned into anMSCV-IRES-hygromycinorMSCV-IRES-puromycin construct (a hygromycin/puromycin selectable retroviral vector) such thatthey were fused either N-terminally to BAK or BAX(murine coding sequences, gifts from D. Huang)or C-terminally to the matrix targeting sequencefrom OTC, DMAC1 (gift from M. Ryan), TFAM(OriGene NM_009360), or TOMM20 (GenScriptsynthesis NM_014765.2) sequences. MEF linesstably expressing fluorescent fusion proteins wereprepared as follows: Expression plasmids weretransiently transfected into Phoenix ecotropicpackaging cells using Fugene 6 (Roche). Viral su-pernatants were collected 48 hours later and usedto infect MEFs by spin infection. Cell populationsexpressing the fluorescent fusion proteins weresorted by flow cytometry (InFlux). Drug treatmentsused throughout the study include QVD-OPh(MedKoo Biosciences 1135695-98-5, MP Biomed-icals 03OPH109, or made in-house by R. Lessene),ABT-737 (Active Biochemicals A-1002), S63845(SYNthesis MedChem), cyclosporin A (Sigma30024), antimycin A (Sigma A8674, CAS:1397-94-0),and oligomycin A (Selleck S1478, CAS:579-13-5).
Viability assay
Cell viability was quantified by CellTiterGlo(Promega G7570) or flow cytometric analysis ofcells excluding propidium iodide (Sigma P4864,5 mg/ml).
ELISA
IFN-b protein was measured using the VeriKine-HS Mouse Interferon Beta ELISA (PBL Assay Sci-ence 42410) as per manufacturer’s instructions.
Subcellular fractionationand immunoblotting
Cells were grown overnight in 10-cm dishes,pretreated with QVD-OPh (50 mM) for 30 min,
McArthur et al., Science 359, eaao6047 (2018) 23 February 2018 9 of 12
RESEARCH | RESEARCH ARTICLEon M
arch 14, 2019
http://science.sciencemag.org/
Dow
nloaded from

then treated with ABT-737 (1 mM) for times asindicated. Culture supernatants were retrievedfor analysis of IFN-b by ELISA, and cells weretrypsinized and fractionated into cytosol andmitochondria-enriched heavy membrane frac-tions by incubating in 0.025% w/v digitonin(Biosynth) in 20 mM Hepes KOH pH 7.5, 93 mMsucrose, 100 mM KCl, 2.5 mM MgCl2 for 10 minon ice. Cytosol and heavy membrane fractionswere separated by centrifugation at 13,000g for5 min at 4°C, before analysis on reducing SDS-PAGE, transfer to nitrocellulose membrane, andimmunoblotting for TFAM (ab131607, Abcam),cytochrome c (556433, BD Biosciences), DLD [sc-365977 (G-2), Santa Cruz Biotechnologies], andVDAC1 (MABN504, Merck).
Confocal microscopy
For imaging of cells at steady state, cells wereplated in 8-well chamber slides (iBidi 80826)and incubated with PicoGreen dye (InvivoGen,3 ml/ml) in serum-free medium for 1 hour at 37°C,and Mitotracker Red-FM dye (InvivoGen, 1 mM)for 30 min (added halfway through PicoGreenstaining). For imaging of apoptotic cells, cellswere plated in 8-well chamber slides (iBidi 80826)and incubated with drug treatments at 37°C forindicated times, after which media was replacedwith 2% paraformaldehyde (Electron MicroscopySciences 15710). Cells were left to fix for 15 min,before three washes in phosphate-buffered sa-line (PBS), and incubated at room temperaturefor 40 min in permeabilization/blocking buffer of0.1% Tween (Sigma P1379), 3% goat serum (LifeTechnologies 501972). Cells were then incubatedovernight at 4°C with primary antibodies anti-TOMM20 (Santa Cruz Biotech sc-11415) and anti-DNA (ProGen AC-30-10) in blocking buffer, washedtwice, then incubated for 1 hour in secondaryantibodies [goat anti-rabbit AF647 (Life Tech-nologies A21245) and goat anti-mouse AF488 (LifeTechnologies A11001)]. In both cases, wells werethen washed in PBS, before phenol red-free me-dium was added and cells imaged on the ZeissLSM 780 confocal microscope using a 63×/1.4Plan Apo objective. Images shown are maximum-intensity projections from Z-stacks.
Lattice light-sheet microscopy
The lattice light-sheet microscopes used in theseexperiments are housed in the Advanced ImagingCenter (AIC) at the Howard Hughes Medical In-stitute Janelia Research Campus, or the Walter &Eliza Hall Institute of Medical Research. The sys-tems were configured and operated as described(14). For all experiments, MEFs were grown on5-mm round glass coverslips (Warner InstrumentsCS-5R). All drug treatments were done after sam-ple mounting in the imaging/media chamber,with the exception of PicoGreen (Invitrogen,ThermoFisher P7581) or TMRM (Sigma T5428)staining and CsA pretreatments, which weredone 30 min before sample mounting. Duringimaging, cells were maintained in Leibovitz’sL-15 medium (GIBCO, ThermoFisher 21083027)supplemented with 10% FBS, 25 mM HEPES(GIBCO, ThermoFisher 15630080), Pen/Strep
(Sigma P0781, 10 ml/ml), 100 mM L-asparagine(Sigma A4159), and 20 mM TROLOX (Santa Cruz53188-07-1). Samples were illuminated by latticelight-sheet using 488-nm, 560-nm, or 641-nmdiode lasers (MPB Communications) throughan excitation objective (Special Optics, 0.65 NA,3.74-mm WD) at 70 to 75%, 40 to 80%, and 60to 100% AOTF transmittance (respectively) and90 mW, 75 mW, and 100 mW initial box power(respectively) for the Janelia system, or 10 to 25%,15 to 35%, and 10 to 25% AOTF transmittance(respectively) and 30 to 60 mW, 50 to 100 mW,and 50 to 100 mW initial box power (respec-tively) for the WEHI system. The lattice light-sheet was illuminated at the back aperture ofthe excitation objective through an annular maskof 0.44 inner NA and 0.55 outer NA. Fluorescentemission was collected by detection objective(Nikon, CFI Apo LWD 25XW, 1.1 NA) and de-tected by sCMOS cameras (Hamamatsu OrcaFlash 4.0 v2). Acquired data were deskewed asdescribed (14) and deconvolved using an itera-tive Richardson-Lucy algorithm. Point-spreadfunctions for deconvolution were experimental-ly measured using 200-nm TetraSpeck beads ad-hered to 5-mm glass coverslips (Invitrogen T7280)for each excitation wavelength.
Live 3D structure illumination microscopy
Live, two-color, 3D-SIM images were capturedon a custom-built structured illumination micro-scope housed in the Advanced Imaging Center(AIC) at the Howard Hughes Medical Institute,Janelia Research Campus. This platform consistsof a Zeiss AxioObserver inverted microscope plat-form with a motorized stage and Zeiss 100×/1.46NA oil immersion objective. Laser excitation wasachieved with 488-nm and 561-nm lasers usingam acousto-optical modulator, which is synchro-nized with a spatial light modulator for fast dualcolor switching at each optical plane as described(76). Cells were maintained at 37°C, 5% CO2 inLeibovitz’s L-15 medium (GIBCO, ThermoFisher21083027) supplemented with 10% FBS, 25 mMHEPES (GIBCO, ThermoFisher 15630080), Pen/Strep (Sigma P0781, 10 ml/ml), 100 mM L-asparagine(Sigma A4159), and 20 mM TROLOX (Santa Cruz53188-07-1). All drug treatments were done aftersample mounting in the imaging/media cham-ber. 512 × 512 images of each channel were col-lected serially on two separate sCMOS cameras(Hamamatsu Flash 4.0) and camera exposureswere typically set at 10 or 20 ms. The step sizewas set at 150 nm, and z-thicknesses of 1.35 to2.85 mm were captured at each time point. Thereconstruction of the data was performed usinga custom-written program and all chromaticalignments were performed after acquisition.Live, three-color, 3D-SIM imaging was per-
formed on the OMX-SR system (GE Health-care). This platform consists of an Olympus 60×1.42 NA oil immersion lens and three PCO.edgesCMOS cameras. Laser excitation was achievedwith 488-nm, 561-nm, and 642-nm lasers. Duringimaging, cells were maintained at 25°C, 5% CO2 inFluorobrite DMEMmedium (GIBCO, ThermoFisherA1896701) supplemented with 10% FBS, 25 mM
HEPES (GIBCO, ThermoFisher 15630080, Pen/Strep (Sigma P0781, 10 ml/ml), 100 mM L-asparagine(Sigma A4159) and 20 mM TROLOX (Santa Cruz53188-07-1). 512 × 512 images were captured withcamera exposures kept below 10 ms. The stepsize was set at 125 nm, and volumes varied be-tween 1.0 and 2.5 mm for each time point. Thereconstruction and chromatic alignment of datawas performed using SoftWorx (GE Healthcare)with a Wiener filter set at 0.005. For all experi-ments, MEFs were grown on 23-mm round glasscoverslips (Warner Instruments). All SIM data,including raw and reconstructed images, weresubjected to SIMcheck FIJI Plugin (77) to en-sure that image quality was within acceptablestandards.
Immunogold transmissionelectron microscopy
Fixation and embedding procedures were carriedout as described (78). Sections were cut on a LeicaFC7-UC7. Immunolabeling was done with goatanti-GFP/biotin (Rockland 600-106-215) and rab-bit anti-biotin (Rockland, 100-4198) followed byincubation with protein-A-Gold 15 nm (Depart-ment of Cell Biology, University Medical Cen-ter, Utrecht). High-resolution EM images weretaken on a Hitachi H-7500 TEM and a FEI TecnaiT12 TEM.
Correlative light and electron microscopy
Mcl1–/–MEFsexpressingTOMM20-HaloandTFAM--mNeonGreen were grown overnight in a 35 mm500-grid plastic-bottomed m-Dish (Ibidi, Germany).After treatment with QVD-OPh (20 mM) and ABT-737 (1 mM), cells were stained with CellMask DeepRed Plasma Membrane stain (ThermoFisher,2.5 mg/ml) and JaneliaFluor-646 HaloTag-specificdye (17) (50 nm) for 30 min at 37°C and 5% CO2,then fixed using prewarmed phosphate-buffered4% paraformaldehyde at 37°C for 1 hour. Thefixed sample was imaged on an inverted LeicaSP8 confocal laser scanning microscope equippedwith an 40×/1.10 objective (water immersion, HCPLAPO, CS2; Leica microsystems) using an HyDHybrid Detector (Leica Biosystems) through theLeica Application Suite X (LASX v2.0.1). The op-tical data (35 nm lateral pixel resolution; 200 nmaxial voxel resolution) was deconvolved for subse-quent alignment (fast classicmaximum likelihoodestimation; 10 signal-to-noise ratio; 40 iterations;0.05 quality threshold) using Huygens Profes-sional (v15.10; Scientific Volume Imaging). Afteroptical image acquisition, the sample was post-fixed overnight with 2.5% glutaraldehyde in 0.1 Msodium cacodylate buffer at 4°C, rinsed twice with0.1 M sodium cacodylate, then osmicated withferricyanide-reduced osmium tetroxide (1% (w/v)OsO4, 1.5% (w/v) K3[Fe(CN)6], 0.065M cacodylatebuffer) for 2 hours at 4°C, and thoroughly rinsedfive times using MilliQ water. All subsequentstages were microwave assisted using a BioWavePro microwave system (Pelco). The sample wasen bloc stained with 2% (w/v) aqueous uranylacetate using three microwave duty cycles (120 son, 120 s off) at 100 W under vacuum, then rinsedfive times with MilliQ water. Microwave-assisted
McArthur et al., Science 359, eaao6047 (2018) 23 February 2018 10 of 12
RESEARCH | RESEARCH ARTICLEon M
arch 14, 2019
http://science.sciencemag.org/
Dow
nloaded from

dehydration was performed at atmospheric pres-sure using 150W for 40 s per stage of a graduatedseries of ethanol (50%, 70%, 90%, 100%, 100%)and propylene oxide (100%, 100%), andmicrowave-assisted resin infiltration was performed undervacuum at 250W for 180 s per stage using a grad-uated series of Procure-Araldite (25%, 50%, 75%,100%, 100%) inpropyleneoxide, before resinpolym-erization at 60°C for 48 hours. The target depthwithin the target cell was then relocated withinthe resin block, using the procedure outlined in(79). The resin block was trimmed, then sec-tioned using Ultracut UCT ultramicrotome (Leica)equipped with a 45° diamond knife (Diatome) tocut serial sections (average thickness 78 nm) forcollection on nine separate 300-mesh hex thin-bar copper grids. Grids containing the sectionsclosest to the target z-planes (1000 nm to 1600 nmdepth into resin block) were stained at roomtemperature using 2% (w/v) aqueous uranyl ace-tate (10min) and Reynolds lead citrate (3min). A27-image TEM montage of the target cell wasmanually acquired using a Tecnai T12 TEM op-erated at 120 kV. The image montage was cor-rected for EM lens distortion and stitched bylinear blending using the appropriate pluginsin FIJI (FIJI Is Just ImageJ) (27, 80, 81).WithinGIMP (GNU Image Manipulation Program, ver-sion 2.8.2), the distortion-corrected TEM mon-tagewas alignedwith the deconvolved optical datausing filopodia, the nucleus, and other intrinsicfeatures as anchor points. All subsequent TEMdatawere aligned directly to this canonical align-ment. Correlated fluorescence data were obtainedby scaling and aligning TEM images to the TEMmontage, extracting the aligned region from thefluorescence channels, then performing the re-verse operations with bicubic interpolation.
Electron cryotomography
Cells were grown overnight on 200 mesh Quanti-foil gold grids, stimulated for 90 min with ABT-737(1 mM) + QVD-OPh (20 mM), and cryo-fixed in liq-uid ethane using a Vitrobot Mark IV. Continuouscryo-tomograms from –60° to 60° were recordedon a Titan Krios at a magnification of 19,500 usingthe Volta phase plate, an energy filter, and a K2Summit camera at a dose of about 90 electronsper angstrom. Reconstruction was done using theIMOD Tomography package. Tomographic slicesof 10-nm thickness are shown.
Data analysis
All image data were analyzed using the FIJIdistribution of ImageJ (27). The segmentation ofmitochondria and TFAM signal was performedusing the WEKA Trainable Segmentation plug-in. Segmentation was trained on representativeframes of five images from different data sets,then applied to all frames of all data sets. All re-sultant segmentation was then also validated vi-sually. Mitochondrial morphology was measuredusing FIJI’s in-built morphology measures. Cyto-chrome c release was measured by calculatingthe area (pixels) of signal above background,within the segmented mitochondria signal, whichwas set manually at a level that was consistent
between all data sets and accurately matchedthe behavior that was qualitatively observed.This was then graphed relative to mitochondrialarea (i.e., cytochrome c area/mito area) to ensurethat changes in cytochrome c area were not ar-tifacts of changing mitochondrial morphology.For nucleoid release measurements, the TFAMsignal was segmented, thresholded, and maskedwith the inverse of the segmented mitochondriasignal, thereby ensuring that only signal fromTFAM outside the mitochondria would be mea-sured. BAX aggregation was quantified by seg-menting and counting all regions of BAX signalabove a set size and intensity limit as they ap-peared over time. For all manual adjustments,threshold values were set using representativeframes and validated against additional frames(from later time points) before application to theentire time course. Once threshold values hadbeen set and validated, all measurements werethen automated across all independent experi-ments and time points.
Code availability
Custom scripts automating the combinations ofFIJI in-built plugins/filters used for analysis areavailable as supplementary files (code files S1and S2).
REFERENCES AND NOTES
1. R. J. Youle, A. Strasser, The BCL-2 protein family: Opposingactivities that mediate cell death. Nat. Rev. Mol. Cell Biol. 9,47–59 (2008). doi: 10.1038/nrm2308; pmid: 18097445
2. P. E. Czabotar, G. Lessene, A. Strasser, J. M. Adams, Control ofapoptosis by the BCL-2 protein family: Implications forphysiology and therapy. Nat. Rev. Mol. Cell Biol. 15, 49–63(2014). doi: 10.1038/nrm3722; pmid: 24355989
3. R. M. Kluck, E. Bossy-Wetzel, D. R. Green, D. D. Newmeyer, Therelease of cytochrome c from mitochondria: A primary sitefor Bcl-2 regulation of apoptosis. Science 275, 1132–1136(1997). doi: 10.1126/science.275.5303.1132; pmid: 9027315
4. J. Yang et al., Prevention of apoptosis by Bcl-2: Release ofcytochrome c from mitochondria blocked. Science 275,1129–1132 (1997). doi: 10.1126/science.275.5303.1129;pmid: 9027314
5. O. Julien, J. A. Wells, Caspases and their substrates.Cell Death Differ. 24, 1380–1389 (2017). doi: 10.1038/cdd.2017.44; pmid: 28498362
6. M. J. White et al., Apoptotic caspases suppress mtDNA-induced STING-mediated type I IFN production. Cell159, 1549–1562 (2014). doi: 10.1016/j.cell.2014.11.036;pmid: 25525874
7. A. Rongvaux et al., Apoptotic caspases prevent the induction oftype I interferons by mitochondrial DNA. Cell 159, 1563–1577(2014). doi: 10.1016/j.cell.2014.11.037; pmid: 25525875
8. M. Patrushev et al., Mitochondrial permeability transitiontriggers the release of mtDNA fragments. Cell. Mol. Life Sci.61, 3100–3103 (2004). doi: 10.1007/s00018-004-4424-1;pmid: 15583871
9. M. Patrushev et al., Release of mitochondrial DNA fragmentsfrom brain mitochondria of irradiated mice. Mitochondrion6, 43–47 (2006). doi: 10.1016/j.mito.2005.12.001;pmid: 16413832
10. A. P. West et al., Mitochondrial DNA stress primes the antiviralinnate immune response. Nature 520, 553–557 (2015).doi: 10.1038/nature14156; pmid: 25642965
11. K. Shimada et al., Oxidized mitochondrial DNA activates theNLRP3 inflammasome during apoptosis. Immunity 36, 401–414(2012). doi: 10.1016/j.immuni.2012.01.009; pmid: 22342844
12. T.-D. Kanneganti, M. Kundu, D. R. Green, Innate immunerecognition of mtDNA—an undercover signal? Cell Metab.21, 793–794 (2015). doi: 10.1016/j.cmet.2015.05.019;pmid: 26039443
13. A. P. West, G. S. Shadel, Mitochondrial DNA in innate immuneresponses and inflammatory pathology. Nat. Rev. Immunol.17, 363–375 (2017). doi: 10.1038/nri.2017.21; pmid: 28393922
14. B.-C. Chen et al., Lattice light-sheet microscopy: Imagingmolecules to embryos at high spatiotemporal resolution.Science 346, 1257998–1257998 (2014). doi: 10.1126/science.1257998; pmid: 25342811
15. T. Oltersdorf et al., An inhibitor of Bcl-2 family proteins inducesregression of solid tumours. Nature 435, 677–681 (2005).doi: 10.1038/nature03579; pmid: 15902208
16. M. F. van Delft et al., The BH3 mimetic ABT-737 targetsselective Bcl-2 proteins and efficiently induces apoptosis viaBak/Bax if Mcl-1 is neutralized. Cancer Cell 10, 389–399(2006). doi: 10.1016/j.ccr.2006.08.027; pmid: 17097561
17. J. B. Grimm et al., A general method to improve fluorophoresfor live-cell and single-molecule microscopy. Nat. Methods12, 244–250 (2015). doi: 10.1016/j.ccr.2006.08.027;pmid: 17097561
18. N. C. Shaner et al., A bright monomeric green fluorescentprotein derived from Branchiostoma lanceolatum.Nat. Methods 10, 407–409 (2013). doi: 10.1038/nmeth.2413;pmid: 23524392
19. T. M. Caserta, A. N. Smith, A. D. Gultice, M. A. Reedy,T. L. Brown, Q-VD-OPh, a broad spectrum caspase inhibitorwith potent antiapoptotic properties. Apoptosis 8, 345–352(2003). doi: 10.1023/A:1024116916932; pmid: 12815277
20. A. Kotschy et al., The MCL1 inhibitor S63845 is tolerable andeffective in diverse cancer models. Nature 538, 477–482(2016). doi: 10.1038/nature19830; pmid: 27760111
21. N. Ashley, D. Harris, J. Poulton, Detection of mitochondrialDNA depletion in living human cells using PicoGreen staining.Exp. Cell Res. 303, 432–446 (2005). doi: 10.1016/j.yexcr.2004.10.013; pmid: 15652355
22. P. D. Bhola, A. L. Mattheyses, S. M. Simon, Spatial andtemporal dynamics of mitochondrial membrane permeabilitywaves during apoptosis. Biophys. J. 97, 2222–2231 (2009).doi: 10.1016/j.bpj.2009.07.056; pmid: 19843454
23. M. Rehm et al., Dynamics of outer mitochondrial membranepermeabilization during apoptosis. Cell Death Differ. 16,613–623 (2009). doi: 10.1038/cdd.2008.187; pmid: 19136937
24. M. Rehm, H. Düssmann, J. H. M. Prehn, Real-time single cellanalysis of Smac/DIABLO release during apoptosis. J. Cell Biol.162, 1031–1043 (2003). doi: 10.1083/jcb.200303123;pmid: 12975347
25. J. C. Goldstein, N. J. Waterhouse, P. Juin, G. I. Evan, D. R. Green,The coordinate release of cytochrome c during apoptosis is rapid,complete and kinetically invariant. Nat. Cell Biol. 2, 156–162(2000). doi: 10.1038/35004029; pmid: 10707086
26. L. Lartigue et al., An intracellular wave of cytochrome cpropagates and precedes Bax redistribution during apoptosis.J. Cell Sci. 121, 3515–3523 (2008). doi: 10.1242/jcs.029587;pmid: 18840646
27. J. Schindelin et al., Fiji: An open-source platform forbiological-image analysis. Nat. Methods 9, 676–682 (2012).doi: 10.1038/nmeth.2019; pmid: 22743772
28. B. Westermann, Mitochondrial fusion and fission in cell lifeand death. Nat. Rev. Mol. Cell Biol. 11, 872–884 (2010).doi: 10.1038/nrm3013; pmid: 21102612
29. R. J. Youle, A. M. van der Bliek, Mitochondrial fission, fusion,and stress. Science 337, 1062–1065 (2012). doi: 10.1126/science.1219855; pmid: 22936770
30. L. Pernas, L. Scorrano, Mito-morphosis: Mitochondrial fusion,fission, and cristae remodeling as key mediators of cellularfunction. Annu. Rev. Physiol. 78, 505–531 (2016). doi: 10.1146/annurev-physiol-021115-105011; pmid: 26667075
31. J. R. Friedman, J. Nunnari, Mitochondrial form and function.Nature 505, 335–343 (2014). doi: 10.1038/nature12985;pmid: 24429632
32. E. Smirnova, L. Griparic, D. L. Shurland, A. M. van der Bliek,Dynamin-related protein Drp1 is required for mitochondrialdivision in mammalian cells. Mol. Biol. Cell 12, 2245–2256(2001). doi: 10.1091/mbc.12.8.2245; pmid: 11514614
33. J. Prudent, H. M. McBride, Mitochondrial dynamics: ER actintightens the Drp1 noose. Curr. Biol. 26, R207–R209 (2016).doi: 10.1016/j.cub.2016.01.009; pmid: 26954442
34. N. Ishihara, Y. Eura, K. Mihara, Mitofusin 1 and 2 play distinctroles in mitochondrial fusion reactions via GTPase activity.J. Cell Sci. 117, 6535–6546 (2004). doi: 10.1242/jcs.01565;pmid: 15572413
35. S. Cipolat, O. Martins de Brito, B. Dal Zilio, L. Scorrano,OPA1 requires mitofusin 1 to promote mitochondrial fusion.Proc. Natl. Acad. Sci. U.S.A. 101, 15927–15932 (2004).doi: 10.1073/pnas.0407043101; pmid: 15509649
36. I. Martinou et al., The release of cytochrome c frommitochondria during apoptosis of NGF-deprived sympatheticneurons is a reversible event. J. Cell Biol. 144, 883–889(1999). doi: 10.1083/jcb.144.5.883; pmid: 10085288
McArthur et al., Science 359, eaao6047 (2018) 23 February 2018 11 of 12
RESEARCH | RESEARCH ARTICLEon M
arch 14, 2019
http://science.sciencemag.org/
Dow
nloaded from
37. S. Frank et al., The role of dynamin-related protein 1, amediator of mitochondrial fission, in apoptosis. Dev. Cell 1,515–525 (2001). doi: 10.1016/S1534-5807(01)00055-7;pmid: 11703942
38. M. Karbowski et al., Quantitation of mitochondrial dynamicsby photolabeling of individual organelles shows thatmitochondrial fusion is blocked during the Bax activationphase of apoptosis. J. Cell Biol. 164, 493–499 (2004).doi: 10.1083/jcb.200309082; pmid: 14769861
39. C. Sheridan, P. Delivani, S. P. Cullen, S. J. Martin, Bax- orBak-induced mitochondrial fission can be uncoupled fromcytochrome C release. Mol. Cell 31, 570–585 (2008).doi: 10.1016/j.molcel.2008.08.002; pmid: 18722181
40. M. Karbowski et al., Spatial and temporal association of Baxwith mitochondrial fission sites, Drp1, and Mfn2 duringapoptosis. J. Cell Biol. 159, 931–938 (2002). doi: 10.1083/jcb.200209124; pmid: 12499352
41. S. Wasiak, R. Zunino, H. M. McBride, Bax/Bak promotesumoylation of DRP1 and its stable association with mitochondriaduring apoptotic cell death. J. Cell Biol. 177, 439–450 (2007).doi: 10.1083/jcb.200610042; pmid: 17470634
42. S. Montessuit et al., Membrane remodeling induced by thedynamin-related protein Drp1 stimulates Bax oligomerization.Cell 142, 889–901 (2010). doi: 10.1016/j.cell.2010.08.017;pmid: 20850011
43. H. Otera, N. Miyata, O. Kuge, K. Mihara, Drp1-dependentmitochondrial fission via MiD49/51 is essential for apoptoticcristae remodeling. J. Cell Biol. 212, 531–544 (2016).doi: 10.1083/jcb.201508099; pmid: 26903540
44. D.-F. Suen, K. L. Norris, R. J. Youle, Mitochondrial dynamicsand apoptosis. Genes Dev. 22, 1577–1590 (2008).doi: 10.1101/gad.1658508; pmid: 18559474
45. J. C. Martinou, R. J. Youle, Which came first, the cytochrome crelease or the mitochondrial fission? Cell Death Differ. 13,1291–1295 (2006). doi: 10.1038/sj.cdd.4401985;pmid: 16763618
46. L. A. Gillies, T. Kuwana, Apoptosis regulation at themitochondrial outer membrane. J. Cell. Biochem. 115, 632–640(2014). doi: 10.1002/jcb.24709; pmid: 24453042
47. B. Oettinghaus et al., DRP1-dependent apoptotic mitochondrialfission occurs independently of BAX, BAK and APAF1 toamplify cell death by BID and oxidative stress. Biochim.Biophys. Acta 1857, 1267–1276 (2016). doi: 10.1016/j.bbabio.2016.03.016; pmid: 26997499
48. A. Olichon et al., Loss of OPA1 perturbates the mitochondrialinner membrane structure and integrity, leading to cytochromec release and apoptosis. J. Biol. Chem. 278, 7743–7746(2003). doi: 10.1074/jbc.C200677200; pmid: 12509422
49. R. Sugioka, S. Shimizu, Y. Tsujimoto, Fzo1, a protein involvedin mitochondrial fusion, inhibits apoptosis. J. Biol. Chem.279, 52726–52734 (2004). doi: 10.1074/jbc.M408910200;pmid: 15459195
50. D. Arnoult, A. Grodet, Y.-J. Lee, J. Estaquier, C. Blackstone,Release of OPA1 during apoptosis participates in the rapid andcomplete release of cytochrome c and subsequentmitochondrial fragmentation. J. Biol. Chem. 280, 35742–35750(2005). doi: 10.1074/jbc.M505970200; pmid: 16115883
51. N. Ishihara et al., Mitochondrial fission factor Drp1 is essentialfor embryonic development and synapse formation in mice.Nat. Cell Biol. 11, 958–966 (2009). doi: 10.1038/ncb1907;pmid: 19578372
52. J. Wakabayashi et al., The dynamin-related GTPase Drp1 isrequired for embryonic and brain development in mice.J. Cell Biol. 186, 805–816 (2009). doi: 10.1083/jcb.200903065;pmid: 19752021
53. C. P. Baines et al., Loss of cyclophilin D reveals a criticalrole for mitochondrial permeability transition in cell death.Nature 434, 658–662 (2005). doi: 10.1038/nature03434;pmid: 15800627
54. V. Petronilli, A. Nicolli, P. Costantini, R. Colonna, P. Bernardi,Regulation of the permeability transition pore, a voltage-dependent mitochondrial channel inhibited by cyclosporin A.
Biochim. Biophys. Acta 1187, 255–259 (1994). doi: 10.1016/0005-2728(94)90122-8; pmid: 7521212
55. K. G. Wolter et al., Movement of Bax from the cytosol tomitochondria during apoptosis. J. Cell Biol. 139, 1281–1292(1997). doi: 10.1083/jcb.139.5.1281; pmid: 9382873
56. A. Nechushtan, C. L. Smith, I. Lamensdorf, S. H. Yoon, R. J. Youle,Bax and Bak coalesce into novel mitochondria-associatedclusters during apoptosis. J. Cell Biol. 153, 1265–1276 (2001).doi: 10.1083/jcb.153.6.1265; pmid: 11402069
57. S. S. Smaili, Y. T. Hsu, K. M. Sanders, J. T. Russell, R. J. Youle,Bax translocation to mitochondria subsequent to a rapidloss of mitochondrial membrane potential. Cell Death Differ.8, 909–920 (2001). doi: 10.1038/sj.cdd.4400889;pmid: 11526446
58. G. Dewson, R. M. Kluck, Mechanisms by which Bak and Baxpermeabilise mitochondria during apoptosis. J. Cell Sci. 122,2801–2808 (2009). doi: 10.1242/jcs.038166; pmid: 19795525
59. S. W. G. Tait, D. R. Green, Mitochondria and cell death: Outermembrane permeabilization and beyond. Nat. Rev. Mol.Cell Biol. 11, 621–632 (2010). doi: 10.15252/embj.201592789;pmid: 26783364
60. L. Große et al., Bax assembles into large ring-like structuresremodeling the mitochondrial outer membrane in apoptosis.EMBO J. 35, 402–413 (2016). doi: 10.15252/embj.201592789;pmid: 26783364
61. R. Salvador-Gallego et al., Bax assembly into rings and arcsin apoptotic mitochondria is linked to membrane pores.EMBO J. 35, 389–401 (2016). doi: 10.15252/embj.201593384;pmid: 26783362
62. H. Düssmann et al., Single-cell quantification of Bax activationand mathematical modelling suggest pore formation onminimal mitochondrial Bax accumulation. Cell Death Differ. 17,278–290 (2010). doi: 10.1038/cdd.2009.123; pmid: 19745831
63. D. A. Stroud et al., Accessory subunits are integral for assemblyand function of human mitochondrial complex I. Nature 538,123–126 (2016). doi: 10.1038/nature19754; pmid: 27626371
64. L. Andreeva et al., cGAS senses long and HMGB/TFAM-boundU-turn DNA by forming protein-DNA ladders. Nature 549,394–398 (2017). doi: 10.1038/nature23890; pmid: 28902841
65. R. J. Youle, M. Karbowski, Mitochondrial fission in apoptosis.Nat. Rev. Mol. Cell Biol. 6, 657–663 (2005). doi: 10.1038/nrm1697; pmid: 16025099
66. P. A. Parone et al., Inhibiting the mitochondrial fissionmachinery does not prevent Bax/Bak-dependent apoptosis.Mol. Cell. Biol. 26, 7397–7408 (2006). doi: 10.1128/MCB.02282-05; pmid: 17015472
67. J. R. Friedman et al., ER tubules mark sites of mitochondrialdivision. Science 334, 358–362 (2011). doi: 10.1126/science.1207385; pmid: 21885730
68. S. C. Lewis, L. F. Uchiyama, J. Nunnari, ER-mitochondriacontacts couple mtDNA synthesis with mitochondrial divisionin human cells. Science 353, aaf5549 (2016). doi: 10.1126/science.aaf5549; pmid: 27418514
69. R. K. Boyapati, A. Tamborska, D. A. Dorward, G.-T. Ho, Advancesin the understanding of mitochondrial DNA as a pathogenicfactor in inflammatory diseases. F1000 Res. 6, 169 (2017).doi: 10.12688/f1000research.10397.1; pmid: 28299196
70. S. Aguirre et al., Dengue virus NS2B protein targets cGAS fordegradation and prevents mitochondrial DNA sensing duringinfection. Nat. Microbiol. 2, 17037 (2017). doi: 10.1038/nmicrobiol.2017.37; pmid: 28346446
71. A. Sugiura, G.-L. McLelland, E. A. Fon, H. M. McBride, A newpathway for mitochondrial quality control: Mitochondrial-derivedvesicles. EMBO J. 33, 2142–2156 (2014). doi: 10.15252/embj.201488104; pmid: 25107473
72. F. A. Ran et al., Genome engineering using the CRISPR-Cas9system. Nat. Protoc. 8, 2281–2308 (2013). doi: 10.1038/nprot.2013.143; pmid: 24157548
73. M. Raab et al., ESCRT III repairs nuclear envelope rupturesduring cell migration to limit DNA damage and cell death.Science 352, 359–362 (2016). doi: 10.1126/science.aad7611;pmid: 27013426
74. A. J. Lam et al., Improving FRET dynamic range with brightgreen and red fluorescent proteins. Nat. Methods 9, 1005–1012(2012). doi: 10.1038/nmeth.2171; pmid: 22961245
75. D. S. Bindels et al.., mScarlet: A bright monomeric redfluorescent protein for cellular imaging. Nat. Methods 14,53–56 (2017). doi: 10.1038/nmeth.4074; pmid: 27869816
76. R. Fiolka, L. Shao, E. H. Rego, M. W. Davidson,M. G. L. Gustafsson, Time-lapse two-color 3D imaging of livecells with doubled resolution using structured illumination.Proc. Natl. Acad. Sci. U.S.A. 109, 5311–5315 (2012).doi: 10.1073/pnas.1119262109; pmid: 22431626
77. G. Ball et al., SIMcheck: A toolbox for successful super-resolution structured illumination microscopy. Sci. Rep. 5,15915 (2015). doi: 10.1038/srep15915; pmid: 26525406
78. J. W. Slot, H. J. Geuze, Cryosectioning and immunolabeling.Nat. Protoc. 2, 2480–2491 (2007). doi: 10.1038/nprot.2007.365; pmid: 17947990
79. B. S. Padman, M. Bach, G. Ramm, An improved procedure forsubcellular spatial alignment during live-cell CLEM. PLOS ONE9, e95967 (2014). doi: 10.1371/journal.pone.0095967;pmid: 24755651
80. S. Preibisch, S. Saalfeld, P. Tomancak, Globally optimal stitchingof tiled 3D microscopic image acquisitions. Bioinformatics25, 1463–1465 (2009). doi: 10.1093/bioinformatics/btp184;pmid: 19346324
81. V. Kaynig, B. Fischer, E. Müller, J. M. Buhmann, Fully automaticstitching and distortion correction of transmission electronmicroscope images. J. Struct. Biol. 171, 163–173 (2010).doi: 10.1016/j.jsb.2010.04.012; pmid: 20450977
ACKNOWLEDGMENTS
We thank A. Taylor, L. Shao, F. Babayekhorasani, and S. Khuon formicroscopy assistance; B. Howden for personnel support; C. De Nardofor administrative support; and D. C. S. Huang and F. Kraus forproviding constructs and cell lines. Funding: Supported by anAustralian Federal Government Postgraduate Award (K.M.); ProjectGrants (1077750, 1106471, 1078924, 1083077), Program Grants(1016647, 1113577, 1113133), Fellowships (1063008, B.T.K.; 1117089,G.L.), an ARC Future Fellowship (160100063, M.L.), an ARCDiscovery Grant (DP16012176, M.T.R.), and an IndependentResearch Institutes Infrastructure Support Scheme Grant (361646)from the Australian National Health and Medical ResearchCouncil (NHMRC); the Australian Cancer Research Fund; and aVictorian State Government Operational Infrastructure SupportGrant. The Advanced Imaging Center at Janelia Research Campusis jointly supported by the Howard Hughes Medical Institute andthe Gordon and Betty Moore Foundation. The Monash RamaciottiCentre for Cryo-Electron Microscopy is supported by theRamaciotti Foundation (CD11/1958) and the Australian ResearchCouncil (LE120100090 and LE100100165). Author contributions:K.M., J.M.H., N.D.G., L.L., and K.L.R. performed LLSM and 3D-SIMmicroscopy experiments. K.M. and S.D. performed confocalmicroscopy experiments. V.O. and G.R. performed EM experiments;B.S.P. performed CLEM experiment. L.W., K.M., B.T.K., M.L., N.D.G.,S.C., and M.D. analyzed data. K.M., T.L.S., C.S., L.L., G.D., andR.M.L. performed cell culture and related experiments. L.D.O.,R.L., M.T.R., and H.S.C. provided reagents. B.T.K., K.M., andM.F.v.D. conceived the project and planned experiments. M.F.v.D.,M.T.R., G.D., K.L.R., G.L., T.L.C., J.M.H., S.C., G.R., and M.L.contributed insightful discussions. K.M. and B.T.K. wrote themanuscript, and all authors contributed to its revision. Competinginterests: All authors declare no competing interests. Data andmaterials availability: All data and custom analysis scriptsare available in the manuscript or the supplementary materials.
SUPPLEMENTARY MATERIALS
www.sciencemag.org/content/359/6378/eaao6047/suppl/DC1Figs. S1 to S6Code Files S1 and S2
8 August 2017; accepted 24 January 201810.1126/science.aao6047
McArthur et al., Science 359, eaao6047 (2018) 23 February 2018 12 of 12
RESEARCH | RESEARCH ARTICLEon M
arch 14, 2019
http://science.sciencemag.org/
Dow
nloaded from

BAK/BAX macropores facilitate mitochondrial herniation and mtDNA efflux during apoptosis
Guillaume Lessene, Michael T. Ryan, Kelly L. Rogers, Mark F. van Delft and Benjamin T. KileCanny Sugiana, Romina Lessene, Laura D. Osellame, Teng-Leong Chew, Grant Dewson, Michael Lazarou, Georg Ramm,Geoghegan, Stephane Chappaz, Sophia Davidson, Hui San Chin, Rachael M. Lane, Marija Dramicanin, Tahnee L. Saunders, Kate McArthur, Lachlan W. Whitehead, John M. Heddleston, Lucy Li, Benjamin S. Padman, Viola Oorschot, Niall D.
DOI: 10.1126/science.aao6047 (6378), eaao6047.359Science
, this issue p. eaao6047Scienceinto the cytoplasm.in mitochondrial herniation. This process allowed the contents of the mitochondrial matrix, including mtDNA, to escape membrane. These massive holes caused the inner mitochondrial membrane to balloon out into the cytoplasm, resultingof the pro-death proteins BAK and BAX resulted in the formation of large macro-pores in the mitochondrial outer
used live-cell lattice light-sheet microscopy to look at mtDNA release during intrinsic apoptosis. Activationet al.McArthur however, the mechanisms of mtDNA release are unclear, and the process has not been observed in real time thus far.
diseases;extracellular milieu, triggers innate immune pathways. mtDNA signaling has been implicated in a wide range of Mitochondrial DNA (mtDNA) is a potent damage-associated molecular pattern that, if it reaches the cytoplasm or
The great escape
ARTICLE TOOLS http://science.sciencemag.org/content/359/6378/eaao6047
MATERIALSSUPPLEMENTARY http://science.sciencemag.org/content/suppl/2018/02/21/359.6378.eaao6047.DC1
REFERENCES
http://science.sciencemag.org/content/359/6378/eaao6047#BIBLThis article cites 81 articles, 27 of which you can access for free
PERMISSIONS http://www.sciencemag.org/help/reprints-and-permissions
Terms of ServiceUse of this article is subject to the
is a registered trademark of AAAS.Sciencelicensee American Association for the Advancement of Science. No claim to original U.S. Government Works. The title Science, 1200 New York Avenue NW, Washington, DC 20005. 2017 © The Authors, some rights reserved; exclusive
(print ISSN 0036-8075; online ISSN 1095-9203) is published by the American Association for the Advancement ofScience
on March 14, 2019
http://science.sciencem
ag.org/D
ownloaded from