cecl technology solutions - sas institute...generic market analysts. the firm has brought together a...
TRANSCRIPT
Independent research by
June 2018
CECL Technology SolutionsSAS: FinTech QuadrantTM 2018

© Copyright Chartis Research Ltd 2018. All Rights Reserved 1
About Chartis Chartis Research is the leading provider of research and analysis on the global market for risk technology. It is part of Infopro Digital, which owns market-leading brands such as Risk and Waters Technology. Chartis’s goal is to support enterprises as they drive business performance through improved risk management, corporate governance and compliance and to help clients make informed technology and business decisions by providing in-depth analysis and actionable advice on virtually all aspects of risk technology. Areas of expertise include:
• Credit risk• Operational risk and governance, risk and compliance (GRC)• Market risk• Asset and liability management (ALM) and liquidity risk• Energy and commodity trading risk• Financial crime including trader surveillance, anti-fraud and anti-money laundering• Cyber risk management• Insurance risk• Regulatory requirements including Basel 2 and 3, Dodd-Frank, MiFID II and Solvency II
Chartis is solely focused on risk and compliance technology, which gives it a significant advantage over generic market analysts.
The firm has brought together a leading team of analysts and advisors from the risk management and financial services industries. This team has hands-on experience of implementing and developing risk management systems and programs for Fortune 500 companies and leading consulting houses.
Visit www.chartis-research.com for more information.
Join our global online community at www.risktech-forum.com.
© Copyright Chartis Research Ltd 2018. All Rights Reserved. Chartis Research is a wholly owned subsidiary of Infopro Digital Ltd.
No part of this publication may be reproduced, adapted, stored in a retrieval system or transmitted in any form by any means, electronic, mechanical, photocopying, recording or otherwise, without the prior permission of Chartis Research Ltd. The facts contained within this report are believed to be correct at the time of publication but cannot be guaranteed.
Please note that the findings, conclusions and recommendations Chartis Research delivers will be based on information gathered in good faith, whose accuracy we cannot guarantee. Chartis Research accepts no liability whatever for actions taken based on any information that may subsequently prove to be incorrect or errors in our analysis. See Chartis ‘Terms of Use’ on www.chartis-research.com.
RiskTech100®, RiskTech Quadrant®, FinTech Quadrant™ and The Risk Enabled Enterprise® are Registered Trade Marks of Chartis Research Limited.
Unauthorized use of Chartis’s name and trademarks is strictly prohibited and subject to legal penalties.

© Copyright Chartis Research Ltd 2018. All Rights Reserved 2
Table of contents1. In this research paper ...........................................................................................................................4
2. FinTech Quadrant™ for CECL technology solutions, 2018 ..........................................................5
3. SAS CECL technology solutions: capabilities and market position ............................................7
4. Appendix A: FinTech Quadrant™ methodology ..............................................................................8
5. Further reading ................................................................................................................................... 14
© Copyright Chartis Research Ltd 2018. All Rights Reserved 3
List of figures and tablesFigure 1: FinTech Quadrant™ for CECL technology solutions, 2018 ...............................................5
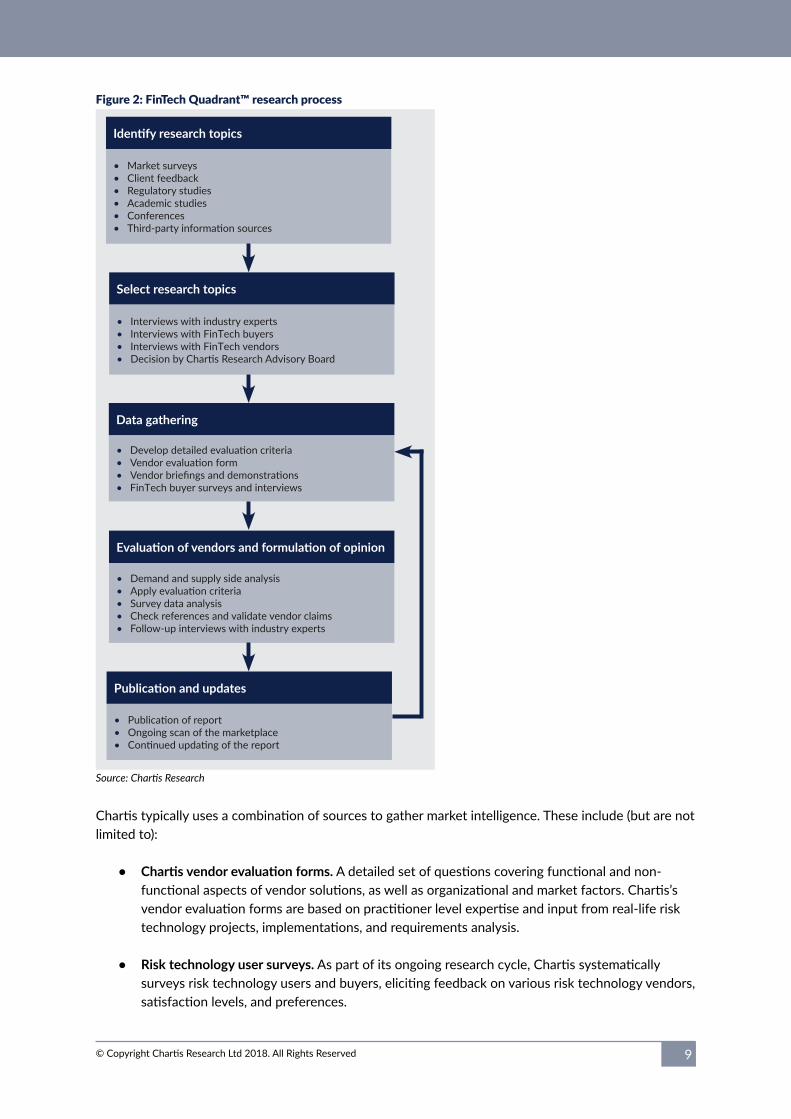
Figure 2: FinTech Quadrant™ research process ....................................................................................9
Figure 3: FinTech Quadrant™ ................................................................................................................. 10

© Copyright Chartis Research Ltd 2018. All Rights Reserved 4
1. In this research paperThis research paper is based on material originally published in the Chartis report CECL Technology Solutions 2018. It includes the following:
• FinTech QuadrantTM for Current Expected Credit Loss (CECL) technology solutions.
• SAS CECL technology solutions capabilities and market position.
• FinTech QuadrantTM methodology.

© Copyright Chartis Research Ltd 2018. All Rights Reserved 5
2. FinTech Quadrant™ for CECL technology solutions, 2018
Figure 1: FinTech Quadrant™ for CECL technology solutions, 2018
Best-of-breed
Point solutions
Category leaders
Enterprise solutions
COMPLETENESS OF OFFERING
MA
RKET
PO
TEN
TIA
L
AxiomSL
BloombergFICO
FIS
Fiserv
JHA
MIAC
Moody’s Analytics
MORS Software
MST
Oracle
RiskSpan
Sageworks
SASSS&C Technologies
Wolters Kluwer
ZM Financial Systems
JHA: Jack Henry & Associates Source: Chartis Research
Figure 1 describes Chartis’s view of the vendor landscape for CECL technology solutions.
The FinTech Quadrant™ is a proprietary methodology developed specifically for the financial technology marketplace. It takes into account the product and technology capabilities of vendors, as well as their organizational capabilities.
Appendix A sets out the generic methodology and criteria used for the FinTech Quadrant™. Specifically, we have considered the following criteria as particularly important:

© Copyright Chartis Research Ltd 2018. All Rights Reserved 6
Completeness of offering:
• GL and accounting
• Classification of financial instruments
• ECL calculation
• Balance sheet management and optimization
• Data management
• Stress testing and variable analysis
• Model validation
• Technology
• Reporting
• Embedded knowledge
• Integration of finance and risk
• Provision of data
Market potential:
• Customer satisfaction
• Market penetration
• Growth strategy
• Financials
• Business model

© Copyright Chartis Research Ltd 2018. All Rights Reserved 7
3. SAS CECL technology solutions: capabilities and market position
Headquartered in Cary, North Carolina, analytics software developer SAS has more than 400 offices in 56 countries, and employs over 14,000 employees. It offers solutions that cover a range of enterprise risk management needs, including credit risk, market risk, asset liability management, operational risk and Governance, Risk and Compliance (GRC), liquidity risk, and financial crime.
On Chartis’ CECL vendor quadrant, suppliers with histories in credit risk and balance sheet management systems scored most highly. Organizational breadth and reach was key to the success of the highest ranked vendors, giving them a wealth of experience in implementing diverse accounting models. In particular, SAS’ experience in deploying IFRS 9 solutions prepared it well to deliver a strong CECL solution, as reflected in the company’s scoring on both the completeness of offering and market potential axes.
The handling and classification of financial instruments in SAS’ CECL solution was especially notable. It offers the capacity for Q factor trend analysis, backtesting and assessment, as well as workflow for adjustments allocation. The solution’s expected credit loss modeling is another point of note, building on SAS’ depth of experience in analytics. In addition, its lifetime loss estimation capability provides a full model risk management framework. SAS’ delivery platform makes integration of the CECL solution easier via its modular implementation, allowing the required software to be delivered rapidly on top of SAS’ underlying technical foundation.

© Copyright Chartis Research Ltd 2018. All Rights Reserved 8
4. Appendix A: FinTech Quadrant™ methodologyChartis is a research and advisory firm that provides technology and business advice to the global financial services industry. Chartis provides independent market intelligence regarding market dynamics, regulatory trends, technology trends, best practices, competitive landscapes, market sizes, expenditure priorities, and mergers and acquisitions. Chartis’s FinTech Quadrant™ reports are written by experienced analysts with hands-on experience of selecting, developing, and implementing financial technology solutions for a variety of international companies in a range of industries including banking, insurance and capital markets.
Chartis’s research clients include leading financial services firms and Fortune 500 companies, leading consulting firms and financial technology vendors. The FinTech vendors that are evaluated in the FinTech Quadrant™ reports can be Chartis clients or firms with whom Chartis has no relationship. Chartis evaluates all FinTech vendors using consistent and objective criteria, regardless of whether or not they are a Chartis client.
Where possible, FinTech vendors are given the opportunity to correct factual errors prior to publication, but cannot influence Chartis’s opinion. FinTech vendors cannot purchase or influence positive exposure.
Inclusion in the FinTech Quadrant™
Chartis seeks to include FinTech vendors that have a significant presence in a given target market. The significance may be due to market penetration (e.g. large client base) or innovative solutions. Chartis does not give preference to its own clients and does not request compensation for inclusion in a FinTech Quadrant™ report. Chartis utilizes detailed and domain-specific ‘vendor evaluation forms’ and briefing sessions to collect information about each vendor. If a vendor chooses not to respond to a Chartis vendor evaluation form, Chartis may still include the vendor in the report. Should this happen, Chartis will base its opinion on direct data collated from FinTech buyers and users, and from publicly available sources.
Research process
The findings and analyses in the FinTech Quadrant™ reports reflect our analysts’ considered opinions, along with research into market trends, participants, expenditure patterns, and best practices. The research lifecycle usually takes several months, and the analysis is validated through several phases of independent verification. Figure 2 describes the research process.
© Copyright Chartis Research Ltd 2018. All Rights Reserved 9
Figure 2: FinTech Quadrant™ research process
Data gathering
Select research topics
• Interviews with industry experts• Interviews with FinTech buyers• Interviews with FinTech vendors•
• Market surveys• Client feedback• Regulatory studies• Academic studies• Conferences •
• • • • FinTech buyer surveys and interviews
• Demand and supply side analysis• • Survey data analysis• Check references and validate vendor claims• Follow-up interviews with industry experts
• • Ongoing scan of the marketplace•
Source: Chartis Research
Chartis typically uses a combination of sources to gather market intelligence. These include (but are not limited to):
• Chartis vendor evaluation forms. A detailed set of questions covering functional and non-functional aspects of vendor solutions, as well as organizational and market factors. Chartis’s vendor evaluation forms are based on practitioner level expertise and input from real-life risk technology projects, implementations, and requirements analysis.
• Risk technology user surveys. As part of its ongoing research cycle, Chartis systematically surveys risk technology users and buyers, eliciting feedback on various risk technology vendors, satisfaction levels, and preferences.

© Copyright Chartis Research Ltd 2018. All Rights Reserved 10
• Interviews with subject matter experts. Once a research domain has been selected, Chartis undertakes comprehensive interviews and briefing sessions with leading industry experts, academics, and consultants on the specific domain to provide deep insight into market trends, vendor solutions, and evaluation criteria.
• Customer reference checks. These are telephone and/or email checks with named customers of selected vendors to validate strengths and weaknesses, and to assess post-sales satisfaction levels.
• Vendor briefing sessions. These are face-to-face and/or web-based briefings and product demonstrations by risk technology vendors. During these sessions, Chartis experts ask in depth, challenging questions to establish the real strengths and weaknesses of each vendor.
• Other third-party sources. sources In addition to the above, Chartis uses other third-party sources of information such as conferences, academic and regulatory studies, and collaboration with leading consulting firms and industry associations.
Evaluation criteria
The FinTech Quadrant™ (see Figure 3) evaluates vendors on two key dimensions:
1. Completeness of offering
2. Market potential
Figure 3: FinTech Quadrant™
Best-of-breed
Point solu�ons
Category leaders
Enterprise solu�ons
COMPLETENESS OF OFFERING
MA
RKET
PO
TEN
TIA
L
Source: Chartis Research

© Copyright Chartis Research Ltd 2018. All Rights Reserved 11
The generic evaluation criteria for each dimension are set out below. In addition to these generic criteria, Chartis utilizes domain-specific criteria relevant to each individual risk, which are available on request. This ensures total transparency in our methodology and allows readers to fully appreciate the rationale for our analysis.
Completeness of offering
• Depth of functionality. The level of sophistication and amount of detailed features in the software product (e.g. advanced risk models, detailed and flexible workflow, domain-specific content). Aspects assessed include: innovative functionality, practical relevance of features, user-friendliness, flexibility, and embedded intellectual property. High scores are given to those firms that achieve an appropriate balance between sophistication and user-friendliness. In addition, functionality linking risk to performance is given a positive score.
• Breadth of functionality. The spectrum of requirements covered as part of an enterprise risk management system. This will vary for each subject area, but special attention will be given to functionality covering regulatory requirements, multiple risk classes, multiple asset classes, multiple business lines, and multiple user types (e.g. risk analyst, business manager, CRO, CFO, Compliance Officer). Functionality within risk management systems and integration between front-office (customer-facing) and middle/back office (compliance, supervisory, and governance) risk management systems are also considered.
• Data management and technology infrastructure. The ability of risk management systems to interact with other systems and handle large volumes of data is considered to be very important. Data quality is often cited as a critical success factor and ease of data access, data integration, data storage, and data movement capabilities are all important factors. Particular attention is given to the use of modern data management technologies, architectures, and delivery methods relevant to risk management (e.g. in-memory databases, complex event processing, component-based architectures, cloud technology, software-as-a-service). Performance, scalability, security, and data governance are also important factors.
• Risk analytics. The computational power of the core system, the ability to analyze large amounts of complex data in a timely manner (where relevant in real time), and the ability to improve analytical performance are all important factors. Particular attention is given to the difference between ‘risk’ analytics and standard ‘business’ analytics. Risk analysis requires such capabilities as non-linear calculations, predictive modeling, simulations, scenario analysis, etc.
• Reporting and presentation layer. The ability to present information in a timely manner, the quality and flexibility of reporting tools, and ease of use are important for all risk management systems. Particular attention is given to the ability to do ad-hoc ‘on-the-fly’ queries (e.g. what-if-analysis), as well as the range of ‘out-of-the-box’ risk reports and dashboards.

© Copyright Chartis Research Ltd 2018. All Rights Reserved 12
Market potential
• Market penetration. Both volume (i.e. number of customers) and value (i.e. average deal size) are considered important. Also, rates of growth relative to sector growth rates are evaluated.
• Brand. Brand awareness, reputation, and the ability to leverage current market position to expand horizontally (with new offerings) or vertically (into new sectors) are evaluated.
• Momentum. Performance over the previous 12 months is evaluated, including financial performance, new product releases, quantity and quality of contract wins, and market expansion moves.
• Innovation. New ideas, functionality, and technologies to solve specific risk management problems are evaluated. Developing new products is only the first step in generating success. Speed to market, positioning, and translation into incremental revenues are critical success factors for exploitation of the new product. Chartis also evaluates business model or organizational innovation (i.e. not just product innovation).
• Customer satisfaction. Feedback from customers regarding after-sales support and service (e.g. training and ease of implementation), value for money (e.g. price to functionality ratio) and product updates (e.g. speed and process for keeping up to date with regulatory changes) is evaluated.
• Sales execution. The size and quality of sales force, sales distribution channels, global presence, focus on risk management, messaging, and positioning are all important factors.
• Implementation and support. Important factors include size and quality of implementation team, approach to software implementation, and post-sales support and training. Particular attention is given to ‘rapid’ implementation methodologies and ‘packaged’ services offerings.
• Thought-leadership. Business insight and understanding, new thinking, formulation and execution of best practices, and intellectual rigor are considered important by end users.
• Financial strength and stability. Revenue growth, profitability, sustainability, and financial backing (e.g. the ratio of license to consulting revenues) is considered as key to scalability of the business model for risk technology vendors.
Quadrant descriptions
Point solutions
• Point Solutions providers focus on a small number of component technology capabilities, meeting a critical need in the risk technology market by solving specific risk management problems with domain-specific software applications and technologies.
• They are often strong engines for innovation, as their deep focus on a relatively narrow area generates thought leadership and intellectual capital.

© Copyright Chartis Research Ltd 2018. All Rights Reserved 13
• By growing their enterprise functionality and utilizing integrated data management, analytics and BI capabilities, vendors in the Point Solutions category can expand their completeness of offering, market potential and market share.
Best-of-breed
• Best-of-Breed providers have best-in-class point solutions and the ability to capture significant market share in their chosen markets.
• They are often distinguished by a growing client base, superior sales and marketing execution, and a clear strategy for sustainable, profitable growth. High performers also have a demonstrable track record of R&D investment, together with specific product or ‘go-to-market’ capabilities needed to deliver a competitive advantage.
• Focused functionality will often see Best-of-Breed providers packaged together as part of a comprehensive enterprise risk technology architecture, co-existing with other solutions.
Enterprise solutions
• Enterprise Solutions providers typically offer risk management technology platforms, combining functionally-rich risk applications with comprehensive data management, analytics and BI.
• A key differentiator in this category is the openness and flexibility of the technology architecture and a ‘toolkit’ approach to risk analytics and reporting, which attracts larger clients.
• Enterprise Solutions are typically supported with comprehensive infrastructure and service capabilities, and best-in-class technology delivery. They also combine risk management content, data and software to provide an integrated ‘one-stop-shop’ for buyers.
Category leaders
• Category Leaders combine depth and breadth of functionality, technology and content with the required organizational characteristics to capture significant share in their market.
• Category Leaders demonstrate a clear strategy for sustainable, profitable growth, matched with best-in-class solutions and the range and diversity of offerings, sector coverage and financial strength to absorb demand volatility in specific industry sectors or geographic regions.
• Category Leaders will typically benefit from strong brand awareness, global reach and strong alliance strategies with leading consulting firms and systems integrators.
© Copyright Chartis Research Ltd 2018. All Rights Reserved 14
5. Further reading• Spotlight on the CECL Reporting Standard
• IFRS 9 Technology Solutions: Market Update 2017
• Data Integrity and Control in Financial Services: Market Update 2018
• Balance Sheet Management Technology 2018
• RiskTech100® 2018
For all these reports see www.chartis-research.com.