ccil all sovereign bonds index (casbi) · 2010-07-06 · ccil all sovereign bonds index (casbi)...
TRANSCRIPT
CCIL All Sovereign Bonds Index (CASBI) Golaka C Nath, Gaurav Yadav and Aparna Vachharajani∗
Introduction Government securities dominate the Indian bond market both in terms of outstanding stock
as well as turnover. The major investors in government securities are banks, insurance
companies, mutual funds, provident/ pension funds, etc. The Reserve Bank of India (RBI)
has been consciously focusing on the development of the government securities markets
through carefully and cautiously sequenced measures within a clear-cut agenda for
developing primary and secondary market in terms of structural design, infrastructure,
enlargement of participants and products, sound trading and settlement practices,
dissemination of market information, prudential guidelines on valuation, accounting and
disclosure. The basic objective has been to improve liquidity in the secondary market so that
primary market investors can exit the market whenever they would like to. Liquidity in the
government securities market is of critical importance in the move towards indirect
instruments of monetary policy.
There have been major policy changes in recent years to improve efficiency in the
government bond market. Introduction of primary dealers (PDs) system, operationalization
of Negotiated Dealing System (NDS) of RBI, starting of centralized clearing and settlement
of gilts by Clearing Corporation of India Ltd. (CCIL), initiating a structured daily liquidity
adjustment facility through repo and reverse repo for moderating availability of short term
optimum funds in the system, introducing an order matching system for gilts through NDS,
phasing out non-bank participants from the call money market, intraday short selling for
banks and PDs, revised guidelines for underwriting by PDs, etc. are some of the important
initiatives of the central bank.
Secondary Market Outcome
Hardening of interest rate resulted in banks moving most of their investment to “Held Till
Maturity” subject to the level of reaching 25% of NDTL for the category. There has been
∗ Dr. Nath is Vice-President, Mr. Yadav and Ms. Vachharajani are Senior Executive Officers, Eco. Research & Surveillance Dept. CCIL
fall in outright trading volumes through the transaction under repo has increased as given in
Table-1.
Table-1: Trading Volumes in Secondary Market Year Outright Repo No. of Trades Value (Rs. Cr) No. of Trades Value (Rs. Cr) 2002-03 191843 1076147 11672 4682292003-04 243585 1575133 20927 9431892004-05 160682 1134222 24364 15579062005-06 125509 864751 25673 1694509
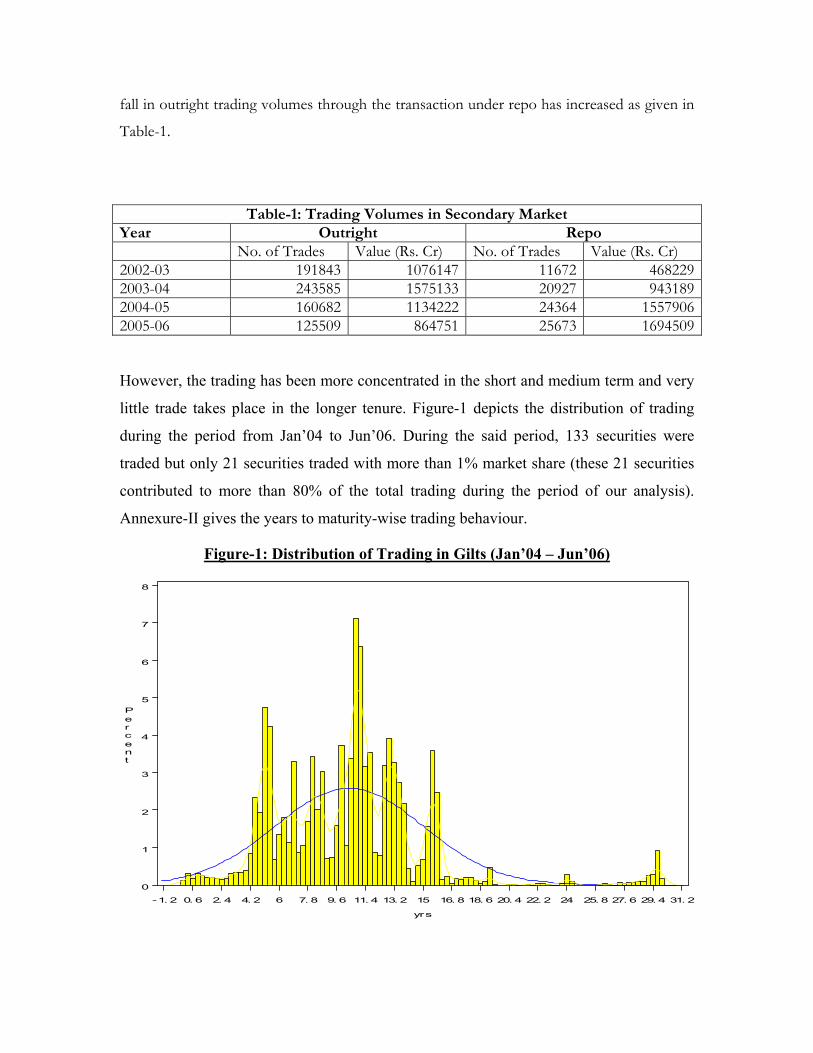
However, the trading has been more concentrated in the short and medium term and very
little trade takes place in the longer tenure. Figure-1 depicts the distribution of trading
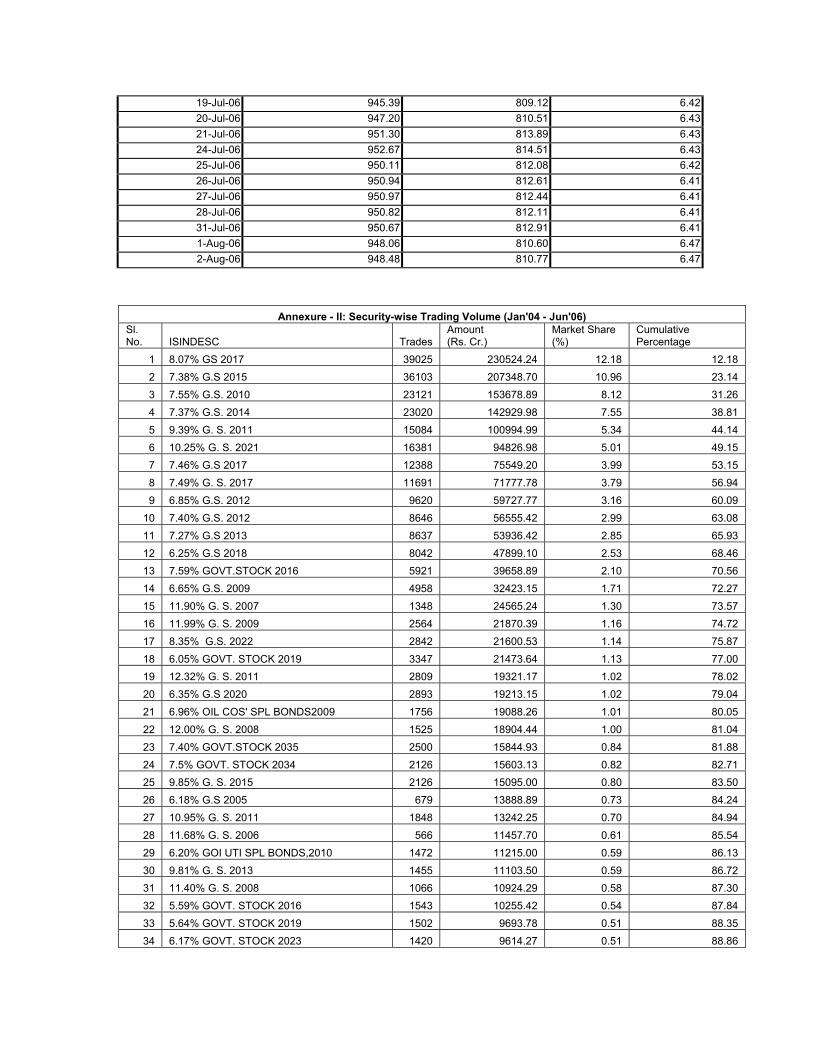
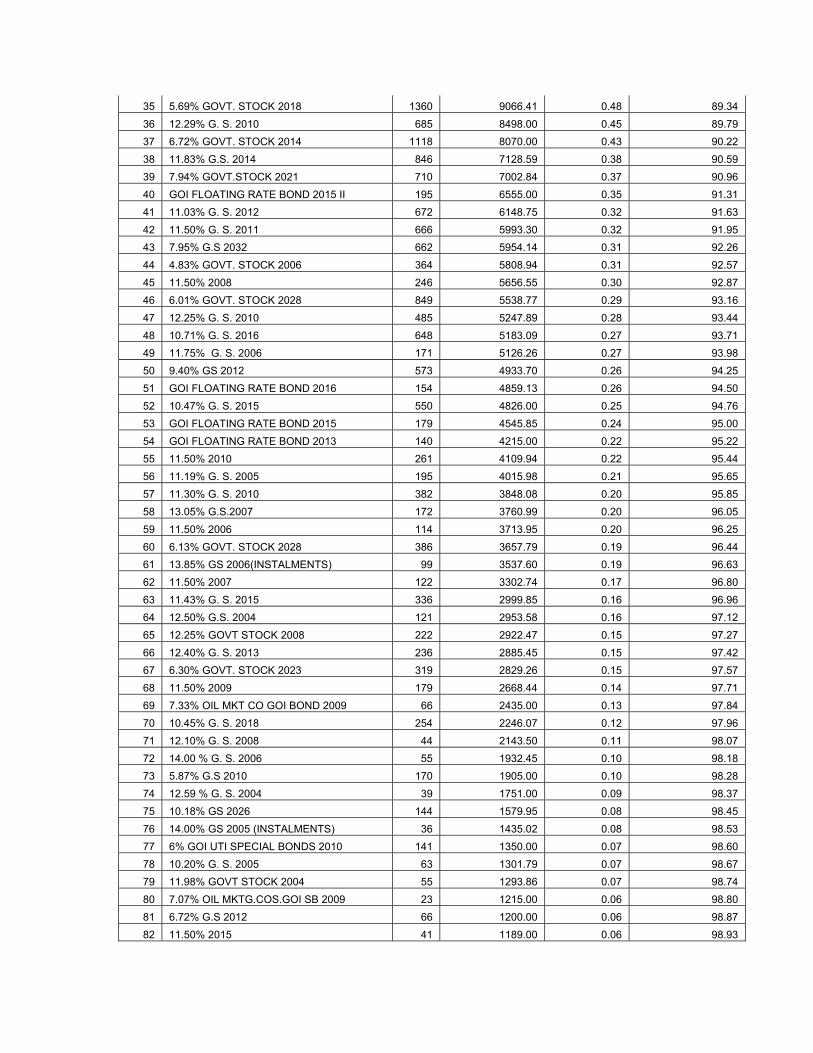
during the period from Jan’04 to Jun’06. During the said period, 133 securities were
traded but only 21 securities traded with more than 1% market share (these 21 securities
contributed to more than 80% of the total trading during the period of our analysis).
Annexure-II gives the years to maturity-wise trading behaviour.
Figure-1: Distribution of Trading in Gilts (Jan’04 – Jun’06)
-1. 2 0. 6 2. 4 4. 2 6 7. 8 9. 6 11. 4 13. 2 15 16. 8 18. 6 20. 4 22. 2 24 25. 8 27. 6 29. 4 31. 2
0
1
2
3
4
5
6
7
8
Percent
yrs
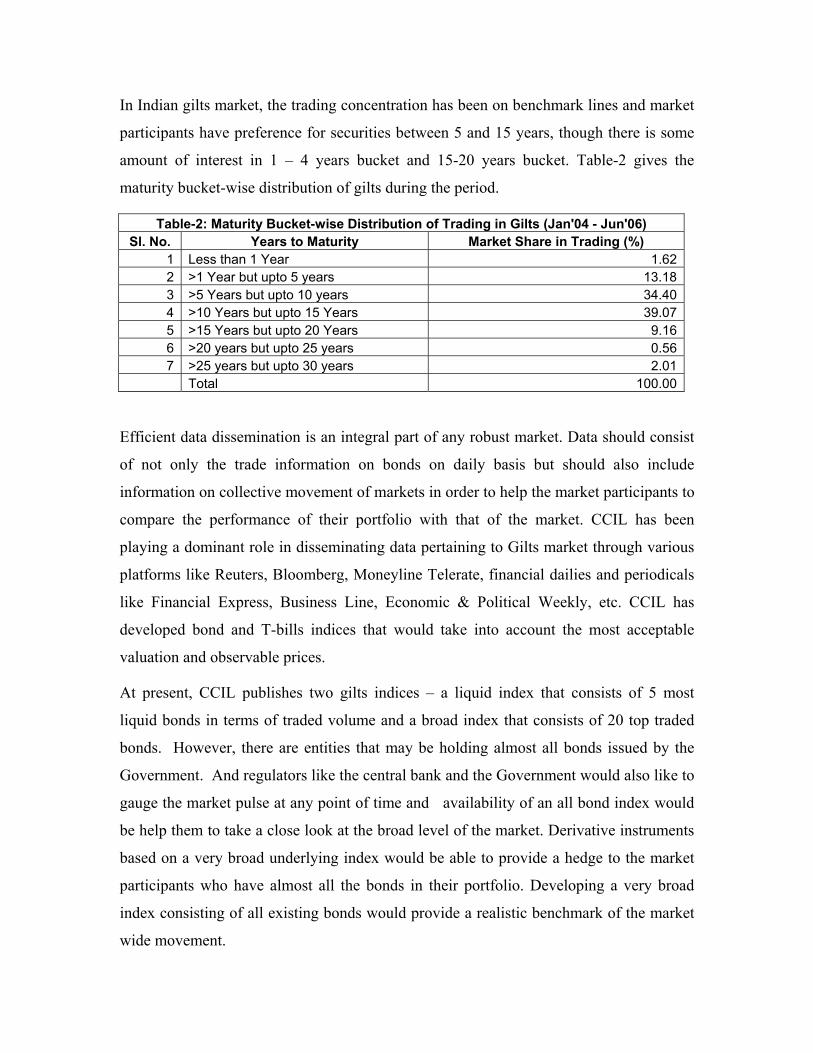
In Indian gilts market, the trading concentration has been on benchmark lines and market
participants have preference for securities between 5 and 15 years, though there is some
amount of interest in 1 – 4 years bucket and 15-20 years bucket. Table-2 gives the
maturity bucket-wise distribution of gilts during the period.
Table-2: Maturity Bucket-wise Distribution of Trading in Gilts (Jan'04 - Jun'06) Sl. No. Years to Maturity Market Share in Trading (%)
1 Less than 1 Year 1.622 >1 Year but upto 5 years 13.183 >5 Years but upto 10 years 34.404 >10 Years but upto 15 Years 39.075 >15 Years but upto 20 Years 9.166 >20 years but upto 25 years 0.567 >25 years but upto 30 years 2.01
Total 100.00
Efficient data dissemination is an integral part of any robust market. Data should consist
of not only the trade information on bonds on daily basis but should also include
information on collective movement of markets in order to help the market participants to
compare the performance of their portfolio with that of the market. CCIL has been
playing a dominant role in disseminating data pertaining to Gilts market through various
platforms like Reuters, Bloomberg, Moneyline Telerate, financial dailies and periodicals
like Financial Express, Business Line, Economic & Political Weekly, etc. CCIL has
developed bond and T-bills indices that would take into account the most acceptable
valuation and observable prices.
At present, CCIL publishes two gilts indices – a liquid index that consists of 5 most
liquid bonds in terms of traded volume and a broad index that consists of 20 top traded
bonds. However, there are entities that may be holding almost all bonds issued by the
Government. And regulators like the central bank and the Government would also like to
gauge the market pulse at any point of time and availability of an all bond index would
be help them to take a close look at the broad level of the market. Derivative instruments
based on a very broad underlying index would be able to provide a hedge to the market
participants who have almost all the bonds in their portfolio. Developing a very broad
index consisting of all existing bonds would provide a realistic benchmark of the market
wide movement.
The indices are regarded as a general indicator for market performance. Most financial
and real asset markets usually monitor the performance of the market using indices
designed to monitor the general health. They also form a crucial input to the design of
security portfolio of investors. Economists and statisticians use these indices to study
trends of growth pattern in economies.
Construction and Methodology
A good index should correctly represent the market scenario. The total returns of the
index must be replicable by the market participants, i.e. investors must be able to
construct a portfolio with similar returns as the index. It should be transparent and all
changes should be easily understood and easily predictable. The sovereign bond index is
expected to track the changes in the market condition and provide hedging possibilities to
market participants. A well constructed bond index is a good mirror of the economic
policy changes of the government and structural reforms that will have bearing on the
interest rate in the economy. Under these circumstances it will serve as a useful aid to
predict the impact of macroeconomic policy decisions on interest rate movement.
Presently, the two gilts indices, CCIL BROAD and CCIL LIQUID, are developed and
owned by CCIL. These indices are market capitalization based indices and are rebalanced
on the first day of every month. The indices do not take into account the special securities
like Oil bonds, embedded options securities, etc. Only securities that have at least three
remaining coupon cycles are considered for inclusion in the index.
The proposed all bond indices would be taking into account all outstanding bonds at the
beginning of the month subject to the conditionality of 3 remaining coupon cycles. The
indices would be market capitalization based and would track both total and principal
returns. The total return index is the absolute return that the bond portfolio offers and it
includes both coupon accrued and capital gains / (losses). The total return index for an
individual bond is calculated each market day by increasing the previous market day’ s
index value by the percentage change in bond’ s gross price. The gross price of a bond is
its net price plus accrued interest. The gross price must be adjusted for loss of accrued
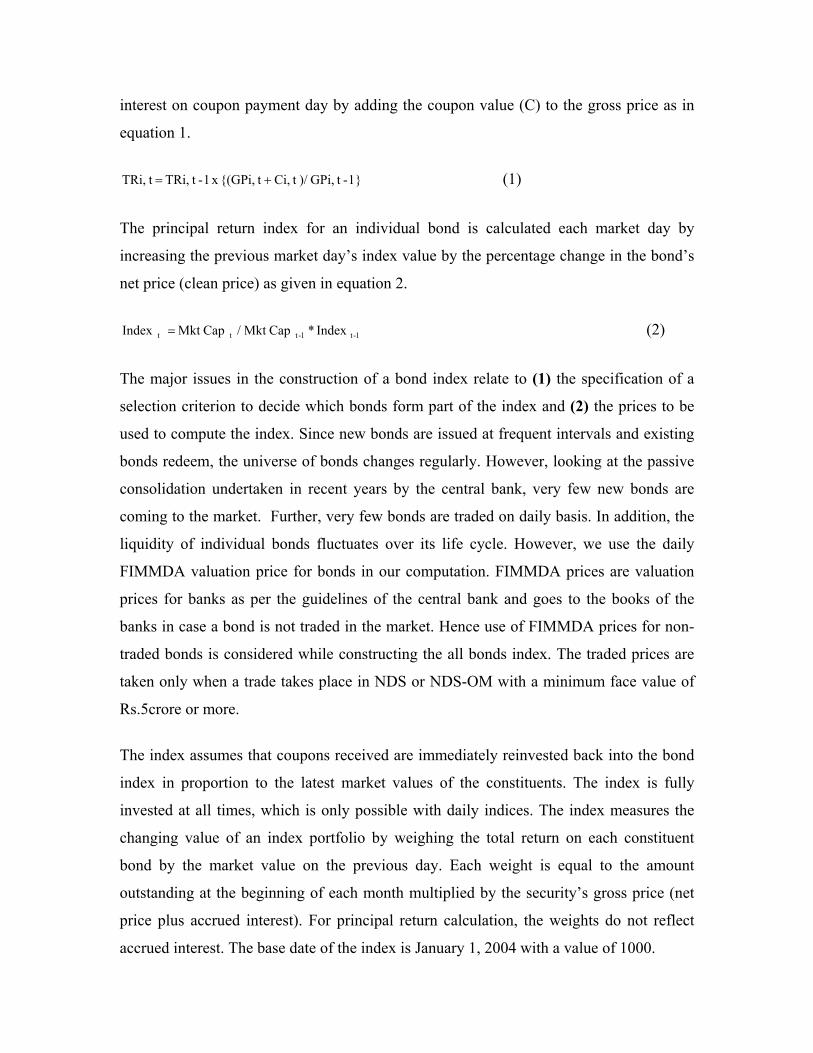
interest on coupon payment day by adding the coupon value (C) to the gross price as in
equation 1.
} 1-tGPi,)/ t Ci, t {(GPi, x 1-tTRi, t TRi, += (1)
The principal return index for an individual bond is calculated each market day by
increasing the previous market day’s index value by the percentage change in the bond’s
net price (clean price) as given in equation 2.
1- t1-ttt Index * CapMkt / CapMkt Index = (2)
The major issues in the construction of a bond index relate to (1) the specification of a
selection criterion to decide which bonds form part of the index and (2) the prices to be
used to compute the index. Since new bonds are issued at frequent intervals and existing
bonds redeem, the universe of bonds changes regularly. However, looking at the passive
consolidation undertaken in recent years by the central bank, very few new bonds are
coming to the market. Further, very few bonds are traded on daily basis. In addition, the
liquidity of individual bonds fluctuates over its life cycle. However, we use the daily
FIMMDA valuation price for bonds in our computation. FIMMDA prices are valuation
prices for banks as per the guidelines of the central bank and goes to the books of the
banks in case a bond is not traded in the market. Hence use of FIMMDA prices for non-
traded bonds is considered while constructing the all bonds index. The traded prices are
taken only when a trade takes place in NDS or NDS-OM with a minimum face value of
Rs.5crore or more.
The index assumes that coupons received are immediately reinvested back into the bond
index in proportion to the latest market values of the constituents. The index is fully
invested at all times, which is only possible with daily indices. The index measures the
changing value of an index portfolio by weighing the total return on each constituent
bond by the market value on the previous day. Each weight is equal to the amount
outstanding at the beginning of each month multiplied by the security’s gross price (net
price plus accrued interest). For principal return calculation, the weights do not reflect
accrued interest. The base date of the index is January 1, 2004 with a value of 1000.
Portfolio Rebalancing
The index constructed has the ability to add new issues and also have the provision to
remove old issues when redeemed. Any change in the outstanding amount of a bond issue
due to re-issue has to be accounted only at the beginning of the next month. The basket of
the bonds is reviewed on a monthly frequency. During the month the daily index is
computed using the same basket of bonds. New issues are not included immediately in
the portfolio as their prices is said to be volatile and would contain noise. New issues
during the month are updated for the index portfolio only at the beginning of the next
month.
Duration of the index is calculated as the weighted average duration of individual bonds in the basket.
DiWi D
n
1i∑==
where Di is the duration of the component bond i and Wi is the relevant weight based on
market capitalization of bond i.
The market index should be constructed such that it reflects the experience of the average
holder of the market port-folio. The approach of the index funds to purchase all securities
in the index in the same proportion as they are held in that index is not feasible for fixed
income funds due to the large number of securities in the index, illiquidity of a significant
portion of all securities contained in bond index. The more practical approach to setting
up an Index Fund is to select a basket of securities, whose aggregate profile
characteristics (such as portfolio yield, duration and convexity) and expected total return
match those of an index.
The non-systematic risk is the risk associated with owing a limited number of securities
in a portfolio; total return of any portfolio is explained partly by the total return of a
market index and partly by the unique feature of individual securities in that portfolio.
Such error and the impact on realized error of price differential is minimized in large
index funds with many securities because the positive price differential in one security is
often offset by the negative price differential in another security.
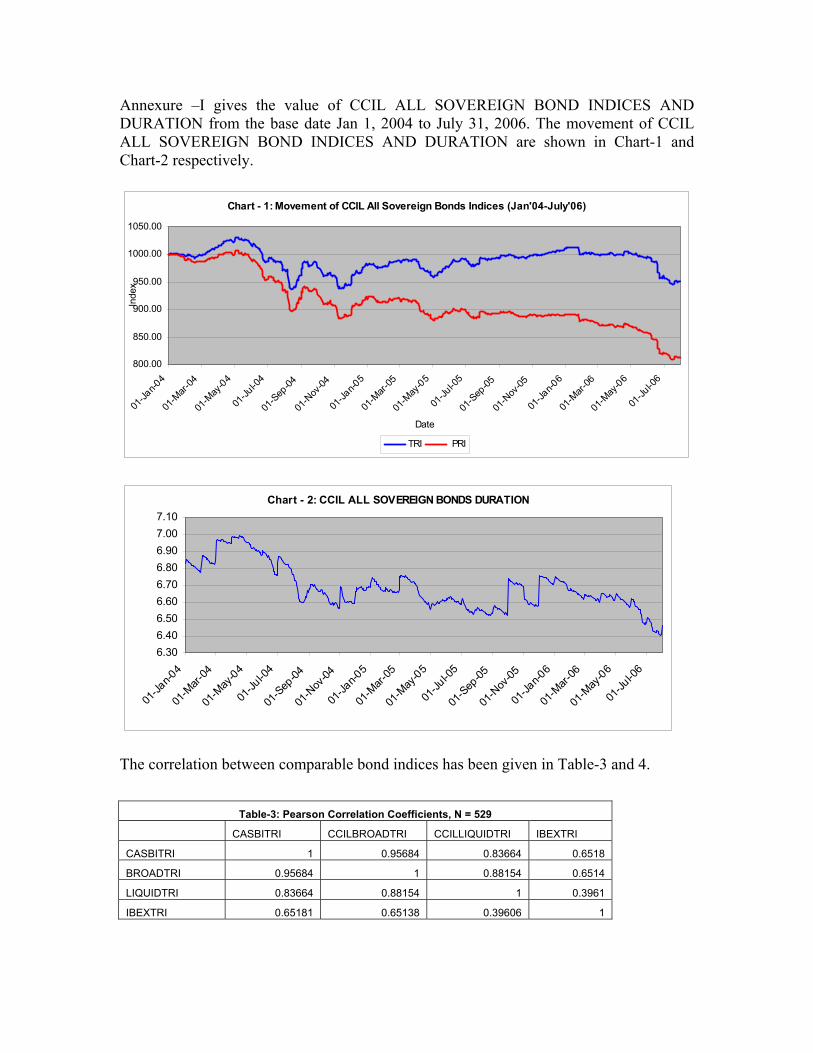
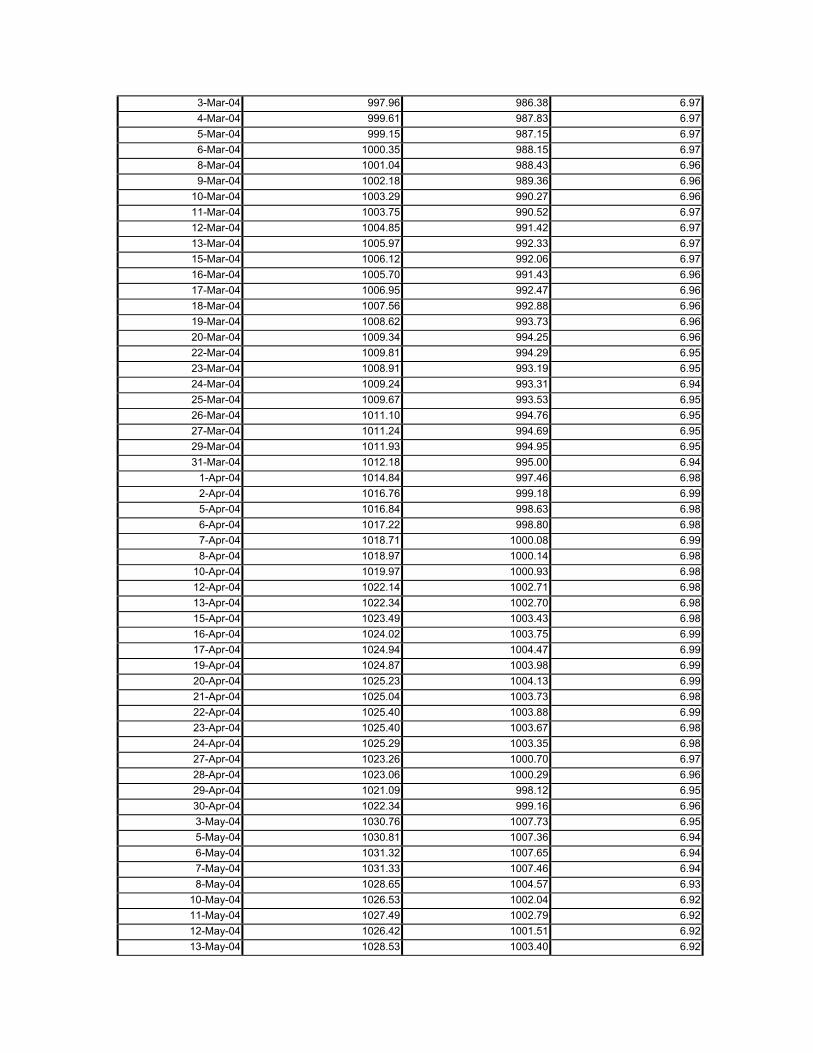
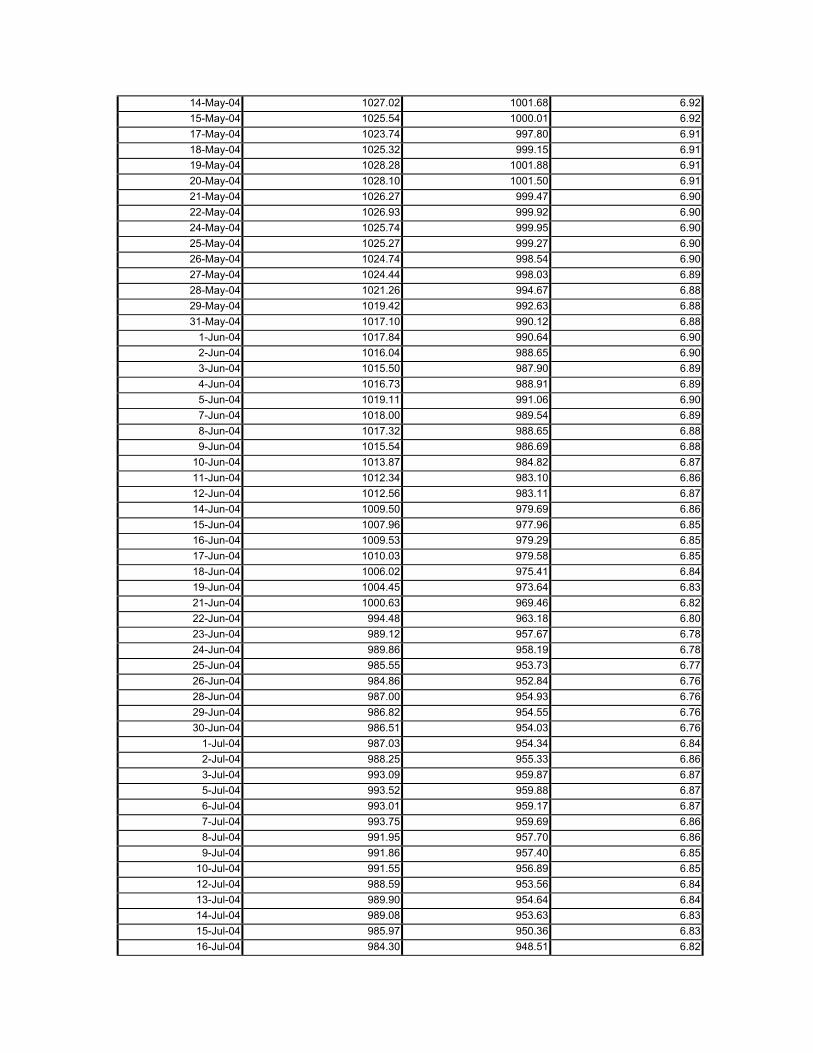
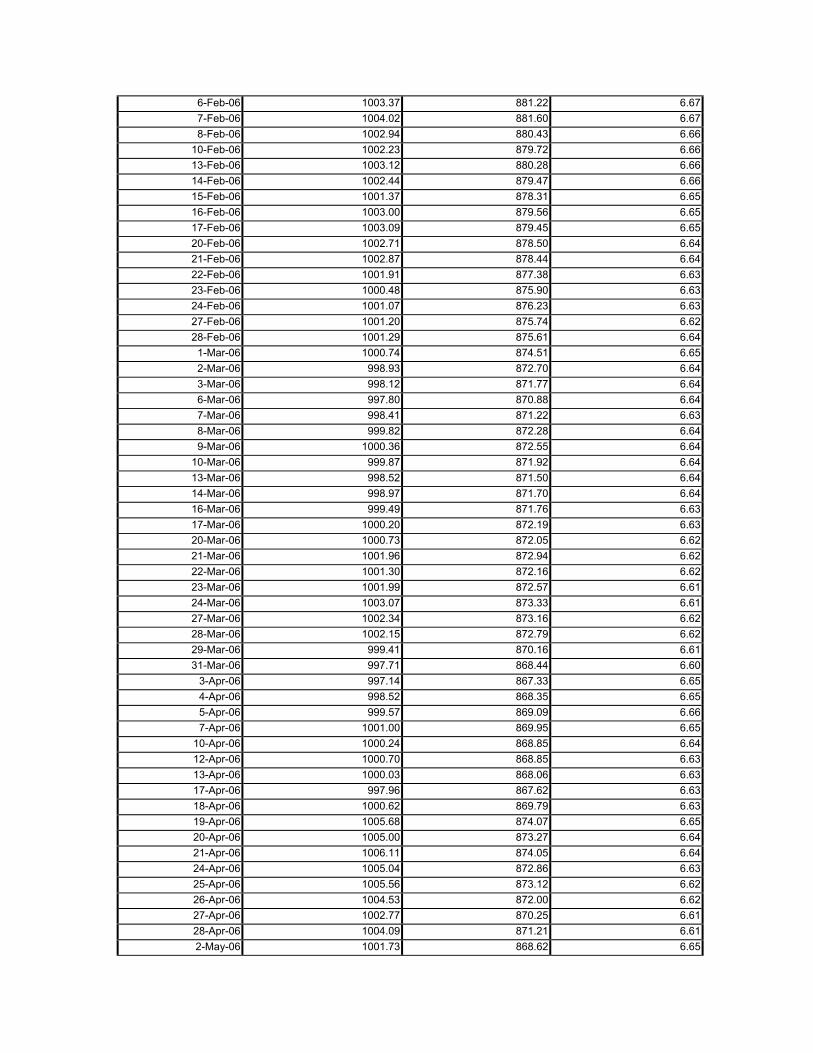
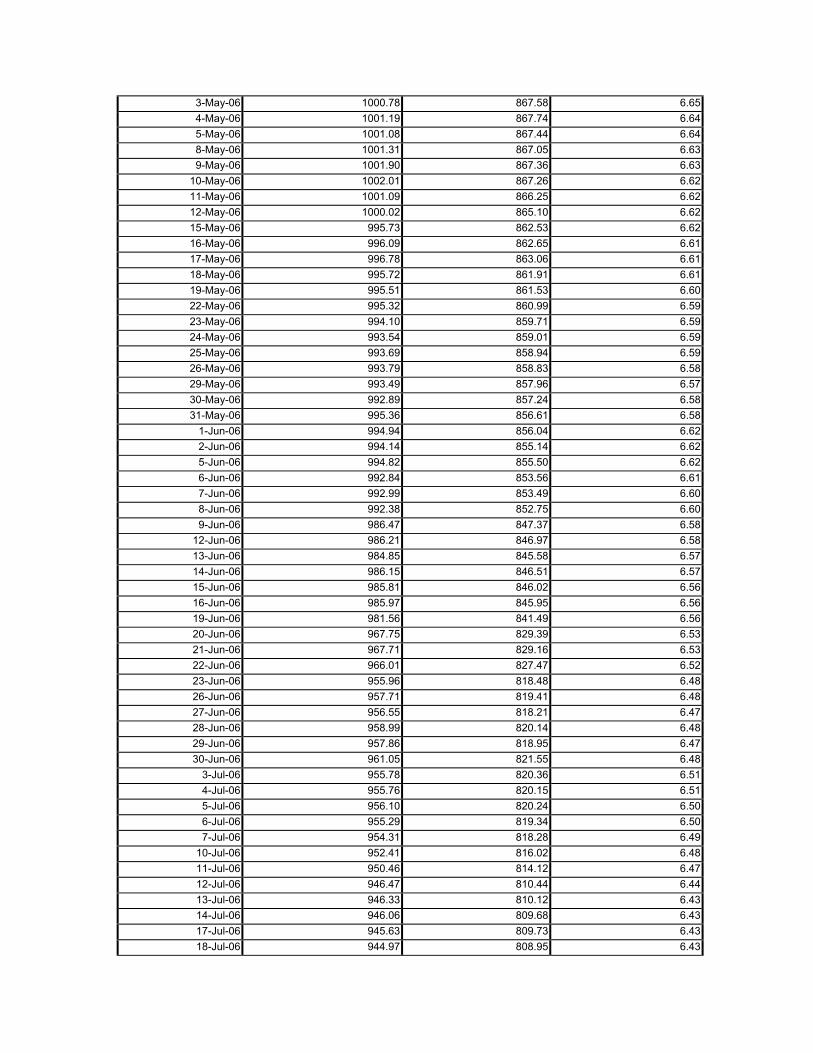
Annexure –I gives the value of CCIL ALL SOVEREIGN BOND INDICES AND DURATION from the base date Jan 1, 2004 to July 31, 2006. The movement of CCIL ALL SOVEREIGN BOND INDICES AND DURATION are shown in Chart-1 and Chart-2 respectively.
Chart - 1: Movement of CCIL All Sovereign Bonds Indices (Jan'04-July'06)
800.00
850.00
900.00
950.00
1000.00
1050.00
01-Ja
n-04
01-M
ar-04
01-M
ay-04
01-Ju
l-04
01-S
ep-04
01-N
ov-04
01-Ja
n-05
01-M
ar-05
01-M
ay-05
01-Ju
l-05
01-S
ep-05
01-N
ov-05
01-Ja
n-06
01-M
ar-06
01-M
ay-06
01-Ju
l-06
Date
Inde
x
TRI PRI
Chart - 2: CCIL ALL SOVEREIGN BONDS DURATION
6.306.406.506.606.706.806.907.007.10
01-Ja
n-04
01-M
ar-04
01-M
ay-04
01-Ju
l-04
01-S
ep-04
01-N
ov-04
01-Ja
n-05
01-M
ar-05
01-M
ay-05
01-Ju
l-05
01-S
ep-05
01-N
ov-05
01-Ja
n-06
01-M
ar-06
01-M
ay-06
01-Ju
l-06
The correlation between comparable bond indices has been given in Table-3 and 4.
Table-3: Pearson Correlation Coefficients, N = 529
CASBITRI CCILBROADTRI CCILLIQUIDTRI IBEXTRI
CASBITRI 1 0.95684 0.83664 0.6518
BROADTRI 0.95684 1 0.88154 0.6514
LIQUIDTRI 0.83664 0.88154 1 0.3961
IBEXTRI 0.65181 0.65138 0.39606 1
There is a very high correlation between all CCIL indices though the IBEX TRI (ICICI Securities) has only 40% correlation with CCIL LIQUID TRI but it has more than 65% correlation with the CASBI TRI.
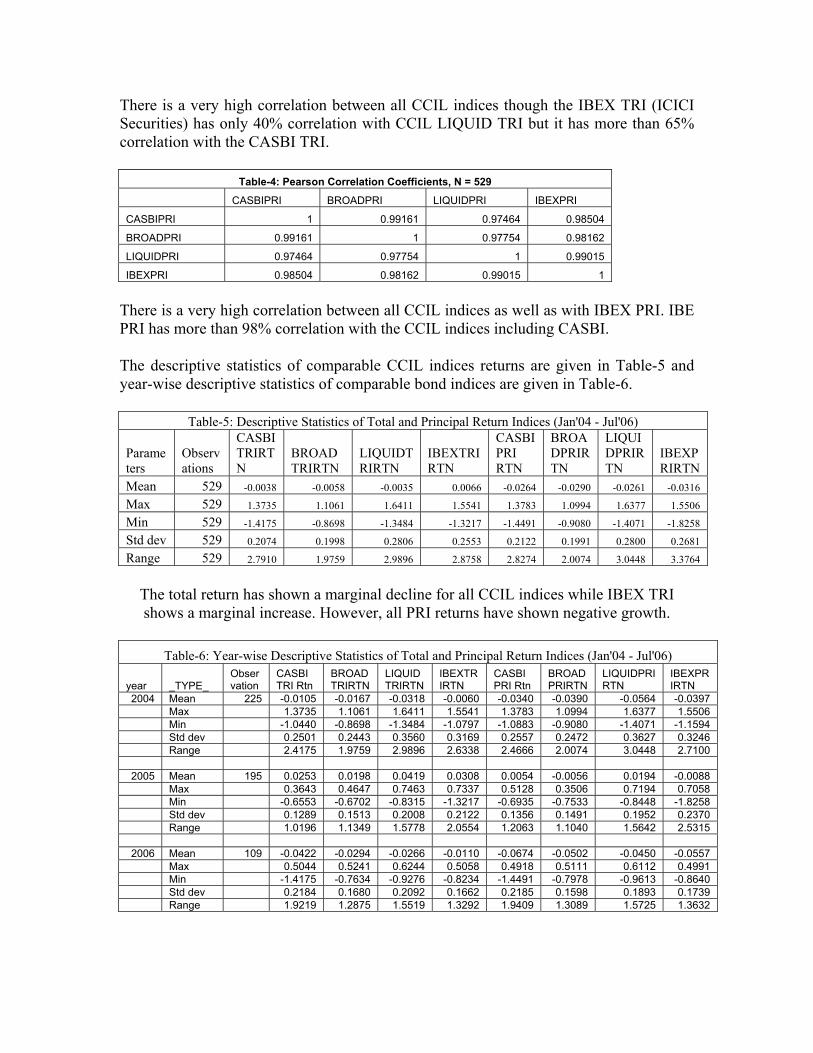
Table-4: Pearson Correlation Coefficients, N = 529
CASBIPRI BROADPRI LIQUIDPRI IBEXPRI
CASBIPRI 1 0.99161 0.97464 0.98504
BROADPRI 0.99161 1 0.97754 0.98162
LIQUIDPRI 0.97464 0.97754 1 0.99015
IBEXPRI 0.98504 0.98162 0.99015 1
There is a very high correlation between all CCIL indices as well as with IBEX PRI. IBE PRI has more than 98% correlation with the CCIL indices including CASBI.
The descriptive statistics of comparable CCIL indices returns are given in Table-5 and year-wise descriptive statistics of comparable bond indices are given in Table-6.
Table-5: Descriptive Statistics of Total and Principal Return Indices (Jan'04 - Jul'06)
Parameters
Observations
CASBITRIRTN
BROADTRIRTN
LIQUIDTRIRTN
IBEXTRIRTN
CASBI PRI RTN
BROADPRIRTN
LIQUIDPRIRTN
IBEXPRIRTN
Mean 529 -0.0038 -0.0058 -0.0035 0.0066 -0.0264 -0.0290 -0.0261 -0.0316 Max 529 1.3735 1.1061 1.6411 1.5541 1.3783 1.0994 1.6377 1.5506 Min 529 -1.4175 -0.8698 -1.3484 -1.3217 -1.4491 -0.9080 -1.4071 -1.8258 Std dev 529 0.2074 0.1998 0.2806 0.2553 0.2122 0.1991 0.2800 0.2681 Range 529 2.7910 1.9759 2.9896 2.8758 2.8274 2.0074 3.0448 3.3764
The total return has shown a marginal decline for all CCIL indices while IBEX TRI shows a marginal increase. However, all PRI returns have shown negative growth.
Table-6: Year-wise Descriptive Statistics of Total and Principal Return Indices (Jan'04 - Jul'06)
year _TYPE_ Observation
CASBI TRI Rtn
BROADTRIRTN
LIQUIDTRIRTN
IBEXTRIRTN
CASBI PRI Rtn
BROADPRIRTN
LIQUIDPRIRTN
IBEXPRIRTN
2004 Mean 225 -0.0105 -0.0167 -0.0318 -0.0060 -0.0340 -0.0390 -0.0564 -0.0397 Max 1.3735 1.1061 1.6411 1.5541 1.3783 1.0994 1.6377 1.5506 Min -1.0440 -0.8698 -1.3484 -1.0797 -1.0883 -0.9080 -1.4071 -1.1594 Std dev 0.2501 0.2443 0.3560 0.3169 0.2557 0.2472 0.3627 0.3246 Range 2.4175 1.9759 2.9896 2.6338 2.4666 2.0074 3.0448 2.7100 2005 Mean 195 0.0253 0.0198 0.0419 0.0308 0.0054 -0.0056 0.0194 -0.0088
Max 0.3643 0.4647 0.7463 0.7337 0.5128 0.3506 0.7194 0.7058 Min -0.6553 -0.6702 -0.8315 -1.3217 -0.6935 -0.7533 -0.8448 -1.8258 Std dev 0.1289 0.1513 0.2008 0.2122 0.1356 0.1491 0.1952 0.2370 Range 1.0196 1.1349 1.5778 2.0554 1.2063 1.1040 1.5642 2.5315 2006 Mean 109 -0.0422 -0.0294 -0.0266 -0.0110 -0.0674 -0.0502 -0.0450 -0.0557
Max 0.5044 0.5241 0.6244 0.5058 0.4918 0.5111 0.6112 0.4991 Min -1.4175 -0.7634 -0.9276 -0.8234 -1.4491 -0.7978 -0.9613 -0.8640 Std dev 0.2184 0.1680 0.2092 0.1662 0.2185 0.1598 0.1893 0.1739 Range 1.9219 1.2875 1.5519 1.3292 1.9409 1.3089 1.5725 1.3632
Conclusion:
In view of the growth in importance of debt market funds and to measure the
performance of various funds, the market needs a benchmark against which the
performance of a debt fund can be judged. The CCIL ALL SOVEREIGN BOND INDEX
(CASBI) that reflects the broad movement of the market as it contains all available
sovereign bonds can form such a benchmark. It has been constructed based on the view
that movements in the index should reflect returns to an investor from movements in
interest rate rather than any idiosyncratic factors. The new index would be very useful for
entities which have exposure to almost all bonds issued by the Government.
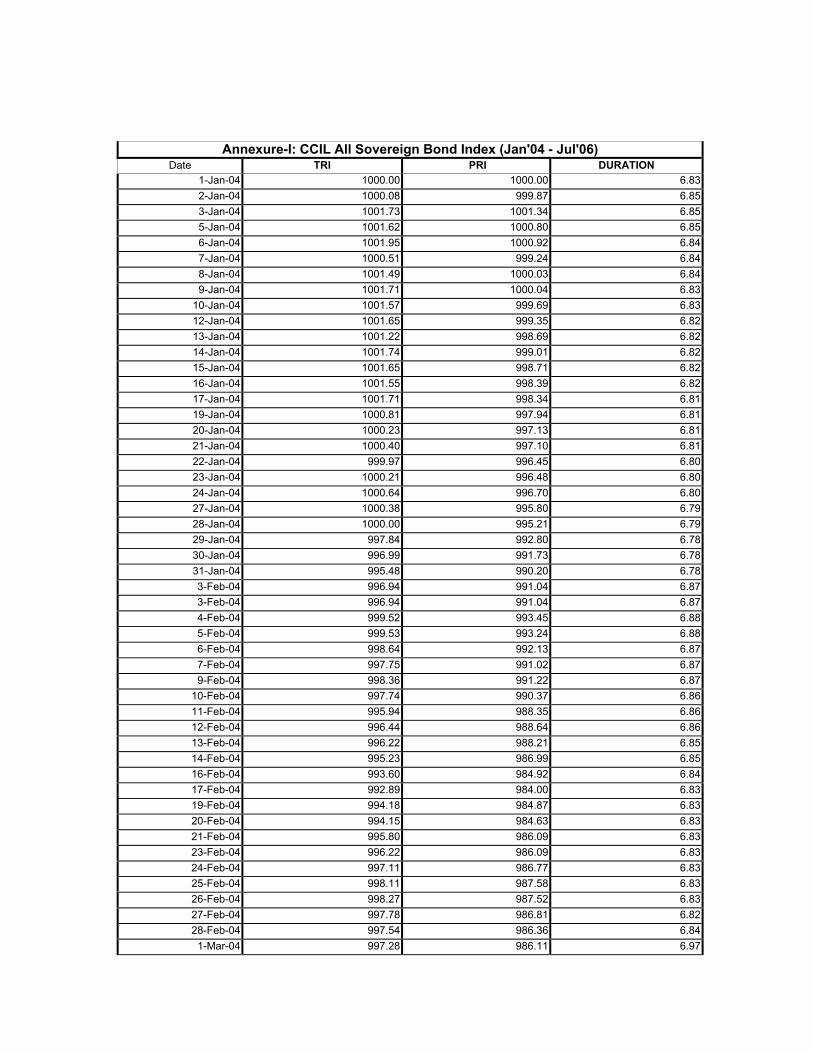
Annexure-I: CCIL All Sovereign Bond Index (Jan'04 - Jul'06) Date TRI PRI DURATION
1-Jan-04 1000.00 1000.00 6.832-Jan-04 1000.08 999.87 6.853-Jan-04 1001.73 1001.34 6.855-Jan-04 1001.62 1000.80 6.856-Jan-04 1001.95 1000.92 6.847-Jan-04 1000.51 999.24 6.848-Jan-04 1001.49 1000.03 6.849-Jan-04 1001.71 1000.04 6.83
10-Jan-04 1001.57 999.69 6.8312-Jan-04 1001.65 999.35 6.8213-Jan-04 1001.22 998.69 6.8214-Jan-04 1001.74 999.01 6.8215-Jan-04 1001.65 998.71 6.8216-Jan-04 1001.55 998.39 6.8217-Jan-04 1001.71 998.34 6.8119-Jan-04 1000.81 997.94 6.8120-Jan-04 1000.23 997.13 6.8121-Jan-04 1000.40 997.10 6.8122-Jan-04 999.97 996.45 6.8023-Jan-04 1000.21 996.48 6.8024-Jan-04 1000.64 996.70 6.8027-Jan-04 1000.38 995.80 6.7928-Jan-04 1000.00 995.21 6.7929-Jan-04 997.84 992.80 6.7830-Jan-04 996.99 991.73 6.7831-Jan-04 995.48 990.20 6.783-Feb-04 996.94 991.04 6.873-Feb-04 996.94 991.04 6.874-Feb-04 999.52 993.45 6.885-Feb-04 999.53 993.24 6.886-Feb-04 998.64 992.13 6.877-Feb-04 997.75 991.02 6.879-Feb-04 998.36 991.22 6.87
10-Feb-04 997.74 990.37 6.8611-Feb-04 995.94 988.35 6.8612-Feb-04 996.44 988.64 6.8613-Feb-04 996.22 988.21 6.8514-Feb-04 995.23 986.99 6.8516-Feb-04 993.60 984.92 6.8417-Feb-04 992.89 984.00 6.8319-Feb-04 994.18 984.87 6.8320-Feb-04 994.15 984.63 6.8321-Feb-04 995.80 986.09 6.8323-Feb-04 996.22 986.09 6.8324-Feb-04 997.11 986.77 6.8325-Feb-04 998.11 987.58 6.8326-Feb-04 998.27 987.52 6.8327-Feb-04 997.78 986.81 6.8228-Feb-04 997.54 986.36 6.84
1-Mar-04 997.28 986.11 6.97
3-Mar-04 997.96 986.38 6.974-Mar-04 999.61 987.83 6.975-Mar-04 999.15 987.15 6.976-Mar-04 1000.35 988.15 6.978-Mar-04 1001.04 988.43 6.969-Mar-04 1002.18 989.36 6.96
10-Mar-04 1003.29 990.27 6.9611-Mar-04 1003.75 990.52 6.9712-Mar-04 1004.85 991.42 6.9713-Mar-04 1005.97 992.33 6.9715-Mar-04 1006.12 992.06 6.9716-Mar-04 1005.70 991.43 6.9617-Mar-04 1006.95 992.47 6.9618-Mar-04 1007.56 992.88 6.9619-Mar-04 1008.62 993.73 6.9620-Mar-04 1009.34 994.25 6.9622-Mar-04 1009.81 994.29 6.9523-Mar-04 1008.91 993.19 6.9524-Mar-04 1009.24 993.31 6.9425-Mar-04 1009.67 993.53 6.9526-Mar-04 1011.10 994.76 6.9527-Mar-04 1011.24 994.69 6.9529-Mar-04 1011.93 994.95 6.9531-Mar-04 1012.18 995.00 6.94
1-Apr-04 1014.84 997.46 6.982-Apr-04 1016.76 999.18 6.995-Apr-04 1016.84 998.63 6.986-Apr-04 1017.22 998.80 6.987-Apr-04 1018.71 1000.08 6.998-Apr-04 1018.97 1000.14 6.98
10-Apr-04 1019.97 1000.93 6.9812-Apr-04 1022.14 1002.71 6.9813-Apr-04 1022.34 1002.70 6.9815-Apr-04 1023.49 1003.43 6.9816-Apr-04 1024.02 1003.75 6.9917-Apr-04 1024.94 1004.47 6.9919-Apr-04 1024.87 1003.98 6.9920-Apr-04 1025.23 1004.13 6.9921-Apr-04 1025.04 1003.73 6.9822-Apr-04 1025.40 1003.88 6.9923-Apr-04 1025.40 1003.67 6.9824-Apr-04 1025.29 1003.35 6.9827-Apr-04 1023.26 1000.70 6.9728-Apr-04 1023.06 1000.29 6.9629-Apr-04 1021.09 998.12 6.9530-Apr-04 1022.34 999.16 6.963-May-04 1030.76 1007.73 6.955-May-04 1030.81 1007.36 6.946-May-04 1031.32 1007.65 6.947-May-04 1031.33 1007.46 6.948-May-04 1028.65 1004.57 6.93
10-May-04 1026.53 1002.04 6.9211-May-04 1027.49 1002.79 6.9212-May-04 1026.42 1001.51 6.9213-May-04 1028.53 1003.40 6.92
14-May-04 1027.02 1001.68 6.9215-May-04 1025.54 1000.01 6.9217-May-04 1023.74 997.80 6.9118-May-04 1025.32 999.15 6.9119-May-04 1028.28 1001.88 6.9120-May-04 1028.10 1001.50 6.9121-May-04 1026.27 999.47 6.9022-May-04 1026.93 999.92 6.9024-May-04 1025.74 999.95 6.9025-May-04 1025.27 999.27 6.9026-May-04 1024.74 998.54 6.9027-May-04 1024.44 998.03 6.8928-May-04 1021.26 994.67 6.8829-May-04 1019.42 992.63 6.8831-May-04 1017.10 990.12 6.88
1-Jun-04 1017.84 990.64 6.902-Jun-04 1016.04 988.65 6.903-Jun-04 1015.50 987.90 6.894-Jun-04 1016.73 988.91 6.895-Jun-04 1019.11 991.06 6.907-Jun-04 1018.00 989.54 6.898-Jun-04 1017.32 988.65 6.889-Jun-04 1015.54 986.69 6.88
10-Jun-04 1013.87 984.82 6.8711-Jun-04 1012.34 983.10 6.8612-Jun-04 1012.56 983.11 6.8714-Jun-04 1009.50 979.69 6.8615-Jun-04 1007.96 977.96 6.8516-Jun-04 1009.53 979.29 6.8517-Jun-04 1010.03 979.58 6.8518-Jun-04 1006.02 975.41 6.8419-Jun-04 1004.45 973.64 6.8321-Jun-04 1000.63 969.46 6.8222-Jun-04 994.48 963.18 6.8023-Jun-04 989.12 957.67 6.7824-Jun-04 989.86 958.19 6.7825-Jun-04 985.55 953.73 6.7726-Jun-04 984.86 952.84 6.7628-Jun-04 987.00 954.93 6.7629-Jun-04 986.82 954.55 6.7630-Jun-04 986.51 954.03 6.76
1-Jul-04 987.03 954.34 6.842-Jul-04 988.25 955.33 6.863-Jul-04 993.09 959.87 6.875-Jul-04 993.52 959.88 6.876-Jul-04 993.01 959.17 6.877-Jul-04 993.75 959.69 6.868-Jul-04 991.95 957.70 6.869-Jul-04 991.86 957.40 6.85
10-Jul-04 991.55 956.89 6.8512-Jul-04 988.59 953.56 6.8413-Jul-04 989.90 954.64 6.8414-Jul-04 989.08 953.63 6.8315-Jul-04 985.97 950.36 6.8316-Jul-04 984.30 948.51 6.82
17-Jul-04 988.08 952.01 6.8319-Jul-04 987.54 951.96 6.8220-Jul-04 988.02 952.23 6.8221-Jul-04 988.05 952.05 6.8222-Jul-04 985.96 949.78 6.8123-Jul-04 984.37 948.01 6.8124-Jul-04 985.54 948.95 6.8126-Jul-04 984.85 947.85 6.8027-Jul-04 983.59 946.40 6.7928-Jul-04 979.93 942.60 6.7829-Jul-04 970.45 933.09 6.7630-Jul-04 972.12 934.51 6.7631-Jul-04 972.74 935.12 6.762-Aug-04 971.10 933.09 6.743-Aug-04 969.05 930.87 6.734-Aug-04 970.87 932.44 6.735-Aug-04 971.46 932.82 6.736-Aug-04 966.98 928.21 6.727-Aug-04 963.33 924.43 6.719-Aug-04 955.23 916.08 6.68
10-Aug-04 945.30 906.16 6.6411-Aug-04 939.90 900.66 6.6212-Aug-04 938.46 899.05 6.6113-Aug-04 937.33 897.73 6.6114-Aug-04 937.47 897.66 6.6016-Aug-04 938.84 898.58 6.6017-Aug-04 940.30 899.79 6.6018-Aug-04 941.63 900.89 6.6019-Aug-04 941.13 900.19 6.6021-Aug-04 940.22 899.88 6.6023-Aug-04 946.55 905.65 6.6124-Aug-04 949.50 908.33 6.6225-Aug-04 954.30 912.80 6.6326-Aug-04 952.80 911.13 6.6327-Aug-04 958.41 916.40 6.6428-Aug-04 963.04 920.72 6.6730-Aug-04 961.20 918.51 6.6631-Aug-04 961.97 919.26 6.66
1-Sep-04 975.27 932.01 6.682-Sep-04 973.73 930.30 6.683-Sep-04 977.23 933.50 6.704-Sep-04 982.52 938.44 6.706-Sep-04 986.35 941.74 6.707-Sep-04 986.09 941.28 6.708-Sep-04 984.16 939.19 6.709-Sep-04 984.76 939.56 6.70
10-Sep-04 984.93 939.51 6.7011-Sep-04 986.16 940.50 6.7113-Sep-04 978.86 932.98 6.6914-Sep-04 981.10 934.95 6.6915-Sep-04 979.54 933.22 6.6816-Sep-04 978.68 932.18 6.6817-Sep-04 979.95 933.19 6.6720-Sep-04 979.26 931.89 6.6621-Sep-04 981.82 934.17 6.67
22-Sep-04 982.16 934.28 6.6623-Sep-04 984.39 936.24 6.6724-Sep-04 986.74 938.31 6.6725-Sep-04 986.08 937.45 6.6827-Sep-04 984.94 935.92 6.6728-Sep-04 982.55 933.39 6.6629-Sep-04 979.76 930.48 6.65
1-Oct-04 976.38 926.77 6.664-Oct-04 974.12 923.95 6.645-Oct-04 972.86 922.51 6.646-Oct-04 972.05 921.52 6.647-Oct-04 969.28 918.62 6.638-Oct-04 968.75 917.89 6.629-Oct-04 964.90 913.95 6.61
11-Oct-04 961.11 910.32 6.6012-Oct-04 959.44 908.49 6.5914-Oct-04 961.79 910.35 6.5915-Oct-04 962.64 910.96 6.5916-Oct-04 962.31 910.42 6.6018-Oct-04 960.37 908.12 6.5819-Oct-04 965.20 912.59 6.5920-Oct-04 964.28 911.48 6.5921-Oct-04 965.24 912.20 6.5923-Oct-04 967.91 915.70 6.6025-Oct-04 967.28 914.67 6.5926-Oct-04 963.56 910.87 6.5827-Oct-04 961.87 909.03 6.5828-Oct-04 959.93 906.94 6.5729-Oct-04 962.21 908.93 6.5730-Oct-04 960.25 906.83 6.561-Nov-04 960.80 907.39 6.692-Nov-04 959.49 905.92 6.693-Nov-04 958.33 904.59 6.694-Nov-04 957.85 903.92 6.685-Nov-04 945.60 891.90 6.656-Nov-04 944.11 890.25 6.648-Nov-04 940.78 886.62 6.629-Nov-04 939.25 884.94 6.61
10-Nov-04 941.28 886.68 6.6111-Nov-04 938.88 884.15 6.6013-Nov-04 938.91 885.06 6.6016-Nov-04 939.92 886.74 6.6117-Nov-04 938.61 885.27 6.6018-Nov-04 941.20 887.55 6.6019-Nov-04 942.79 888.88 6.6020-Nov-04 944.74 890.55 6.6022-Nov-04 945.74 891.36 6.6023-Nov-04 943.99 889.47 6.6024-Nov-04 942.87 888.18 6.6025-Nov-04 942.61 887.72 6.6027-Nov-04 944.48 889.10 6.5929-Nov-04 943.69 888.83 6.5930-Nov-04 944.26 889.17 6.60
1-Dec-04 946.33 890.94 6.652-Dec-04 956.92 900.89 6.66
3-Dec-04 959.24 902.90 6.664-Dec-04 963.70 906.96 6.696-Dec-04 962.74 905.62 6.687-Dec-04 963.09 905.75 6.688-Dec-04 964.76 907.15 6.689-Dec-04 966.37 908.48 6.69
10-Dec-04 967.80 909.63 6.6911-Dec-04 969.87 911.41 6.6913-Dec-04 966.74 908.80 6.6914-Dec-04 965.50 907.41 6.6915-Dec-04 964.86 906.59 6.6816-Dec-04 965.86 907.34 6.6816-Dec-04 965.42 906.91 6.6817-Dec-04 967.36 908.56 6.6818-Dec-04 965.55 906.62 6.6720-Dec-04 967.04 907.86 6.6721-Dec-04 969.84 910.33 6.6722-Dec-04 972.69 912.85 6.6823-Dec-04 976.55 916.34 6.6924-Dec-04 977.26 916.81 6.6927-Dec-04 979.14 917.98 6.6928-Dec-04 981.79 920.31 6.6929-Dec-04 982.52 920.80 6.6930-Dec-04 982.99 921.04 6.6931-Dec-04 983.86 921.87 6.69
1-Jan-05 979.79 917.77 6.713-Jan-05 981.25 922.49 6.754-Jan-05 983.05 924.00 6.755-Jan-05 983.06 923.80 6.756-Jan-05 981.50 922.10 6.747-Jan-05 981.99 922.37 6.748-Jan-05 981.78 921.95 6.73
10-Jan-05 981.17 920.95 6.7211-Jan-05 982.46 921.98 6.7212-Jan-05 982.42 921.73 6.7213-Jan-05 981.52 920.66 6.7114-Jan-05 980.03 919.03 6.7015-Jan-05 978.32 917.18 6.7117-Jan-05 976.90 915.40 6.6918-Jan-05 977.89 916.14 6.7019-Jan-05 975.65 913.80 6.6920-Jan-05 976.05 913.97 6.6822-Jan-05 976.23 913.73 6.6824-Jan-05 976.46 913.52 6.6725-Jan-05 976.40 913.26 6.6727-Jan-05 976.10 912.55 6.6628-Jan-05 976.65 912.87 6.6629-Jan-05 978.36 914.30 6.6731-Jan-05 978.63 914.35 6.671-Feb-05 978.65 914.16 6.692-Feb-05 979.60 914.85 6.683-Feb-05 978.54 913.63 6.684-Feb-05 978.51 913.40 6.675-Feb-05 978.44 913.12 6.677-Feb-05 979.13 913.36 6.67
8-Feb-05 980.50 914.46 6.669-Feb-05 982.13 915.79 6.67
10-Feb-05 984.98 918.31 6.6811-Feb-05 985.89 918.96 6.6812-Feb-05 984.09 917.04 6.6714-Feb-05 984.43 916.94 6.6615-Feb-05 984.26 916.57 6.6616-Feb-05 985.35 917.40 6.6617-Feb-05 986.30 918.10 6.6618-Feb-05 987.90 919.41 6.6619-Feb-05 987.40 918.73 6.6621-Feb-05 987.22 919.17 6.6622-Feb-05 988.02 919.72 6.6623-Feb-05 988.24 919.72 6.6624-Feb-05 988.34 919.61 6.6625-Feb-05 989.12 920.14 6.6626-Feb-05 989.88 920.65 6.6628-Feb-05 989.21 919.59 6.67
1-Mar-05 986.01 915.93 6.752-Mar-05 984.91 914.68 6.753-Mar-05 985.39 914.93 6.764-Mar-05 986.85 916.10 6.765-Mar-05 988.31 917.27 6.767-Mar-05 990.06 918.52 6.759-Mar-05 990.81 919.20 6.75
10-Mar-05 990.06 918.28 6.7511-Mar-05 990.47 918.46 6.7612-Mar-05 990.81 918.58 6.7614-Mar-05 990.66 918.01 6.7515-Mar-05 990.71 917.86 6.7516-Mar-05 990.01 916.98 6.7417-Mar-05 988.38 915.24 6.7418-Mar-05 988.92 915.54 6.7319-Mar-05 989.99 916.34 6.7321-Mar-05 989.13 915.11 6.7222-Mar-05 988.67 914.46 6.7223-Mar-05 988.14 913.75 6.7224-Mar-05 990.30 915.59 6.7228-Mar-05 990.76 915.96 6.7229-Mar-05 990.64 915.64 6.7230-Mar-05 990.77 915.55 6.7131-Mar-05 990.55 915.35 6.71
1-Apr-05 990.68 915.26 6.712-Apr-05 988.21 912.71 6.704-Apr-05 985.76 909.99 6.695-Apr-05 983.86 907.99 6.686-Apr-05 980.34 904.45 6.667-Apr-05 977.57 901.63 6.668-Apr-05 972.97 897.09 6.64
11-Apr-05 973.10 896.78 6.6312-Apr-05 973.42 896.88 6.6313-Apr-05 974.82 897.98 6.6315-Apr-05 974.39 897.16 6.6216-Apr-05 969.90 892.72 6.6219-Apr-05 969.31 891.54 6.61
20-Apr-05 968.41 890.49 6.6021-Apr-05 969.84 891.62 6.6023-Apr-05 966.54 889.47 6.6025-Apr-05 966.55 889.06 6.5926-Apr-05 968.58 890.75 6.6027-Apr-05 969.31 891.23 6.6028-Apr-05 962.98 885.07 6.5729-Apr-05 962.21 884.15 6.5730-Apr-05 959.23 881.13 6.562-May-05 957.36 878.96 6.593-May-05 958.99 880.28 6.594-May-05 961.21 882.15 6.595-May-05 962.25 882.93 6.596-May-05 962.07 882.54 6.597-May-05 962.21 882.46 6.599-May-05 962.95 882.74 6.58
10-May-05 965.11 884.56 6.5911-May-05 965.76 884.96 6.5912-May-05 967.49 886.37 6.5913-May-05 968.35 886.98 6.5914-May-05 969.25 887.61 6.6016-May-05 967.92 886.25 6.5917-May-05 969.50 887.52 6.6018-May-05 969.13 886.96 6.5919-May-05 972.00 889.43 6.6020-May-05 975.54 892.54 6.6121-May-05 975.04 891.87 6.6024-May-05 975.53 893.31 6.6125-May-05 978.96 896.31 6.6226-May-05 977.97 895.18 6.6127-May-05 977.86 894.87 6.6128-May-05 977.72 894.53 6.6130-May-05 976.42 892.90 6.6131-May-05 979.47 893.34 6.61
1-Jun-05 979.45 893.11 6.622-Jun-05 980.86 894.21 6.623-Jun-05 982.68 895.69 6.624-Jun-05 985.30 897.91 6.636-Jun-05 985.42 897.60 6.637-Jun-05 987.25 899.09 6.638-Jun-05 990.47 901.87 6.649-Jun-05 991.52 902.64 6.64
10-Jun-05 990.02 901.04 6.6311-Jun-05 988.18 899.13 6.6213-Jun-05 988.07 899.39 6.6314-Jun-05 987.24 898.41 6.6215-Jun-05 987.16 898.13 6.6216-Jun-05 986.84 897.63 6.6117-Jun-05 986.31 896.93 6.6118-Jun-05 986.64 897.03 6.6020-Jun-05 987.26 897.41 6.6021-Jun-05 989.11 898.92 6.6022-Jun-05 991.49 900.92 6.6123-Jun-05 992.68 901.81 6.6124-Jun-05 991.98 900.96 6.60
25-Jun-05 992.36 901.10 6.6027-Jun-05 991.48 899.87 6.6028-Jun-05 991.46 899.64 6.5929-Jun-05 992.69 900.57 6.5930-Jun-05 992.25 899.96 6.59
1-Jul-05 991.47 899.03 6.602-Jul-05 988.77 896.32 6.624-Jul-05 985.53 892.91 6.605-Jul-05 986.29 893.41 6.606-Jul-05 983.56 890.68 6.597-Jul-05 982.89 889.86 6.598-Jul-05 981.65 888.50 6.589-Jul-05 981.39 888.06 6.57
11-Jul-05 979.06 885.49 6.5612-Jul-05 980.41 886.53 6.5613-Jul-05 979.49 885.47 6.5514-Jul-05 981.09 886.74 6.5615-Jul-05 981.64 887.04 6.5616-Jul-05 978.63 884.06 6.5418-Jul-05 980.57 885.43 6.5519-Jul-05 981.47 886.05 6.5520-Jul-05 980.76 885.19 6.5421-Jul-05 982.29 886.40 6.5422-Jul-05 983.11 886.93 6.5423-Jul-05 982.17 885.86 6.5425-Jul-05 982.85 886.16 6.5326-Jul-05 990.89 893.36 6.5529-Jul-05 994.06 896.24 6.5630-Jul-05 993.02 895.08 6.551-Aug-05 993.26 895.09 6.572-Aug-05 993.34 894.96 6.573-Aug-05 993.11 894.53 6.564-Aug-05 992.60 893.85 6.565-Aug-05 992.08 893.17 6.566-Aug-05 991.61 892.53 6.558-Aug-05 991.73 893.06 6.569-Aug-05 990.25 891.50 6.55
10-Aug-05 991.27 892.23 6.5611-Aug-05 991.87 892.57 6.5512-Aug-05 991.88 892.38 6.5513-Aug-05 990.77 891.15 6.5516-Aug-05 991.14 890.87 6.5417-Aug-05 992.21 891.64 6.5418-Aug-05 993.17 892.31 6.5419-Aug-05 993.10 892.04 6.5322-Aug-05 992.94 892.31 6.5323-Aug-05 992.39 891.59 6.5224-Aug-05 992.74 891.71 6.5325-Aug-05 992.90 891.65 6.5326-Aug-05 993.65 892.13 6.5327-Aug-05 994.67 892.86 6.5229-Aug-05 992.33 891.79 6.5330-Aug-05 993.73 892.86 6.5431-Aug-05 992.49 891.74 6.54
1-Sep-05 993.85 892.78 6.57
2-Sep-05 995.03 893.65 6.563-Sep-05 996.82 895.08 6.585-Sep-05 996.89 894.74 6.586-Sep-05 996.96 894.60 6.578-Sep-05 997.61 894.78 6.579-Sep-05 997.59 894.56 6.56
10-Sep-05 996.96 893.78 6.5612-Sep-05 995.91 893.80 6.5613-Sep-05 996.73 894.34 6.5614-Sep-05 997.16 894.53 6.5615-Sep-05 997.32 894.47 6.5616-Sep-05 997.98 894.87 6.5617-Sep-05 998.42 895.07 6.5519-Sep-05 999.03 895.22 6.5520-Sep-05 999.29 895.25 6.5521-Sep-05 999.18 894.94 6.5422-Sep-05 998.61 894.22 6.5423-Sep-05 997.57 893.05 6.5324-Sep-05 998.03 893.27 6.5326-Sep-05 997.16 893.12 6.5427-Sep-05 995.46 891.36 6.5428-Sep-05 994.66 890.42 6.5329-Sep-05 995.20 890.71 6.5330-Sep-05 994.86 890.20 6.53
1-Oct-05 995.47 890.54 6.743-Oct-05 994.45 889.21 6.744-Oct-05 994.14 888.71 6.735-Oct-05 994.30 888.65 6.736-Oct-05 993.35 887.58 6.727-Oct-05 994.21 888.16 6.72
10-Oct-05 993.78 887.32 6.7211-Oct-05 994.74 888.00 6.7113-Oct-05 995.15 887.96 6.7114-Oct-05 995.76 888.31 6.7117-Oct-05 994.26 888.36 6.7218-Oct-05 993.36 887.32 6.7119-Oct-05 993.20 886.98 6.7120-Oct-05 992.56 886.19 6.7121-Oct-05 994.15 887.43 6.7124-Oct-05 995.40 889.10 6.7125-Oct-05 995.42 888.91 6.7126-Oct-05 996.74 889.92 6.7127-Oct-05 997.69 890.58 6.7128-Oct-05 997.74 890.42 6.7031-Oct-05 997.52 889.90 6.702-Nov-05 998.23 890.15 6.623-Nov-05 998.66 890.33 6.624-Nov-05 999.01 890.45 6.627-Nov-05 998.65 889.51 6.618-Nov-05 997.52 888.28 6.609-Nov-05 996.72 887.35 6.59
10-Nov-05 997.71 888.04 6.5911-Nov-05 998.50 888.56 6.5914-Nov-05 998.19 888.52 6.6016-Nov-05 998.25 888.44 6.59
17-Nov-05 998.20 888.19 6.5918-Nov-05 998.46 888.23 6.5921-Nov-05 999.08 888.33 6.5822-Nov-05 999.23 888.27 6.5823-Nov-05 1000.50 889.22 6.5824-Nov-05 1001.22 889.67 6.5925-Nov-05 1001.76 889.95 6.5828-Nov-05 1002.06 889.62 6.5829-Nov-05 1003.95 891.12 6.5830-Nov-05 1003.64 890.64 6.59
1-Dec-05 1003.71 890.50 6.762-Dec-05 1003.19 889.83 6.765-Dec-05 1003.42 889.82 6.756-Dec-05 1004.19 890.32 6.757-Dec-05 1004.89 890.75 6.758-Dec-05 1005.49 891.08 6.759-Dec-05 1005.13 890.56 6.75
12-Dec-05 1004.53 889.85 6.7513-Dec-05 1004.74 889.85 6.7514-Dec-05 1005.30 890.15 6.7515-Dec-05 1006.22 890.77 6.7516-Dec-05 1006.44 890.77 6.7419-Dec-05 1006.65 890.35 6.7320-Dec-05 1006.22 889.77 6.7321-Dec-05 1006.00 889.37 6.7222-Dec-05 1006.30 889.43 6.7223-Dec-05 1006.56 889.46 6.7226-Dec-05 1007.63 889.82 6.7127-Dec-05 1007.53 889.53 6.7128-Dec-05 1007.96 889.72 6.7129-Dec-05 1008.65 890.13 6.7130-Dec-05 1009.45 890.65 6.71
2-Jan-06 1010.08 890.81 6.753-Jan-06 1011.00 891.44 6.754-Jan-06 1011.17 891.39 6.755-Jan-06 1011.43 891.42 6.746-Jan-06 1011.51 891.30 6.749-Jan-06 1011.93 891.07 6.73
10-Jan-06 1012.19 891.09 6.7312-Jan-06 1012.37 890.86 6.7313-Jan-06 1012.17 890.47 6.7216-Jan-06 1011.90 890.75 6.7217-Jan-06 1011.75 890.41 6.7218-Jan-06 1012.04 890.47 6.7219-Jan-06 1011.94 890.18 6.7220-Jan-06 1011.56 889.64 6.7223-Jan-06 1012.68 890.06 6.7124-Jan-06 1010.29 887.71 6.7025-Jan-06 1003.47 881.39 6.6827-Jan-06 1000.37 878.21 6.6730-Jan-06 999.84 879.08 6.6731-Jan-06 1001.56 880.62 6.671-Feb-06 1002.69 881.44 6.682-Feb-06 1001.39 880.07 6.673-Feb-06 1002.14 880.54 6.67
6-Feb-06 1003.37 881.22 6.677-Feb-06 1004.02 881.60 6.678-Feb-06 1002.94 880.43 6.66
10-Feb-06 1002.23 879.72 6.6613-Feb-06 1003.12 880.28 6.6614-Feb-06 1002.44 879.47 6.6615-Feb-06 1001.37 878.31 6.6516-Feb-06 1003.00 879.56 6.6517-Feb-06 1003.09 879.45 6.6520-Feb-06 1002.71 878.50 6.6421-Feb-06 1002.87 878.44 6.6422-Feb-06 1001.91 877.38 6.6323-Feb-06 1000.48 875.90 6.6324-Feb-06 1001.07 876.23 6.6327-Feb-06 1001.20 875.74 6.6228-Feb-06 1001.29 875.61 6.64
1-Mar-06 1000.74 874.51 6.652-Mar-06 998.93 872.70 6.643-Mar-06 998.12 871.77 6.646-Mar-06 997.80 870.88 6.647-Mar-06 998.41 871.22 6.638-Mar-06 999.82 872.28 6.649-Mar-06 1000.36 872.55 6.64
10-Mar-06 999.87 871.92 6.6413-Mar-06 998.52 871.50 6.6414-Mar-06 998.97 871.70 6.6416-Mar-06 999.49 871.76 6.6317-Mar-06 1000.20 872.19 6.6320-Mar-06 1000.73 872.05 6.6221-Mar-06 1001.96 872.94 6.6222-Mar-06 1001.30 872.16 6.6223-Mar-06 1001.99 872.57 6.6124-Mar-06 1003.07 873.33 6.6127-Mar-06 1002.34 873.16 6.6228-Mar-06 1002.15 872.79 6.6229-Mar-06 999.41 870.16 6.6131-Mar-06 997.71 868.44 6.60
3-Apr-06 997.14 867.33 6.654-Apr-06 998.52 868.35 6.655-Apr-06 999.57 869.09 6.667-Apr-06 1001.00 869.95 6.65
10-Apr-06 1000.24 868.85 6.6412-Apr-06 1000.70 868.85 6.6313-Apr-06 1000.03 868.06 6.6317-Apr-06 997.96 867.62 6.6318-Apr-06 1000.62 869.79 6.6319-Apr-06 1005.68 874.07 6.6520-Apr-06 1005.00 873.27 6.6421-Apr-06 1006.11 874.05 6.6424-Apr-06 1005.04 872.86 6.6325-Apr-06 1005.56 873.12 6.6226-Apr-06 1004.53 872.00 6.6227-Apr-06 1002.77 870.25 6.6128-Apr-06 1004.09 871.21 6.612-May-06 1001.73 868.62 6.65
3-May-06 1000.78 867.58 6.654-May-06 1001.19 867.74 6.645-May-06 1001.08 867.44 6.648-May-06 1001.31 867.05 6.639-May-06 1001.90 867.36 6.63
10-May-06 1002.01 867.26 6.6211-May-06 1001.09 866.25 6.6212-May-06 1000.02 865.10 6.6215-May-06 995.73 862.53 6.6216-May-06 996.09 862.65 6.6117-May-06 996.78 863.06 6.6118-May-06 995.72 861.91 6.6119-May-06 995.51 861.53 6.6022-May-06 995.32 860.99 6.5923-May-06 994.10 859.71 6.5924-May-06 993.54 859.01 6.5925-May-06 993.69 858.94 6.5926-May-06 993.79 858.83 6.5829-May-06 993.49 857.96 6.5730-May-06 992.89 857.24 6.5831-May-06 995.36 856.61 6.58
1-Jun-06 994.94 856.04 6.622-Jun-06 994.14 855.14 6.625-Jun-06 994.82 855.50 6.626-Jun-06 992.84 853.56 6.617-Jun-06 992.99 853.49 6.608-Jun-06 992.38 852.75 6.609-Jun-06 986.47 847.37 6.58
12-Jun-06 986.21 846.97 6.5813-Jun-06 984.85 845.58 6.5714-Jun-06 986.15 846.51 6.5715-Jun-06 985.81 846.02 6.5616-Jun-06 985.97 845.95 6.5619-Jun-06 981.56 841.49 6.5620-Jun-06 967.75 829.39 6.5321-Jun-06 967.71 829.16 6.5322-Jun-06 966.01 827.47 6.5223-Jun-06 955.96 818.48 6.4826-Jun-06 957.71 819.41 6.4827-Jun-06 956.55 818.21 6.4728-Jun-06 958.99 820.14 6.4829-Jun-06 957.86 818.95 6.4730-Jun-06 961.05 821.55 6.48
3-Jul-06 955.78 820.36 6.514-Jul-06 955.76 820.15 6.515-Jul-06 956.10 820.24 6.506-Jul-06 955.29 819.34 6.507-Jul-06 954.31 818.28 6.49
10-Jul-06 952.41 816.02 6.4811-Jul-06 950.46 814.12 6.4712-Jul-06 946.47 810.44 6.4413-Jul-06 946.33 810.12 6.4314-Jul-06 946.06 809.68 6.4317-Jul-06 945.63 809.73 6.4318-Jul-06 944.97 808.95 6.43
19-Jul-06 945.39 809.12 6.4220-Jul-06 947.20 810.51 6.4321-Jul-06 951.30 813.89 6.4324-Jul-06 952.67 814.51 6.4325-Jul-06 950.11 812.08 6.4226-Jul-06 950.94 812.61 6.4127-Jul-06 950.97 812.44 6.4128-Jul-06 950.82 812.11 6.4131-Jul-06 950.67 812.91 6.411-Aug-06 948.06 810.60 6.472-Aug-06 948.48 810.77 6.47
Annexure - II: Security-wise Trading Volume (Jan'04 - Jun'06) Sl. No. ISINDESC Trades
Amount (Rs. Cr.)
Market Share (%)
Cumulative Percentage
1 8.07% GS 2017 39025 230524.24 12.18 12.18 2 7.38% G.S 2015 36103 207348.70 10.96 23.14 3 7.55% G.S. 2010 23121 153678.89 8.12 31.26 4 7.37% G.S. 2014 23020 142929.98 7.55 38.81 5 9.39% G. S. 2011 15084 100994.99 5.34 44.14 6 10.25% G. S. 2021 16381 94826.98 5.01 49.15 7 7.46% G.S 2017 12388 75549.20 3.99 53.15 8 7.49% G. S. 2017 11691 71777.78 3.79 56.94 9 6.85% G.S. 2012 9620 59727.77 3.16 60.09
10 7.40% G.S. 2012 8646 56555.42 2.99 63.08 11 7.27% G.S 2013 8637 53936.42 2.85 65.93 12 6.25% G.S 2018 8042 47899.10 2.53 68.46 13 7.59% GOVT.STOCK 2016 5921 39658.89 2.10 70.56 14 6.65% G.S. 2009 4958 32423.15 1.71 72.27 15 11.90% G. S. 2007 1348 24565.24 1.30 73.57 16 11.99% G. S. 2009 2564 21870.39 1.16 74.72 17 8.35% G.S. 2022 2842 21600.53 1.14 75.87 18 6.05% GOVT. STOCK 2019 3347 21473.64 1.13 77.00 19 12.32% G. S. 2011 2809 19321.17 1.02 78.02 20 6.35% G.S 2020 2893 19213.15 1.02 79.04 21 6.96% OIL COS' SPL BONDS2009 1756 19088.26 1.01 80.05 22 12.00% G. S. 2008 1525 18904.44 1.00 81.04 23 7.40% GOVT.STOCK 2035 2500 15844.93 0.84 81.88 24 7.5% GOVT. STOCK 2034 2126 15603.13 0.82 82.71 25 9.85% G. S. 2015 2126 15095.00 0.80 83.50 26 6.18% G.S 2005 679 13888.89 0.73 84.24 27 10.95% G. S. 2011 1848 13242.25 0.70 84.94 28 11.68% G. S. 2006 566 11457.70 0.61 85.54 29 6.20% GOI UTI SPL BONDS,2010 1472 11215.00 0.59 86.13 30 9.81% G. S. 2013 1455 11103.50 0.59 86.72 31 11.40% G. S. 2008 1066 10924.29 0.58 87.30 32 5.59% GOVT. STOCK 2016 1543 10255.42 0.54 87.84 33 5.64% GOVT. STOCK 2019 1502 9693.78 0.51 88.35 34 6.17% GOVT. STOCK 2023 1420 9614.27 0.51 88.86
35 5.69% GOVT. STOCK 2018 1360 9066.41 0.48 89.34
36 12.29% G. S. 2010 685 8498.00 0.45 89.79 37 6.72% GOVT. STOCK 2014 1118 8070.00 0.43 90.22 38 11.83% G.S. 2014 846 7128.59 0.38 90.59 39 7.94% GOVT.STOCK 2021 710 7002.84 0.37 90.96 40 GOI FLOATING RATE BOND 2015 II 195 6555.00 0.35 91.31 41 11.03% G. S. 2012 672 6148.75 0.32 91.63 42 11.50% G. S. 2011 666 5993.30 0.32 91.95 43 7.95% G.S 2032 662 5954.14 0.31 92.26 44 4.83% GOVT. STOCK 2006 364 5808.94 0.31 92.57 45 11.50% 2008 246 5656.55 0.30 92.87 46 6.01% GOVT. STOCK 2028 849 5538.77 0.29 93.16 47 12.25% G. S. 2010 485 5247.89 0.28 93.44 48 10.71% G. S. 2016 648 5183.09 0.27 93.71 49 11.75% G. S. 2006 171 5126.26 0.27 93.98 50 9.40% GS 2012 573 4933.70 0.26 94.25 51 GOI FLOATING RATE BOND 2016 154 4859.13 0.26 94.50 52 10.47% G. S. 2015 550 4826.00 0.25 94.76 53 GOI FLOATING RATE BOND 2015 179 4545.85 0.24 95.00 54 GOI FLOATING RATE BOND 2013 140 4215.00 0.22 95.22 55 11.50% 2010 261 4109.94 0.22 95.44 56 11.19% G. S. 2005 195 4015.98 0.21 95.65 57 11.30% G. S. 2010 382 3848.08 0.20 95.85 58 13.05% G.S.2007 172 3760.99 0.20 96.05 59 11.50% 2006 114 3713.95 0.20 96.25 60 6.13% GOVT. STOCK 2028 386 3657.79 0.19 96.44 61 13.85% GS 2006(INSTALMENTS) 99 3537.60 0.19 96.63 62 11.50% 2007 122 3302.74 0.17 96.80 63 11.43% G. S. 2015 336 2999.85 0.16 96.96 64 12.50% G.S. 2004 121 2953.58 0.16 97.12 65 12.25% GOVT STOCK 2008 222 2922.47 0.15 97.27 66 12.40% G. S. 2013 236 2885.45 0.15 97.42 67 6.30% GOVT. STOCK 2023 319 2829.26 0.15 97.57 68 11.50% 2009 179 2668.44 0.14 97.71 69 7.33% OIL MKT CO GOI BOND 2009 66 2435.00 0.13 97.84 70 10.45% G. S. 2018 254 2246.07 0.12 97.96 71 12.10% G. S. 2008 44 2143.50 0.11 98.07 72 14.00 % G. S. 2006 55 1932.45 0.10 98.18 73 5.87% G.S 2010 170 1905.00 0.10 98.28 74 12.59 % G. S. 2004 39 1751.00 0.09 98.37 75 10.18% GS 2026 144 1579.95 0.08 98.45 76 14.00% GS 2005 (INSTALMENTS) 36 1435.02 0.08 98.53 77 6% GOI UTI SPECIAL BONDS 2010 141 1350.00 0.07 98.60 78 10.20% G. S. 2005 63 1301.79 0.07 98.67 79 11.98% GOVT STOCK 2004 55 1293.86 0.07 98.74 80 7.07% OIL MKTG.COS.GOI SB 2009 23 1215.00 0.06 98.80 81 6.72% G.S 2012 66 1200.00 0.06 98.87 82 11.50% 2015 41 1189.00 0.06 98.93
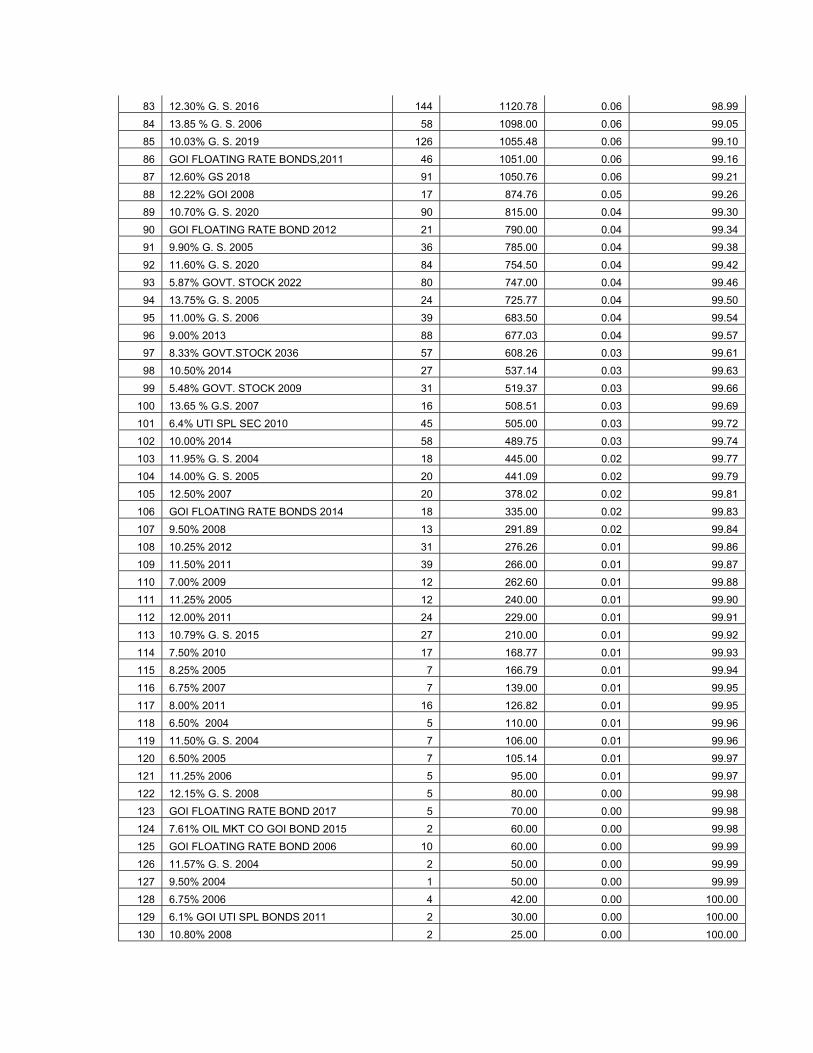
83 12.30% G. S. 2016 144 1120.78 0.06 98.99
84 13.85 % G. S. 2006 58 1098.00 0.06 99.05 85 10.03% G. S. 2019 126 1055.48 0.06 99.10 86 GOI FLOATING RATE BONDS,2011 46 1051.00 0.06 99.16 87 12.60% GS 2018 91 1050.76 0.06 99.21 88 12.22% GOI 2008 17 874.76 0.05 99.26 89 10.70% G. S. 2020 90 815.00 0.04 99.30 90 GOI FLOATING RATE BOND 2012 21 790.00 0.04 99.34 91 9.90% G. S. 2005 36 785.00 0.04 99.38 92 11.60% G. S. 2020 84 754.50 0.04 99.42 93 5.87% GOVT. STOCK 2022 80 747.00 0.04 99.46 94 13.75% G. S. 2005 24 725.77 0.04 99.50 95 11.00% G. S. 2006 39 683.50 0.04 99.54 96 9.00% 2013 88 677.03 0.04 99.57 97 8.33% GOVT.STOCK 2036 57 608.26 0.03 99.61 98 10.50% 2014 27 537.14 0.03 99.63 99 5.48% GOVT. STOCK 2009 31 519.37 0.03 99.66
100 13.65 % G.S. 2007 16 508.51 0.03 99.69 101 6.4% UTI SPL SEC 2010 45 505.00 0.03 99.72 102 10.00% 2014 58 489.75 0.03 99.74 103 11.95% G. S. 2004 18 445.00 0.02 99.77 104 14.00% G. S. 2005 20 441.09 0.02 99.79 105 12.50% 2007 20 378.02 0.02 99.81 106 GOI FLOATING RATE BONDS 2014 18 335.00 0.02 99.83 107 9.50% 2008 13 291.89 0.02 99.84 108 10.25% 2012 31 276.26 0.01 99.86 109 11.50% 2011 39 266.00 0.01 99.87 110 7.00% 2009 12 262.60 0.01 99.88 111 11.25% 2005 12 240.00 0.01 99.90 112 12.00% 2011 24 229.00 0.01 99.91 113 10.79% G. S. 2015 27 210.00 0.01 99.92 114 7.50% 2010 17 168.77 0.01 99.93 115 8.25% 2005 7 166.79 0.01 99.94 116 6.75% 2007 7 139.00 0.01 99.95 117 8.00% 2011 16 126.82 0.01 99.95 118 6.50% 2004 5 110.00 0.01 99.96 119 11.50% G. S. 2004 7 106.00 0.01 99.96 120 6.50% 2005 7 105.14 0.01 99.97 121 11.25% 2006 5 95.00 0.01 99.97 122 12.15% G. S. 2008 5 80.00 0.00 99.98 123 GOI FLOATING RATE BOND 2017 5 70.00 0.00 99.98 124 7.61% OIL MKT CO GOI BOND 2015 2 60.00 0.00 99.98 125 GOI FLOATING RATE BOND 2006 10 60.00 0.00 99.99 126 11.57% G. S. 2004 2 50.00 0.00 99.99 127 9.50% 2004 1 50.00 0.00 99.99 128 6.75% 2006 4 42.00 0.00 100.00 129 6.1% GOI UTI SPL BONDS 2011 2 30.00 0.00 100.00 130 10.80% 2008 2 25.00 0.00 100.00
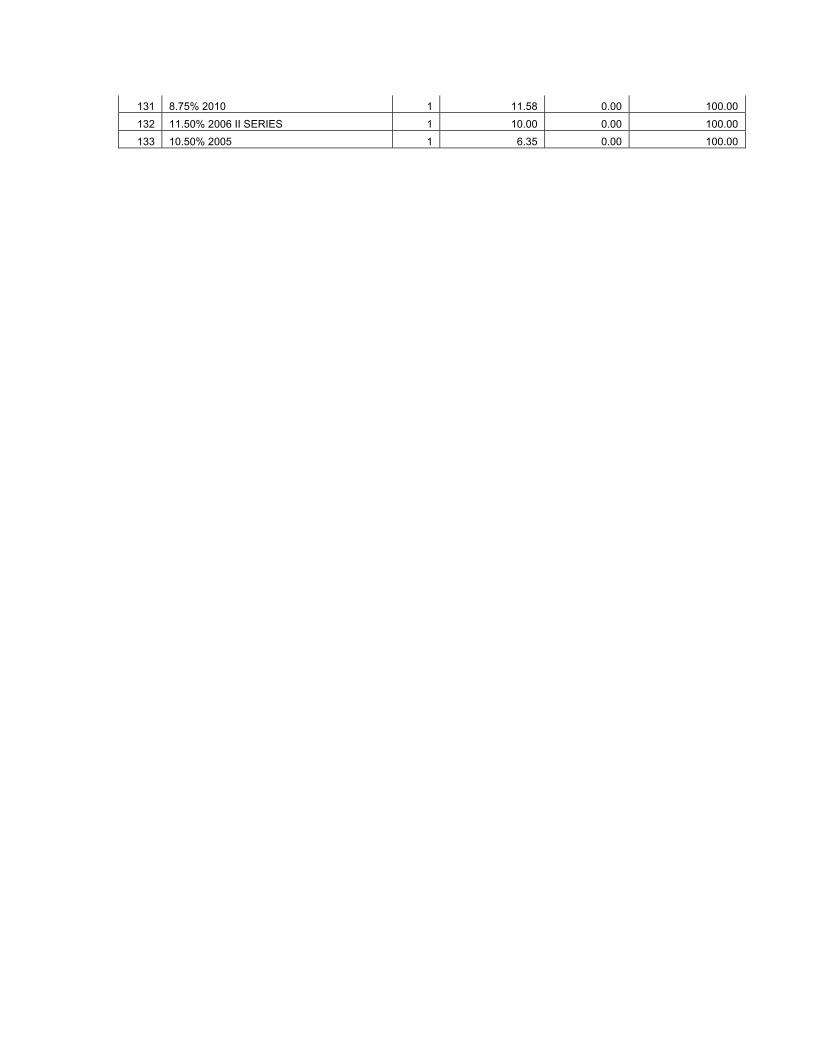
131 8.75% 2010 1 11.58 0.00 100.00
132 11.50% 2006 II SERIES 1 10.00 0.00 100.00 133 10.50% 2005 1 6.35 0.00 100.00