cc0 - adobe · maximo and digital analytix (2015); livefyre (2016); ... providing the best...
TRANSCRIPT

CDP Climate Change 2017 Information Request Adobe Systems, Inc.
Module: Introduction
Page: Introduction
CC0.1
Introduction Please give a general description and introduction to your organization. Adobe is changing the world through digital experiences. Our creative, marketing and document solutions empower everyone - from emerging artists to global brands - everything they need to design and deliver exceptional digital experiences. In 2016, Adobe grew annual revenues to over $5.854 billion (up 22% from FY2015) and FTE to 15,706 employees (up 14% from FY2015), with 373 new patents, in 77 locations around the world. Adobe integrates products from Digital Media and Digital Marketing, to create a comprehensive suite of solutions and services to deliver innovation and productivity. Major acquisitions, including Macromedia (2005); Omniture (2009); Echosign (2012); Behance (2013); Neolane (2014); Fotolia, Maximo and Digital Analytix (2015); LiveFyre (2016); and TubeMogul (2017) have grown the company and solidified Adobe’s leadership in digital experiences. By the end of 2016, over 98% of all Adobe solutions were delivered digitally, completely eliminating a physical supply chain and the subsequent environmental impact that goes with it. As a result, Adobe now offers three “clouds” in its product portfolio: Creative Cloud (Photoshop, Illustrator, InDesign), Experience Cloud (Advertising Cloud, Analytics Cloud, Marketing Cloud); and Document Cloud (Adobe Sign, Acrobat, PDF). From its inception, Adobe has been committed to responsibly managing our business. The company has a long history of energy efficiency leadership, resource conservation, waste reduction, and most recently to powering our operations and digital delivery of product with 100% renewable energy by 2035. Adobe was the first company to earn Leadership in Energy and Environmental Design (LEED) certification through the U.S. Green Building Council (USGBC) at the Platinum level in June 2006. By the end of 2016, 78% of Adobe employees work in LEED/Green-Certified workspaces. 19 out of 25 LEED certifications are at the Platinum level. We employ aggressive waste management in all of our controlled buildings resulting in a diversion rate of over 90% globally. The same resource strategy, processes and best practices apply to our leased sites where we don't directly manage the utility bill but accept that energy efficiency, water conservation, waste diversion, and providing the best workspaces anywhere makes us desirable tenants, best-in-the-world employers, and responsible citizens in every community where we work and live. In 2016, Adobe made significant progress toward achieving our 100% renewable energy (RE) goal and our commitment to a low-carbon economy. The four key elements to our strategy: 1. Energy Efficiency: the foundation of any renewable strategy and the hallmark of our operational leadership.

2. Advocacy: partner, collaborate and push utilities whose grids we are on to implement grid-scale RE strategies enabling a low-carbon economy. As examples, in 2016 Adobe signed the Amicus Brief in support of the U.S. Clean Power Plan, as well as written support for Clean Power Virginia. 3. On-site RE: when it makes business sense or when the technology implementation moves us and the market forward. As examples, in 2010 the company installed wind energy turbines at its San Jose campus. In 2014 we installed Stem battery system to reduce peak demand in our San Francisco campus. 4. Offsite RE: explore renewable energy power purchase agreements (PPAs) as a means to stabilize operational costs and power not just Adobe sites with clean energy, but make RE more widely available in the communities where we live and work (true additionality). Adobe is committed to reducing Scope 3 emissions by encouraging our employees to take action at home and at work through our Green Teams. Adobe partnered with BMW and Nissan to incentivize employees to purchase electric vehicles, and we continue to add charging stations to provide employees added encouragement to go electric. Employees are provided site-specific alternative commuting options so they can use no- or low- carbon ways to get to work each day. Since 2014, Adobe implemented a “Skip-A-Trip: Use Adobe Connect Instead” program to mitigate employee travel emissions and save the equivalent of traveling around the world over 30 times. Now more than ever, Adobe enables customers to be more sustainable through their use of our products. Adobe Connect, Adobe Sign, as well as Creative and Marketing Clouds help customers reduce physical workflows and lower their footprint. The environmental impact of Adobe Sign is remarkable: for every 1M transactions using Adobe Sign services instead of traditional print, sign, or fax, 1,142,674 gallons of water, 96,090 pounds of waste, and 372,500 pounds of wood is saved. Adobe worked with EDF and the EPN to develop our Resource Saver Calculator (URL: http://blogs.adobe.com/documentcloud/resource-saver-calculator/) so that customers understand how this product can help make any business more sustainable by saving time, resources and costs.
CC0.2
Reporting Year Please state the start and end date of the year for which you are reporting data. The current reporting year is the latest/most recent 12-month period for which data is reported. Enter the dates of this year first. We request data for more than one reporting period for some emission accounting questions. Please provide data for the three years prior to the current reporting year if you have not provided this information before, or if this is the first time you have answered a CDP information request. (This does not apply if you have been offered and selected the option of answering the shorter questionnaire). If you are going to provide additional years of data, please give the dates of those reporting periods here. Work backwards from the most recent reporting year. Please enter dates in following format: day(DD)/month(MM)/year(YYYY) (i.e. 31/01/2001).
Enter Periods that will be disclosed
Tue 01 Dec 2015 - Wed 30 Nov 2016

CC0.3
Country list configuration Please select the countries for which you will be supplying data. If you are responding to the Electric Utilities module, this selection will be carried forward to assist you in completing your response.
Select country
United States of America India Rest of world
CC0.4
Currency selection Please select the currency in which you would like to submit your response. All financial information contained in the response should be in this currency. USD($)
CC0.6
Modules As part of the request for information on behalf of investors, companies in the electric utility sector, companies in the automobile and auto component manufacturing sector, companies in the oil and gas sector, companies in the information and communications technology sector (ICT) and companies in the food, beverage and tobacco sector (FBT) should complete supplementary questions in addition to the core questionnaire. If you are in these sector groupings, the corresponding sector modules will not appear among the options of question CC0.6 but will automatically appear in the ORS navigation bar when you save this page. If you want to query your classification, please email [email protected]. If you have not been presented with a sector module that you consider would be appropriate for your company to answer, please select the module below in CC0.6.

Further Information
Module: Management
Page: CC1. Governance
CC1.1
Where is the highest level of direct responsibility for climate change within your organization? Board or individual/sub-set of the Board or other committee appointed by the Board
CC1.1a
Please identify the position of the individual or name of the committee with this responsibility All major sustainability strategies and initiatives are reviewed annually (or as needed and/or appropriate) with three C-suite leaders: Chief Marketing Officer and EVP Marketing & Communications, EVP Customer and Employee Experience, and the General Counsel (EVP and Secretary of the Board). All three of these officers of the company sit on the Board of Directors meetings and update members of the Board as needed. The CEO is advised prior to any of these meetings, as appropriate.
CC1.2
Do you provide incentives for the management of climate change issues, including the attainment of targets? Yes
CC1.2a
Please provide further details on the incentives provided for the management of climate change issues

Who is entitled to benefit from these incentives?
The type of incentives
Incentivized performance
indicator
Comment
Facility managers Monetary reward
Emissions reduction project Emissions reduction target Energy reduction project Energy reduction target Efficiency project Efficiency target Environmental criteria included in purchases Supply chain engagement Other: Behaviour change related indicator
Adobe Site Operations Managers have specific sustainability initiatives that are tied to incentives, both monetary and for recognition. Similarly, our facility partners as well as our food service partners under the direction of Adobe also have specific sustainability initiatives that tie to their performance.
Environment/Sustainability managers
Monetary reward
Emissions reduction project Emissions reduction target Energy reduction project Energy reduction target Efficiency project Efficiency target Environmental criteria included in purchases Supply chain engagement Other: Behaviour change related
A number of positions throughout Global Workplace Services, as well as Corporate Responsibility and Supply Chain, have sustainability performance built directly into their incentive structure, which can be monetary, recognition, or both, depending on the achievement. Similarly, our facility partners as well as a food service partners under the direction of Adobe also have specific sustainability initiatives that tie to their performance.

Who is entitled to benefit from these incentives?
The type of incentives
Incentivized performance
indicator
Comment
indicator
Business unit managers Monetary reward
Emissions reduction project Emissions reduction target Energy reduction project Energy reduction target Efficiency project Efficiency target Environmental criteria included in purchases Supply chain engagement Other: Behaviour change related indicator
"Incentives" can be monetary, recognition, or both, depending on the achievement. Leaders in this category are product managers, data center managers, procurement specialists. Examples of performance indicators can be but are not limited to: Increase in # of Adobe Connect meeting minutes (result in potential travel emissions reductions for customers) Increase in # of Adobe Sign transactions / year (reported as resource reduction and cost savings for customers) as well as pipeline development from product sustainability Data Center, CoLo PUE - IT/Tech Ops Management
Management group Monetary reward
Emissions reduction target Energy reduction project Energy reduction target Efficiency project Efficiency target Environmental criteria included in purchases Supply chain engagement Other: Behaviour change related
"Incentives" can be monetary, recognition, or both, depending on the achievement and impact of team accomplishing sustainability goals and reporting KPIs. Leaders in this category are Directors in operations and corporate responsibility leadership. Performance indicators are reported KPIs, successful project/program implementation, thought leadership, and management of sustainability personnel. Also, as above, Increase in # of Adobe Sign transactions / year (reported as resource reduction and cost savings for customers) as well as pipeline development from product sustainability

Who is entitled to benefit from these incentives?
The type of incentives
Incentivized performance
indicator
Comment
indicator
Director on board Monetary reward
Emissions reduction target Energy reduction target Efficiency target Other: Behaviour change related indicator
"Incentives" can be recognition, monetary bonus or both, depending on the achievement, the ownership of the program lead, and the significance of the impact to the business. Majority of employees (FTE) of the organization are eligible for the Annual Incentive Plan (“AIP ”), where specific goals are set and rewarded if met. Hence, reward can be monetary or non-monetary: A typical example is positive media attention on the company's sustainability performance recognized at a Board meeting (non-monetary recognition). Example of behavioral change would be CFO promotion of "Skip a Trip" to change employee travel behaviours and reduce emissions and OpEx.
Corporate executive team Monetary reward
Emissions reduction target Energy reduction target Efficiency target Environmental criteria included in purchases Other: Behaviour change related indicator
For Director level and above, "Incentives" can be recognition, monetary bonus or both, depending on the achievement. Any monetary reward would be through the Annual Incentive Plan (“AIP ”). Non-monetary recognition is also an incentive. A typical example is recognition for meeting sustainability goals, driving stakeholder awareness and affinity, and for team's accomplishments -- all can be rewarded monetarily or through recognition. An example, as above, would be increase in Adobe Sign pipeline, and subsequent transactions / year (reported as resource reduction and cost savings for customers), from product sustainability
Further Information
Page: CC2. Strategy
CC2.1
Please select the option that best describes your risk management procedures with regard to climate change risks and opportunities Integrated into multi-disciplinary company wide risk management processes

CC2.1a
Please provide further details on your risk management procedures with regard to climate change risks and opportunities
Frequency of monitoring
To whom are results
reported?
Geographical areas
considered
How far into
the future are risks
considered?
Comment
Six-monthly or more frequently
Board or individual/sub-set of the Board or committee appointed by the Board
All global geographical areas where Adobe has facilities are considered.
> 6 years
Sustainability Strategy development, integration, review and approval begins with the Sustainability Strategist and the Sustainability Committee (or other sub team), and is vetted with appropriate C-suite individuals (EVP/CMO, VP & Director of CR, EVP of Customer and Employee Experience, VP of Operations, EVP/General Counsel), ultimately with outcomes reported to the CEO. Risk management/mitigation initiatives, as well as operational and thought leadership opportunities are constantly reviewed, strategies are developed, and approval is granted in this way. Timeline: 1-20 years, with the level of risk or opportunity driving the timeline. For example, the strategy for developing our 2035 100% renewable energy goal incorporated action needed by the company within a 1-year period, a reasonable analysis of policy, regulations, trends, opportunities over the next 3–10 years, and an analytical approach of what the energy landscape will look like 20 years from now.
CC2.1b
Please describe how your risk and opportunity identification processes are applied at both company and asset level Company Level: Adobe’s sustainability/climate strategy is integrated with its business strategy. The cross-functional Sustainability Committee is the key entity that evaluates climate/environmental risks and opportunities and interprets them into business risk/opportunity assessment with recommendations. Depending on urgency, information is shared immediately or in team meetings (bi-weekly to annual) with functional staff owners, project leads, and in larger scope risk/opportunities with upper leadership/C-Suite owner(s), as appropriate. All internal stakeholders (Ops, Procurement, IT, etc.) are informed by committee members about key business issues, changes in regulations, trends, innovations in new technologies and other factors that could disrupt (risk) or improve (opportunity) the resiliency of the business. Recent examples include Adobe's justification to LEED certify new buildings in India, in setting Adobe’s 100% renewable energy (RE)

goal, and for setting Science-Based Targets (SBTs). Approval was based on forward-looking, economic opportunity (OpEx stabilization, employee & customer brand affinity, etc.) and risk mitigation (reduced value chain risk from fossil fuel dependence, etc.). Asset level: all owned, managed, and leased Adobe sites, as well as CoLo and cloud providers, complies with Adobe's Sustainability Policy. This specifically outlines (in contracts) planning for energy cost and availability risk, as well as action plans to avoid disruption of business due to any natural disaster, including extreme climate change. Examples: in 2016 Adobe continued to consolidate IT and CoLo tasks to full-service cloud providers and to our owned data center. This not only reduced energy demand from server rooms at Adobe sites but also helps mitigate business risk away from IT providers that do not provide operational/sustainability data or complete disaster recovery plans, or do not have renewable energy goals or SBTs.
CC2.1c
How do you prioritize the risks and opportunities identified? Adobe prioritizes risks and opportunities based on maintaining or improving the long-term resiliency of the business. All priorities start with elements of the business that have a positive, or potentially negative, impact on our customers, employees, and the environment. Immediate action is taken on anything that may disrupt, compromise, or enhance these elements. But as part of Adobe's core values (Genuine, Exceptional, Innovative & Involved) we strive to be forward-looking, assess long-term risks and trends, and implement new technologies when appropriate to continue to be a trusted brand to our customers. Adobe's successful cloud strategy is the best example of this. In late 2015, Adobe worked with BSR to develop a complete materiality assessment. Over the past 4 years, risks associated with creating physical product have been eliminated by transitioning over 98% of product to digital delivery. However, these risks have been replaced with those of a digital supply chain: energy efficiency, resource availability (energy, water), power mixes, location of CoLos, etc. Our priority is now on our own data center (OR1) as well as CoLo & cloud providers for resilient and responsible delivery of digital products. Because of this, Adobe has committed to power its operations and digital delivery of product with 100% RE by 2035 as well as implement SBTs to set operational KPIs. Adobe has short- and long-term milestones with short-term projects to be implemented by 2020 and 2025. The strategy is based on true RE additionality on the grids where we work and live and digital delivery of product to customers with 100% RE. The reason: a responsible supplier who commits to run on RE mitigates risk (energy availability, cost predictability, reputation), seeks opportunity (sites data centers in higher potential renewable locations, focuses on energy efficiency), and passes the benefits on to customers (like Adobe) and the communities where they operate.
CC2.1d
Please explain why you do not have a process in place for assessing and managing risks and opportunities from climate change, and whether you plan to introduce such a process in future

Main reason for not having a process
Do you plan to introduce a process?
Comment
CC2.2
Is climate change integrated into your business strategy? Yes
CC2.2a
Please describe the process of how climate change is integrated into your business strategy and any outcomes of this process 1. The process by which the strategy is influenced: Sustainability data collection, analysis: The process for evaluating climate change risks, costs & opportunities and integrating them into business strategy is at the operational & product level. Operational: In 2016 we deployed CR360 & Urjanet software to help collect & manage sustainability data and to develop operational strategy in line with climate goals (SBTs, RE100, etc.). Data & insights are vetted with ops executives (Facilities Managers, Directors, VP) to take immediate action or develop short- & long-term strategies with execs & the sustainability team. Reporting: communicated to Adobe’s Heads of CR & Ops, who report findings/recommendations to the VP of Ops, EVP/CMO, EVP People & Places, EVP/CFO, & EVP/GC & Board Secretary, as appropriate, who report directly to the CEO. Feedback & recommendations are communicated through the business teams to shape relevant strategies. Results and future goals are reported annually in the Sustainability & Social Impact (CR) Report. Also, our materiality assessment is reviewed annually to ensure actions are aligned with climate science and Adobe products. Last, we report potential business risks from climate change in our annual SEC 10-K report. Stakeholder engagement: Adobe actively engages with NGO working groups (ex. BSR, WRI, RE100, REBA, SBTi, etc.) and with industry peers, to obtain guidance, identify trends, share best practices, benchmark, & collaborate on industry-wide initiatives & to assess business risks & opportunities due to climate change and incorporate them into action plans. 2. Examples of business strategy influenced by climate change: Adobe’s Standards of Business Conduct: our SBCs explicitly integrate environmental considerations into employee performance. Employees are educated on Adobe’s sustainability strategies, their impact on climate, and areas where employees can take action in business-wide goals related to sustainable strategy, process, program & product design. Adobe “green” products are perhaps the best examples: Document Cloud (reduces printing & waste); Adobe Connect (virtual meeting tool, reduces employee travel); LeanPrint (reduces resource & emissions when one must print). As we continue to make progress on our RE100 goal, the impact of digital delivery and customers’ emissions from use of these products will move to zero. 3. Aspects of climate change have influenced the strategy: Risk: mitigating climate, business and reputational risk were drivers in setting our RE100 strategy and SBTs in 2016. Operational excellence through energy efficiency is the core of our short- and long-term RE strategy and it has worked in the past to mitigate business continuity and energy price volatility risk associated

with a fossil fuel dependent grid. Annual energy efficiency projects (sensor technology, sub-metering, demand-response software, over 200 sustainability projects since early 2000s w/ average ROIs < 3 years, saving millions $US) enabled us to hold the first LEED-EB platinum certifications in the US & a global footprint housing > 78% of employees in LEED workspaces. Long-term energy efficiency excellence is the only way to “right size” any grid-scale RE PPAs. Revenue opportunity: the move from boxed software to the cloud not only accelerated business growth, but it also it allowed us to develop business strategy that directly impacts climate change: it eliminated all emissions tied to Adobe’s physical supply chain, it reduced environmental impact of product use by more than 90%, it focused IT to set annual data center efficiency goals, consolidate and virtualize Adobe’s data center ops, set green standards for digital suppliers, reduce energy costs, all while increasing business resiliency and profit margins – in FY2016 alone revenue grew by over 22%. 4. Short-term strategy: climate risks and opportunities drove development of our SBTs’ short-term goal to reduce emissions by 2% per site per year. Success depends on annual energy efficiency projects, deployment of new technologies (LEDs, Stem batteries), on-site renewables (PV panels in Adobe Noida, Windspires in CA) when feasible, and ongoing policy advocacy (w/ NGOs, peers, etc.) to open grid-scale RE. These short-term solutions prove that smart sustainability projects are good business. 5. Long-term strategy: we developed our SBTs specifically to set long-term operational KPIs and RE milestones aligned with the Paris Agreement. In 2016 Adobe made progress on investment in true, grid-scale RE PPAs (India, US West) which we expect to realize and report on in 2017. Long-term emissions reduction targets are: by 2025, absolute Scope 1+2 emissions reduction by 25% (w/ Scope 3 business travel by 5%); by 2035, 80%; by 2050, by 100% from 2015 base. 6. Strategic advantage: as in (iii.) above, Adobe is enjoying revenue growth alongside the ratcheting of meaningful operational sustainability goals from its cloud strategy. Adobe products that can reduce or eliminate employee travel (Connect) & paper & printing resources (Sign), uniquely positions us to gain incremental sales revenues by helping customers become more sustainable, particularly w/ customers who have set sustainability goals. Our RE strategy underscores our commitment to take meaningful climate action: it will NOT involve purchase of unbundled RECs or offsets. Adobe used this as a strategy in the past (2012). We ultimately decided it did little to nothing to grow grid-scale RE, it carries a weak economic case for RE, and we know we can do better. This sets Adobe apart from organizations that choose to spend additional funds offsetting emissions rather than save costs eliminating them. Last, companies that do not have RE goals, SBTs, or sustainability goals are at a competitive disadvantage. This has proven to be the case in competitive bid situations where a “trusted partner” wins on the margin. vii. Substantial business decisions: In order to mitigate our climate, business, and reputational risk, in FY2016, we set SBTs and used them to set operational KPIs; set our RE Strategy and assembled an RE Task Force to achieve it; delivered a RE PPA RFP for a portion of our India operations, launched an RFP for US sites and allocated “sustainability funds” (see CC2.2d) to launch water and energy audits. 7. Adobe’s 3rd-party verified SBTs are aligned with the recommendations of the Paris Agreement, and SDA v7 IPCC guidance, with consideration of 2C scenarios implicit in the strategy to achieve them. SBTs are the means for Adobe to own and reduce its share of emissions in each country where we operate, in line with their Intended (& actual) NDCs. Adobe has adopted elements of the reporting recommendations by the TCFD to the extent that we discuss climate risk in our financial reporting (FY2016 SEC 10-K), CR Report, and Sustainability Policy Statement.
CC2.2b
Please explain why climate change is not integrated into your business strategy
CC2.2c

Does your company use an internal price on carbon? Yes
CC2.2d
Please provide details and examples of how your company uses an internal price on carbon Adobe charges each business unit for costs associated with resource consumption -- but we do not label it a "carbon tax". The goal is to implement resource efficiency projects to reduce costs, mitigate business risk, and implement new technologies (like the Stem battery system) whenever possible. However, we believe the title "carbon tax" carries a potential negative, or punitive, label that is not productive and not part of our culture. Every business unit has initiatives that reduce this cost involving sustainability leadership. Examples are "Skip a Trip" (scope 3 emissions, travel, cost reduction) and evaluation of PPAs (scope 2 emissions, cost reduction, OpEx stabilization).
CC2.3
Do you engage in activities that could either directly or indirectly influence public policy on climate change through any of the following? (tick all that apply) Direct engagement with policy makers Trade associations Other
CC2.3a
On what issues have you been engaging directly with policy makers?
Focus of legislation
Corporate Position
Details of engagement
Proposed legislative solution
Clean energy generation Support
As part of Adobe's ongoing commitment to purchasing renewable power, Adobe participated in early discussions of the first commercial Community Choice Aggregation (CCA) in Silicon Valley. The CCA was adopted in CA in 2002, but thus far no aggregation was implemented for companies. This act allows for entities in California to group together
In 2016, Adobe participated in working groups with Cities around the Bay Area to understand how the Cities can implement renewable energy (CCA for one) and procure enough power for the companies that request renewable energy. Adobe is on the City of SF BC3 group and the Bay Area Council to push for true renewable "additionality" and

Focus of legislation
Corporate Position
Details of engagement
Proposed legislative solution
and effectively form their own utility company and dictate and purchase the power mixes required. In CA, the power will be 100% renewable. Adobe was invited to participate based on the company's implementation of many energy efficiency projects and general understanding and interest in the topic.
resource reduction.
Clean energy generation Support
Adobe is a founding member in BSR’s (Business for Social Responsibility) -- Future of Internet Power Group to work with other technology peer companies as a consortium to increase the renewable energy percentage in utility company’s power mix. Additionally, Adobe was among the first companies to sign the “Renewable Energy Buyer’s Principles”, a commitment toward long-term deployment of renewable energy, sponsored by WRI, WWF, BSR, and RMI. We engage with our cloud providers: Adobe and 18 other companies that are customers of Amazon Web Services sent a letter to AWS urging the company to adopt greater energy transparency and to increase its supply of renewable energy.
In 2015 Adobe began actively engaging with all COLOs and cloud providers across the portfolio to: 1) Quantify the types of power supplied to each site annually; and 2) Encourage and support setting 100% renewable energy goals. By the end of 2016, all but one supplier were supplying sufficient data to report separate Scope 2 emissions from managed CoLos. We continue to work with these suppliers to streamline the process and attain 100% reporting compliance.
Other: Low carbon, healthy buildings (implement policies for healthy material procurement)
Support
Adobe is a founding member of the USGBC’s Building Health Initiative. The goal: to make all new construction, and renovation of older buildings, with less environmental impact and subsequently, have a positive effect on human health
Implementation of Environmental and Health Product Disclosures (EPDs and HPDs), as part of LEED v4.0, for all new and existing building projects.
Clean energy generation Support
In 2015 Adobe signed The White House's American Business Act on Climate Pledge as well as the RE100. Additionally, Adobe worked with regulators and utilities and signed a public comment to regulators in response to the long-term energy resource plan from Dominion, a major US utility. The comment called for increased investment in renewable energy on Dominion’s grid in Virginia. Adobe also engages to encourage cloud providers to go renewable: Nineteen companies that are customers of Amazon Web Services sent a letter to AWS urging the company to adopt greater energy transparency and to increase its supply of renewable energy.
As a key component of our renewable energy strategy, we have pledged to work with local utilities, NGOs, and local and federal governments to implement renewable energy policy.
Clean energy generation Support
In 2016 Adobe signed the Amicus Brief in support of the Clean Power Plan. The company worked with the Environmental Defense Fund (EDF) to sign on to this
Adobe supports the CPP because of the potential for delivering 100% renewable energy not just to our businesses in the US but to everyone in our communities at

Focus of legislation
Corporate Position
Details of engagement
Proposed legislative solution
proposal by the Obama Administration that supports the US commitments to the COP21 Paris accord.
cost parity to existing grid, or at lower cost. The company stands by this support for lowering costs and operating expenses associated with grid-scale renewables versus price variability and resource dependence from fossil fuels.
Clean energy generation Support
In 2016 Adobe signed a letter of support for the Virginia Clean Energy proposal. The company worked with our partners at the World Wildlife Fund (WWF) and Ceres to demonstrate our support of this legislation. While Adobe only has a small office site in McLean, VA, the support was for our digital supply chain providers (ex. AWS) to be able to power their data centers with 100% renewable energy.
Virginia Clean Power legislation will remove barriers to adding grid-scale renewable energy to the PJM service area, allow large data center operators to have low cost choice to getting the renewable energy, and for increasing the amount of renewable energy available to all Virginia communities.
CC2.3b
Are you on the Board of any trade associations or provide funding beyond membership? Yes
CC2.3c
Please enter the details of those trade associations that are likely to take a position on climate change legislation
Trade association
Is your position on
climate change
consistent with theirs?
Please explain the trade association's position
How have you, or are you attempting to, influence the position?
United States Green Building Council
Consistent
The United States Green Building Council proposed standards and supports legislation regarding green and sustainable building construction, practices and maintenance, including mitigation of energy and resource usage, resulting in lower carbon emissions.
Adobe's Director of Corporate Social Responsibility is a Board Member on the Northern California Chapter. of the US Green Building Council. In this capacity, Adobe will be in the forefront and in front of any new regulation that is generated to mitigate carbon emissions via better building and energy practices.

Trade association
Is your position on
climate change
consistent with theirs?
Please explain the trade association's position
How have you, or are you attempting to, influence the position?
BSR-Future of Internet Power Consistent
BSR-FoIP's goal from inception in 2013, with Adobe as one of the original 5 companies, has committed to working toward an internet powered by 100% renewable energy.
Adobe's Sustainability Strategist is one of the group's founding members and has worked with peer/partner companies to collaborate with each other, with other NGOs, utilities, regulators and policy makers to move to a low-carbon economy. Additionally, in 2016 Adobe helped create the "CoLo Buyer's Principles", much like the "Renewable Energy Buyer's Principles" to partner with cloud and CoLo suppliers to commit to powering their businesses with renewable energy.
CC2.3d
Do you publicly disclose a list of all the research organizations that you fund?
CC2.3e
Please provide details of the other engagement activities that you undertake As above, we continue to work with the Renewable Energy Buyer's Principles Alliance (REBA, aligned with RMI's BRC) -- a working consortium of companies and RMI, WRI, WWF, and BSR. This engagement gave us direct meetings with the Oregon Public Utility Commission, Dominion Energy, and local governments in India to implement renewable energy (expected online in FY2017). Additionally, BSR and WRI provided guidance on how to set our Science Based Targets (SBTs) put in place in 2016 and used as the method for defining Adobe's site-level operational KPIs.
CC2.3f
What processes do you have in place to ensure that all of your direct and indirect activities that influence policy are consistent with your overall climate change strategy? Adobe has established goals regarding reduction of energy, water, solid waste, carbon emissions and conservation of energy and natural resources. In our work with NGOs such as WRI, WWF, RMI and BSR, we are kept up-to-date on new regulations, legislation and standards. It is with these NGOs that Adobe meets with regulators, energy commissions, utility companies, sustainability groups and other entities to understand these regulations and how they will affect Adobe’s current

climate policies. Adobe directly engages with these stakeholders to ensure that they have a voice in policy and regulation regardless of whether the company completely supports the new standards or has alternative viewpoints. In 2013, Adobe hired on its first Sustainability Strategist to lead overall company climate change strategy; employee education of, and action on, climate change; and serve as point-person for collaboration and education with external peers, NGOs, and working groups. In this way, Adobe ensures that its overall sustainability and climate strategy are meeting these standards. The Sustainability Strategist meets at least quarterly with legal, government relations and other internal teams to ensure that policy engagement is consistent with overall climate change strategy. The Strategist also works closely with the operations teams to collaborate on climate change strategy programs and projects.
CC2.3g
Please explain why you do not engage with policy makers
Further Information
Page: CC3. Targets and Initiatives
CC3.1
Did you have an emissions reduction or renewable energy consumption or production target that was active (ongoing or reached completion) in the reporting year? Absolute target Intensity target Renewable energy consumption and/or production target
CC3.1a
Please provide details of your absolute target

ID
Scope
% of emissions in
scope
% reduction
from base year
Base year
Base year emissions covered by
target (metric tonnes CO2e)
Target year
Is this a
science-based target?
Comment
Abs1 Scope 1+2 (market-based) 100% 25% 2015 64736 2025
Yes, and this target has been approved as science-based by the Science Based Targets initiative
Adobe commits to reduce absolute global scope 1 and 2 emissions 25% by 2025 from 2015 levels.
Abs2 Scope 1+2 (market-based) 100% 55% 2015 64736 2040
Yes, and this target has been approved as science-based by the Science Based Targets initiative
Adobe commits to reduce absolute global scope 1 and 2 emissions 55% by 2040 from 2015 levels.
Abs3
Scope 3: Downstream transportation and distribution
100% 100% 2013 10444 2018
No, but we are reporting another target which is science-based
In 2012 Adobe adopted a cloud strategy for all products. This strategy not only made it easier and more efficient for customers to use Adobe products, but it also dematerialized our entire physical supply chain and eliminated all downstream waste from the businesses, all material waste and emissions from transportation and logistics throughout each product's lifecycle, and decreasing the environmental impact of the customers by a minimum of 70%, with an average greater than 90% reduction, and greater than 95% when customers use Adobe products from a mobile device. The goal was to achieve 100% digital download of product by 2017. By the end of 2014, Adobe achieved greater than 90% digital download. By the end of 2015, greater than 97%. At the end of 2016, greater than 98%.
CC3.1b

Please provide details of your intensity target
ID
Scope
% of emissions in scope
% reduction
from base year
Metric
Base year
Normalized base year emissions covered by
target
Target year
Is this a science-based
target?
Comment
Int1 Scope 3: Business travel
100% 5%
Metric tonnes CO2e per unit FTE employee
2015 2.09 2025
Yes, and this target has been approved as science-based by the Science Based Targets initiative
Adobe will strive to reduce scope 3 business travel emissions per employee 5% by 2025 from 2015 levels. On the heels of Adobe's 2014 launched “Skip a Trip, Use Adobe Connect instead” program, the company has implemented a SBT-verified goal. With significant business growth the last two years, employee population growth over 20% since 2014, and with CFO support of the Skip A Trip effort, this target is sufficiently ambitious but achievable for a fast-growing technology company.
Int2
Scope 3: Fuel- and energy-related activities (not included in Scopes 1 or 2)
100% 15%
Metric tonnes CO2e per square foot*
2015 0.00293 2025
Yes, and this target has been approved as science-based by the Science Based Targets initiative
Adobe will work to reduce its scope 3 Fuel and Energy Related Emissions per square foot by 15% by 2025 from 2015 levels for its owned and managed facilities.
CC3.1c
Please also indicate what change in absolute emissions this intensity target reflects

ID
Direction of change
anticipated in absolute
Scope 1+2 emissions at
target completion?
% change anticipated in absolute Scope 1+2 emissions
Direction of change
anticipated in absolute Scope 3
emissions at target
completion?
% change anticipated in absolute
Scope 3 emissions
Comment
Int1 No change 0 Increase 43
Regarding our scope 3 business travel to reduce emissions per employee by 5% from 2015 to 2025, Adobe is projected to have strong business growth and therefore travel growth. As a result, an emissions per employee intensity goal would allow us to focus on reducing travel per employee while still allowing for business growth. Looking at our growth projection, we determined that a 5% reduction in emissions per passenger was an aggressive target that over the long term would be challenging to achieve. Although IEA models predict that per-mile air travel emission factors will decrease due to reduced carbon intensity, we are not relying on emission factor reductions to achieve our goal. Rather, the way we plan to achieve our goal is to focus on reducing business travel and the resulting airline miles traveled per employee.
Int2 No change 0 Decrease 60 Because Scope 3 FERA emissions are directly related to Scope 1 and 2 emissions, we expect decreases in both Scopes 1, 2, and 3 for this target.
CC3.1d
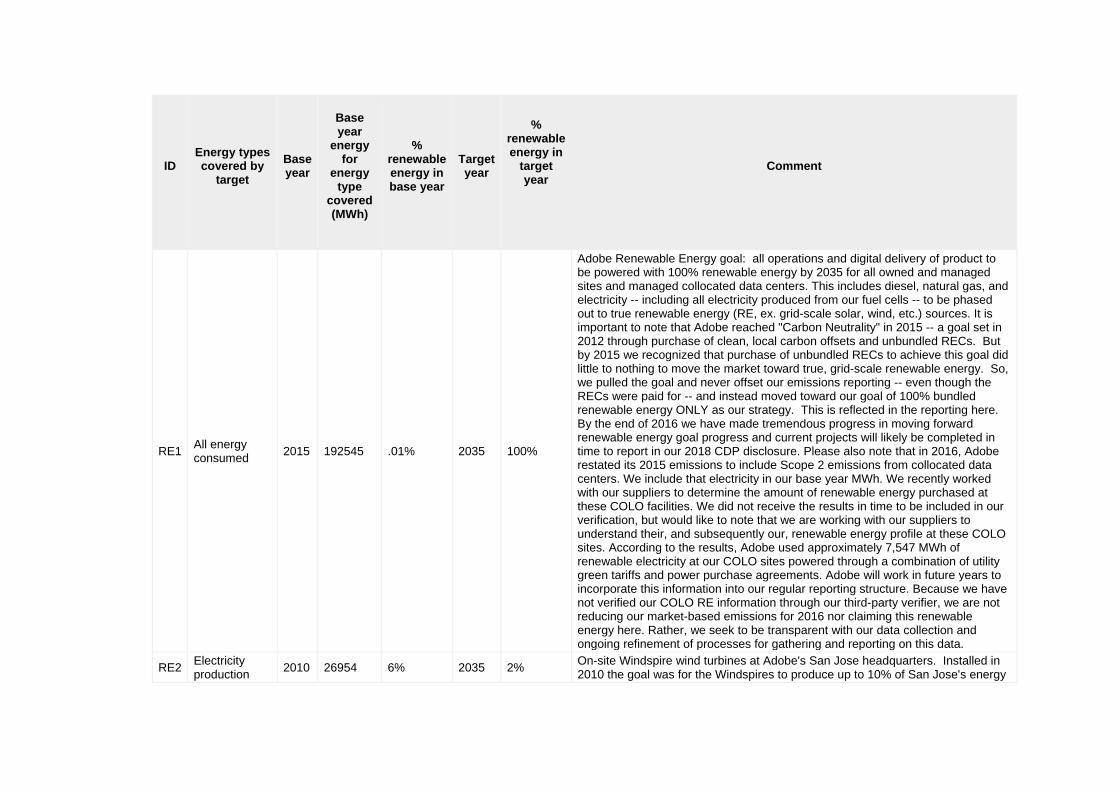
Please provide details of your renewable energy consumption and/or production target
ID
Energy types covered by
target
Base year
Base year
energy for
energy type
covered (MWh)
%
renewable energy in base year
Target year
%
renewable energy in
target year
Comment
RE1 All energy consumed 2015 192545 .01% 2035 100%
Adobe Renewable Energy goal: all operations and digital delivery of product to be powered with 100% renewable energy by 2035 for all owned and managed sites and managed collocated data centers. This includes diesel, natural gas, and electricity -- including all electricity produced from our fuel cells -- to be phased out to true renewable energy (RE, ex. grid-scale solar, wind, etc.) sources. It is important to note that Adobe reached "Carbon Neutrality" in 2015 -- a goal set in 2012 through purchase of clean, local carbon offsets and unbundled RECs. But by 2015 we recognized that purchase of unbundled RECs to achieve this goal did little to nothing to move the market toward true, grid-scale renewable energy. So, we pulled the goal and never offset our emissions reporting -- even though the RECs were paid for -- and instead moved toward our goal of 100% bundled renewable energy ONLY as our strategy. This is reflected in the reporting here. By the end of 2016 we have made tremendous progress in moving forward renewable energy goal progress and current projects will likely be completed in time to report in our 2018 CDP disclosure. Please also note that in 2016, Adobe restated its 2015 emissions to include Scope 2 emissions from collocated data centers. We include that electricity in our base year MWh. We recently worked with our suppliers to determine the amount of renewable energy purchased at these COLO facilities. We did not receive the results in time to be included in our verification, but would like to note that we are working with our suppliers to understand their, and subsequently our, renewable energy profile at these COLO sites. According to the results, Adobe used approximately 7,547 MWh of renewable electricity at our COLO sites powered through a combination of utility green tariffs and power purchase agreements. Adobe will work in future years to incorporate this information into our regular reporting structure. Because we have not verified our COLO RE information through our third-party verifier, we are not reducing our market-based emissions for 2016 nor claiming this renewable energy here. Rather, we seek to be transparent with our data collection and ongoing refinement of processes for gathering and reporting on this data.
RE2 Electricity production 2010 26954 6% 2035 2% On-site Windspire wind turbines at Adobe's San Jose headquarters. Installed in
2010 the goal was for the Windspires to produce up to 10% of San Jose's energy

ID
Energy types covered by
target
Base year
Base year
energy for
energy type
covered (MWh)
%
renewable energy in base year
Target year
%
renewable energy in
target year
Comment
by wind. Unfortunately, we have never achieved that level of production but we plan to continue to review and report on them as well as determine if the Windspires are having a positive impact on energy use, our communities perception of Adobe with this iconic symbol in San Jose, and employee and community affinity for company's who are trying to deploy on-site renewable energy generation.
RE3 Electricity consumption 2015 63660 0.01% 2035 100%
While our 100% renewable energy goal includes more than just electricity, we are cognizant that at the moment very few paths to achieve this goal on the natural gas side currently exist. Therefore we have a focus on our owned and managed sites worldwide and their electricity consumption, over which we have the largest operational control. We have made significant progress towards our goal in FY2016 and are looking forward to being able to report on this progress in 2018.
CC3.1e
For all of your targets, please provide details on the progress made in the reporting year
ID
% complete
(time)
% complete (emissions
or renewable
energy)
Comment
Abs1 10% 0%
Adobe set its Science Based Targets in late 2016 into early 2017 with a base year of 2015. We have made significant progress in 2016 in advancing our renewable energy plan and given the length of time to move projects forward, should be able to report progress on both the RE front as well as the energy efficiency front in our 2018 CDP response. While seemingly modest, Adobe has already decreased energy consumption and emissions by ~60% from 2002 baseline but the goal here is

ID
% complete
(time)
% complete (emissions
or renewable
energy)
Comment
to improve each year -- and not baseline in the distant past. Progress on location-based emissions goals focused on energy efficiency excellence to achieve overall reductions in grid and fuel energy consumption, stated in terms of emissions reductions by each site (owned and managed sites where we have control over the utility bills excluding our data center), each year. This goal was developed using each year as a baseline, and meeting/exceeding it every year going forward to 2025. The % comes from early estimates of SBTs implemented in 2016 and verified in early 2017. Also important to this goal, this is where we expect to report progress in "fuel switching" or moving natural gas or diesel powered appliances, heating, or backup generation, respectively, to renewable energy based technology. Presently, no economically viable alternatives exist but we anticipate growth in these markets prior to 2025 and well ahead of 2040.
Abs2 60% 98%
Adobe's cloud strategy was launched at the beginning of 2013 to reach 100% digital delivery of products by the end of 2018. At the end of 2016 the company exceeded 98% of all product delivered digitally, and subsequent waste and emissions reductions. While Adobe no longer procures physical products in its supply chain, we will continue to report this up until the time 100% of product is moved to digital and there is no more shipment of any physical products.
Int1 10% 100%
We have made significant progress on our Scope 3 business travel emissions reduction initiatives. Our Science Based Targets were set before we knew the results of our Scope 3 business travel emissions. Our SBTs state that Adobe will reduce emissions per employee by 5% for business travel by 2025. Our emissions per employee from 2015 to 2016 was reduced by 15%, far exceeding our goal. This is in part due to company efforts to skip unnecessary long-haul trips. For example, the "Skip a Trip -- Use Connect instead" initiative launched in 2014 has created company-wide awareness to reduce employee travel and emissions. We adjusted the time frame for this initiative to extend to 2025 due to setting our Science Based Targets as well as the success in creating awareness, encouraging employees to use Adobe Connect for meetings instead of travel, and for getting a better understanding of their contribution to Adobe's overall impact. Despite the fact that our overall business travel expanded by ~20% due to business growth, we calculate that over 100 trips skipped was equivalent to emissions avoidance of ~240 Mt CO2. We surmise that although employees may not be participating in Skip A Trip, that its impact was significant enough in awareness and cost reductions to influence behavior. Emissions calculations for Skip A Trip are based on 1. Reported trip skipped by employees including airports, stops, class, etc., and 2. Terrapass.com flight emissions (including radiative forcing).
Int2 10% 0%
Adobe set its Science Based Targets in late 2016 into early 2017 with a base year of 2015. As reported in Abs1, our targets revolve around both reaching aggressive renewable energy goals and aggressive energy efficiency goals. We expect that our FERA emissions of our owned and managed facilities will decrease simultaneously as our Scope 1 & 2 emissions decrease of the same facilities.
RE1 5% 1%
Progress on Adobe's goal to reach 100% RE by 2035. The 100% renewable goal was set in late 2015, baseline year. By the end of 2016 Adobe has made significant progress on our RE goals. However, by end FY2016 we did not complete finalization of PPAs in both India and the U.S. It is important to note that from 2014 forward, we will no longer purchase unbundled RECs or carbon credits not bundled with renewable energy and former purchases are not included in any of our reporting processes. Essentially, we will achieve our RE goals with true renewable energy alone. The "~1%" here reflects onsite RE generation

ID
% complete
(time)
% complete (emissions
or renewable
energy)
Comment
(Windspires). As mentioned above in 3.1d, we also collected data on our COLO suppliers' renewable energy. According to the results, Adobe used approximately 7,547 MWh of renewable electricity at our COLO sites powered through a combination of utility green tariffs and power purchase agreements, which would bring our % completion up to 4%. Adobe will work in future years to incorporate this information into our regular reporting structure. Because we have not verified this information through our third-party verifier, we are not reducing our market-based emissions for 2016 nor claiming the renewable energy as our own. Rather, we seek to be transparent with our data collection and ongoing refinement of processes for gathering and reporting on this data.
RE2 100% 1%
Reporting of onsite energy production. Here % complete does not reflect performance for the installed San Jose Headquarter's Windspires. The project timeline is 100% complete and the amount of emissions avoidance from this project is not likely to increase. Based on Adobe's goal of complete transparency in reporting, we will report out progress on true onsite renewable energy and will continue to report on the Windspires to CDP annually.
RE3 5% 1% As above for RE1, we have made progress on our RE goals and look forward to reporting on this concrete progress in our 2018 reporting year.
CC3.1f
Please explain (i) why you do not have a target; and (ii) forecast how your emissions will change over the next five years
CC3.2
Do you classify any of your existing goods and/or services as low carbon products or do they enable a third party to avoid GHG emissions? Yes
CC3.2a

Please provide details of your products and/or services that you classify as low carbon products or that enable a third party to avoid GHG emissions
Level of
aggregation
Description of
product/Group of products
Are you
reporting low carbon
product/s or avoided
emissions?
Taxonomy, project or
methodology used to classify
product/s as low carbon or to calculate
avoided emissions
%
revenue from low carbon
product/s in the
reporting year
% R&D in
low carbon
product/s in the
reporting year
Comment
Product
Document Cloud and Adobe Sign: create, edit, share, sign, and store documents digitally versus any paper workflow.
Low carbon product
Evaluating the carbon reducing impacts of ICT
14.9%
More than 10% but less than or equal to 20%
Customer use of Adobe Sign (part of Adobe Document Cloud along with PDF, Acrobat, etc.), can eliminate paper workflows and substantially reduce paper and printing resource consumption (wood, water, waste, and emissions) from the paper production process. The impact reduction is so significant that Adobe, in partnership with the Environmental Defense Fund (EDF) and the Environmental Paper Network (EPN), developed the Resource Saver Calculator specifically -- and conservatively -- estimate water, wood, waste, and cost avoidance simply by using Adobe's digital tools versus a paper workflow. See https://blogs.adobe.com/documentcloud/resource-saver-calculator/
Product Adobe Connect: our URL/web-based meeting platform.
Low carbon product and avoided emissions
Evaluating the carbon reducing impacts of ICT
4% Less than or equal to 10%
URL based meeting platform. Many large corporations use Connect to avoid employee travel and reduce emissions. We estimate with over 6 billion meeting minutes (100M meeting hours) completed in 2016, and only about 5% of these represent avoided business travel (Skip a Trip: Connect instead) a minimum of 6M tonnes CO2e were potentially avoided by Adobe customers and employees.
Group of products
Creative Cloud: incorporating, Photoshop, InDesign, Premiere, After Effects, Behance,
Low carbon product
Evaluating the carbon reducing impacts of ICT
51.8%
More than 40% but less than or equal to 60%
Creative Cloud as a low carbon product offering versus Creative Suite and individual products (all boxed). Independent analysis of the overall environmental impact of each product, and using the Lawerence Berkeley Labs (LBL) CLEER method for estimating data center consumption of a

Level of
aggregation
Description of
product/Group of products
Are you
reporting low carbon
product/s or avoided
emissions?
Taxonomy, project or
methodology used to classify
product/s as low carbon or to calculate
avoided emissions
%
revenue from low carbon
product/s in the
reporting year
% R&D in
low carbon
product/s in the
reporting year
Comment
Spark, Stock, etc. all consolidated in a single cloud offering (with options) versus each as a boxed, physical product (Creative Suite + individual products)
digitally delivered product, we estimate that the impact is at least 90% less than it was as a physical product, 95% when used with a mobile device. The advent of cloud storage for customer workproducts in Creative Cloud has removed the need to print or even store on a local device (PC, workstation, etc.).
CC3.3
Did you have emissions reduction initiatives that were active within the reporting year (this can include those in the planning and/or implementation phases) Yes
CC3.3a
Please identify the total number of projects at each stage of development, and for those in the implementation stages, the estimated CO2e savings

Stage of development
Number of projects
Total estimated annual CO2e savings in metric tonnes CO2e (only for rows marked *)
Under investigation 2 8050 To be implemented* 5 500 Implementation commenced* 1 3000 Implemented* 5 389 Not to be implemented 1 200
CC3.3b
For those initiatives implemented in the reporting year, please provide details in the table below
Activity type
Description of activity
Estimated annual CO2e
savings (metric tonnes CO2e)
Scope
Voluntary/ Mandatory
Annual monetary savings
(unit currency
- as specified in CC0.4)
Investment required
(unit currency -
as specified in CC0.4)
Payback period
Estimated lifetime of
the initiative
Comment
Energy efficiency: Building services
The projects ranged from LED installations to server room temperature adjustments. Several additional projects did not have sufficient data capabilities to analyze CO2e savings and so they are not reported
333
Scope 2 (market-based)
Voluntary 250000 500000 1-3
years 3-5 years
Important to note that the vast majority of major and minor energy efficiency projects have been completed and have enjoyed an ROI in ~1.5 years for 80% of over 180 projects. The goal here is to do everything possible, each year, to adopt new technologies and processes to

Activity type
Description of activity
Estimated annual CO2e
savings (metric tonnes CO2e)
Scope
Voluntary/ Mandatory
Annual monetary savings
(unit currency
- as specified in CC0.4)
Investment required
(unit currency -
as specified in CC0.4)
Payback period
Estimated lifetime of
the initiative
Comment
here but we expect that they contributed positively to emissions reductions.
minimize energy consumption and subsequent emissions. These market-based emissions represent 389 MTCO2e of location-based emissions.
Low carbon energy purchase
Managed collocated data center purchase of renewable energy.
0
Scope 2 (market-based)
Voluntary
Please note that in 2016, Adobe began including Scope 2 electricity emissions from our managed collocated data centers. We recently worked with our suppliers to determine the amount of renewable energy purchased at these COLO facilities. We did not receive the results in time to be included in our verification and subsequently in our reporting, but would like to note that we are working with our suppliers to understand their, and subsequently our, renewable energy profile at these COLO sites. According to the results, Adobe used approximately 7,547 MWh of renewable electricity at our COLO sites powered through a combination of utility green tariffs and power purchase agreements. Adobe will work

Activity type
Description of activity
Estimated annual CO2e
savings (metric tonnes CO2e)
Scope
Voluntary/ Mandatory
Annual monetary savings
(unit currency
- as specified in CC0.4)
Investment required
(unit currency -
as specified in CC0.4)
Payback period
Estimated lifetime of
the initiative
Comment
in future years to incorporate this information into our regular reporting structure so that we can identify the reduction in CO2e through market-based and location-based emissions. Because we have not verified this information through our third-party verifier, we are not reducing our market-based emissions for 2016 nor claiming this renewable energy here. Rather, we seek to be transparent with our data collection and ongoing refinement of processes for gathering and reporting on this data.
CC3.3c
What methods do you use to drive investment in emissions reduction activities?

Method
Comment
Compliance with regulatory requirements/standards
All construction projects follow efficiency and code requirements to achieve better energy efficiency. Adobe has publicly advocated for passing stricter code compliance and other related sustainability standards. In each project, Adobe management has always reached minimum compliance and in most projects goes well beyond mere compliance to achieve a sustainability and efficiency-focused project.
Dedicated budget for energy efficiency
Adobe has a budget for its very comprehensive energy efficiency program. While Adobe does not use the terminology "Carbon Tax" simply because of the punitive overtone for business units that are doing exceptionally well with energy efficiency, the funds gained from this allocation are used specifically for sustainability and energy efficiency projects. This budget is prepared by the facilities group and overseen by the Director of Global Site Operations (GSO). GSO has a Sustainability Committee, comprised of cross-departmental members that meets every two weeks to discuss priorities, projects and budgets. A Sustainability Strategy Committee with the Director of Corporate Social Responsibility, VP of Marketing, VP of Operations (Global Workplace Solutions), and the CFO further reviews projects and sustainability initiatives, as needed.
Dedicated budget for low carbon product R&D
Many of Adobe products, such as Adobe Document Cloud (PDF, Adobe Sign), and Adobe Connect (TM), and LeanPrint allow users to operate more sustainably - virtually - using ICT in place of paper and ink, inefficient workflows, and physical travel. These products enable resource use and emissions reduction and are major core deliverables for Adobe with dedicated budget for continued development. Case in point, Adobe Procurement adopted Adobe Sign and enjoyed a 70% reduction in transaction time as well as an 80% decrease in printing purchases and subsequent paper and ink use and waste. See http://wwwimages.adobe.com/content/dam/Adobe/en/customer-success/pdfs/adobe-at-adobe-esign-procure-case-study.pdf
Employee engagement
Adobe fosters a culture of sustainability by encouraging employees to engage in the Green Teams. Currently, Green Teams make up over 10% of the total employee population. The Green Teams receive funding from Adobe to independently organize and run emission reduction activities to target emissions generated by Adobe as well as the community as a whole. These projects include planting on-site "edible gardens" for the cafeteria, organizing e-waste drives, employee discounts for living more sustainably (EVs, solar, etc.) and educational lunch-and-learn opportunities.
Financial optimization calculations
All significant environmental initiatives are reviewed by the Vice President of Global Workplace Solutions and, for most large-scale projects or commitments, is reviewed by at least one member of the C-suite. All investment decisions in sustainability-related and emissions reduction projects involve careful financial analysis to assess the viability of each initiative. Market research, benchmarking, and investment modeling are employed to justify environmental projects.
Partnering with governments on technology development
Adobe has partnered with a number of government agencies including General Services Administration (GSA), Lawrence Berkeley Labs (LBL) and Center for Built Environment (CBE), sharing best practices, including development of Adobe's energy monitoring system, IBIS (Intelligent Building Interface System) which Adobe uses to monitor and manage carbon emissions, energy usage, water usage, and alternative energy production as well as potential renewable energy projects in the Bay Area.
Other
Voluntary compliance with standards developed by organizations such as Australia's NABERS, U.S. Environmental Protection Agency's Energy Star for Buildings, and the U.S. Green Building Council's Leadership in Energy and Environmental Design (LEED) programs have been pivotal to shaping Adobe's emissions and energy reduction strategy. Adobe currently operates twenty-five LEED-certified facilities across the globe, with nineteen at the Platinum level.. Adobe's buildings were the first buildings to be certified and re-certified at the Platinum level (the highest level possible) under the permanent LEED for Existing Buildings Program.

CC3.3d
If you do not have any emissions reduction initiatives, please explain why not
Further Information
Page: CC4. Communication
CC4.1
Have you published information about your organization’s response to climate change and GHG emissions performance for this reporting year in places other than in your CDP response? If so, please attach the publication(s)
Publication
Status
Page/Section reference
Attach the document
Comment
In other regulatory filings
Complete 12
https://www.cdp.net/sites/2017/33/333/Climate Change 2017/Shared Documents/Attachments/CC4.1/CRS R44480_Clean Power Plan- Legal Background and Pending Litigation in West Virginia v. EPA.pdf
Filed with the Environmental Defense Fund (EDF), Adobe supported President Obama's Clean Power Plan in 2016. Please see EDF's communications: https://www.edf.org/media/clean-power-plan-amicus-briefs-show-unstoppable-momentum-climate-action The Clean Power Plan is the single biggest step America has ever taken to address the threat of climate change. It established the first-ever national limits on carbon pollution from fossil-fuel fired power plants – the largest source of such pollution in the U.S. EPA estimates that by 2030, the Clean Power Plan will: Reduce carbon pollution from existing power plants 32 percent below 2005 levels. Save 3,600 lives annually. Prevent 90,000 childhood asthma attacks annually. Save American families almost $85 on their annual energy bill.
In other regulatory filings
Complete 3
https://www.cdp.net/sites/2017/33/333/Climate Change 2017/Shared Documents/Attachments/CC4.1/11142016 VA-RE_
Virginia (VA) Renewable Energy letter of support. Adobe, along with 18 other major corporations, provided public support of the state's renewable energy initiatives. The

Publication
Status
Page/Section reference
Attach the document
Comment
Appalachian Power Co petition for approval of a renewable energy rider.pdf
letter of support, led by the World Wildlife Fund (WWF), has been an influential instrument in proving that action taken on climate change is good for business. In Adobe's case, we fully support this type of legislation and even though we only maintain small leased offices in Virginia, this type of legislation enables our digital supply chain providers to set and achieve their renewable energy goals for their operations in Virginia. More on the renewable energy support in Virginia from the Richmond Times-Dispatch: http://www.richmond.com/business/major-companies-call-for-more-renewable-energy-options-in-virginia/article_57df1b1e-8e36-5786-b15e-b582771772d1.html
In mainstream reports (including an integrated report) in accordance with the CDSB Framework
Complete 31
https://www.cdp.net/sites/2017/33/333/Climate Change 2017/Shared Documents/Attachments/CC4.1/2016 ADBE-10K-FY16-FINAL-CERTIFIED.pdf
Adobe's 2016 10-K final report includes a section disclosing the company's position on climate change and associated risk. Please see page 31 of the report here and at https://wwwimages2.adobe.com/content/dam/Adobe/en/investor-relations/PDFs/ADBE-10K-FY16-FINAL-CERTIFIED.PDF
In voluntary communications
Complete 2
https://www.cdp.net/sites/2017/33/333/Climate Change 2017/Shared Documents/Attachments/CC4.1/CR_Report_2016_Final.pdf
Attached, the 2016 CR report. See pages 2 (our CEO letter), 4 (highlights), 6-7 (sustainability data disclosure). The CR Report, and all sustainability-related reports, can be found at http://www.adobe.com/corporate-responsibility/corporate-responsibility-reports.html
In other regulatory filings
Underway - previous year attached
Archived page 5
https://www.cdp.net/sites/2017/33/333/Climate Change 2017/Shared Documents/Attachments/CC4.1/2016 White House American Business Act on Climate Pledge _ whitehouse.pdf
While the business commitments were removed in late January 2017, the archived pages from the U.S. Obama Administration survive and demonstrate our 2015 commitment -- which is honored today and going forward. Adobe has made a number of public commitments to the Paris Agreement, advocacy to stay in the accord, and will remain faithful to this commitment. Please see https://obamawhitehouse.archives.gov/the-press-office/2015/11/30/white-house-announces-additional-commitments-american-business-act

Further Information
Module: Risks and Opportunities
Page: CC5. Climate Change Risks
CC5.1
Have you identified any inherent climate change risks that have the potential to generate a substantive change in your business operations, revenue or expenditure? Tick all that apply Risks driven by changes in regulation Risks driven by changes in physical climate parameters Risks driven by changes in other climate-related developments
CC5.1a
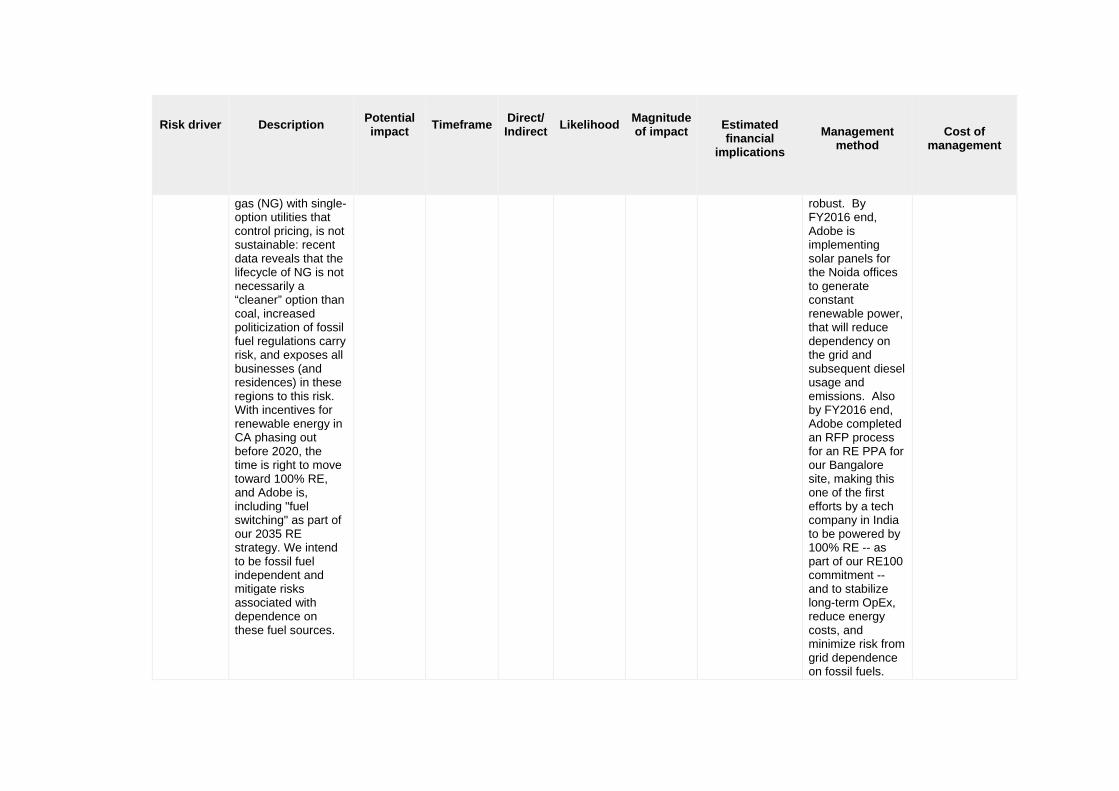
Please describe your inherent risks that are driven by changes in regulation
Risk driver
Description
Potential impact
Timeframe
Direct/ Indirect
Likelihood
Magnitude of impact
Estimated financial
implications
Management
method
Cost of
management
Fuel/energy taxes and regulations
Variable costs and increased taxes on fuel/energy necessary to run our operations imparts inherent risk to our business. For all owned and leased sites, as well as co-
Increased operational cost
3 to 6 years Direct Virtually
certain Medium-high
New initiatives involve consultants to scope out locations and research power mixes and regulations, leases and
Adobe's management of this risk is to ensure facilities are certified as green buildings under Leadership in Energy and Environmental
By mitigating risks in the beginning, costs would run about $75,000-$125,000 per building, including costs of consultants. As

Risk driver
Description
Potential impact
Timeframe
Direct/ Indirect
Likelihood
Magnitude of impact
Estimated financial
implications
Management
method
Cost of
management
located data centers (CoLos) where Adobe pays the utility bill, electricity costs are a significant portion of total OpEx. With variable utility costs, increased taxes from regulations, and in some regions, potential lack or even loss of energy availability the risk grows. For example, our Noida, India site is subject to scheduled brown-outs that requires use of back-up diesel generators for business continuity. Any reliance on these generators, on a fossil-fuel dependent grid, carries significant emissions, costs and availability risk -- but also huge opportunities to address this risk by switching to RE. In California, reliance on a grid primarily powered by natural
agreements. This can cost up to $100,000 per building/leased facility.
Design (LEED) under the United States Building Council (USGBC). This certification program offers a structured approach to ensuring that the facility maintains its sustainability, through a series of focused actions. The LEED program serves as both. Adobe has even certified its owned data center to LEED-Gold standards. In 2014, as Adobe expanded its operations in India and realized the risks inherent in the unreliable grid, the company decided to invest in green building initiatives in the India facilities, as green buildings historically consume less energy and are
we finalize an RE PPA for our Bangalore site in mid-2017 and launch an RE PPA RFP in CA (and for owned sites in Utah and Oregon) our push is for cost-parity as a minimum for entering into an agreement, ideally (and likely, only) if there is a cost benefit. Prices will depend on local utility costs now and predicted in the future and we are exploring virtual PPAs (vPPAs) and contract for differences (CFD) options. We will have progress to report in 2018 reporting cycle.
Risk driver
Description
Potential impact
Timeframe
Direct/ Indirect
Likelihood
Magnitude of impact
Estimated financial
implications
Management
method
Cost of
management
gas (NG) with single-option utilities that control pricing, is not sustainable: recent data reveals that the lifecycle of NG is not necessarily a “cleaner” option than coal, increased politicization of fossil fuel regulations carry risk, and exposes all businesses (and residences) in these regions to this risk. With incentives for renewable energy in CA phasing out before 2020, the time is right to move toward 100% RE, and Adobe is, including "fuel switching" as part of our 2035 RE strategy. We intend to be fossil fuel independent and mitigate risks associated with dependence on these fuel sources.
robust. By FY2016 end, Adobe is implementing solar panels for the Noida offices to generate constant renewable power, that will reduce dependency on the grid and subsequent diesel usage and emissions. Also by FY2016 end, Adobe completed an RFP process for an RE PPA for our Bangalore site, making this one of the first efforts by a tech company in India to be powered by 100% RE -- as part of our RE100 commitment -- and to stabilize long-term OpEx, reduce energy costs, and minimize risk from grid dependence on fossil fuels.

Risk driver
Description
Potential impact
Timeframe
Direct/ Indirect
Likelihood
Magnitude of impact
Estimated financial
implications
Management
method
Cost of
management
Renewable energy regulation
As Adobe moves toward 100% digital delivery of products (currently over 98% digital delivery), access and availability of renewable power becomes highly important to maintain Adobe's climate action objectives as well as uninterruptible delivery of product to our customers. Potential regulations that make renewable energy (RE) economically unfavorable for businesses to choose it over fossil fuel grid energy makes delivery of product subject to the risk of the grids our data center and CoLo partners are on. Both the risk of potential unavailability of RE and misunderstanding of regulations that either promote its
Increased operational cost
1 to 3 years Direct Very likely Medium-
high
New initiatives involve renewable energy consultants to scope out locations and research power mixes and regulations. Renewable power can be more expensive than existing grid power, except in certain locations such as states in India where we have found it to be lower cost than grid.
In 2016, Adobe finalized its plan to meet its aggressive renewable energy goals starting first at its owned and managed sites. This involves first focusing on efficiency and conservation methods in each of its sites, and then looking at on-site and power purchase agreements for renewable energy while simultaneously working with NGOs, utilities, and other groups to affect renewable energy on the grid. For example, we took advantage of RE policies in place in India to begin the process of signing a PPA. Additionally, we worked with our collocated data
Staff time as well as consultant time to determine overall efficiency and renewable strategy is ongoing.

Risk driver
Description
Potential impact
Timeframe
Direct/ Indirect
Likelihood
Magnitude of impact
Estimated financial
implications
Management
method
Cost of
management
proliferation, or deter it, can prevent sites from both financial and functional efficiency.
centers to understand their baseline of renewable energy and how that affects our Scope 2 reporting.
CC5.1b
Please describe your inherent risks that are driven by changes in physical climate parameters
Risk driver
Description
Potential
impact
Timeframe
Direct/
Indirect
Likelihood
Magnitude
of impa
ct
Estimated
financial
implications
Management method
Cost of management
Change in temperature extremes
Changes in temperature extremes will result in need for increased energy use to heat and cool Adobe's facilities. Increasingly, the high potential for increased costs to our digital supply chain (Cloud and CoLo suppliers) that would ultimately be passed on to Adobe is becoming more important due to these suppliers' increasing scale and
Increased operational cost
3 to 6 years
Direct
Very likely
Medium-high
Potential financial implications of temperature extremes
Our renewable energy strategy will mitigate risks for rising utility costs as well grid reliability. For example, our Hillsboro, OR site (OR1) was chosen for Adobe's only owned data center because of the potential for moving it to 100% RE as well as a "low" assessed climate risk (high ground, not in a floodplain, moderate drought potential). Also, Adobe's digital supply chain (OR1, Cloud & CoLos) is a "hybrid cloud" that limits our risk for delivering product to customers. Increasing reliance on our
Adobe's long-term digital business strategy is to drive innovati

Risk driver
Description
Potential
impact
Timeframe
Direct/
Indirect
Likelihood
Magnitude
of impa
ct
Estimated
financial
implications
Management method
Cost of management
majority portion of our emissions. This is particularly true in cases where these data centers operate in non-temperate climate zones like Texas, Virginia, and throughout the midwest U.S. Adobe anticipates that these costs would significantly impact overall costs of operation as well as could result in energy shortages. While Adobe's only wholly-owned data center is in a temperate location (Hillsboro, Oregon), this risk is less likely but with expansion of our business, this will represent a smaller portion of our digital supply chain. We are addressing this potential climate parameter with our vendors.
include cooling and heating strategies and even loss of power itself which would be detrimental for the data centers. Annual utility spend is currently over $7M per year; increases in utility costs for
digital partners has eliminated risk: greater virtualization, higher utilization rates, data de-duplication reduction of redundant processes, as well as greater economies of their scale. But this relationship with our partners presents a greater opportunity to work with them in developing 100% RE strategies. By doing so, they will reduce risk, long-term costs, all while achieving greater economies of scale. In 2016 through our partners at BSR's Future of Internet Power working group, we developed a CoLo and Cloud Buyer's Principles (https://www.bsr.org/files/work/BSR_Corporate_Colocation_Cloud_Buyers_Principles.pdf) We also publicly supported policy in Virginia specifically to encourage broader adoption of RE by commenting on Dominion's petition for approval of an 100% renewable energy rider. Adobe does not own a data center there, but our digital supplier does, so we want to show good faith in supporting their RE goals (p.4: http://scc.virginia.gov/docketsearch/DOCS/3bx201!.PDF)
ve, uninterruptible delivery of products to customers. Energy efficiency throughout our operations -- digital and workspaces -- drives down costs and allows the company to accurately provision renewa

Risk driver
Description
Potential
impact
Timeframe
Direct/
Indirect
Likelihood
Magnitude
of impa
ct
Estimated
financial
implications
Management method
Cost of management
additional heating and cooling coupled with the potential of needing to restart data centers if the power suddenly turns off could double the current utility spend and impact business operations for an
ble energy (RE). Our work in implementing RE PPAs for major owned and operated sites requires that we manage our business with operational excellence and this is the only economic way to ensure we are entering

Risk driver
Description
Potential
impact
Timeframe
Direct/
Indirect
Likelihood
Magnitude
of impa
ct
Estimated
financial
implications
Management method
Cost of management
estimated total impact of over $7M.
into the right RE terms. Operational excellence in our data center operations, as well as our digital supply chain operations, require that we understand these potential costs and do everything we can to stabilize and lower

Risk driver
Description
Potential
impact
Timeframe
Direct/
Indirect
Likelihood
Magnitude
of impa
ct
Estimated
financial
implications
Management method
Cost of management
them -- even looking out to 2035 when we intend to be running on 100% RE. We budget incrementally each year to address these challenges.
Change in mean (average) precipitation
Drought poses risk and added costs to our business. Access to clean water and reliable energy in the communities where we conduct our business, whether for our offices of for our vendors, is a priority. Our major operations in California and India are vulnerable as they are in areas where drought has become the norm. While Adobe has reduced
Increased operational cost
>6 years
Direct
Virtually certain
Medium-high
As with temperature extremes, a primary risk is in operational
Our management method is: 1. Water conservation methods at all Adobe sites, including but not limited to transitioning to water softener installations in cooling towers to limit the need to change out water -- which Adobe did in 2015 and subsequently lowered our global water consumption by over 6% -- to waterless urinals and water-efficient dishwashers in our break rooms and cafes. These efforts remain in line with LEED Platinum guidance. 2. Investigate new technologies to either capture or
Majority of costs due associated with water conservation at our sites

Risk driver
Description
Potential
impact
Timeframe
Direct/
Indirect
Likelihood
Magnitude
of impa
ct
Estimated
financial
implications
Management method
Cost of management
water consumption by 60-70% since 2005, and we continue to deploy every conservation method possible throughout our operations, drought produces risk to maintaining a growing employee population in an area with very little water, it poses risk and cost to our cooling operations, and it poses great risk to energy prices with the majority of energy in local grids coming from large hydro. We believe this risk is significant enough to list this as a business risk in 2016 Adobe 10-K report: https://wwwimages2.adobe.com/content/dam/Adobe/en/investor-relations/PDFs/ADBE-10K-FY16-FINAL-CERTIFIED.PDF
cost increase and reduced availability of both energy and water to our operations and in the communities where we do business. Annual utility spend is currently around $7M per year; increas
recycle water. This is a priority in our Bangalore site where the surrounding community has endured extremely dire droughts. 3. Work with local utilities to encourage water recycling, purple pipe installation, runoff capture, etc. 4. Educate employees on what they can do at home to conserve but also to make the most out of living in a drought environment (the goal to recruit and retain talent). We can do a lot to become water efficient in our operations but encouraging and educating those in our communities to take action is also key.
have already been incurred. However, adoption of new technologies runs into the thousands of dollars and each project should have a reasonable (3-5 years) ROI. Water audits planned for 2017, as well as

Risk driver
Description
Potential
impact
Timeframe
Direct/
Indirect
Likelihood
Magnitude
of impa
ct
Estimated
financial
implications
Management method
Cost of management
es in utility costs for both water and energy impact business operations for an estimated total impact of over $7M ($7M in energy, unknown for additional water costs).
investigation into water recycling and reuse at majority sites, will involve TBD costs. But these types of projects may have an attractive ROI in terms of securing business continuity and we will continue to investig

Risk driver
Description
Potential
impact
Timeframe
Direct/
Indirect
Likelihood
Magnitude
of impa
ct
Estimated
financial
implications
Management method
Cost of management
ate.
CC5.1c
Please describe your inherent risks that are driven by changes in other climate-related developments
Risk driver
Description
Potential impact
Timeframe
Direct/
Indirect
Likelihood
Magnitude
of impac
t
Estimated
financial
implications
Management
method
Cost of manage
ment
Reputation
Adobe strives to be a leader in mitigating the short- and long-term effects of climate change, not only to reduce cost through operational excellence but also to drive revenue/incremental sales by building on our trusted brand. For either of these, reputational "hits" can directly affect revenues and economic resiliency. As examples: 1. Ongoing short-term goals of energy efficiency have boosted our reputation/brand. This is evidenced in a recent case study by PG&E (CA utility) that highlighted Adobe's implementation of well over 180 (as of 2016, over 200) significant emissions-reductions projects for over a decade, and inspired customers and peers to query us for best practices: https://www.pge.com/includes/docs/pdfs/mybusiness/energysavingsrebates/incentivesbyindustry/hightech/cs_adobe.pdf and, 2. Long-term goal to run our operations and digital delivery of product with 100% renewable energy (RE) by 2035. Please see our CEO's statement on this (page 2) of
Reduced demand for goods/services
>6 years
Direct
About as likely as not
High
Risks associated with reputational "hits" could potentially impact overall revenue. Quantify
In 2016 Adobe implemented Science-Based Targets (SBTs) that are now formally our operational KPIs
Cost savings from implementing renewable energy could exceed $1M in operation costs per

Risk driver
Description
Potential impact
Timeframe
Direct/
Indirect
Likelihood
Magnitude
of impac
t
Estimated
financial
implications
Management
method
Cost of manage
ment
our 2016 CR Report (2016 Sustainability + Social Impact data): http://wwwimages.adobe.com/content/dam/acom/en/corporate-responsibility/pdfs/CR_Report_2016_Final.pdf. We believe both examples have boosted our brand and we recognize that failing to meet our ambitious goals due to circumstances beyond our control could potentially negatively impact customer perception of our brand and could have a negative effect on business revenue.
ing by how much based on 2016 revenues of $5.5B US is hard to predict but would depend on the level of reputational impact. As an example, if a reputational hit due to a failure to achieve a climate change commitment
for each site that roll up into our global SBT goals. These SBTs translate to specific short-term goals and KPIs: 2% annual emissions reductions through energy efficiency projects. Long-term, Adobe the SBTs
year. This is to be determined based on PPA pricing, onsite costs, etc. but Adobe anticipates cost stabilization (OpEx predictability), cost savings, reputation enhancement, and potential incremental sales revenue from brand lift

Risk driver
Description
Potential impact
Timeframe
Direct/
Indirect
Likelihood
Magnitude
of impac
t
Estimated
financial
implications
Management
method
Cost of manage
ment
were to impact our sales revenue by just 0.1%, that would equate to revenue decrease of $5.5M, as well as increased operational costs. In this case, there would be economic justification to ensure projects
have the milestones of 2025 and long-term (2050) goals that align with our 100% renewable energy goal by 2035. This relies on: 1) energy efficiency and energy reduction per square foot; 2) implement on-site renewab
of our renewable energy goals and achievements as well as from customer purchases due to environmental attributes of our products.

Risk driver
Description
Potential impact
Timeframe
Direct/
Indirect
Likelihood
Magnitude
of impac
t
Estimated
financial
implications
Management
method
Cost of manage
ment
that address climate change (ex. energy efficiency) are implemented.
le energy when economically feasible; 3) actively work with NGOs and peers to increase the economic benefit of renewable energy purchasing; and 4) investigate RE PPAs and work with our digital suppliers to set

Risk driver
Description
Potential impact
Timeframe
Direct/
Indirect
Likelihood
Magnitude
of impac
t
Estimated
financial
implications
Management
method
Cost of manage
ment
and achieve 100% RE goals. In 2016, we completed an RFP for an off-site RE PPA for our Bangalore site (online in 2017) and we began the RFP process for some of our strategic U.S. sites. The focus is based on true renewable

Risk driver
Description
Potential impact
Timeframe
Direct/
Indirect
Likelihood
Magnitude
of impac
t
Estimated
financial
implications
Management
method
Cost of manage
ment
energy "additionality" -- no unbundled RECs or offsets -- into the grids where we work and live so everyone in our communities can enjoy the benefits and anticipated cost savings of RE. As a reputational lift to the Adobe brand, our

Risk driver
Description
Potential impact
Timeframe
Direct/
Indirect
Likelihood
Magnitude
of impac
t
Estimated
financial
implications
Management
method
Cost of manage
ment
customers will enjoy using products delivered by renewable energy with a minimum environmental impact.
CC5.1d
Please explain why you do not consider your company to be exposed to inherent risks driven by changes in regulation that have the potential to generate a substantive change in your business operations, revenue or expenditure
CC5.1e

Please explain why you do not consider your company to be exposed to inherent risks driven by changes in physical climate parameters that have the potential to generate a substantive change in your business operations, revenue or expenditure
CC5.1f
Please explain why you do not consider your company to be exposed to inherent risks driven by changes in other climate-related developments that have the potential to generate a substantive change in your business operations, revenue or expenditure
Further Information
Page: CC6. Climate Change Opportunities
CC6.1
Have you identified any inherent climate change opportunities that have the potential to generate a substantive change in your business operations, revenue or expenditure? Tick all that apply Opportunities driven by changes in regulation Opportunities driven by changes in physical climate parameters Opportunities driven by changes in other climate-related developments
CC6.1a
Please describe your inherent opportunities that are driven by changes in regulation
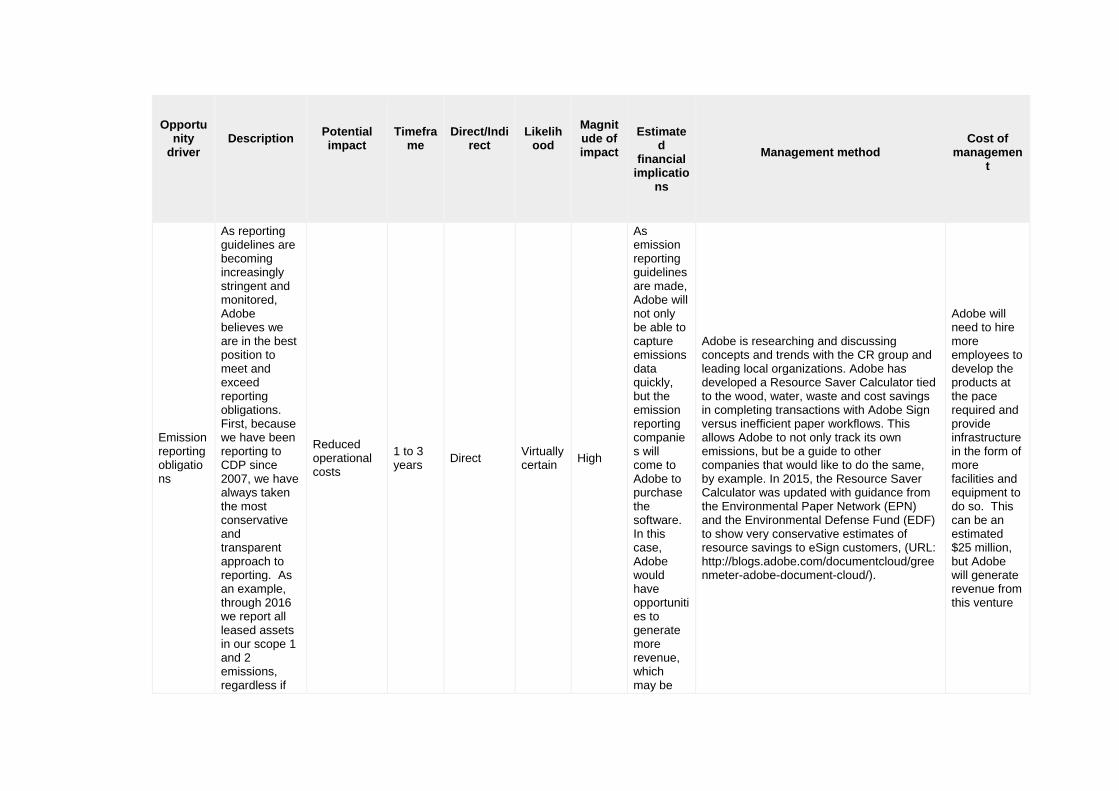
Opportunity
driver
Description
Potential impact
Timeframe
Direct/Indirect
Likelihood
Magnitude of impact
Estimated
financial implicatio
ns
Management method
Cost of
management
Emission reporting obligations
As reporting guidelines are becoming increasingly stringent and monitored, Adobe believes we are in the best position to meet and exceed reporting obligations. First, because we have been reporting to CDP since 2007, we have always taken the most conservative and transparent approach to reporting. As an example, through 2016 we report all leased assets in our scope 1 and 2 emissions, regardless if
Reduced operational costs
1 to 3 years Direct Virtually
certain High
As emission reporting guidelines are made, Adobe will not only be able to capture emissions data quickly, but the emission reporting companies will come to Adobe to purchase the software. In this case, Adobe would have opportunities to generate more revenue, which may be
Adobe is researching and discussing concepts and trends with the CR group and leading local organizations. Adobe has developed a Resource Saver Calculator tied to the wood, water, waste and cost savings in completing transactions with Adobe Sign versus inefficient paper workflows. This allows Adobe to not only track its own emissions, but be a guide to other companies that would like to do the same, by example. In 2015, the Resource Saver Calculator was updated with guidance from the Environmental Paper Network (EPN) and the Environmental Defense Fund (EDF) to show very conservative estimates of resource savings to eSign customers, (URL: http://blogs.adobe.com/documentcloud/greenmeter-adobe-document-cloud/).
Adobe will need to hire more employees to develop the products at the pace required and provide infrastructure in the form of more facilities and equipment to do so. This can be an estimated $25 million, but Adobe will generate revenue from this venture

Opportunity
driver
Description
Potential impact
Timeframe
Direct/Indirect
Likelihood
Magnitude of impact
Estimated
financial implicatio
ns
Management method
Cost of
management
we never see a utility bill and need to estimate them. Second, Adobe's cloud strategy has changed the way we and our customers conduct business. By moving to a digital product we can more accurately account for the environmental impact our customers have when using them. This also resulted in a methodology change for our Scope 2 reporting; our product moving into the cloud means that in 2016 we began
about 10% of overall revenue or $4.15 million.

Opportunity
driver
Description
Potential impact
Timeframe
Direct/Indirect
Likelihood
Magnitude of impact
Estimated
financial implicatio
ns
Management method
Cost of
management
reporting our managed CoLo emissions in Scope 2 rather than Scope 3, because we perceive operational control. Last, Adobe's digital products have reduced the environmental impact versus boxed software by at least 90% by eliminating a physical supply chain, reducing carbon emissions from transportation and erasing end-of-life product waste.
Renewable energy regulatio
2. Ratification of the US Clean Power Plan. Adobe
Reduced operational costs
>6 years Direct Likely High
$1M or more in cost savings
As with SB 286, above, in 2016 Adobe worked actively with peer companies as well as trusted NGOs to engage with the US federal government in promoting the CPP
Low- to no-cost. Cost is embedded in employee/FT

Opportunity
driver
Description
Potential impact
Timeframe
Direct/Indirect
Likelihood
Magnitude of impact
Estimated
financial implicatio
ns
Management method
Cost of
management
n assesses that if the guidelines of the CPP are adopted by more states, PUCs, and utilities where we operate -- regardless of the final court rulings -- it will increase the amount of true renewable energy (RE) in each state's RE portfolio (RPS) and what is delivered to everyone in these regions. Again, regardless of the court's decision on the CPP, adoption of higher RE RPS goals over the next 10-15 years will very likely
as well as anticipated cost stabilization / OpEx predictability.
and other broader efforts that support action on addressing climate change.
E time working with various groups and in travel (if any).

Opportunity
driver
Description
Potential impact
Timeframe
Direct/Indirect
Likelihood
Magnitude of impact
Estimated
financial implicatio
ns
Management method
Cost of
management
1. Stabilize utility rates due to transition from price variability inherent in fossil fuel extraction and use, to fixed price long-term PPAs from RE production, as well as 2. Enhance reputational benefits, and progress in our long-term Science Based Target (SBTs) goals from having more of our leased sites (where we do not get a utility bill) operating on renewable energy.
Emission reporting obligations
Adobe anticipates increased regulations by
Reduced operational costs
>6 years Direct Virtually
certain High
In addition to lowering long-term
To minimize our climate impact as we grow our business, operational excellence in energy and resource efficiency is critical. Adobe certifies its buildings under the U.S.
Costs associated with this are about

Opportunity
driver
Description
Potential impact
Timeframe
Direct/Indirect
Likelihood
Magnitude of impact
Estimated
financial implicatio
ns
Management method
Cost of
management
cities and counties on "green" building standards, chiefly, in building to the USGBC's LEED and/or BREAM standard and achieving ongoing certification. The company is extremely well positioned for this with over 75% of its global footprint (total square footage) achieving LEED certification. Additionally, we see added benefit from a majority LEED footprint in: 1. Recruiting and retaining talent, 2. Reduced long-
costs and risk with our owned and managed assets, Adobe's commitment to LEED has helped in recruiting and retaining employee talent, as well as influencing a broader brand halo with customers -- many of whom have mentioned this in meetings. On the margin, Adobe anticipates a
Green Building Council's Leadership in Energy and Environmental design program (USGBC-LEED), including its owned data center in Oregon, multiple sites in India, as well as Sydney, Australia (BREAM), and in Europe. Overall, Adobe will: 1. Seek to maintain and/or grow its existing global footprint of 78% of employees working in LEED workspaces 2. Highlight the operational footprint alongside "green" products 3. Strive to exceed local, state, and federal government guidelines for green buildings 4. Focus on energy efficiency excellence for low-carbon digital delivery of Adobe products, moving toward zero-carbon delivery by 2035 when we intend for our data centers as well as our vendors to operate on 100% renewable energy. As an example, in 2015, Adobe's two new sites in India filed to achieve LEED Gold certification. In 2016, we worked towards LEED EBOM recertification of our Adobe Seattle building in LEED ARC.
$100,000 per building including consultants, etc.

Opportunity
driver
Description
Potential impact
Timeframe
Direct/Indirect
Likelihood
Magnitude of impact
Estimated
financial implicatio
ns
Management method
Cost of
management
term operational cost and risk, 3. Reputational "halo" -- on the sales margin, customers will choose Adobe as a trusted, responsible, and sustainable partner, and 4. Lower overall scope 1 and 2 emissions Examples of such legislation are the EU Energy Performance of Buildings Directive, AB-32 in California where we are headquartered (campuses in San Jose and San Francisco, ~2M sq. ft., 5000 FTEs), and LEED commitment
stronger, more trusted brand in promoting its LEED global footprint alongside its "green" products. This demonstrates the company develops sustainable products, out of responsibly run facilities, with plans for long-term, low-carbon economic resiliency. Reputational opportunities could potentially

Opportunity
driver
Description
Potential impact
Timeframe
Direct/Indirect
Likelihood
Magnitude of impact
Estimated
financial implicatio
ns
Management method
Cost of
management
guidance for new buildings in San Francisco where we own 3 buildings (~500K sq. ft. and 2000 FTEs). The company anticipates the net effect could potentially generate an increased demand in Adobe’s products and services, as well as lower operational risk and costs.
contribute an estimated 5-10% of the overall revenue of $5 billion, with cost reductions over $1M per year.
Product efficiency regulations and standards
Adobe anticipates increased federal and state regulations and directives regarding purchase of low-carbon
Increased demand for existing products/services
1 to 3 years Direct Virtually
certain High
Environmental attributes of Adobe products could potentially contribute an additional
Promoting Adobe's "green" product portfolio to all customers, particularly federal, state, city and county agencies is a key enabler. Creating awareness about Adobe's Resource Saver Calculator, which provides information on potential resource savings (wood, water, waste) as well as costs, will help in this effort: http://blogs.adobe.com/documentcloud/resource-saver-calculator/
Adobe's cost impact is nominal (less than $100K per year) to take advantage of this opportunity. Most would

Opportunity
driver
Description
Potential impact
Timeframe
Direct/Indirect
Likelihood
Magnitude of impact
Estimated
financial implicatio
ns
Management method
Cost of
management
and emissions reducing products will enable a significant benefit to increased sales of Adobe products. Our reasoning: 1. Adobe Connect: government agencies have been increasing purchasing and use of Connect to reduce employee travel and emissions. 2. Adobe Document Cloud: the transition from paper to digital workflows is seen as a business "must" for companies and
1-5% of overall revenue of $5 billion with this type of federal directive.
be from events, employee travel, small web and app development, and partnerships.

Opportunity
driver
Description
Potential impact
Timeframe
Direct/Indirect
Likelihood
Magnitude of impact
Estimated
financial implicatio
ns
Management method
Cost of
management
governments needing to reduce costs, resource consumption and emissions. 3. Creative Cloud and Marketing Cloud: both digital products have reduced their environmental impact to customers by over 90% in transitioning from boxed software and manual processes/resource-heavy campaigns, respectively. Legislation such as President Obama's Executive Order (EO) in March of 2015 calling for all federal

Opportunity
driver
Description
Potential impact
Timeframe
Direct/Indirect
Likelihood
Magnitude of impact
Estimated
financial implicatio
ns
Management method
Cost of
management
government agencies to procure products from companies that report emissions data and to favor products that have the potential to reduce their emissions and resource consumption. The company anticipates the net effect could generate an increased demand in Adobe’s products and services, as well as lower operational risk and costs.
Renewable energy regulation
Implementation of Community Choice Energy (CCE, also known as
Wider social benefits
1 to 3 years Direct Virtually
certain High
Cost savings in moving from a Contract For
Adobe has worked directly with the CCA/CCE founders since 2010 to help them move into Bay Area counties of San Francisco and San Jose, but also San Mateo, Santa Clara and Contra Costa counties where employees live. Also,
Adobe estimates transitioning to CCE in San Francsico

Opportunity
driver
Description
Potential impact
Timeframe
Direct/Indirect
Likelihood
Magnitude of impact
Estimated
financial implicatio
ns
Management method
Cost of
management
Community Choice Aggregation (CCA)). Adobe has supported expansion of this program in both San Francisco and San Jose, California. The reasons: 1. Adobe believes expansion of these renewable energy programs provide utility customers with choice, and given that choice, most will chose renewable energy, 2. We believe expansion of CCA/CCE in California will force traditional
Differences virtual power purchase agreement (CFD, vPPA) to Direct Access could save Adobe, and other businesses in California, millions of dollars over the term of a typical PPA (7-25 years). Additionally, we believe if implemented without the use of unbundled Renewable Energy Credits (uRECs),
Adobe's Green Teams have held webinars, infosessions and an array of informational opportunities for employees to learn about, and act on, CCA/CCE implementation in their areas.
and San Jose could save approximately 1% on energy bills in the first two years and depending on the ability of the CCEs to implement 5-25 year long-term grid-scale PPA, the company could save 5-10% over grid pricing alone. We believe Direct Access would allow this to happen sooner and with greater potential cost savinges.

Opportunity
driver
Description
Potential impact
Timeframe
Direct/Indirect
Likelihood
Magnitude of impact
Estimated
financial implicatio
ns
Management method
Cost of
management
utility operators -- who will still derive revenue from transmission & delivery (T&D) -- will see a shrinking energy revenues and will see Direct Access expansion as an economic opportunity, and 3. Perhaps most importantly, it will give our employees -- not just Adobe -- as well as everyone in our communities where we live and work, the opportunity to run on renewable energy.
and instead on long-term, grid-scale RE PPAs will deliver electricity to everyone in our communities at a cost savings.
Renewa There were a Reduced 1 to 3 Direct Likely High $1M - Adobe works with our NGO partners to push Main costs

Opportunity
driver
Description
Potential impact
Timeframe
Direct/Indirect
Likelihood
Magnitude of impact
Estimated
financial implicatio
ns
Management method
Cost of
management
ble energy regulation
number of bills and proposals that could pose significant economic and reputation benefits: 1. California Senate Bill 286 (CA SB 286), Direct Access (DA) expansion -- to authorize and facilitate direct transactions between electricity suppliers and retail end-use customers. Adobe has been on the waiting list for Direct Access in CA for over 4 years with no movement of any of the businesses wanting to enjoy the benefits of
operational costs
years $5M per year benefit in cost savings as well as anticipated cost stabilization / OpEx predictability.
for regulatory policies related to RE adoption because of the inherent opportunities (OpEx reduction, reputation lift, employee affinity) they provide to the company: * NGO working-groups: as a founding, and ongoing, member of BSR’s Future of Internet Power (FoIP) group, an early signatory of the “Renewable Energy Buyer’s Principles”, in 2016 as signatory of the "Cloud and CoLo Buyer's Principles", and as an early and "core" member of the Renewable Energy Buyer's Alliance (REBA), to not only drive RE goal setting for Adobe but also for our suppliers. * NGO partnerships: to help us develop and set our 100% RE strategy in 2016 and launch it with a RFP for RE in India (U.S. in 2017). Also in 2016, Adobe's NGO partners helped the company develop, implement and verify our SBT's to align Adobe’s operational goals to climate science. * NGO mediation: face-to-face meetings with utilities and PUC’s (OR, CA, VA) to influence them to adopt renewable energy policy. * Virginia: Adobe was 1 of 11 companies publicly supporting increased investment in renewable energy on Dominion’s (major utility) grid: http://www.scc.virginia.gov/docketsearch/DOCS/34yj01!.PDF * California: Adobe’s public support of CCE/CCA legislation to achiever broader access of RE to businesses and residences in our communities. Adobe has voiced public support of this legislation in letters and meetings with San Jose and San
come from: 1. Employing our trusted energy advisors, Competitive Energy Systems (CES) for evaluation, recommendations, RFPs, etc. 2. Transaction costs 3. Travel and other unplanned costs We expect total cost not to exceed $100K US.

Opportunity
driver
Description
Potential impact
Timeframe
Direct/Indirect
Likelihood
Magnitude of impact
Estimated
financial implicatio
ns
Management method
Cost of
management
renewable energy (RE). Through DA, large businesses are allowed to purchase power directly from independent electric service providers via “Direct Access,” but this program has been capped and its expansion is tightly constrained. Proposed legislation to expand Direct Access (SB 286) failed in 2016 and is likely to be reintroduced in 2017. We will continue to advocate for this legislation -- if this passes, it
Francisco officials, and to the CA senate.
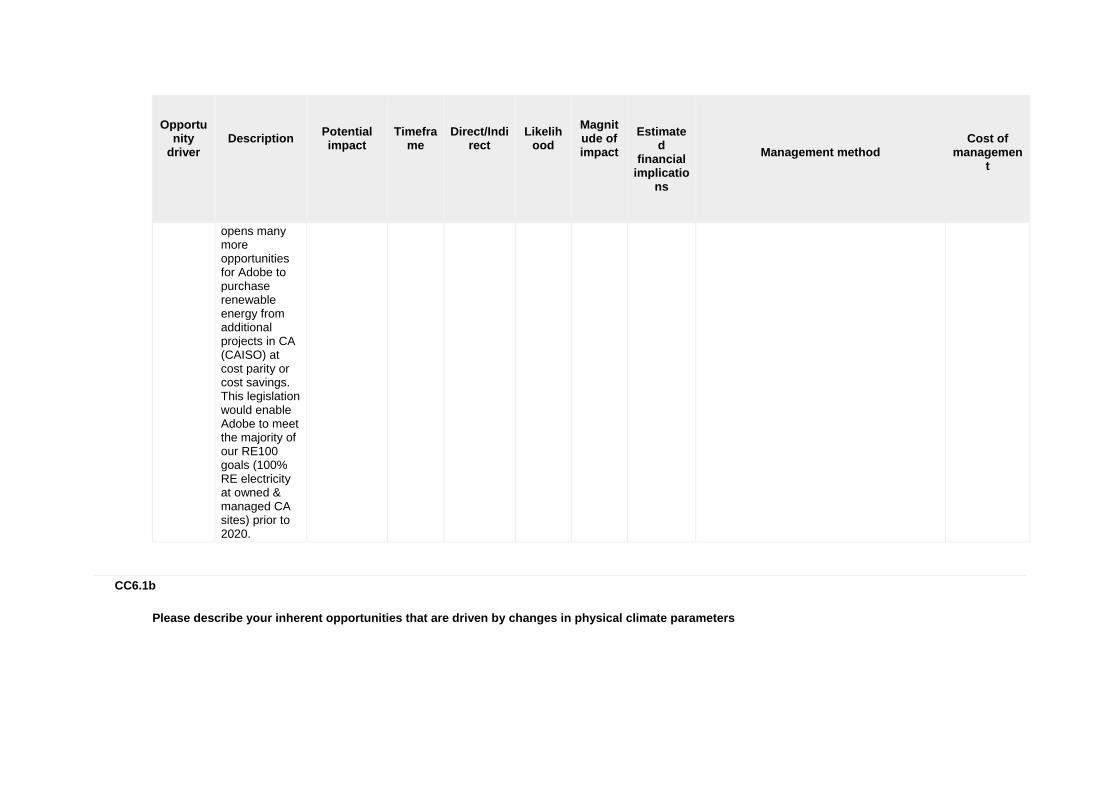
Opportunity
driver
Description
Potential impact
Timeframe
Direct/Indirect
Likelihood
Magnitude of impact
Estimated
financial implicatio
ns
Management method
Cost of
management
opens many more opportunities for Adobe to purchase renewable energy from additional projects in CA (CAISO) at cost parity or cost savings. This legislation would enable Adobe to meet the majority of our RE100 goals (100% RE electricity at owned & managed CA sites) prior to 2020.
CC6.1b
Please describe your inherent opportunities that are driven by changes in physical climate parameters

Opportunity driver
Description
Potential impact
Timeframe
Direct/ Indirect
Likelihood
Magnitude of impact
Estimated financial
implications
Management
method
Cost of
management
Induced changes in natural resources
As Adobe grows its business it seeks to minimize its environmental impact and maximize its contribution to a low-carbon economy. A decrease in natural resources such as fossil fuel power or trees to produce power make Adobe well-positioned to adapt to this new reality as our products provide lower-carbon alternatives. As mentioned in CC6.1a, we see this coming from three fundamental areas: 1. Customer adoption of Adobe's "green" products -- Connect (virtual meeting platform) and Adobe Sign (digital signatures) -- are primary examples. As customers demand products that enable them to reduce their emissions and
Wider social benefits
>6 years Direct Likely Medium
Incremental sales of Adobe products. We can estimate this can be from less than 1% of total annual revenue to 5% or more, or between $25M US (0.05%) and above.
As Adobe completes the transition to its three clouds -- Creative, Document, Marketing -- the company is continuously improving on its features, processes, offerings, and innovative technologies that do more with less. The company has a long history (over 35 years) of developing new products and features for existing products in-house, and through acquiring technologies that grow the business. Many new product ideas are vetted by the employees and in many cases -- as with Adobe LeanPrint (print minimization) -- come from the employees themselves to mitigate further resource impact. As we educate our employees on our
Costs of recruiting and retaining talent, product development, new real estate are ongoing. We estimate that annual costs specifically to achieve the objectives here would not exceed $5M. Most are in place, most come from expansion of Adobe's employee base.

Opportunity driver
Description
Potential impact
Timeframe
Direct/ Indirect
Likelihood
Magnitude of impact
Estimated financial
implications
Management
method
Cost of
management
resource consumption, we expect to see growth in sales of these products. As an example, with deforestation and high emissions emanated from paper production, trees/forests represent a dwindling, precious resource. Companies that acknowledge this, and the importance of them to carbon sequestration, they will chose products like Adobe Sign that reduce or eliminate use of this resource. 2. Operational excellence requiring less use of energy produced from fossil fuels. Adobe's commitment to LEED and to exceed guidance for resource reduction, energy consumption, and climate change mitigation. Again, over 70% of Adobe
Standards of Business Conduct (annually) which guides every employee to incorporate climate change in their daily work, we anticipate new products being developed that will promote Adobe's commitment to a low-carbon economy. It is important to note that our Science-Based Targets established in 2016 were very positively received by employees who can now relate their business unit's activities directly to climate science. This, along with our frequently communicated RE100 pledge demonstrates to employees and customers our commitment to doing our part in reducing our environmental impact.

Opportunity driver
Description
Potential impact
Timeframe
Direct/ Indirect
Likelihood
Magnitude of impact
Estimated financial
implications
Management
method
Cost of
management
employees work in LEED workspaces and this percent continues to grow with our two buildings in Noida and Bangalore, India with LEED Gold certifications. 3. Commitment to operate on 100% renewable energy. Clean, affordable energy -- and cleaner air -- for everyone in the communities where we work and live. 4. Education and involvement of employees, wherever possible to achieve all of our sustainability goals. Adobe has found that employees who employ sustainability best practices at home and in their communities are happier, more productive, and we expect, healthier. All these factors promote wider social benefits far

Opportunity driver
Description
Potential impact
Timeframe
Direct/ Indirect
Likelihood
Magnitude of impact
Estimated financial
implications
Management
method
Cost of
management
beyond the walls of our LEED buildings.
CC6.1c
Please describe your inherent opportunities that are driven by changes in other climate-related developments
Opportunity driver
Description
Potential impact
Timeframe
Direct/ Indirect
Likelihood
Magnitude of impact
Estimated financial
implications
Management
method
Cost of
management
Induced changes in human and cultural environments
As climate change issues become more pronounced, customer demand for products that have minimal impact on natural resources will grow -- not just in helping reduce customer's emissions, as in CC6.1b, but in requiring less and less energy to deliver. With Document Cloud
Premium price opportunities
1 to 3 years Direct Virtually
certain High
More consumers will utilize Adobe's products as it has minimal impact on the environment. And that will result in Adobe being able to raise its process for its products. Based on general growth and opportunities linked to promoting "green" products, we can
As we grow as a cloud business we strive to minimize our footprint. Adobe's RE100 goal could not be made without a commitment to energy efficiency, operational excellence, and maximizing our contribution to a low-carbon economy. As consumer preference grows to include an
Costs associated with these actions include hiring analysts, product managers to ensure product sustainability, and software developers to create the product itself, at an estimated $500,000 per annum. These are embedded costs in our growth plans, not additional. New technology implementation, depending on what it is (hydrogen fuel cells to replace

Opportunity driver
Description
Potential impact
Timeframe
Direct/ Indirect
Likelihood
Magnitude of impact
Estimated financial
implications
Management
method
Cost of
management
(PDF, Adobe Sign, Acrobat) and Creative Cloud in place, their environmental impact is less than 90% of what it was as a boxed product. But all Adobe Clouds are poised for the demands of a low-carbon economy: as demand for these products grows, the economies of scale of the data centers where these products are delivered has to out grow the energy demand to run them. Even if Moore's Law (where processor speeds double every two years, making more processing power per unit of input power)
conservatively estimate a marginal sales increase of 0.5% (~$25M US).
environmental footprint factor, Adobe could command a price premium for its products and continue to expand its customer base to capitalize on its brand. Strides made in accomplishing our RE100 goal are key. In 2016 it includes instituting Adobe’s RE Task Force which finalized our RE Strategy globally and for each region/site. This allowed us to launch an RFP for an RE PPA for our site in Bangalore, India as well as construct the framework for an RFP in the U.S. Strategic acquisitions (FY2017 TubeMogul) and the transition
diesel back-up generators or advanced storage/batteries, for example) could significantly increase capital costs. However, Adobe has a strong record of delivering reasonable ROI (3-5 years, with a 1.5 year average for over 180 projects in ten years). We are confident we can achieve economic resiliency going forward.

Opportunity driver
Description
Potential impact
Timeframe
Direct/ Indirect
Likelihood
Magnitude of impact
Estimated financial
implications
Management
method
Cost of
management
slows dramatically, data center efficiency will continue and when run with renewable energy -- as our 2035 goals demand -- the impact is even less. We believe this positions all 3 Adobe Clouds (Creative, Document, Marketing) in a way that will expand our portfolio and generate more income.
from a boxed software company to a 3-cloud business has drastically grown revenues for Adobe (up 22% from FY2015 end) and its employee base (FTE up 14% from FY2015). The notion of decoupling business growth from emissions growth is a priority. Adobe has eliminated its physical supply chain and all associated waste and emissions from it. The move to CoLo and Cloud suppliers who also set RE goals eliminates emissions from our business. As our business grows, as more companies are acquired, as we move to 100%

Opportunity driver
Description
Potential impact
Timeframe
Direct/ Indirect
Likelihood
Magnitude of impact
Estimated financial
implications
Management
method
Cost of
management
digital delivery and 100% RE, we can anticipate decreasing – not increasing emissions – as well as growth in our "green" product portfolio beyond Document Cloud, Connect, and LeanPrint.
CC6.1d
Please explain why you do not consider your company to be exposed to inherent opportunities driven by changes in regulation that have the potential to generate a substantive change in your business operations, revenue or expenditure
CC6.1e
Please explain why you do not consider your company to be exposed to inherent opportunities driven by changes in physical climate parameters that have the potential to generate a substantive change in your business operations, revenue or expenditure

CC6.1f
Please explain why you do not consider your company to be exposed to inherent opportunities driven by changes in other climate-related developments that have the potential to generate a substantive change in your business operations, revenue or expenditure
Further Information
Module: GHG Emissions Accounting, Energy and Fuel Use, and Trading
Page: CC7. Emissions Methodology
CC7.1
Please provide your base year and base year emissions (Scopes 1 and 2)
Scope
Base year
Base year emissions (metric tonnes CO2e)
Scope 1 Thu 01 Jan 2015 - Thu 31 Dec 2015
10992
Scope 2 (location-based) Thu 01 Jan 2015 - Thu 31 Dec 2015
61602
Scope 2 (market-based) Thu 01 Jan 2015 - Thu 31 Dec 2015
53744
CC7.2

Please give the name of the standard, protocol or methodology you have used to collect activity data and calculate Scope 1 and Scope 2 emissions
Please select the published methodologies that you use
The Greenhouse Gas Protocol: A Corporate Accounting and Reporting Standard (Revised Edition) US EPA Mandatory Greenhouse Gas Reporting Rule
CC7.2a
If you have selected "Other" in CC7.2 please provide details of the standard, protocol or methodology you have used to collect activity data and calculate Scope 1 and Scope 2 emissions
CC7.3
Please give the source for the global warming potentials you have used
Gas
Reference
CO2 IPCC Fourth Assessment Report (AR4 - 100 year) CH4 IPCC Fourth Assessment Report (AR4 - 100 year) N2O IPCC Fourth Assessment Report (AR4 - 100 year)
CC7.4

Please give the emissions factors you have applied and their origin; alternatively, please attach an Excel spreadsheet with this data at the bottom of this page
Fuel/Material/Energy
Emission Factor
Unit
Reference
Further Information
Please see in use emissions factors here. All EFs use the most recent year available. Please also note that our 2015 base year emissions now include Scope 2 emissions from our collocated data center.
Attachments
https://www.cdp.net/sites/2017/33/333/Climate Change 2017/Shared Documents/Attachments/ClimateChange2017/CC7.EmissionsMethodology/Adobe In Use Emissions Factors 2016.xlsx
Page: CC8. Emissions Data - (1 Dec 2015 - 30 Nov 2016)
CC8.1
Please select the boundary you are using for your Scope 1 and 2 greenhouse gas inventory Operational control
CC8.2
Please provide your gross global Scope 1 emissions figures in metric tonnes CO2e

11082
CC8.3
Please describe your approach to reporting Scope 2 emissions
Scope 2, location-
based
Scope 2, market-
based
Comment
We are reporting a Scope 2, location-based figure
We are reporting a Scope 2, market-based figure
It is important to note that these numbers include all Scope 2 emissions from Adobe's CoLocated data centers (CoLos). This reflects a marked increase in Scope 2 emissions from our original 2015 inventory with this change in methodology. Additionally, in 2016 Adobe reviewed and recalculated all emissions data from 2015 (base year) in order to set and verify our Science Based Targets (SBTs) to include CoLos. We are in the process of restating and verifying this portion of our emissions for 2015. These SBTs are not just in aggregate for our business, they are the main basis for setting operational site KPIs. In other words, the SBTs are our operational strategy. In order to make sure our SBTs are correct, we report both location- and market-based Scope 1 & 2 emissions.
CC8.3a
Please provide your gross global Scope 2 emissions figures in metric tonnes CO2e
Scope 2, location-
based
Scope 2,
market-based (if applicable)
Comment
61875 58473 It is important to note that these numbers include all Scope 2 emissions from Adobe's CoLocated data centers (CoLos). This
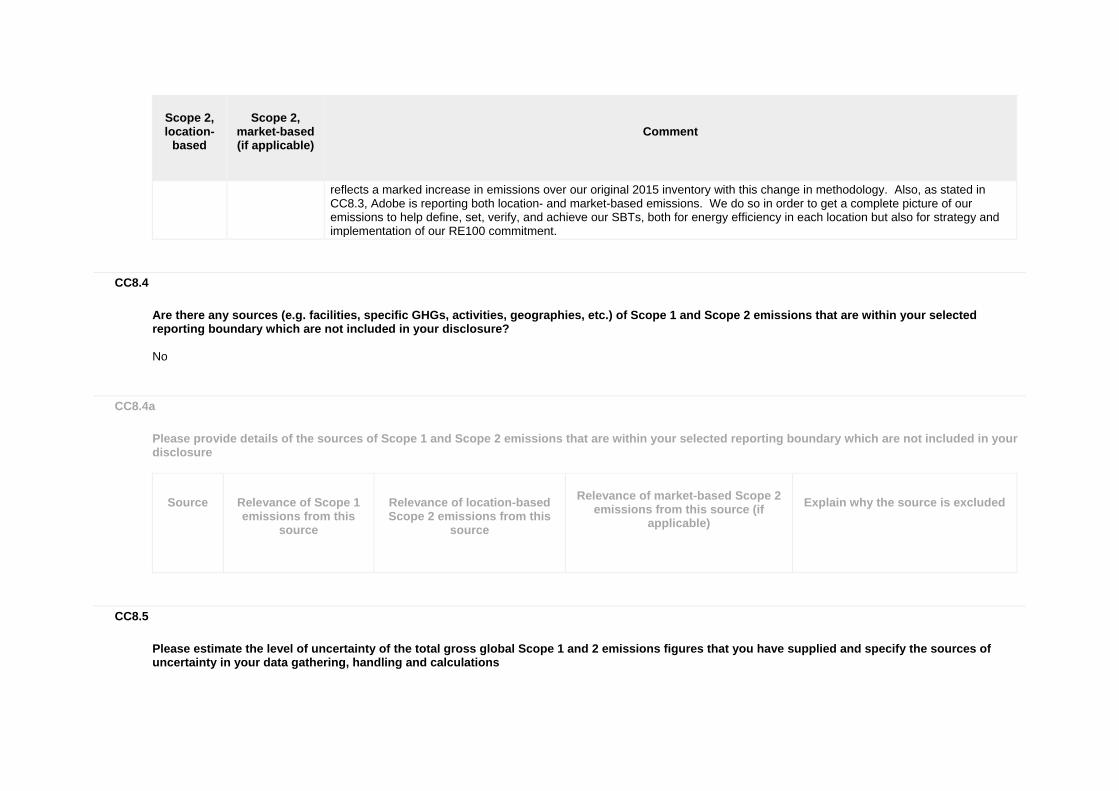
Scope 2, location-
based
Scope 2,
market-based (if applicable)
Comment
reflects a marked increase in emissions over our original 2015 inventory with this change in methodology. Also, as stated in CC8.3, Adobe is reporting both location- and market-based emissions. We do so in order to get a complete picture of our emissions to help define, set, verify, and achieve our SBTs, both for energy efficiency in each location but also for strategy and implementation of our RE100 commitment.
CC8.4
Are there any sources (e.g. facilities, specific GHGs, activities, geographies, etc.) of Scope 1 and Scope 2 emissions that are within your selected reporting boundary which are not included in your disclosure? No
CC8.4a
Please provide details of the sources of Scope 1 and Scope 2 emissions that are within your selected reporting boundary which are not included in your disclosure
Source
Relevance of Scope 1 emissions from this
source
Relevance of location-based Scope 2 emissions from this
source
Relevance of market-based Scope 2
emissions from this source (if applicable)
Explain why the source is excluded
CC8.5
Please estimate the level of uncertainty of the total gross global Scope 1 and 2 emissions figures that you have supplied and specify the sources of uncertainty in your data gathering, handling and calculations

Scope
Uncertainty range
Main sources of
uncertainty
Please expand on the uncertainty in your data
Scope 1 More than 5% but less than or equal to 10%
Extrapolation Metering/ Measurement Constraints
Approximately one-third of Adobe's office space is leased; we have worked hard to incorporate metered data where available for these facilities. However, we do not have submetering across the leased portfolio and subsequently needed to extrapolate information across our leased portfolio.
Scope 2 (location-based)
More than 5% but less than or equal to 10%
Extrapolation Metering/ Measurement Constraints
It is important to note that these numbers include all Scope 2 location-based emissions from Adobe's CoLocated data centers (CoLos). This reflects a marked increase in emissions over our original 2015 inventory with this change in reporting methodology. Approximately one-third of Adobe's office space is leased; we have worked hard to incorporate the metered data where available for these facilities. However, we do not have submetering across the leased portfolio and subsequently needed to extrapolate information across our leased portfolio.
Scope 2 (market-based)
More than 5% but less than or equal to 10%
Extrapolation Metering/ Measurement Constraints
It is important to note that these numbers include all Scope 2 location-based emissions from Adobe's CoLocated data centers (CoLos). This reflects a marked increase in emissions over our original 2015 inventory with this change in reporting methodology. Approximately one-third of Adobe's office space is leased; we have worked hard to incorporate the metered data where available for these facilities. However, we do not have submetering across the leased portfolio and subsequently needed to extrapolate information across our leased portfolio.
CC8.6
Please indicate the verification/assurance status that applies to your reported Scope 1 emissions Third party verification or assurance process in place
CC8.6a
Please provide further details of the verification/assurance undertaken for your Scope 1 emissions, and attach the relevant statements

Verification
or assurance cycle in place
Status in
the current reporting
year
Type of verification
or assurance
Attach the statement
Page/section
reference
Relevant standard
Proportion of reported
Scope 1 emissions verified (%)
Annual process Complete Limited
assurance
https://www.cdp.net/sites/2017/33/333/Climate Change 2017/Shared Documents/Attachments/CC8.6a/Adobe 2016 GHG Assurance Review Letter 20170517_vF.pdf
1-2 ISO14064-3 100
CC8.6b
Please provide further details of the regulatory regime to which you are complying that specifies the use of Continuous Emission Monitoring Systems (CEMS)
Regulation
% of emissions covered by the system
Compliance period
Evidence of submission
CC8.7
Please indicate the verification/assurance status that applies to at least one of your reported Scope 2 emissions figures Third party verification or assurance process in place
CC8.7a
Please provide further details of the verification/assurance undertaken for your location-based and/or market-based Scope 2 emissions, and attach the relevant statements
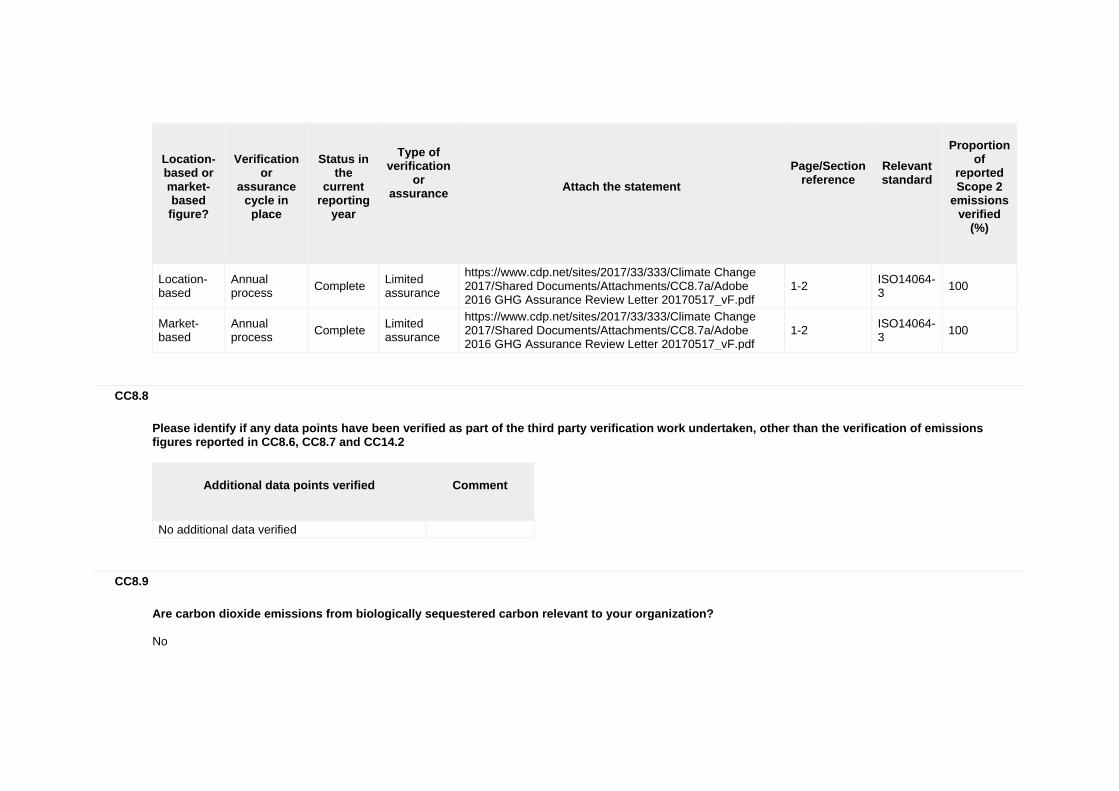
Location-based or market-based figure?
Verification
or assurance
cycle in place
Status in
the current
reporting year
Type of verification
or assurance
Attach the statement
Page/Section reference
Relevant standard
Proportion
of reported Scope 2
emissions verified
(%)
Location-based
Annual process Complete Limited
assurance
https://www.cdp.net/sites/2017/33/333/Climate Change 2017/Shared Documents/Attachments/CC8.7a/Adobe 2016 GHG Assurance Review Letter 20170517_vF.pdf
1-2 ISO14064-3 100
Market-based
Annual process Complete Limited
assurance
https://www.cdp.net/sites/2017/33/333/Climate Change 2017/Shared Documents/Attachments/CC8.7a/Adobe 2016 GHG Assurance Review Letter 20170517_vF.pdf
1-2 ISO14064-3 100
CC8.8
Please identify if any data points have been verified as part of the third party verification work undertaken, other than the verification of emissions figures reported in CC8.6, CC8.7 and CC14.2
Additional data points verified
Comment
No additional data verified
CC8.9
Are carbon dioxide emissions from biologically sequestered carbon relevant to your organization? No

CC8.9a
Please provide the emissions from biologically sequestered carbon relevant to your organization in metric tonnes CO2
Further Information
Page: CC9. Scope 1 Emissions Breakdown - (1 Dec 2015 - 30 Nov 2016)
CC9.1
Do you have Scope 1 emissions sources in more than one country? Yes
CC9.1a
Please break down your total gross global Scope 1 emissions by country/region
Country/Region
Scope 1 metric tonnes CO2e
United States of America 8012 India 1984 Rest of world 1086
CC9.2

Please indicate which other Scope 1 emissions breakdowns you are able to provide (tick all that apply) By activity
CC9.2a
Please break down your total gross global Scope 1 emissions by business division
Business division
Scope 1 emissions (metric tonnes CO2e)
CC9.2b
Please break down your total gross global Scope 1 emissions by facility
Facility
Scope 1 emissions (metric tonnes CO2e)
Latitude
Longitude
CC9.2c
Please break down your total gross global Scope 1 emissions by GHG type

GHG type
Scope 1 emissions (metric tonnes CO2e)
CC9.2d
Please break down your total gross global Scope 1 emissions by activity
Activity
Scope 1 emissions (metric tonnes CO2e)
Combustion in Boilers (natural gas and diesel) 6022 Combustion of fuel in fuel cells (natural gas) 4542 Refrigerants 151 Diesel 356 Gasoline 9
Further Information
Page: CC10. Scope 2 Emissions Breakdown - (1 Dec 2015 - 30 Nov 2016)
CC10.1
Do you have Scope 2 emissions sources in more than one country? Yes
CC10.1a

Please break down your total gross global Scope 2 emissions and energy consumption by country/region
Country/Region
Scope 2, location-based (metric
tonnes CO2e)
Scope 2, market-based (metric tonnes CO2e)
Purchased and consumed
electricity, heat, steam or cooling
(MWh)
Purchased and consumed low carbon electricity, heat, steam or
cooling accounted in market-based approach (MWh)
United States of America 34786 30557 104005 India 17352 17352 22486 Rest of world 9737 10564 23889
CC10.2
Please indicate which other Scope 2 emissions breakdowns you are able to provide (tick all that apply) By activity
CC10.2a
Please break down your total gross global Scope 2 emissions by business division
Business division
Scope 2, location-based (metric tonnes CO2e)
Scope 2, market-based (metric tonnes CO2e)

CC10.2b
Please break down your total gross global Scope 2 emissions by facility
Facility
Scope 2, location-based (metric tonnes CO2e)
Scope 2, market-based (metric tonnes CO2e)
CC10.2c
Please break down your total gross global Scope 2 emissions by activity
Activity
Scope 2, location-based (metric tonnes CO2e)
Scope 2, market-based (metric tonnes CO2e)
Office/workspaces and internal Data Centers or server rooms 40909 38356
Managed Co-located data centers (CoLos) 20966 20117
Further Information
Please also note that in 2016, Adobe changed its Scope 2 emissions methodology to include our managed collocated data centers' electricity. We worked with our suppliers to determine the amount of renewable energy purchased at these COLO facilities. We did not receive the results in time to be included in our verification, but would like to note that we are working with our suppliers to understand their, and subsequently our, renewable energy profile at these COLO sites. According to the results, Adobe used approximately 7,547 MWh of renewable electricity at our COLO sites powered through a combination of utility green tariffs and power purchase agreements. Adobe will work in future years to incorporate this information into our regular reporting structure.
Page: CC11. Energy
CC11.1

What percentage of your total operational spend in the reporting year was on energy? More than 15% but less than or equal to 20%
CC11.2
Please state how much heat, steam, and cooling in MWh your organization has purchased and consumed during the reporting year
Energy type
MWh
Heat 0 Steam 0 Cooling 0
CC11.3
Please state how much fuel in MWh your organization has consumed (for energy purposes) during the reporting year 62551
CC11.3a
Please complete the table by breaking down the total "Fuel" figure entered above by fuel type
Fuels
MWh

Fuels
MWh
Natural gas 58281 Distillate fuel oil No 2 4232 Motor gasoline 38
CC11.4
Please provide details of the electricity, heat, steam or cooling amounts that were accounted at a low carbon emission factor in the market-based Scope 2 figure reported in CC8.3a
Basis for applying a low carbon emission factor
MWh consumed associated with
low carbon electricity, heat,
steam or cooling
Emissions factor (in units of metric tonnes
CO2e per MWh)
Comment
Off-grid energy consumption from an on-site installation or through a direct line to an off-site generator owned by another company
15 0
This is the total MWh produced by on-site Windspires at our San Jose. It is important to note that Adobe purchased verified unbundled Renewable Energy Credits (uRECs) and clean offsets in 2013 to achieve "carbon neutrality" for global operations by 2015. However, our RE100 strategy developed and put in motion in 2015 is based on energy efficiency excellence, on-site RE when possible, policy advocacy for grid-scale RE, and investment in true, grid-scale RE PPAs. Because of this, we have never accounted for our 2013 uREC purchases (including distributed biogas purchases for our fuel cells) as offsets for our emissions. Adobe’s stance on purchase of uRECs is unwavering: companies, starting with our own, need to do better. We all need to invest in true, grid-scale RE and end purchasing of uRECs to make RE claims. We believe uRECs in the volume necessary to make carbon neutrality, or Net Zero, claims does very little to nothing at all in moving markets to power businesses and communities where we live and work with renewable energy. We believe the purchase of uRECs pushes the market in the opposite direction because it proves that one need only throw money at this challenge to solve it, making RE (by uRECs) a poor economic argument. Last, we believe the practice of purchasing uRECs to make marketing claims drives complacency, rather than urgency, because it allows companies to reach publicly stated RE goals

Basis for applying a low carbon emission factor
MWh consumed associated with
low carbon electricity, heat,
steam or cooling
Emissions factor (in units of metric tonnes
CO2e per MWh)
Comment
within the year of setting them, or so far ahead of long-term schedules that doing nothing further becomes a reasonable option. In 2016, Adobe made significant progress toward its 100% RE goal by 2035 by setting in motion RFPs for RE PPAs in both India and the U.S. While we have little to report in 2016 in terms of MWh, we expect to make true, grid-scale RE claims in 2017.
Other 7547 0
As mentioned in Section 10, in 2016, Adobe changed its Scope 2 emissions methodology to include our managed collocated data centers' electricity. We worked with our managed COLO suppliers to determine the amount of renewable energy purchased at these COLO facilities. We did not receive the results in time to be included in our verification, but would like to note that we are working with our suppliers to understand their, and subsequently our, renewable energy profile at these COLO sites. According to the results, Adobe used approximately 7,547 MWh of renewable electricity at our COLO sites powered through a combination of utility green tariffs and power purchase agreements. Adobe will work in future years to incorporate this information into our regular reporting structure. Because we have not verified this information through our third-party verifier, we are not reducing our market-based emissions for 2016 based on this information. Rather, we seek to be transparent with our data collection and ongoing refinement of processes for gathering and reporting on this data.
CC11.5
Please report how much electricity you produce in MWh, and how much electricity you consume in MWh

Total
electricity consumed
(MWh)
Consumed electricity
that is purchased
(MWh)
Total
electricity produced
(MWh)
Total
renewable electricity produced
(MWh)
Consumed renewable electricity
that is produced by
company (MWh)
Comment
150380 139137 11243 15 15
Electricity produced by fuel cells make up the majority the difference between electricity purchased and electricity consumed, with generators and a small wind installation making up the rest of total electricity produced. Adobe does not consider fuel cell energy to be remotely renewable and report the natural gas used to produce fuel cell electricity in our Scope 1 emissions. However, with significant progress in 2016 on our RE PPA for our Bangalore site (to be completed in 2017) we will report offsite (and likely onsite) bundled RE in 2017. As mentioned in other sections, including above in 11.4, Adobe could include an additional 7,547 MWh of renewable energy used by Adobe at its collocated data centers; however, because this information was not verified in 2016, we are providing this information for transparency purposes only and will seek to include this information in our verification in subsequent years.
Further Information
Please find Adobe's 2017 RE100 reporting spreadsheet attached here.
Attachments
https://www.cdp.net/sites/2017/33/333/Climate Change 2017/Shared Documents/Attachments/ClimateChange2017/CC11.Energy/Adobe RE100 Reporting Spreadsheet 2017 vF.xlsx
Page: CC12. Emissions Performance
CC12.1
How do your gross global emissions (Scope 1 and 2 combined) for the reporting year compare to the previous year?
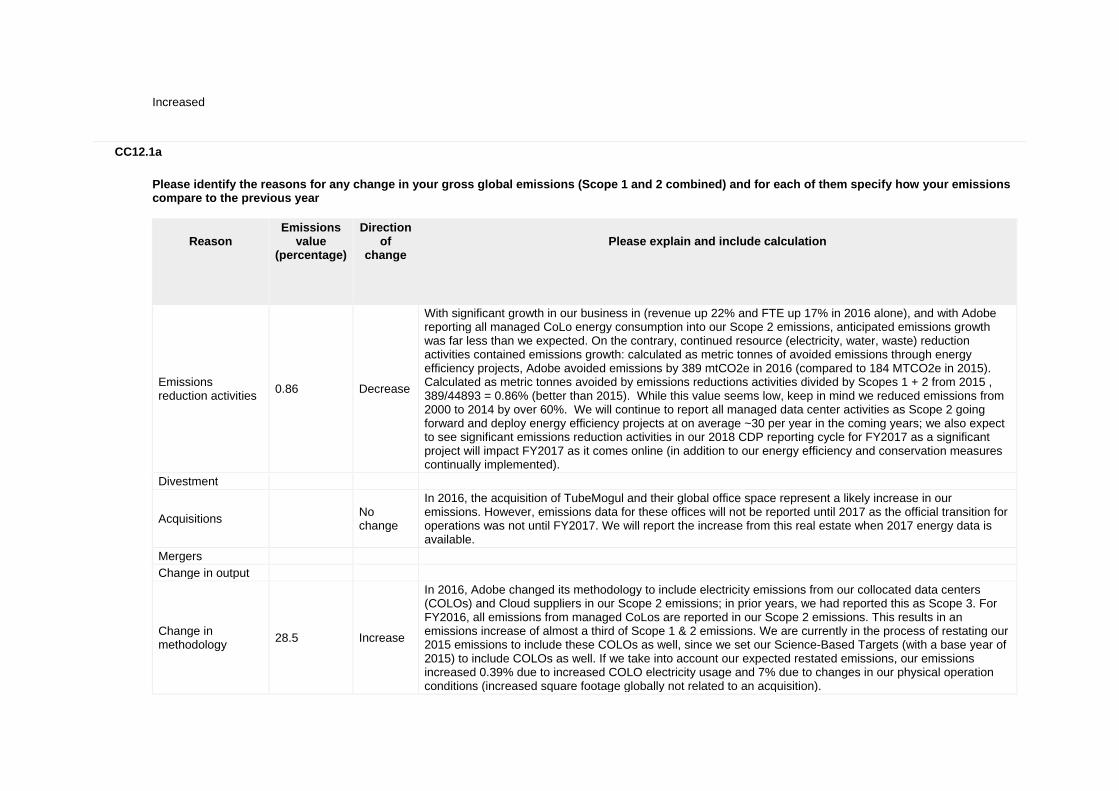
Increased
CC12.1a
Please identify the reasons for any change in your gross global emissions (Scope 1 and 2 combined) and for each of them specify how your emissions compare to the previous year
Reason
Emissions value
(percentage)
Direction of
change
Please explain and include calculation
Emissions reduction activities 0.86 Decrease
With significant growth in our business in (revenue up 22% and FTE up 17% in 2016 alone), and with Adobe reporting all managed CoLo energy consumption into our Scope 2 emissions, anticipated emissions growth was far less than we expected. On the contrary, continued resource (electricity, water, waste) reduction activities contained emissions growth: calculated as metric tonnes of avoided emissions through energy efficiency projects, Adobe avoided emissions by 389 mtCO2e in 2016 (compared to 184 MTCO2e in 2015). Calculated as metric tonnes avoided by emissions reductions activities divided by Scopes 1 + 2 from 2015 , 389/44893 = 0.86% (better than 2015). While this value seems low, keep in mind we reduced emissions from 2000 to 2014 by over 60%. We will continue to report all managed data center activities as Scope 2 going forward and deploy energy efficiency projects at on average ~30 per year in the coming years; we also expect to see significant emissions reduction activities in our 2018 CDP reporting cycle for FY2017 as a significant project will impact FY2017 as it comes online (in addition to our energy efficiency and conservation measures continually implemented).
Divestment
Acquisitions No change
In 2016, the acquisition of TubeMogul and their global office space represent a likely increase in our emissions. However, emissions data for these offices will not be reported until 2017 as the official transition for operations was not until FY2017. We will report the increase from this real estate when 2017 energy data is available.
Mergers Change in output
Change in methodology 28.5 Increase
In 2016, Adobe changed its methodology to include electricity emissions from our collocated data centers (COLOs) and Cloud suppliers in our Scope 2 emissions; in prior years, we had reported this as Scope 3. For FY2016, all emissions from managed CoLos are reported in our Scope 2 emissions. This results in an emissions increase of almost a third of Scope 1 & 2 emissions. We are currently in the process of restating our 2015 emissions to include these COLOs as well, since we set our Science-Based Targets (with a base year of 2015) to include COLOs as well. If we take into account our expected restated emissions, our emissions increased 0.39% due to increased COLO electricity usage and 7% due to changes in our physical operation conditions (increased square footage globally not related to an acquisition).

Reason
Emissions value
(percentage)
Direction of
change
Please explain and include calculation
Change in boundary Change in physical operating conditions
Unidentified Other
CC12.1b
Is your emissions performance calculations in CC12.1 and CC12.1a based on a location-based Scope 2 emissions figure or a market-based Scope 2 emissions figure? Market-based
CC12.2
Please describe your gross global combined Scope 1 and 2 emissions for the reporting year in metric tonnes CO2e per unit currency total revenue
Intensity figure =
Metric numerator (Gross global combined
Scope 1 and 2 emissions)
Metric denominator:
Unit total revenue
Scope
2 figure used
% change
from previous
year
Direction of change
from previous
year
Reason for change

Intensity figure =
Metric numerator (Gross global combined
Scope 1 and 2 emissions)
Metric denominator:
Unit total revenue
Scope
2 figure used
% change
from previous
year
Direction of change
from previous
year
Reason for change
0.0000119 metric tonnes CO2e 5854000000 Market-based 11.98 Decrease
To calculate the % change from the previous year, we used our currently in process restated 2015 Scope 1 & 2 (market-based) emissions that include our collocated data centers to determine the change. Adobe's Scope 1 & 2 emissions increased by 7% at the same time that revenue increased 22% from FY2015. Therefore, the intensity decreased for two reasons: 1) emissions reductions activities reduced the amount by which emissions increased and 2) revenue increased significantly more than emissions.
CC12.3
Please provide any additional intensity (normalized) metrics that are appropriate to your business operations
Intensity figure =
Metric numerator (Gross global combined
Scope 1 and 2 emissions)
Metric denominator
Metric
denominator: Unit total
Scope
2 figure used
% change
from previous
year
Direction of change
from previous
year
Reason for change
4.43 metric tonnes CO2e
full time equivalent (FTE) employee
15706 Market-based 8 Decrease
To calculate the % change from the previous year, we used our currently in process restated 2015 Scope 1 & 2 (market-based) emissions that include our collocated data centers to determine the change. Emissions reductions activities caused some of the decrease in intensity; additionally, employee headcount increased at a larger rate (> 15%) than did our emissions, resulting in an overall decrease in intensity.

Further Information
Page: CC13. Emissions Trading
CC13.1
Do you participate in any emissions trading schemes? No, and we do not currently anticipate doing so in the next 2 years
CC13.1a
Please complete the following table for each of the emission trading schemes in which you participate
Scheme name
Period for which data is supplied
Allowances allocated
Allowances purchased
Verified emissions in metric tonnes CO2e
Details of ownership
CC13.1b
What is your strategy for complying with the schemes in which you participate or anticipate participating?
CC13.2
Has your organization originated any project-based carbon credits or purchased any within the reporting period? No

CC13.2a
Please provide details on the project-based carbon credits originated or purchased by your organization in the reporting period
Credit origination
or credit purchase
Project type
Project identification
Verified to which standard
Number of credits (metric
tonnes CO2e)
Number of credits (metric tonnes
CO2e): Risk adjusted volume
Credits canceled
Purpose, e.g. compliance
Further Information
Page: CC14. Scope 3 Emissions
CC14.1
Please account for your organization’s Scope 3 emissions, disclosing and explaining any exclusions
Sources of Scope 3
emissions
Evaluation status
metric tonnes CO2e
Emissions calculation methodology
Percentage of
emissions calculated using data obtained
from suppliers or value chain
partners
Explanation
Purchased goods and services
Relevant, calculated 30133
Calculations were made based on OpEx coupled with an estimation factor for emissions plus the emissions from our actual and estimated electricity consumption at our unmanaged colocation centers (CoLos) across
33.00%
In 2016 all emissions from managed CoLos are reported as Scope 2 emissions. The number here represents both the electricity emissions associated with our unmanaged COLOs as well as our operational expenses.

Sources of Scope 3
emissions
Evaluation status
metric tonnes CO2e
Emissions calculation methodology
Percentage of
emissions calculated using data obtained
from suppliers or value chain
partners
Explanation
the United States.
Capital goods Relevant, calculated 6274
Calculations were performed based on capital goods expenditures via an estimation factor for emissions.
0.00%
Fuel-and-energy-related activities (not included in Scope 1 or 2)
Relevant, calculated 13991
This was calculated using our Scope 1 & 2 (Scope 2 market-based) emissions multiplied by an emissions factor for upstream emissions associated with the production and delivery of these resources.
0.00%
Upstream transportation and distribution
Not relevant, explanation provided
Over 98% of Adobe's product is produced and distributed digitally, so there is no physical product to transport. The remaining 2% was produced in prior years so no supply chain procurement and distribution of physical product is being done.
Waste generated in operations
Relevant, calculated 51
Adobe collects data on its US owned and managed sites for waste and recycling. The EPA WARM model version 14-1 was used to calculate emissions from waste.
100.00%
Adobe diverts over 90% of its waste to recycling and composting (90% of 1241 short tons of total waste was recycled. The diversion rates was 99+% from San Jose (headquarters), San Francisco, Seattle, Noida, and Bangalore; 40% from Lehi, Utah). Only waste that goes to landfills is included in this calculation otherwise the emissions number would be negative due to the lifecycle emissions implications from recycling and composting.
Business travel Relevant, calculated 27763
Employee business travel was calculated for both car rental and air travel based on numbers from travel provider. Car rental estimates assumed an average mileage per day driven. Air travel included short, medium and long-haul
100.00%

Sources of Scope 3
emissions
Evaluation status
metric tonnes CO2e
Emissions calculation methodology
Percentage of
emissions calculated using data obtained
from suppliers or value chain
partners
Explanation
flights with specific emissions factors for each length based on the most recent UK DEFRA factors. We calculate a net reduction in business travel emissions from 28925 mtCO2e in 2015 to 27763 mtCO2e in 2016.
Employee commuting
Relevant, calculated 9007
Employee surveys are conducted at large sites and miles commuted are aggregated. Estimates of public/mass transportation are taken from employee counts at each site as well as estimates from reimbursed commute expenses. Estimations of miles traveled are made for smaller sites. EPA emission factors were used to calculate carbon emissions from travel.
100.00% The 100% value is extrapolated using employee data for completeness.
Upstream leased assets
Not relevant, explanation provided
Adobe includes all of its leased assets in Scopes 1 and 2 emissions.
Downstream transportation and distribution
Relevant, calculated 208.8
Total emissions from baseline year 2013,10,444 tonnes CO2e is the sum of logistics, waste, production, etc. provided to us from third party vendors. 10,444 represents 100% of emissions in scope, 314 tonnes is the remaining 2% at the end of 2016.
100.00%
Over 98% of Adobe's product is produced and distributed digitally. Current distribution of the product occurs through Adobe's owned and leased data centers as well as through colocation centers. The emissions from our owned and leased data centers are already reported in our Scopes 1 & 2 emissions, and energy use from our Colos is included above in Purchased Goods and Services.
Processing of sold products
Not relevant, explanation provided
Adobe's products are final products and there is no third-party that processes our product.
Use of sold Relevant, 505 This calculation is based on the energy values 100.00% As Adobe works with suppliers to obtain more

Sources of Scope 3
emissions
Evaluation status
metric tonnes CO2e
Emissions calculation methodology
Percentage of
emissions calculated using data obtained
from suppliers or value chain
partners
Explanation
products calculated of Creative and Document Clouds versus boxed, physical Creative Suite and Acrobat and per-use for a standard customer using the digital products. Calculations are based on Lawrence Berkeley Laboratory's CLEER methodology calculated as a greater than 90% overall reduction in emissions from physical product depending on "client" (iPad, mobile device vs. workstation or desktop). It also includes per-use per customer emissions for a standard user of either product for one year as total subscriptions multiplied by standard customer use.
detailed information about energy consumption, utilization, etc. we will more accurately account for this information. This number represents 100% of what is provided, not including what we already report in scope 1 and 2 emissions.
End of life treatment of sold products
Not relevant, explanation provided
With greater than 97% of product delivered digitally, Adobe no longer has a physical supply chain. Adobe therefore no longer has physical/boxed software products.
Downstream leased assets
Not relevant, explanation provided
Adobe leases office space to tenants in facilities within Adobe's operational boundaries. This value is already calculated and accounted for in our Scopes 1 and 2 emissions.
Franchises Not relevant, explanation provided Adobe does not have any franchises.
Investments Not relevant, explanation provided Adobe does not make outside investments.
Other (upstream) Other

Sources of Scope 3
emissions
Evaluation status
metric tonnes CO2e
Emissions calculation methodology
Percentage of
emissions calculated using data obtained
from suppliers or value chain
partners
Explanation
(downstream)
CC14.2
Please indicate the verification/assurance status that applies to your reported Scope 3 emissions Third party verification or assurance process in place
CC14.2a
Please provide further details of the verification/assurance undertaken, and attach the relevant statements
Verification
or assurance cycle in place
Status in
the current reporting
year
Type of
verification or
assurance
Attach the statement
Page/Section
reference
Relevant standard
Proportion of
reported Scope 3 emissions verified (%)
Annual process Complete Reasonable
assurance
https://www.cdp.net/sites/2017/33/333/Climate Change 2017/Shared Documents/Attachments/CC14.2a/Adobe 2016 GHG Assurance Review Letter 20170517_vF.pdf
1 ISO14064-3 40

CC14.3
Are you able to compare your Scope 3 emissions for the reporting year with those for the previous year for any sources? Yes
CC14.3a
Please identify the reasons for any change in your Scope 3 emissions and for each of them specify how your emissions compare to the previous year
Sources of
Scope 3 emissions
Reason for
change
Emissions
value (percentage)
Direction
of change
Comment
Purchased goods & services
Change in methodology 65 Increase
Change in methodology: Adobe was able to collect specific energy data use specifically for delivering Adobe products from our CoLo suppliers as well as calculated emissions from Cloud suppliers. Because of more complete dissemination of data from managed CoLos, we are now reporting energy consumption and subsequent emissions in Scope 2. Cloud supplier data, which does not contain specific energy consumption for delivery of Adobe products, is reported as Scope 3. As part of our "green procurement" guidance, we submit criteria in our digital supply chain RFP's to have "preference" for suppliers that have 100% RE goals -- in line with Adobe achieving 100% RE delivery of digital products. We also include in purchased goods & services the operational expense of running our facilities in addition to our COLO electricity (which in 2015 and prior we reported in FERA) hence the increase
Business travel
Emissions reduction activities
4 Decrease Our business travel emissions decreased 4% from 2015 to 2016 from a decrease in long-haul air trips taken by employees.
CC14.4

Do you engage with any of the elements of your value chain on GHG emissions and climate change strategies? (Tick all that apply) Yes, our suppliers Yes, our customers Yes, other partners in the value chain
CC14.4a
Please give details of methods of engagement, your strategy for prioritizing engagements and measures of success Adobe engages with its suppliers in these ways: quarterly meetings with our Technical Operations lead (data center management or "Tech Ops"), quarterly to annual surveys to acquire data related to resource consumption, and through RE strategy updates in annual assessments. Throughout the value chain, our goal is to obtain data on energy consumption, PUE, utilization rates, renewable energy goal progress, and on obtaining any information that will help us assemble a complete assessment of our emissions in order to act on reducing them. Since 2014 Adobe sent its COLOs and cloud suppliers questionnaires/surveys to do this and the company plans to work to influence all COLOs and cloud suppliers to establish renewable energy goals and transparency in reporting. Adobe also prioritizes which supplier partners it engages the most with by level of impact and level of prior engagement -- in other words, we "light touch" partners that are providing requested data complete and on-time; and we have many more touch points with suppliers that do not and may be at risk of losing our business. As part of our surveys, we include "green" preferences in our RFPs to specifically call out vendors to deliver on reporting transparency and renewable energy. For example, PUE is criteria for evaluating potential suppliers' operational efficiency, cost controls, risk mitigation, and commitment to addressing climate change. PUE, utilization rates, energy consumption per unit of computing (ex. kWh/byte) all weigh into evaluating suppliers. Last, supplier setting of renewable energy goals carries significant weight since it directly affects our scope 2 emissions as well as reaching our 2035 100% renewable energy goal. Success is measured by response time, completeness of data requested, willingness to continue or grow the partnership, and progress on 100% RE goals as well as emissions reductions that have a direct impact on Adobe's ability to meet its SBTs as well as 100% RE goal. Adobe engages with its customers on a quarterly to annual basis. Upon customer request, Adobe can allocate an estimate of customer GHG emissions for use of products purchased in order to be transparent with data for our customers’ reporting. Climate change goals and environmental product benefits are regularly communicated in line with CDP Supply Chain reporting. We also engage with our customers via our products. We provide them with tools to calculate their environmental impact reduction through use of our products. For example, we provide the Adobe Resource Saver Calculator which measures wood, water, and waste reduction from paper avoidance through the use of Adobe Sign. We prioritize engagement with our customers based on their reporting needs and timeline. Indicators of success for this strategy are shown in CDP Supply Chain responses. Adobe engages with other partners throughout the value chain such as policymakers and our utility providers in the regions we operate to assess their renewable energy strategies and their effect on our market-based emissions. For example, in 2016 we worked with San Francisco CleanPowerSF to gain a better understanding of where the renewable energy and environmental attributes are sourced and how to report it for Adobe. We also engage by working with them to influence their decision for how they procure true grid-scale renewable energy. The strategy for prioritization is the level of impact for short-term and long-term Adobe operations. Indicators of success is based on our partners’ in procuring or implementing their strategy with our support (i.e., CleanPowerSF investing in PPAs and not unbundled RECs).

CC14.4b
To give a sense of scale of this engagement, please give the number of suppliers with whom you are engaging and the proportion of your total spend that they represent
Type of
engagement
Number of
suppliers
% of total spend
(direct and indirect)
Impact of engagement
Active engagement 13 92%
Adobe has 11 managed Colo suppliers, as well as 2 cloud suppliers, accounting for 100% of our digital delivery value chain (and approximately 22 other suppliers that have "green" preferences built into their RFP processes). Only 1 supplier does not engage on energy and emissions data, accounting for only 8% of the supply chain -- 92% provide what we ask. Adobe has worked actively with each of these suppliers to collect energy (and water, utilization, etc.) data in order to report our share of it in our Scope 2 emissions. Energy consumption from the Colo suppliers represents a significant portion of Adobe's product delivery and, as stated in CC14.4a, we now have a "preference" for CoLos that agree to deliver this information and that set 100% RE goals.
CC14.4c
Please explain why you do not engage with any elements of your value chain on GHG emissions and climate change strategies, and any plans you have to develop an engagement strategy in the future
Further Information
Module: Sign Off
Page: CC15. Sign Off
CC15.1
Please provide the following information for the person that has signed off (approved) your CDP climate change response
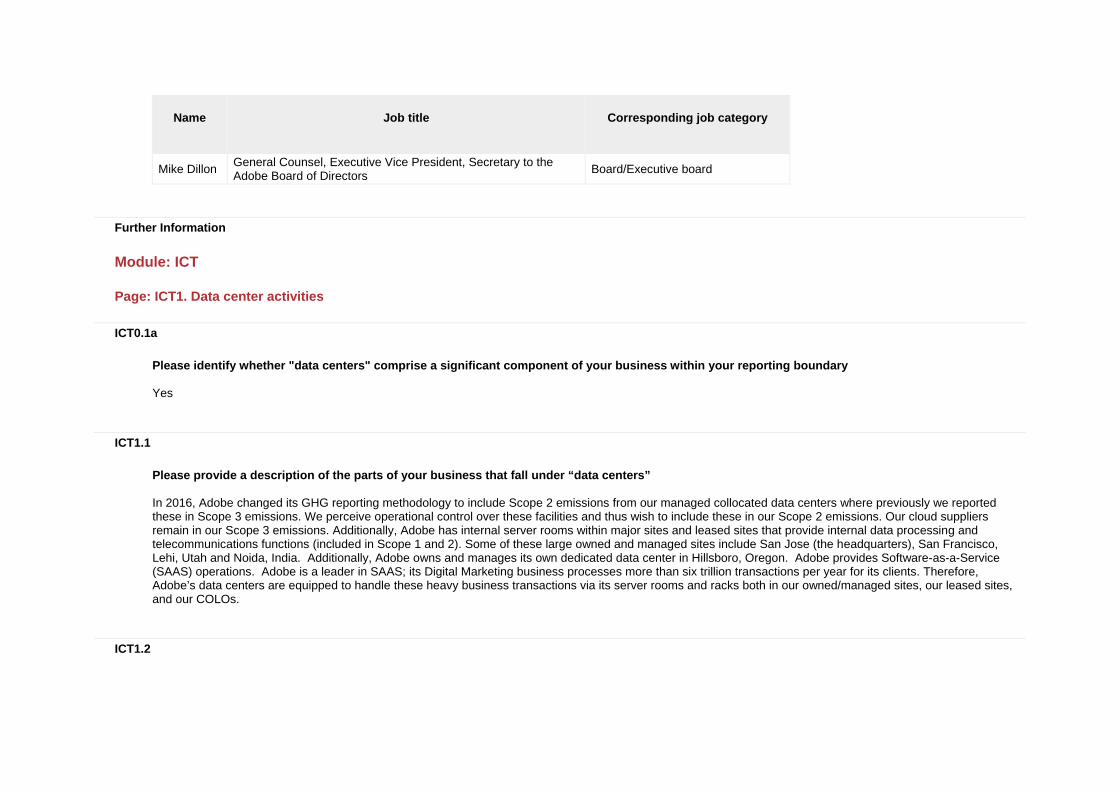
Name
Job title
Corresponding job category
Mike Dillon General Counsel, Executive Vice President, Secretary to the Adobe Board of Directors Board/Executive board
Further Information
Module: ICT
Page: ICT1. Data center activities
ICT0.1a
Please identify whether "data centers" comprise a significant component of your business within your reporting boundary Yes
ICT1.1
Please provide a description of the parts of your business that fall under “data centers” In 2016, Adobe changed its GHG reporting methodology to include Scope 2 emissions from our managed collocated data centers where previously we reported these in Scope 3 emissions. We perceive operational control over these facilities and thus wish to include these in our Scope 2 emissions. Our cloud suppliers remain in our Scope 3 emissions. Additionally, Adobe has internal server rooms within major sites and leased sites that provide internal data processing and telecommunications functions (included in Scope 1 and 2). Some of these large owned and managed sites include San Jose (the headquarters), San Francisco, Lehi, Utah and Noida, India. Additionally, Adobe owns and manages its own dedicated data center in Hillsboro, Oregon. Adobe provides Software-as-a-Service (SAAS) operations. Adobe is a leader in SAAS; its Digital Marketing business processes more than six trillion transactions per year for its clients. Therefore, Adobe’s data centers are equipped to handle these heavy business transactions via its server rooms and racks both in our owned/managed sites, our leased sites, and our COLOs.
ICT1.2

Please provide your absolute Scope 1 and 2 emissions and electricity consumption for the data centers component of your business
Business activity
Scope 1 emissions
(metric tonnes CO2e)
Scope 2 emissions
(metric tonnes CO2e)
Annual electricity
consumption (MWh)
Electricity data
collection method
Comment
Data centers 34189 82440 Other:
Scope 2 emissions are location-based and are also available as market-based emissions. For all server rooms (data centers located in office buildings), we submeter electricity usage but do not have dedicated HVAC units for these IT areas. Therefore, we cannot presently determine Scope 1 emissions from our owned, managed and leased data centers. For our managed collocated data centers, we work with each supplier to determine Adobe’s portion of electricity use through metering.
ICT1.3
What percentage of your ICT population sits in data centers where Power Usage Effectiveness (PUE) is measured on a regular basis?
Percentage
Comment
38% PUE is measured regularly at its Hillsboro Oregon Data Center and internal server rooms. PUE at collocated data centers is obtained by request and measured on an irregular basis
ICT1.4
Please provide a Power Usage Effectiveness (PUE) value for your data center(s). You can provide this information as (a) an average, (b) a range or (c) by individual data center - please tick the data you wish to provide (tick all that apply) Range
ICT1.4a

Please provide your average PUE across your data centers
Number of data centers
Average PUE
% change from previous year
Direction of change
Comment
ICT1.4b
Please provide the range of PUE values across your data centers
Number of data
centers
PUE Minimum
Value
% change of PUE
Minimum Value from previous
year
PUE Maximum
Value
% change of PUE
Maximum Value from
previous year
Direction of change
Comment
1 1.29 7.5 1.35 3.5 Decrease This is the range of PUE for our Hillsboro, Oregon data center. The minimum value has increased slightly for Hillsboro but the maximum value has decreased slightly.
ICT1.4c
Please provide your PUE values of all your data centers
Data center reference
PUE value
% change from previous year
Direction of change
Comment
ICT1.5
Please provide details of how you have calculated your PUE value Green Grid, or Total Facility Power divided by IT Equipment Power

ICT1.6
Do you use any alternative intensity metrics to assess the energy or emissions performance of your data center(s)? No
ICT1.6a
Please provide details on the alternative intensity metrics you use to assess the energy or the emissions performance of your data center(s)
ICT1.7
Please identify the measures you are planning or have undertaken in the reporting year to increase the energy efficiency of your data center(s)
Status in reporting year
Energy efficiency measure
Comment
Planned Cooling Efficiencies Planned remodel of San Jose server rooms to improve efficiency
Implemented Cooling Efficiencies Raised temperature of several server rooms
ICT1.8
Do you participate in any other data center efficiency schemes or have buildings that are sustainably certified or rated? Yes
ICT1.8a
Please provide details on the data center efficiency schemes you participate in or the buildings that are sustainably certified or rated

Scheme name
Level/certification (or equivalent) achieved in the reporting year
Percentage of your overall facilities to which the scheme
applies
LEED Gold for Adobe's wholly owned data center (OR1), Platinum for all Adobe housed server rooms 100%
EPA Energy Star We use Energy Star on an ongoing basis for several of our owned and managed facilities that also have server rooms.
ICT1.9
Do you measure the utilization rate of your data center(s)? Yes
ICT1.9a
What methodology do you use to calculate the utilization rate of your data center(s)? Measured IT load/design IT load
ICT1.10
Do you provide carbon emissions data to your clients regarding the data center services they procure? No
ICT1.10a
How do you provide carbon emissions data to your clients regarding the data center services they procure?
ICT1.11

Please describe any efforts you have made to incorporate renewable energy into the electricity supply to your data center(s) or to re-use waste heat Our RE100 goal encompasses our owned and managed sites that contain server rooms and a data center as well as working with our suppliers to ensure they are adopting and making progress towards RE goals also. For our owned and managed sites, our internal RE task force and consultants have made significant progress in identifying sites with the most opportunity and moving forward with procuring RE at these sites. For our COLO suppliers, we work with them to understand their current renewable practices and this year found that approximately 7,547 MWh of renewable energy was being used to power Adobe's portion of managed COLO electricity, which represents approximately 15% of Adobe's managed COLO electricity use. We will continue to work with these suppliers to incorporate this progress into our GHG inventory and subsequently reducing our Scope 2 market-based emissions.
Further Information
Page: ICT2. Provision of network/connectivity services
ICT0.1b
Please identify whether "provision of network/connectivity services" comprises a significant component of your business within your reporting boundary No
ICT2.1
Please provide a description of the parts of your business that fall under "provision of network/connectivity services"
ICT2.2
Please provide your absolute Scope 1 and 2 emissions and electricity consumption for the provision of network/connectivity services component of your business
Business activity
Scope 1 emissions (metric tonnes CO2e)
Scope 2 emissions (metric tonnes CO2e)
Annual electricity consumption (MWh)
Electricity data collection method
Comment

ICT2.3
Please describe your gross combined Scope 1 and 2 emissions or electricity use for the provision of network/connectivity services component of your business as an intensity metric
Intensity figure
Metric numerator
Metric denominator
% change from previous year
Direction of change from previous year
Reason for change
Comment
ICT2.4
Please explain how you calculated the intensity figures given in response to Question ICT2.3
ICT2.5
Do you provide carbon emissions data to your clients regarding the network/connectivity services they procure?
ICT2.5a
How do you provide carbon emissions data to your clients regarding the network/connectivity services they procure?
Further Information
Page: ICT3. Manufacture or assembly of hardware/components
ICT0.1c

Please identify whether "manufacture or assembly of hardware/components" comprises a significant part of your business within your reporting boundary No
ICT3.1
Please provide a description of the parts of your business that fall under "manufacture or assembly of hardware/components"
ICT3.2
Please provide your absolute Scope 1 and 2 emissions and electricity consumption for the manufacture or assembly of hardware/components part of your business
Business activity
Scope 1 emissions (metric tonnes CO2e)
Scope 2 emissions (metric tonnes CO2e)
Annual electricity consumption (MWh)
Electricity data collection method
Comment
ICT3.3
Please identify the percentage of your products meeting recognized energy efficiency standards/specifications by sales weighted volume (full product range)
Product type
Standard (sleep mode)
Percentage of products meeting the
standard by sales volume (sleep mode)
Standard (standby mode)
Percentage of products meeting the
standard by sales volume (standby
mode)
Standard (in use mode)
Percentage of products meeting the
standard by sales volume (in use mode)
Comment
ICT3.4

Of the new products released in the reporting year, please identify the percentage (as a percentage of all new products in that product type category) that meet recognized energy efficiency standards/specifications
Product type
Standard (sleep mode)
Percentage of new products meeting
the standard (sleep mode)
Standard (standby mode)
Percentage of new products meeting
the standard (standby mode)
Standard (in use mode)
Percentage of new products meeting
the standard (in use mode)
Comment
ICT3.5
Please describe the efforts your organization has made to improve the energy efficiency of your products
ICT3.6
Please describe the GHG emissions abatement measures you have employed specifically in your ICT manufacturing operations
ICT3.7
Do you provide carbon emissions data to your clients regarding the hardware/component products they procure?
ICT3.7a
How do you provide carbon emissions data to your clients regarding the hardware/component products they procure?
Further Information
Page: ICT4. Manufacture of software
ICT0.1d
Please identify whether "manufacture of software" comprises a significant component of your business within your reporting boundary No
ICT4.1
Please provide a description of the parts of your business that fall under "manufacture of software"
ICT4.2
Please provide your absolute Scope 1 and 2 emissions and electricity consumption for the software manufacture component of your business
Business activity
Scope 1 emissions (metric tonnes CO2e)
Scope 2 emissions (metric tonnes CO2e)
Annual electricity consumption (MWh)
Electricity data collection method
Comment
ICT4.3
Please describe your gross combined Scope 1 and 2 emissions for the software manufacture component of your business in metric tonnes CO2e per unit of production
Intensity figure
Metric numerator
Metric denominator
% change from previous year
Direction of change from previous year
Reason for change
Comment
ICT4.4
What percentage of your software sales (by volume) is in an electronic format?

ICT4.5
Do you provide carbon emissions data to your clients regarding the software products they procure?
ICT4.5a
How do you provide carbon emissions data to your clients regarding the software products they procure?
Further Information
Page: ICT5. Business services (office based activities)
ICT0.1e
Please identify whether "business services (office based activities)" comprise a significant component of your business within your reporting boundary Yes
ICT5.1
Please provide a description of the parts of your business that fall under "business services (office based activities)" i. The types of activities at Adobe that fall under business services include software development, IT support, and research and development. ii. These are the main components of building Adobe’s software suites, and are revenue generating activities. iii. The facilities are based globally, and include both purely office locations, as well as larger facilities that house data centers and server rooms for research and development and software development. iv. Inaccuracies may have arisen in documenting these locations when they are mixed with other activities such as sales or finance.
ICT5.2

Please provide your absolute Scope 1 and 2 emissions and electricity consumption for the business services (office based activities) component of your business
Business activity
Scope 1 emissions
(metric tonnes CO2e)
Scope 2 emissions
(metric tonnes CO2e)
Annual electricity
consumption (MWh)
Electricity data
collection method
Comment
Business services (office based activities)
11082 27686 67940 Meter or submeter reading
Scope 2 emissions are location-based. Adobe collects submetered electricity usage from our data centers and server rooms across our owned and leased properties. The business portion of our scopes 1 & 2 emissions are then assumed to be the emissions remaining once data center, server room electricity, and collocated data center electricity is subtracted from total electricity usage across our portfolio.
ICT5.3
Please describe your gross combined Scope 1 and 2 emissions for the business services (office based activities) component of your business in metric tonnes per square meter
Intensity figure
Metric numerator
Metric denominator
% change from previous year
Direction of change from previous year
Reason for change
Comment
0.11321 metric tonnes CO2e Square meter 1.2 Decrease
ICT5.4
Please describe your electricity use for the provision of business services (office based activities) component of your business in MWh per square meter
Intensity figure
Metric numerator
Metric denominator
% change from previous year
Direction of change from previous year
Reason for change
Comment
0.1984 MWh Square meter 1.6 Increase

Further Information
Page: ICT6. Other activities
ICT0.1f
Please identify whether "other activities" comprise a significant component of your business within your reporting boundary No
ICT6.1
Please provide a description of the parts of your business that fall under "other"
ICT6.2
Please provide your absolute Scope 1 and 2 emissions and electricity consumption for the identified other activity component of your business
Activity
Scope 1 emissions (metric tonnes CO2e)
Scope 2 emissions (metric tonnes CO2e)
Annual electricity consumption (MWh)
Electricity data collection method
Comment
ICT6.3
Please describe your gross combined Scope 1 and 2 emissions for your defined additional activity using an appropriate activity based intensity metric
Activity
Intensity figure
Metric numerator
Metric denominator
% change from
previous year
Direction of change from previous year
Reason for change
Comment
ICT6.4
If appropriate, please describe your electricity use for your defined additional activity using an appropriate activity based intensity metric
Activity
Intensity figure
Metric numerator
Metric denominator
% change from
previous year
Direction of change from previous year
Reason for change
Comment
Further Information
CDP