causes of prison overcrowding - · pdf filecauses of prison overcrowding ... there are also...
TRANSCRIPT

43
CAUSES OF PRISON OVERCROWDING
Tapio Lappi-SeppäläDirector, National Research Institute of Legal Policy, Finland
I. INTRODUCTION
Imprisonment ratesAn unprecedented expansion of penal control has occurred in recent decades in diff erent parts of
the world. Since the mid 1970s imprisonment rates in North America have increased nearly fi vefold. A similar increase occurred in many other countries during the 1980s and 1990s, in Africa, Asia, Europe and Oceania. During the last 15 years (1992-2008), in two out of three (63 %) countries, imprisonment rates increased by at least 10 %. The steepest increases exceed 200 %. Changes in prisoner rates by country from 1992-2008 are shown in fi gure I.1 (measured as percentages).
Figure I.1. Changes in national imprisonment rates per 100 000 population in 1992-2008 by country (ICPS)
Another distinct feature is a huge variation in the size of the prison population in diff erent countries (counted per 100 000 population.). Imprisonment rates by country are presented in fi gure I.2 below.

44
Figure I.2. Imprisonment rates per 100 000 population in 218 countries 2007/8 (ICPS)
At the top of the scale remains the US with 760 prisoners/100 000 pop. The lowest fi gures, around 10-20, can be found in the smaller (mostly Western) African countries, as well as in some micro-states (Liechtenstein, San Marino, Faeroe Islands, Tuvalu, Nauru, Timor Leste). The overall mean lies around 165 prisoners / 100 000.1
Regional analyses within continents show the lowest overall rates in Europe (mean 144) with the figures ranging regionally from 56 in Scandinavia to over 300 (Russia and the former Soviet Union region). In Africa (mean 111) the fi gures range from 50 in Western Africa to 250 in Southern Africa, in Asia (mean 158) between 110 (South-Central Asia) and a little below 200 (Central-Asia) . The Highest overall fi gures are found in the Americas (mean 282) ranging between 200 (South America) and 750 (USA, and 350 Canada included).
Occupancy and overcrowdingThe increase in the use of imprisonment has resulted in severe overcrowding. In this paper,
overcrowding is given a technical definition with the help of the statistical occupancy rate. Overcrowding means simply that the number of prisoners exceeds the official prison capacity (over 100 % occupancy rate). For the moment, this is the only available measure for wider comparisons between countries. The main problem with this measure is that the extent of overcrowding in this sense depends heavily on national/local standards. County which allow four prisoners in one cell may report “free space” if some cells are occupied by only three prisoners, while countries with single-cell accommodation as a norm may report overcrowding with much less “objective” overcrowding. Neither does this measure take into account diff erences in space, or in other prison conditions.
This means that the following figures of overcrowding are in most cases the absolute minimum fi gures. Using more substantial criteria - for example those imposed by the CPT - ratings for prison overcrowding would most probably look much worse.
More substantial criteria would refer for example to spatial density (sq meters /person), social density (number of persons in one space), and privacy (the time individuals can spend on their own). Subjective criteria of overcrowding would also include feelings of helplessness and stress, etc.
1 Data is obtained from the ICPS (International School of Prison Studies, King’s College, London) website. At the moment there is information from 218 countries. See http://www.kcl.ac.uk/schools/law/research/icps. These fi gures contain “raw” imprisonment rates on a specifi c day (not as annual averages). They do not take into account the diff erences whether fi gures in individual countries include juveniles detained in juvenile institutions, persons in drug treatment or mental health facilities, immigrants and foreigners detained on the basis of immigration laws. These adjustments are possible only for a limited number of countries (see Lappi-Seppälä 2008 and SPACE I 2009).

45
However, for the moment there is no data of these measures for comparative purposes. Neither is there agreement on international standards of what constitutes prison overcrowding. The Council of Europe Prison Rules has no provisions for the minimum space in the EPR (as there is the risk that the minimum will become a norm, see Zyl Smit & Snacken 2008 p.131 ff ). The CPT has emphasized that the acceptable minimum space depends also on the quality of the space and the time to be spent in the cells. Nevertheless, according to the CPT, the absolute minimum would be 4 sq meters in shared accommodation and 6 sq meters in single cells, which is more than can be found in several countries across the world.
Figure I.3. shows the distribution of countries according to the level of occupancy rate. Rate 100 % means that all prison places are in use. Rates exceeding 100 % demonstrate that prisoners have been inhabited more densely than the offi cial enforcement policy would indicate.
Figure I.3. Occupation rates (% of total prison capacity) in 185 countries 2007/8 (ICPS)
The data from ICPS indicates that more than two out of three countries have an occupancy rate of over 100 %. The average global occupancy rate is 122 %, exceeding the overall capacity by more than one fi fth. In the worst cases the number of prisoners exceeds the number of prison places by three to one. Figure I.4. displays occupancy rates by region.
Figure I.4. Occupancy rates (% of total prison capacity) by regions 2007/8 (ICPS)

46
Occupancy levels differ systematically. All European regions are below 100 %, while all African regions are above 100 %, and most of them over 150 %.
Factors contributing to overcrowding and overuse of imprisonment Technically, overcrowding results from the fact that the justice system is sending more people to
prison, and for longer periods, than the prison capacity allows. The immediate cause of overcrowding is either overuse of imprisonment or insufficient prison capacity.2 Also the remedy is simple: send fewer off enders to prison and/or for shorter periods, or build more prisons. But which would be the most preferable way to proceed?
Prison construction hardly provides a sustainable solution to the overcrowding problem. Prisons usually tend to get fi lled once they have been built. Also the CPT has concluded that the expansion of prison capacity to tackle prison overcrowding has not been successful (see Zyl Smit & Snacken 2008 p.89 and 132).
The search for remedies needs to draw attention also to those factors that contribute to the general use of imprisonment. There are also substantial reasons to be worried, not only about overcrowding but also of overuse. The consensus represented in the UN standards and norms urge member states to use prison as a last resort (see the UN Handbook on alternatives to imprisonment). Also, the social costs of extensive use of imprisonment are well documented in research literature (Garland 2001).
The following examines in more detail the reasons behind both overcrowding and overuse of imprisonment with the help of comparative statistics from the ICPS and two other data bases.3 Since causal explanations are highly problematic in explaining the functioning of complex social institutions, such as criminal punishment, the following discusses instead direct causes of “factors contributing to overcrowding and overuse of imprisonment”.
II. OVERCROWDING AND THE ROLE OF PRE-TRIAL DETENTION
The overall share of pre-trial prisoners of all prisoners is 32 %. However, this share varies between diff erent regions from 15 to 55 %, and among single countries from 0 to close to 100 %. Figure II.1. displays these diff erences by regions.
2 Which of these alternatives is stressed, depends, of course, of each and everyone's own point of view. There is, perhaps, even less agreement on what constitutes “overuse” than “overcrowding” (see above). It is fundamentally a value judgment. However, this judgment can be given reasons related to the social and economic costs involved in the use of imprisonment, as well as its relative cost-effectiveness, as compared to other available crime prevention strategies.
3 Three samples are employed. The fi rst contains all 218 countries in the ICPS database. The second covers top 100 countries ranked according to the UN human development index. Third sample includes 25 industrialized countries with more detailed information on possible background variables. The sample includes 16 in Western Europe, three in Eastern Europe (Czech Republic, Hungary, and Poland), two Baltic countries (Estonia, Lithuania), and four Anglo-Saxon countries (United States, Canada, New Zealand, and Australia). Samples and sources are described in more detail in Lappi-Seppälä 2008.

47
Figure II.1. Pre-trial rates (% of all prisoners) by regions 2007/8 (ICPS)
These differences are reflected also in differences in occupancy rates. We may confirm this by comparing the share of pre-trial detainees occupancy rates.
Table II.1. Pre-trial rates and occupancy rates by selected regionsHIGH PRE TRIAL REGIONS LOW PRE-TRIAL REGIONS
Occupancy rate % Pre trial % Occupancy
rate % Pre trial %
Central Africa 173 53 Scandinavia 94 19South-Central Asia 203 53 North America 91 18Western Africa 149 51 Central-Eastern Europe 94 16South America 141 51 Oceania 99 16Eastern Africa 170 42 Central Asia 78 15
48
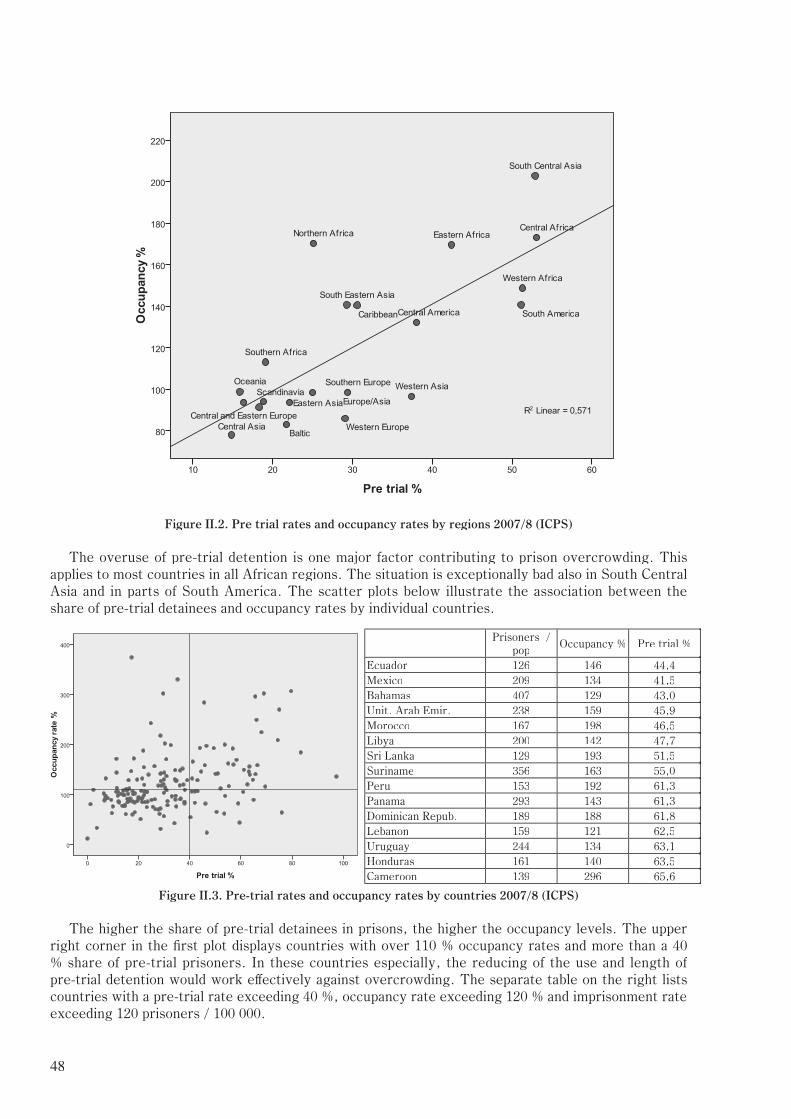
Figure II.2. Pre trial rates and occupancy rates by regions 2007/8 (ICPS)
The overuse of pre-trial detention is one major factor contributing to prison overcrowding. This applies to most countries in all African regions. The situation is exceptionally bad also in South Central Asia and in parts of South America. The scatter plots below illustrate the association between the share of pre-trial detainees and occupancy rates by individual countries.
Prisoners /pop Occupancy % Pre trial %
Ecuador 126 146 44,4Mexico 209 134 41,5Bahamas 407 129 43,0Unit. Arab Emir. 238 159 45,9Morocco 167 198 46,5Libya 200 142 47,7Sri Lanka 129 193 51,5Suriname 356 163 55,0Peru 153 192 61,3Panama 293 143 61,3Dominican Repub. 189 188 61,8Lebanon 159 121 62,5Uruguay 244 134 63,1Honduras 161 140 63,5Cameroon 139 296 65,6
Figure II.3. Pre-trial rates and occupancy rates by countries 2007/8 (ICPS)
The higher the share of pre-trial detainees in prisons, the higher the occupancy levels. The upper right corner in the fi rst plot displays countries with over 110 % occupancy rates and more than a 40 % share of pre-trial prisoners. In these countries especially, the reducing of the use and length of pre-trial detention would work eff ectively against overcrowding. The separate table on the right lists countries with a pre-trial rate exceeding 40 %, occupancy rate exceeding 120 % and imprisonment rate exceeding 120 prisoners / 100 000.

49
The use of pre-trial imprisonment is not the only factor behind high occupancy rates. The upper left corner in fi gure III.3. holds countries with high occupancy rates, but low pre-trial rates. Thus, quite often overcrowding is just a result of the overuse of imprisonment, or a result of insuffi cient prison capacity (depending on one’s point of view on this issue). If high occupancy rates coincide with high overall prisoner rates, one might be inclined to support more the former than the latter interpretation. The table in the appendix divides countries according to the overall levels of incarceration and occupancy rates (see appendix).
III. THE RELEVANCE OF CRIME
What is the impact of the level of crime and criminality on overcrowding and the general use of imprisonment? In advance one could imagine several mechanisms: prisons are used as a consequence of crime, and it would be only natural that the number of sentenced off ences would refl ect also the overall use of imprisonment (overcrowding). Imprisonment is also used as a means to reduce crime. Therefore the views of policymakers on trends of crime (and the eff ectiveness of imprisonment), may well have an eff ect on policy decisions.
The following correlation table III.1. takes a brief look at the statistical associations between imprisonment rates and crime rates. Crime is measured using several indicators: The UN survey data for total recorded crime in 44 countries (row 1), health statistics data (mainly WHO) data for completed homicide in 192 countries (row 2), data from victimization studies in assault worldwide (68 countries, row 3) and for 10 crimes in the EU (29 countries, row 4). In addition, the impact of crime on imprisonment is examined using conviction statistics both from the UN surveys and the European Sourcebook (Space I, rows 5-6).
Table III.1. Bivariate correlations between crime and imprisonment ratesPRISONERS / 100 000
(2007/8, ICPS)COUNTRIES
N
1. Total reported crime /100 000 (2004, UN) -0,36* 44
2. Homicide /100 000 (completed, WHO, UN) ,031 192
3. Victimization % assault % (ICVS, van Dijk 2009) 0,06 68
4. Victimization % (EU ICS, prevalence 2005, 10 crimes) 0,14 29
5. Convictions 2004 / 100 000 (total, UN) -0,08 34
6. Convictions 2003 (traffi c excluding, Space I) -0,21 20
*. Correlation is signifi cant at the 0.05 level (2-tailed).**. Correlation is signifi cant at the 0.01 level (2-tailed).
50
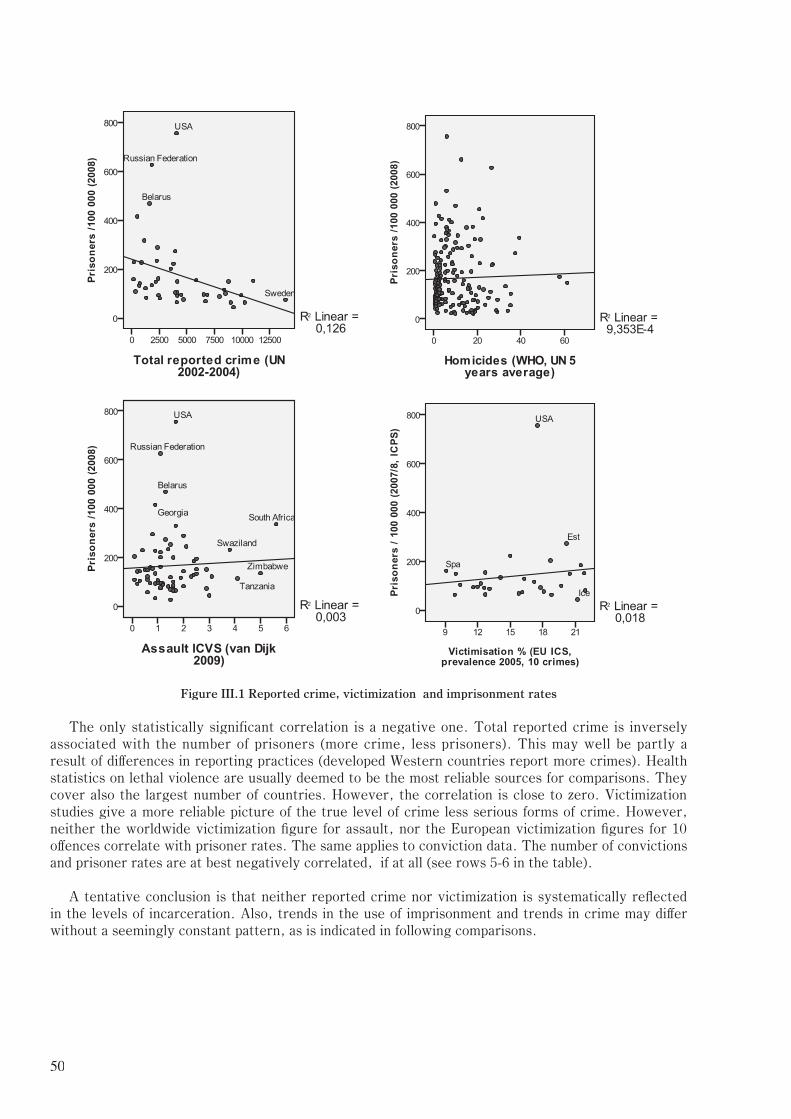
Figure III.1 Reported crime, victimization and imprisonment rates
The only statistically significant correlation is a negative one. Total reported crime is inversely associated with the number of prisoners (more crime, less prisoners). This may well be partly a result of diff erences in reporting practices (developed Western countries report more crimes). Health statistics on lethal violence are usually deemed to be the most reliable sources for comparisons. They cover also the largest number of countries. However, the correlation is close to zero. Victimization studies give a more reliable picture of the true level of crime less serious forms of crime. However, neither the worldwide victimization fi gure for assault, nor the European victimization fi gures for 10 off ences correlate with prisoner rates. The same applies to conviction data. The number of convictions and prisoner rates are at best negatively correlated, if at all (see rows 5-6 in the table).
A tentative conclusion is that neither reported crime nor victimization is systematically refl ected in the levels of incarceration. Also, trends in the use of imprisonment and trends in crime may diff er without a seemingly constant pattern, as is indicated in following comparisons.
51
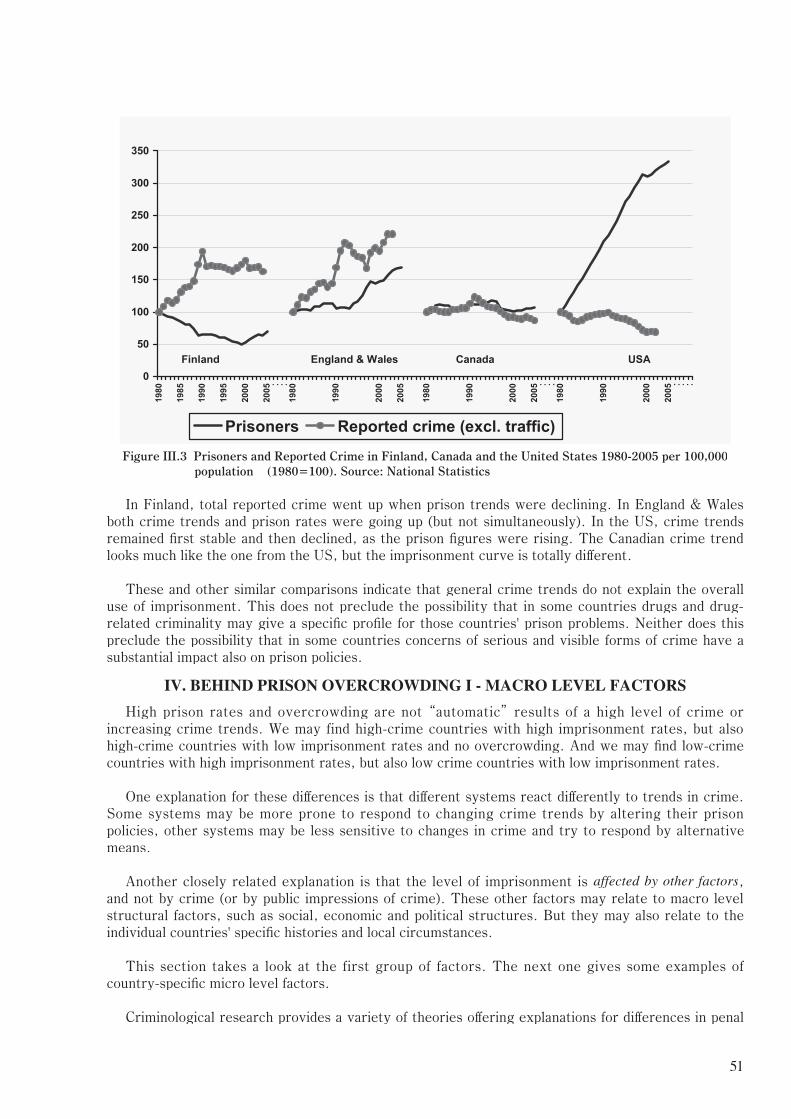
Figure III.3 Prisoners and Reported Crime in Finland, Canada and the United States 1980-2005 per 100,000 population (1980=100). Source: National Statistics
In Finland, total reported crime went up when prison trends were declining. In England & Wales both crime trends and prison rates were going up (but not simultaneously). In the US, crime trends remained fi rst stable and then declined, as the prison fi gures were rising. The Canadian crime trend looks much like the one from the US, but the imprisonment curve is totally diff erent.
These and other similar comparisons indicate that general crime trends do not explain the overall use of imprisonment. This does not preclude the possibility that in some countries drugs and drug-related criminality may give a specifi c profi le for those countries' prison problems. Neither does this preclude the possibility that in some countries concerns of serious and visible forms of crime have a substantial impact also on prison policies.
IV. BEHIND PRISON OVERCROWDING I - MACRO LEVEL FACTORS
High prison rates and overcrowding are not “automatic” results of a high level of crime or increasing crime trends. We may find high-crime countries with high imprisonment rates, but also high-crime countries with low imprisonment rates and no overcrowding. And we may fi nd low-crime countries with high imprisonment rates, but also low crime countries with low imprisonment rates.
One explanation for these diff erences is that diff erent systems react diff erently to trends in crime. Some systems may be more prone to respond to changing crime trends by altering their prison policies, other systems may be less sensitive to changes in crime and try to respond by alternative means.
Another closely related explanation is that the level of imprisonment is affected by other factors, and not by crime (or by public impressions of crime). These other factors may relate to macro level structural factors, such as social, economic and political structures. But they may also relate to the individual countries' specifi c histories and local circumstances.
This section takes a look at the first group of factors. The next one gives some examples of country-specifi c micro level factors.
Criminological research provides a variety of theories off ering explanations for diff erences in penal

52
severity and the use of imprisonment. Most of the in depth studies are confi ned to a small selection of (usually Western) countries. Comparisons covering a larger numbers of countries, on the other hand, are often impaired by the availability of data.
None of the analyses so far have been able to produce a simple explanation for global penal differences, and one may doubt whether they ever will. However, it has been possible to detect factors which seem to explain a large proportion of the diff erences in the use of imprisonment in many developed industrialized democracies. Still, it remains open to what extent these explanations apply to developing countries. One may need to pay attention to diff erent things in explaining penal policies in Northern Europe, in Latin America, or in Africa. Being aware of these risks, the following gives some examples of interesting associations between imprisonment and selected social, political and economic factors.
Economic wealthBuilding prisons is expensive, so it is natural to assume that an increase in economic resources will
at some point contribute to the increased use of imprisonment. But, one may also assume that after reaching a certain level of economic wealth, also other measures and strategies become available, should politicians wish to use them.
These assumptions have also some empirical support. The direction of the correlation seems to be dependent on the general level of economic prosperity.
Figure IV.1 Prisoner Rates and GDP. GDP under and over 15,000 $. Sample 100. Outliers US and Luxemburg removed. Source: Sourcebook 2006 complemented, IMF
In poorer countries with GDP below $15,000 the association is positive (more money means more prisoners), whereas in rich democracies the correlation changes direction (more money, fewer prisoners - except in the US). Building prisons is expensive, and having a positive correlation makes sense from this point of view.4 At some point, however, the accumulation of economic wealth becomes negatively associated with penal severity. In general, wealthy nations seem to be less punitive, with one obvious outlier - the United States.
This does not apply to overcrowding (occupancy levels). Here the general rule is that increased
4 This fact is refl ected also in recent trends in the use of imprisonment among developing countries. Johnson (2008, p.51) observes how developing countries in the Asian region are now constructing the required infrastructure for routine based use of imprisonment, resulting in a rapid increase in the use of imprisonment in those regions.
53
wealth is weakly associated with less overcrowding both in poorer and richer countries.
Social indicators and general well-beingAlong with economic wealth the use of imprisonment is affected by a number of social factors.
Indicators that measure the general well-being seem to be closely connected also with the quality and severity of criminal justice. These factors include economic and social equality and the extent of social protection provided by the state.
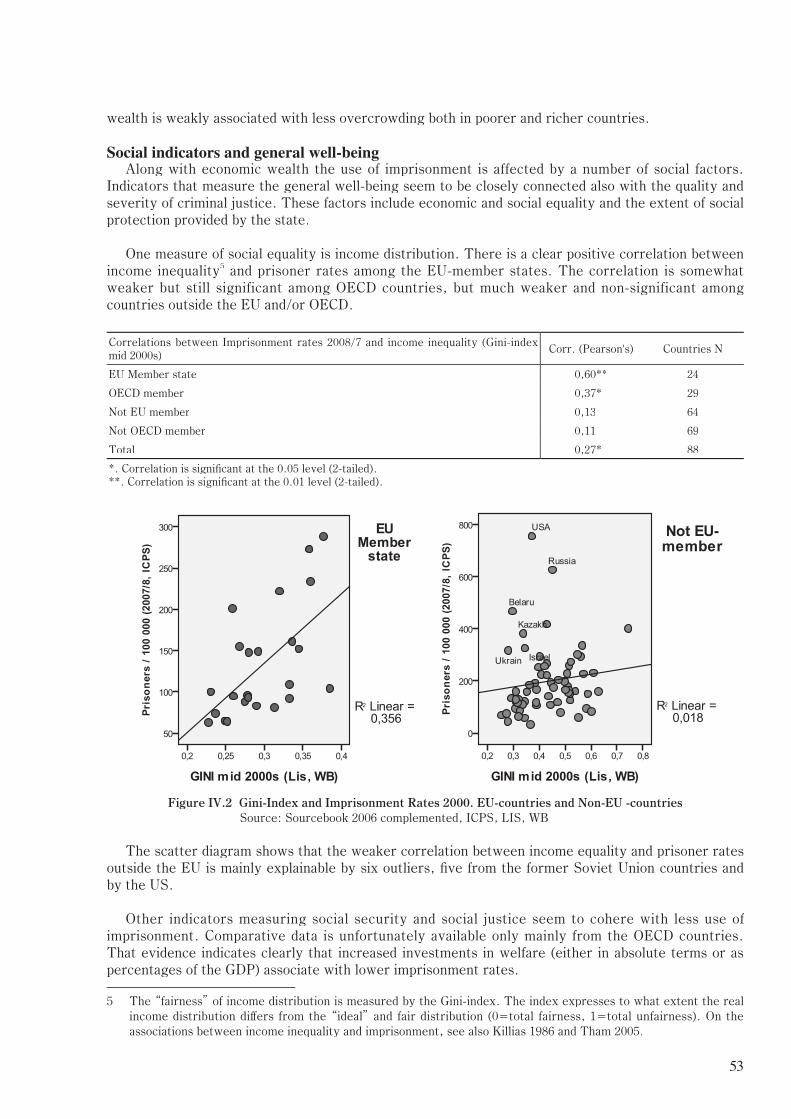
One measure of social equality is income distribution. There is a clear positive correlation between income inequality5 and prisoner rates among the EU-member states. The correlation is somewhat weaker but still significant among OECD countries, but much weaker and non-significant among countries outside the EU and/or OECD.
Correlations between Imprisonment rates 2008/7 and income inequality (Gini-index mid 2000s) Corr. (Pearson's) Countries N
EU Member state 0,60** 24
OECD member 0,37* 29
Not EU member 0,13 64
Not OECD member 0,11 69
Total 0,27* 88
*. Correlation is signifi cant at the 0.05 level (2-tailed).**. Correlation is signifi cant at the 0.01 level (2-tailed).
Figure IV.2 Gini-Index and Imprisonment Rates 2000. EU-countries and Non-EU -countries Source: Sourcebook 2006 complemented, ICPS, LIS, WB
The scatter diagram shows that the weaker correlation between income equality and prisoner rates outside the EU is mainly explainable by six outliers, fi ve from the former Soviet Union countries and by the US.
Other indicators measuring social security and social justice seem to cohere with less use of imprisonment. Comparative data is unfortunately available only mainly from the OECD countries. That evidence indicates clearly that increased investments in welfare (either in absolute terms or as percentages of the GDP) associate with lower imprisonment rates.
5 The “fairness” of income distribution is measured by the Gini-index. The index expresses to what extent the real income distribution diff ers from the “ideal” and fair distribution (0=total fairness, 1=total unfairness). On the associations between income inequality and imprisonment, see also Killias 1986 and Tham 2005.

54
Figure IV.3 Social expenditure and Imprisonment Rates: OECD countries. Source: Sourcebook 2006 complemented, Eurostat
In the right lower corner are the countries with strong investments in welfare and low imprisonment/occupancy rates. On the upper left corner we fi nd mostly Eastern countries.
Trust and legitimacyIt is also assumable that the legitimacy of the political system and confi dence in the legal system
and the severity of criminal justice may be intercorrelated. A legitimate system may get by with less severe sanctions, while a system in crisis may wish to uphold its credibility by increasing penalties. And a legal system whose norms and procedures are experienced as fair and legitimate may be complied with by the people because the system is felt to be worth following. The norms of criminal law are followed out of legitimacy, and not out of fear. And in such a system the legislator may well be able to use more moderate sanctions.
Both assumptions get support among the developed countries, but less so among developing countries.
Figure IV.4 Trust in Police and Imprisonment Rates. Sample 100, EU-countries and Non-EU -countries. Source: Sourcebook 2006 complemented, WVS
The strongest association between social trust (trust in people) and institutional trust (trust in police and the legal system) and the use of imprisonment can be detected among European countries

55
14
Figure IV.4 Social trust and trust in legal system and Imprisonment Rates. Basic sample. Source: Sourcebook 2006 complemented, ESS
DiscussionThese tentative fi ndings need several qualifi cations. Firstly, there are other factors which should
also have been included; among others, the political culture and diff erences in democratic structures. A closer analyses would indicate that “consensual democracies”, as opposed to “confl ictual” majoritarian democracies associate with more moderate penalty levels and lower imprisonment rates (Lijphart 1999, Lappi-Seppälä 2008, Green 2008). Such democracies are also characterized by better political and economic equality, stronger welfare and lesser fears.
In fact, most of the key factors studied above are interrelated. Economic wealth, social security, low fears, income equality and the quality of democracy seem all to sustain each other, and at the same time promote moderation in penal policies. It is hard to say which of these comes fi rst, or which is more fundamental. In any case, that would be a task of another study. But for the purpose of the discussions in the workshop it may be enough to conclude that the building of a democratic state under the rule of law, and promoting social equality, is also building a legitimate system of criminal justice. And this system manages to fulfi l its tasks with less use of imprisonment.
Or put the other way around: a high imprisonment rate is not a sign of a well functioning democracy and trusted legal system, rather the opposite. At least the eff orts to uphold confi dence in the justice system by severe sanctions do not seem to carry very far. After all, the countries with high trust tend to have low imprisonment rates, but countries with high imprisonment rates tend to have low trust.
V. BEHIND OVERCROWDING II: MICRO LEVEL CASE STUDY OF FINLAND
But if the use of imprisonment is determined by structural factors, where does it leave human action? This question is based on misunderstanding. Macro level structural factors do not determine the outcome, they merely increase the probability of some type of policies (and they may make other policies less probable). Still, they never dictate the end result. Structure is not determination (Lacey 2008 p. 205), and there always remains room for choice. That can be seen just by looking at the countries (above and below the regression lines) which have not followed the general patterns.
Studying these “deviant countries” may also give information of these specifi c local conditions that have infl uenced the policy choices. A single country case-study from Finland may also illustrate how it has been possible to swim against the tide, at times when other countries were moving in the opposite direction. These experiences give also concrete examples of the causes of overcrowding, as well as of proper countermeasures.

56
Social and economic backgroundA small country from northern Europe with only a little over 5 million inhabitants may seem too
remote a point for meaningful comparison. However, the nature of the problems is surprisingly similar, once we look back at history. Today Finland is a prosperous and safe Nordic welfare state. However, this was not always the case. During the last century Finland experienced a brutal civil war, the harshness of the Second World War, heavy war compensations, severe social crises, and deep recessions.
These social and political crises were reflected in the Finnish criminal justice system. At the beginning of the 1950s, the prisoner rate in Finland was four times higher than in the other Nordic -countries. Our prisoner rates were on the same level as several countries in Northern and Southern Africa and South America, including Brazil. Finland had almost 200 prisoners per 100,000 inhabitants, while the fi gures in Sweden, Denmark and Norway were around 50. Even during the 1970s, Finland's prisoner rate continued to be among the highest in Western Europe.
The first hand explanation for this relates to structural factors discussed above. Burdened with political and economic crisis Finland had been unable to invest in criminal justice reform in a similar manner to its neighbours. Consequently, the legislation became to lag far behind general societal development. This discrepancy became more and more evident once Finland was joining the Nordic welfare family in the course of the 1960s and 70s
Ideological and legislative backgroundReasons behind overcrowding were partly ideological, as well. In the 1950s and early 1960s the
criminal justice system and imprisonment were seen as the key answer to the crime problem. The strong reliance on the eff ectiveness of imprisonment started to weaken during the 1960s. We began to realize the limitations of the prison system, fi rst just by comparing our prisoner rates and crime rates with the other Nordic countries (see for example Christie 1968). The nature of the crime problem in the Nordic countries was more or less the same, but there were huge diff erences in the numbers of incarcerated people. This was deemed to be both irrational and inhuman.
Also, criminological research findings pointed at the same direction. Reoffending rates were documented to be generally higher after imprisonment, compared to other sanctions. In Finland, as well as in other Nordic countries, the conclusion was a general distrust of the overall eff ectiveness of criminal sanctions, when compared to other means of crime prevention. As a consequence, attention was directed to social and situational crime prevention strategies.
These findings may have relevance for today's discussions as well. Popular overreliance on the preventive eff ects of imprisonment (whether rehabilitation or deterrence) may still be one of the major background factors behind high incarceration rates and high levels of overcrowding. Public policies would benefi t from a lot of the systematic use of research evidence on relative cost-eff ectiveness of prison policies, as compared to social and situational crime strategies.
The simple technical explanation for the unduly high prisoner rates in Finland was, however, our outdated and overly severe criminal law. Political consensus was reached that the penal code should be reformed and our prisoner rates should also be reduced to be closer to our Nordic neighbours'. This, in turn, was motivated by the intensifi ed Nordic cooperation in penal matters. This reform work started in the mid 1960s and continued till the mid 1990s. This long-term programme can also be read as a part of a series of actions targeted against the major legislative causes of prison overcrowding.
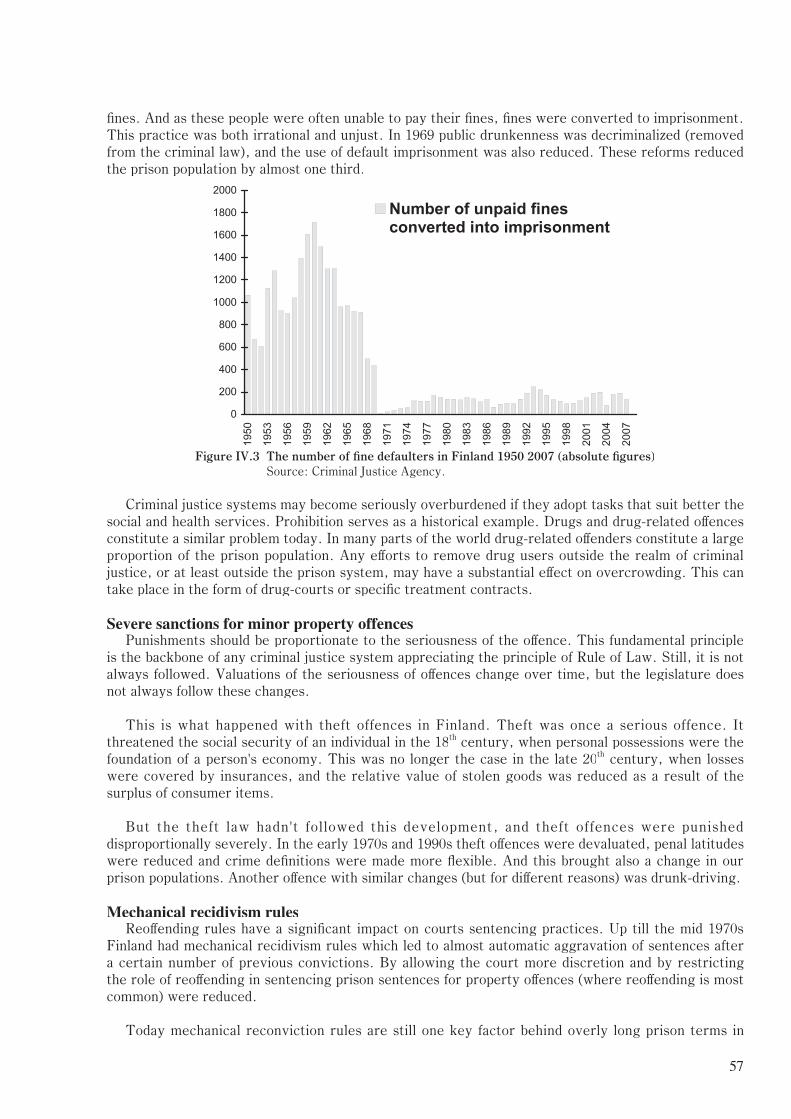
Unnecessary criminalization and overuse of default imprisonment for unpaid fi nes The fi rst target was the overuse of default imprisonment for unpaid fi nes, as well as the misuse
of the criminal law as a means of social control. Criminal law should be used as a last resort, and not extend itself to areas that can better be dealt with by means of social and health policy. This advice was not appreciated in Finland in the 1950s and 1960s when public drunkenness was still punishable by
57
fi nes. And as these people were often unable to pay their fi nes, fi nes were converted to imprisonment. This practice was both irrational and unjust. In 1969 public drunkenness was decriminalized (removed from the criminal law), and the use of default imprisonment was also reduced. These reforms reduced the prison population by almost one third.
Figure IV.3 The number of fi ne defaulters in Finland 1950 2007 (absolute fi gures) Source: Criminal Justice Agency.
Criminal justice systems may become seriously overburdened if they adopt tasks that suit better the social and health services. Prohibition serves as a historical example. Drugs and drug-related off ences constitute a similar problem today. In many parts of the world drug-related off enders constitute a large proportion of the prison population. Any eff orts to remove drug users outside the realm of criminal justice, or at least outside the prison system, may have a substantial eff ect on overcrowding. This can take place in the form of drug-courts or specifi c treatment contracts.
Severe sanctions for minor property offences Punishments should be proportionate to the seriousness of the off ence. This fundamental principle
is the backbone of any criminal justice system appreciating the principle of Rule of Law. Still, it is not always followed. Valuations of the seriousness of off ences change over time, but the legislature does not always follow these changes.
This is what happened with theft offences in Finland. Theft was once a serious offence. It threatened the social security of an individual in the 18th century, when personal possessions were the foundation of a person's economy. This was no longer the case in the late 20th century, when losses were covered by insurances, and the relative value of stolen goods was reduced as a result of the surplus of consumer items.
But the theft law hadn't followed this development, and theft offences were punished disproportionally severely. In the early 1970s and 1990s theft off ences were devaluated, penal latitudes were reduced and crime defi nitions were made more fl exible. And this brought also a change in our prison populations. Another off ence with similar changes (but for diff erent reasons) was drunk-driving.
Mechanical recidivism rulesReoff ending rules have a signifi cant impact on courts sentencing practices. Up till the mid 1970s
Finland had mechanical recidivism rules which led to almost automatic aggravation of sentences after a certain number of previous convictions. By allowing the court more discretion and by restricting the role of reoff ending in sentencing prison sentences for property off ences (where reoff ending is most common) were reduced.
Today mechanical reconviction rules are still one key factor behind overly long prison terms in

58
several parts of the world. Sometimes rigid defi nitions for organized crime have the same impact (for example stipulating that any off ence committed together by several persons is to be treated as a form of organized crime). As a result, a substantial part of prisoners may be serving unduly long sentences for fairly trivial property off ences. This is much due to the fact that in this off ence type reoff ending is generally common and rigid recidivism sentencing provisions lead easily to unduly harsh penalties.
Rigid early release practices Early release and parole procedures are another key factor affecting the extent of the use of
imprisonment. In the 1950s, and even into the 1960s, Finland had quite rigid early release provisions, which granted the possibility for parole only after six months of a prison term had passed. This minimum time was gradually reduced to 14 days, and early release was made a semi-automatic practice now reaching 99 % of all prisoners. Also, the rules of parole revocation were made more fl exible. All these reforms had an immediate impact on the Finnish incarceration rates.
Today the pivotal role of parole and early release is demonstrated by those countries with increasing prisoner rates as a result of the adoption of a determinate sentencing system. This eff ect is escalated if prior sentencing practice remains the same, but prisoners are denied parole.
Juveniles in prisonSending young off enders to prison is unwise policy. Research tells us that re-off ending rates are
generally very high. Placing juveniles in prison creates thus a substantial risk for a prolonged prison-career.
This was one of the obvious drawbacks of the Finnish prison policy in the 1960s. Finland had several times more juveniles in prison than its neighbours. The detrimental effects of prison for juveniles became widely acknowledged during the 1970s. This also led to a strong reduction in custodial sanctions for children under 18, both in law and in court practice.
Figure IV.5 The number of juvenile prisoners 1975 2007 (annual averages, absolute fi gures, remand included). Source: Criminal Sanctions Agency
The large number of children in custody is a specific problem for a substantial number of high-imprisonment countries. The share of juveniles under 18 of all prisoners may, in some cases, near one tenth of the overall imprisonment rate, while in most low-imprisonment countries this share ranges between 1 to 2 %. Today several low-imprisonment countries prefer other than criminal justice solutions in dealing with young offenders. According to the general Nordic youth justice model all children under 15 and many of those aged 15-17 are dealt with using social welfare and child protection measures, instead of the criminal law.

59
More alternatives to imprisonmentThe international movements of the 1970s towards alternatives to imprisonment began to
have legislative consequences first during the 1980s, and more widely in the 1990s. The Finnish experiences, on the other hand, prove that visible results can be achieved just by using traditional alternatives, such as fi nes and conditional sentences.
By the 1990s around two out of three prison sentences in Finland were imposed conditionally and fi nes accounted for more than 60 % of all penalties imposed by the courts. It was unlikely that these alternatives could be extended beyond that point. New alternatives were needed, and community service served that purpose. Community service was adopted on an experimental basis in 1992 and made permanent in 1995. As the statistics below show, the number of prison sentences fell, together with the increase in the number of community service orders, between 1992 1997. In a short time community service came to replace 35 % of short prison sentences of a maximum of eight months.
Figure IV.6 Imprisonment and community service in Finland 1992 2007 (court statistics). Source: Statistics Finland
All in all, there is evidence from low imprisonment countries, such as Scandinavia and Germany that frequent use of fines goes together with lower imprisonment rates. The same holds true for traditional alternatives such as the conditional and suspended sentence, as well as more recent innovations such as community service and electronic monitoring (especially in Sweden). Overall, a substantial part of the low imprisonment level in Scandinavia, Germany and Switzerland may be attributed to the eff ective implementation of non-custodial alternatives.
The lack of alternatives may obviously explain the overuse of imprisonment in countries whose sanctions system operates mainly through imprisonment. Often this may also be a question of material resources. New alternatives, such as community service and electronic monitoring, require a proper infrastructure. But in such cases, it might be good to remember that there are also traditional alternatives, such as fines and conditional and suspended sentences, which may contribute to the system with a much lighter infrastructure. These low-cost sanctions are available to most jurisdictions without any major investments. And using shorter sentences does not require any infrastructure at all.
Prison rates and crime rates These were by far not the only reforms that were carried out in order to bring down the Finnish
prisoner rates. Other important changes were made in provisions concerning pre-trial, preventive detention, day-fine rules, conditional imprisonment, drunken driving, non-prosecution, etc. Also, prison laws were reformed and new enforcement practices were adopted in order to ease the overcrowding problem (open prisons and prison furloughs).

60
The overall result of these reforms was a substantial reduction in the prison population from the exceptionally high level of 150 (p/pop) in the beginning of the 1960s, to the common Nordic level of around 60 in the early 1990s. This raises also the question of what were the crime preventive eff ects of this steep decrease in the use of imprisonment. To evaluate this, we need to include the other Nordic countries in the comparisons.
These countries have strong social and structural similarities. But they have diff erent penal history on one point: in the exceptional fall of the imprisonment rate that took place in Finland from the 1950s. This provides an unusual opportunity to assess how drastic changes in penal practices in one country have been refl ected in the crime rates compared to countries (with similar social and cultural conditions) which have kept their penal systems more or less stable. Figure VI.2 shows incarceration and reported crime rates in Finland, Sweden, Denmark and Norway from 1950 to 2005.
Figure IV.7 Prison rates and crime rates in four Nordic countries 1950 2005. Compiled from: Falck et al 2003 and national Statistics
There is a striking diff erence in the use of imprisonment, and a striking similarity in the trends in recorded criminality. That Finland has substantially reduced its incarceration rate has not disturbed the symmetry of the Nordic crime rates. These fi gures, once again, support the general criminological conclusion that crime and incarceration rates are fairly independent of one another; each rises and falls according to its own laws and dynamics.
V. CONCLUSIONS
The title promised an answer to the question of “causes of prison overcrowding”. Unfortunately, no simple answers are available.
In several countries, overcrowding results simply from the overuse of pre-trial detention. This applies especially to the African regions. In many of the African prisons suffering from severe overcrowding, more than half of the prisoners are on pre-trial detention.
But besides the use of pre-trial detention one should look also for other reasons behind overcrowding.
Against what one could assume, trends in crime seem to have less impact on the overall use of

61
imprisonment. There is no general association between total reported crime and victimization. Nor do the overall trends of reported crime associate systematically with changes in incarceration. The search for the reasons for overcrowding and diff erences in the use of imprisonment must proceed beyond the analyses of crime trends. This does not mean that crime is irrelevant, but the relevance of crime may diff er, depending on other social and political factors.
The search for these background causes may take different routes. We may examine individual countries and their histories. Or we may compare a larger number of countries in order to figure out what factors are common in high imprisonment countries, and what unites low imprisonment countries. Both methods increase our understanding of the dynamics of penal change.
In a wider historical and comparative perspective, the general practice of punishment seems to be conditioned by macro level factors, including economic and social structures, political culture, and also public sentiments and political legitimacy. This may appear disappointing for anyone wishing to initiate a penal change. However, there is always room for political choice, even in this “structurally given” environment. It is, still, in the hands of local governments and politicians to decide, what to do and how to conduct domestic penal policy. In the end, it is up to political will.
This conclusion is highlighted by the case study from Finland. High incarceration was defi ned at the political level as a problem. The Finnish politicians also understood and accepted that the use of imprisonment could be reduced without serious repercussions on the level of criminality, and they acted accordingly.
One central element behind the success was a broad based approach to the problem. The reform programme was grounded in research-based theoretical notions on the functions of the criminal justice system. Legislative actions were carried out on all fronts and of all levels of the criminal justice system: in criminal process, sanctions systems, specifi c off ences, sentencing principles, enforcement and prison law, and juvenile justice. This was achieved with the close cooperation of all the key groups in the criminal justice system.
Appendix. Countries by prisoner rates and occupancy levels (ICPS)Prisoners /100 000 (2008) Occupancy rate % Total
<75 % 75-100 % 101-110 % 111-150 % 151-200 % Over 200 % <75 %-50 Andorra
LiechtensteinSolomonIslandsNigerGambia
Faeroe Islands (Denmark)NigeriaIceland
MauritaniaRepublic of Guinea
LiberiaIndiaNepal
Burkina Faso
Sierra Leone 8 %
51-100
Sao Tome e PrincipeIraqVanuatuSyria
AngolaAustriaBahrainBosnia andHerzegovina: FederatioDenmarkFinlandGermanyIreland, Republic ofKosovo/KosMaltaNetherlandsNorwayPapua New GuineaSwitzerlandTongaNorthern Ireland
JapanSwedenGuatemalaSamoaCyprusKiribati
ItalyParaguayVenezuelaFranceBelgiumSloveniaMarshall IslandsMayotte (France)MadagascarBosnia and Herzegovina: RepublikaCroatiaMozambiqueCambodia
SenegalIndonesiaGhanaMalawiHaitiUganda
BoliviaCote D'IvoirePakistanCongo (Dem Repub of)BangladeshBenin
28 %

62
101-150 Cook Islands (NZL)MonacoKyrgyzstanGuernsey(United Kingdom)TajikistanIsle of Man(United Kingdom)
SlovakiaRomaniaJordanArmeniaPortugalFijiBulgariaCanadaLesothoHong Kong (China)
UK: ScotlandMacedoniaKuwaitTurkeyZimbabweAustraliaMontenegro
UzbekistanSerbiaHungaryColombiaNicaraguaBrunei DarussalamGreeceMyanmarEcuador
Philipp.New Caledon. Sri LankaTanzania
BurundiKenyaCameroonZambia
22 %
151-250
Northern MarianaIslands (USA)Gibraltar (United Kingdom)Jersey (United Kingdom)
Macau (China)MoldovaAzerbaijan Dominican RepublicTurkmenistanNew ZealandLithuaniaSwazilandNamibiaArgentinaCzech RepublicCosta Rica
Greenland (Denmark)MauritiusReunion(France)PolandLuxembourg
JamaicaEngland & WalesGuadeloupe LebanonMalaysiaAlbaniaMartinique (MexicoHondurasSpainLibyaUruguayBrazil
United Arab EmiratesPeruAlgeriaMorocco
RwandaFrench Polynesia Iran
22 %
251-400
SeychellesBermuda (UK)Latvia
KazakhstanAntillesPuerto Rico (USA)Trinidad and TobagoAruba (Netherlands)EstoniaSingaporeIsraelUkraineSt Vincent and the Grenadines
Guyana
CaymanGuam (USA)St LuciaAntigua and BarbudaFrench Guiana/Guyane South AfricaBotswanaMaldivesDominica
ChileThailandPanamaSurinameEl Salvador
Barbados 16 %
Over 400 BelizeRussian FederationVirgin Islands(UK)
BelarusUSA
BahamasGeorgiaAnguila
St. Kitts and Nevis Grenada 5 %
Total 11 % 30 % 12 % 27 % 11 % 9 % 100 %
Relevant litteratureAebi, M., Aromaa K., Aubusson de Cavarlay B., Barclay G:, Gruszczyñska B., von Hofer H., Hysi V.,
Jehle J-M., Killias M., Smit P., and Tavares C. (2006) The European Sourcebook of Crime and Criminal Justice Statistics-2006. The Hague: Boom Juridische uitgevers.
Aebi, M., and Stadnic N. (2007/2009)Council of Europe SPACE 1: 2005/1007 Survey on Prison Populations. Document PC-CP (2007) 2 / (2009) 1. Strasbourg: Council of Europe.
Beckett, K. & Western, B. (2001)“Governing social marginality: Welfare, incarceration, and the transformation of state policy.” In Mass Imprisonment. Social Causes and Consequences, edited by David Garland. Sage Publications Ltd. P.: 35 50.
Cavadino, M. & Dignan, J. (2006)Penal Systems. A Comparative Approach London / Thousand Oaks / New Delhi: Sage Publications.
Christie, Nils. (1968)“Changes in Penal Values”. In Scandinavian Studies in Criminology 2. Universitetsforlaget, Oslo.
Downes, D. & Hansen, K. (2006)“Welfare and Punishment in Comparative Perspective”. In Perspectives on Punishment: The Contours of Control, edited by Armstrong and McAra. Oxford: Oxford University Press: 133-154.

63
Downes, D. & Swaaningen R.,(2007)“The Road to Dystopia? Changes in the Penal Climate of the Netherlands”. “. In Vol. 35 of Crime and Justice: A Review of Research, edited by Michael Tonry. Chicago: The University of Chicago Press: 31-72.
Falck, S., von Hofer, H. and Storgaard, A. (2003)Nordic Criminal Statistics 1950-2000. Department of Criminology. Stockholm University. Report 2003:3.
Garland, D. (2001)The Culture of Control. Crime and Social Order in Contemporary Society. The University of Chicago Press.
Greenberg, D. (1999)“Punishment, Division of Labor, and Social Solidarity.” In The Criminology of Criminal Law, Advances in Criminological Theory, vol. 8, edited by William S. Laufer and Freda Adler. Transaction Publishers: 283 361.
Hofer, H. von. (2003)“Prison populations as Political Constructs: The Case of Finland, Holland and Sweden”. Journal of Scandinavian Studies in Criminology and Crime Prevention, vol. 4: 21 38.
Johnson, D. (2008)“Japanese Punishment in Comparative Perspective”. Japanese Journal of Sociological Criminology, no 33/2008:46-66.
Killias, M. (1986)“Power Concentration, Legitimation Crisis and Penal Severity: A Comparative Perspective.” In International Annals of Criminology, vol. 24: 181 211.
Lacey N. (2008)The Prisoners' Dilemma. Political Economy and Punishment in Contemporary Democracies. The Hamlyn Lectures 2007. Cambridge University Press. 2008.
Lappi-Seppälä, T. (2001)“Sentencing and Punishment in Finland: The Decline of the Repressive Ideal”. In Punishment and Penal Systems in Western Countries, edited by M. Tonry and R. Frase. New York: Oxford University Press: 92-150.
Lappi-Seppälä, T. (2007)“Penal Policy in Scandinavia”. In Vol. 36 of Crime and Justice: A Review of Research, edited by Michael Tonry. Chicago: The University of Chicago Press: 217-296.
Lappi-Seppälä, T. (2008a)“Trust, Welfare, and Political Culture: Explaining Diff erence in National Penal Policies”. In Vol. 37 of Crime and Justice: A Review of Research, edited by Michael Tonry. Chicago: The University of Chicago Press: 313-387.
Lijphart, A. (1999)Patterns of Democracy. Government Forms and Performance in Thirty-six Countries. New Haven / London: Yale University Press.
Mayhew, P. & van Kesteren, J. (2002)“Cross-national attitudes to punishment.” In Changing Attitudes to Punishment. Public opinion, crime
and justice, edited by Julian V. Roberts and Mike Hough. Willan Publishing: 63 92.
Pratt, J. (2008)“Scandinavian Exceptionalism in an Era of Penal Excess: Part I: The nature and Roots of Scandinavian Exceptionalism”. The British Journal of Criminology. 48: 119-137.
Pratt, J. & Clark, M. (2005)“Penal populism in New Zealand.” Punishment & Society. The International Journal of Penology, vol. 7. No. 3. Sage Publications: 303 322.
Roberts, J., Stalans, L., Indermaur, D. and Hough M. (2003)Penal Populism and Public Opinion. Lessons from fi ve countries. Oxford: Oxford University Press.
Snacken, S. (2008)“Penal Policy and Practice in Belgium”. In Vol. 36 of Crime and Justice: A Review of Research, edited

64
by Michael Tonry. Chicago: The University of Chicago Press: 127-216.Sutton, J. (2004)“The Political Economy of Imprisonment in Affl uent Western Democracies 1960-1990.” American Sociological Review. 2004. Vol 69: 170-189.
Tham, H. (2001)“Law and order as a leftist project? .” Punishment & Society. The International Journal of Penology, vol. 3. No. 3. Sage Publications: 409 426.
Tonry, M. (2004)Thinking about Crime. Sense and sensibilities in American penal culture. Oxford University Press 2004.
Tonry, M. (2007)“Determinants of Penal Policies”. In Vol. 36 of Crime and Justice: A Review of Research, edited by Michael Tonry. Chicago: The University of Chicago Press: 1-48.
Tyler, T. (2003)Procedural Justice, Legitimacy, and the Eff ective Rule of Law.“ In Crime and Justice. A Review of Research, edited by Michael Tonry, vol. 30. Chicago: The University of Chicago Press: 283-357.
van Dijk J., van Kesteren J. and Smit P. (2007)Criminal Victimisation in International Perspective. Key Findings from the 2004-2005 ICVS and EU ICS. WODC 257/2007.
van Dijk J. (2008)The World of Crime. Breaking the Silence on Problems of security, Justice, and Development Across the World. Sage Publications.
Zimring, F., Hawkins G., and Kamin, S. (2001)Punishment and Democracy. Three Strikes and You're out in California. Oxford Unversity Press. Oxford.
Zimring, F. and Johnson, D. (2006).“Public Opinion and the Governance of Punishment in Democratic Political Systems.” The ANNALS of the American Academy of Political and Social Science 6005, May 2006: 266-280.