cardiovascular responses to ingestion of energy drinks drinks degree project ... title:...
TRANSCRIPT

1
Cardiovascular Responses to Ingestion of
Energy Drinks
Degree project thesis in Medicine
Niklas Odén
Supervisor: Kai Knudsen
Department of Anesthesiology and Intensive Care
The Sahlgrenska Academy
Programme in Medicine
Gothenburg, Sweden 2015

2
Contents
Abstract ............................................................................................................................. 3
Introduction ....................................................................................................................... 5
Aim ............................................................................................................................... 8
Methods ............................................................................................................................ 8
ED after physical exercise ............................................................................................ 8
Comparison between ED and caffeine supplementation ............................................ 10
Ethical considerations ................................................................................................. 12
Data analysis ............................................................................................................... 13
Statistical methods ...................................................................................................... 14
Results ............................................................................................................................. 15
ED after physical exercise .......................................................................................... 15
Comparison between ED and caffeine supplementation ............................................ 24
Discussion ....................................................................................................................... 37
Limitations .................................................................................................................. 40
Conclusions and Implications ..................................................................................... 41
Populärvetenskaplig sammanfattning ............................................................................. 42
References ....................................................................................................................... 44

3
Abstract
Niklas Odén. Master thesis, Programme in Medicine, University of Gothenburg, 2015.
Title: Cardiovascular Responses to Ingestion of Energy Drinks
Background: The popularity of caffeinated energy drinks (ED) has increased rapidly. A
number of cases have been reported where severe cardiac manifestations have occurred
following their use. It has been speculated whether if it is the high caffeine content or any of
the other active ingredients, such as taurine, that is responsible for these effects.
Aims: Investigate the hemodynamic response following ingestion of energy drinks during
inactivity and physical exercise. Heart rate, saturation, blood pressure, heart rate variability,
echocardiography and ECG are the parameters used to describe this response.
Methods: This project consists of two different studies, both with a cross-over arrangement.
In the first study, heart rate, oxygen saturation, blood pressure and heart rate variability were
examined after two identical workouts where either 500 ml of energy drinks or sports drinks
(SD) were ingested afterwards. The other study focused on the differences in heart rate, blood
pressure, ECG and echocardiography between consumption of ED and caffeine
supplementation.
Results: Following statistically significant differences were found: Post-exercise systolic
blood pressure was increased by 10.0 mmHg 60 minutes after ingestion of ED compared to
SD (P=0.002). Post-exercise mean arterial pressure was increased by 4.3 mmHg at 30 minutes
(P=0.02) and by 7.7 mmHg 60 minutes after ingestion of ED (P=0.007).

4
Conclusions: Consumption of energy drinks after a physical exercise results in a significant
increase of systolic blood pressure and mean arterial pressure. Post-exercise heart rate
variability and heart rate recovery are a not altered by the ingestion. Statistically significant
differences between intake of ED and caffeine supplementation in heart rate, blood pressure,
ECG or echocardiography are not proved.
Key words: Energy drinks · Caffeine · Taurine · Heart rate · Blood pressure · Heart rate
variability · ECG · Echocardiography

5
Introduction
Energy drinks (ED) are referred as a group of beverages which contain a considerable
amount of caffeine, along with additional active metabolites and other ingredients such as
minerals and vitamins. Since their introduction to the European market during the 1990s, the
popularity of the drinks has increased rapidly. A report published by the European Food
Safety Authority in 2013 concluded that approximately 30% of the adults (18 - 65 years) and
68% of the adolescents (10 - 18 years) interviewed had consumed ED at least once during the
last year (1)
. Red Bull® (RB), the company holding the largest share of the market(2)
, is
distributing a variety of energy drinks all containing caffeine, taurine and glucuronolactone.
Their products are promoted as enhancing the well-being, performance ability and reactivity
of the user (3)
. Thus they are often ingested in conjunction with physical exercise.
Concerns have been raised that ED consumption may result in severe effects on the
health, especially the cardiovascular system. For instance, three inexplicable deaths have
occurred in Sweden where RB combined with alcohol had been ingested within hours before
time of death (4)
. Adverse effects such as palpitations, tachycardia, tremor, headaches,
agitation and insomnia have been reported following their use(5)
. Due to the popularity of
drinks among adolescents, otherwise unusual cardiac manifestations have been observed in
this age category(6)
. After excessive consumption of ED, a 14-year-old boy experienced acute
atrial fibrillation during a running race(7)
and two adolescents suffered from ST-elevation
myocardial infarction(8, 9)
.
The biochemical mechanisms of taurine and glucuronolactone have not been fully
clarified and neither has their potential interaction with caffeine. Studies suggest that taurine,
a semi-essential amino acid, exerts a variety of functions in the human body, where one of its
roles is regulation of the intracellular concentration of Ca2+
in myocytes. Taurine acts as a

6
normalizer of the Ca2+
levels, preventing it from being too low or high. Hence taurine will
increase the inotropy of heart when the contractility is low(10)
. Other functions of the amino
acid involve intracellular osmoregulation, anti-inflammatory activity and neuromodulation as
a GABA receptor agonist(11-13)
. Glucuronolactone is a normal human metabolite derived from
glucose. It is considered unlikely that glucuronolactone influences the mechanisms of the
other ingredients in ED(14)
. The most researched component is caffeine, which among others
acts as an adenosine receptor antagonist and thereby increasing the plasma levels of
epinephrine, norepinephrine and renin(15)
. In 2003 The European Union’s Scientific
Committee on Food published a report summarizing the possible interactions of the
ingredients in ED, where they noted that the field had not been sufficiently examined.
Therefore they could not dismiss that taurine modulates the effects of caffeine(16)
.
Since the 2003 report, the cardiovascular responses to ED consumption have been
investigated more extensively, although the results are somewhat inconclusive. Regarding
blood pressure, a number of studies have shown that blood pressure increases after ED
ingestion(17-21)
, whereas others failed to confirm such correlation(22, 23)
. Grasser et al.
concluded in 2013 that RB consumption resulted in “an overall negative hemodynamic profile
[…], in particular an elevated blood pressure and double product and a lower cerebral blood
flow velocity”(18)
. Significant increase in blood pressure was also found by Worthley et al. in
healthy young adults following ingestion of one can of sugar-free ED. Furthermore they
detected platelet hyperaggregability and decreased endothelial function, consequently
increasing the risk of a thrombotic event(19)
.
Due to the popularity of consuming the drinks in conjunction with physical exercise(1)
,
and the advertising encouraging such usage(3)
, examining the hemodynamic effects during this
combination is highly relevant. So far two studies with different approaches have been

7
published in the field. In 2001 Baum & Weiss compared myocardial contractile capacity in a
double blind crossover study. Athletes drank either #1 an original R B, #2 a RB preparation
lacking taurine and glucuronolactone or #3 a RB preparation lacking caffeine, taurine and
glucuronolactone and then performed a workout. The major conclusion was that stroke
volume and fractional shortening were elevated after exercise when the participants had drunk
preparation #1, an original Red Bull(22)
. The other study published by Wiklund et al. found
that ingestion of 750 ml ED before exercise caused prolonged heart rate recovery and
decreased heart rate variability after the workout. What is more this impact was enhanced
when ED was combined with alcohol(24)
.
Heart rate variability (HRV) is the endogenous ability of the heart to alter its pace
between two adjacent heartbeats. The superior control over the variability is exerted by the
cardiovascular regulation center in the medulla, which communicates with the heart through
the sympathetic (SNS) and the parasympathetic nervous systems (PNS). During sympathetic
domination HRV is diminished, whereas HRV increases while PNS (the vagal nerve) is more
active. Hence HRV can be used as a quantitative measurement of autonomic balance.
Evidence exists that depressed vagal activity can provoke cardiac arrhythmias(25, 26)
.
Prolonged retrieval of the heart rate, named heart rate recovery (HRR), after physical exercise
is also considered as a sign of imbalance in the autonomic nervous system. Moreover
extended HRR has been proven to be a powerful predictor of mortality(27)
.
Inspired by former studies we decided to arrange two of the similar kind where the
cardiovascular reaction to ED ingestion was examined. The first study focused on ED
consumption combined with physical exercise, while the latter investigated the difference
between ED and caffeine supplementation. Following hypotheses were assumed:

8
Heart rate variability decreases, heart rate recovery is prolonged and blood
pressure is elevated when energy drinks are ingested after a physical exercise.
Consumption of energy drinks results in greater increase of blood pressure and
heart rate and prolongation of the ECG intervals QTc, PQ and QRS than equal
amount of caffeine through supplementation would induce.
Aim
The overall aim of the study is to establish an extended knowledge about the
hemodynamic response following ingestion of energy drinks during inactivity and physical
exercise. Heart rate, saturation, blood pressure, heart rate variability, echocardiography and
ECG are the parameters used to describe this response.
Methods
In order to validate our hypotheses two cross-over studies were designed. These were
named ED after physical exercise and Comparison between ED and caffeine supplementation.
Methods and results are presented separately for each study.
ED after physical exercise
Fifteen healthy adults were recruited from Sahlgrenska Academy student population and
staff at Sahlgrenska Universitetssjukhuset. Inclusion criteria were age between 20 – 60,
absence from cardiovascular disease and prescribed medication, not drinking more than three
cups of coffee or three energy drinks per day. Each subject answered a questionnaire
containing age, sex, length, weight, amount of regular exercising and usage of coffee, energy
drinks and caffeine supplementation. One can of ED and one cup of coffee was estimated to

9
contain 80 mg caffeine each, and the daily intake of caffeine was calculated. The results of the
questionnaire are summarized in table 1.
Table 1. Demographic characteristics of subjects completing the study.
Women Men
(n = 7) (n = 8)
Characteristic
Age [years] 32.9 (16.9) 33.3 (11.5)
Height [cm] 169.0 (5.2) 182.6 (6.8)
Weight [kg] 63.6 (3.8) 83.0 (12.0)
BMI [kg/m2] 22.4 (2.4) 25.0 (4.3)
Caffeine intake [mg/day] 202.4 (80.7) 215.9 (150.5)
Exercise amount [workouts/week] 4.1 (1.6) 4.3 (2.3)
Values are reported as mean (standard deviation).
The study consisted of two experimental sessions in a single-blinded cross-over manner.
All subjects abstained from caffeinated products 24 hours before the tests, which occurred
within an interval of two weeks. The sessions were held at the same fitness center using the
same equipment both times. A spinning workout at intermediate intensity lasting 45 minutes
was performed during each session. The workouts were held by the same leader directing the
same instructions in order to ensure equality in the intensity. Immediately after the exercise
the subjects ingested the drink they had been instructed to consume, either 500 ml of drink A
(non caffeinated sports drink which served as control) or 500 ml of drink B (energy drink).
Table 2 lists the contents of the drinks.
Table 2. Characteristics of drinks used in the study.
B - Energy drink A - Sports drink
(Effector) (Control)
Characteristic
Name Red Bull Sugarfree Powerade Passionfruit
Manufacturer Red Bull GmbH The Coca-Cola Company
Caloric content [per 100 ml] 3 kcal 16 kcal
Ingridients [per 100 ml]
Taurine (400 mg) Glucoronolactone (240 mg)
Vitamin B3 (8 mg) Vitamin B5 (2 mg) Vitamin B6 (2 mg) Vitamin B12 (2 µg)
Sodium (50 mg) Potassium (12.5 mg)
Calcium (3.5 mg) Magnesium (0.9 mg)
Caffeine [per 100 ml] 32 mg 0 mg
Volume served 500 ml 500 ml

10
In the second session the participants consumed the drink they did not ingest in the
former. The order of the drinks was randomized and arranged so one half of the subjects
drank A and the other drank B the in the first test. Both drinks had a resembling appearance
and were served in plastic cups marked “A” or “B”. The sugar free version of Red Bull was
chosen since its caloric content best corresponds with that of Powerade. When the drinks had
been consumed the participants remained resting in the facility for over an hour, although they
were not prohibited from moving around or eating non caffeinated products.
Measurements of heart rate (HR), oxygen saturation (POX), systolic (SBP) and diastolic
blood pressure (DBP) were made in rest before the exercise had started, instantly after the
exercise was ended, 30 and 60 minutes after the drinks were ingested. Philips IntelliVue X2
was the instrument used for these controls. Blood pressure was measured by a
sphygmomanometer on the right arm. All subjects wore an individual pulse watch connected
to a screen throughout the exercise and the resting period. The screen, showing the current
heart rate of the participants, was photographed before the exercise, at the maximum intensity
of the exercise, immediately when the exercise ended and then every five minutes during the
resting period lasting 65 minutes after the drinks were ingested. Five subjects were chosen to
wear a HRV recorder (eMotion Faros, Mega Electronics Ltd) during each workout, and
removed those 150 minutes after the intake of drinks.
Comparison between ED and caffeine supplementation
Ten healthy adults were recruited from Sahlgrenska Academy student population and
staff at Sahlgrenska Universitetssjukhuset. The same inclusion criteria as in ED after physical
were applied and the participants were given a similar questionnaire. Table 3 summarizes the
outcome.

11
Table 3. Demographic characteristics of subjects completing the study.
Women Men
(n = 7) (n = 3)
Characteristic Age [years] 38.1 (18.1) 24.3 (1.2) Height [cm] 166.3 (5.9) 188.0 (6.2) Weight [kg] 62.0 (4.5) 86.7 (5.8) BMI [kg/m
2] 22.5 (1.8) 24.6 (2.7)
Caffeine intake [mg/day] 195.9 (138.2) 186.7 (166.5)
Values are reported as means (standard deviation).
This study consisted of two cross-over experimental sessions as well, although not
blinded. The participants were instructed to refrain from caffeinated products 24 hours before
each trial. Three cans of 250 ml Red Bull containing totally 240 mg caffeine or two and a half
tablets of 100 mg caffeine supplementation (totally 250 mg caffeine) were handed to the
subjects after arrival. Half of the group drank Red Bull the first session whereas the other
ingested caffeine supplementation, and in the second session the exposure was shifted. The
treatment with caffeine supplementation contained 10 mg caffeine more than the amount
given through Red Bull, since the tablets were formed with a notch making it possible to split
in half. A sufficiently accurate scale was not available to make the amount of caffeine in the
treatments correspond precisely. Table 4 comprises detailed information about the products.
Table 4. Characteristics of products used in the study.
Energy drink Caffeine supplementation
Characteristic
Name Red Bull Koffein Apofri
Manufacturer Red Bull GmbH Apofri AB
Caloric content [per 100ml] 46 kcal -
Ingridients [per 100 ml]
Taurine (400 mg) Glucoronolactone (240 mg)
Vitamin B3 (8 mg) Vitamin B5 (2 mg) Vitamin B6 (2 mg) Vitamin B12 (2 µg)
-
Caffeine 32 mg/100 ml 100 mg/unit
Amount served 750 ml 2.5 units
Amount caffeine served 240 mg 250 mg

12
After intake the participants mostly remained in a sitting position for 90 minutes, but
were allowed to move around, go to the toilet or eat non caffeinated products.
Heart rate, systolic and diastolic blood pressure were measured in rest before ingestion
and 30, 60 and 90 minutes after intake. Philips IntelliVue X2 was the instrument used for
these controls and blood pressure was measured by a sphygmomanometer on the right arm.
Electrocardiography (ECG) with 12 leads was taken (with Cardiolex EC Sense Rest ECG
Uni-cart) before consumption and 60 minutes afterwards. The durations of the QTc-, PQ- and
QRS-intervals were analyzed by the ECG-device and reported on the printouts. The day after
each session the subjects filled out a questionnaire regarding experienced adverse effects and
estimated sleep quality from 1 - 5 the night after the trial, where 1 was “no sleep at all” and 5
was “perfect sleep”. During the first session a physician examined eight participants with
echocardiography (with GE Healthcare Vivid E9 cardiovascular ultrasound system) before
intake and then 60 minutes after ingestion. Stroke volume, cardiac output and left ventricular
strain were measured. Following clinical routine was applied in the examination: 2,3,4-
chamber frames and pulsed Doppler were used in left ventricular outflow tract (LVOT).
Stroke volume (SV) and cardiac output (CO) were calculated from velocity time integral
(VTI) in LVOT and LVOT area: . Global left ventricular
strain was calculated with speckel tracking echocardiography in 4,3,2-chamber frames.
However echocardiographic examination was not possible the second session, hence cross-
over comparison did not occur.
Ethical considerations
Application of formal ethical permission was not submitted to the local ethical
committee of Gothenburg University since a degree project thesis is not included in their
regulation(28)
. The head of the Department of Anesthesiology and Intensive Care at

13
Sahlgrenska Universitetssjukhuset approved the study protocol. Description of methods and
potential adverse effects were declared to subjects, who gave informed consent. Contact
information of the persons responsible for the studies was handed to the subjects. All tests
were supervised by a physician. The studies were designed to minimize the risk of
participants experiencing adverse effects. The amount of caffeine consumed did not exceed
the recommendations for maximum of daily intake(29)
. Energy drinks were ingested when the
workout was ended and not before or during the exercise to avoid the risk of cardiac
arrhythmias(6)
.
Data analysis
Mean arterial pressure (MAP) was calculated by using the formula:
Analysis of HRV was made with Kubios HRV/MATLAB (The MathWorks, Inc.).
Artifact correction was applied at medium level and the length of the samples was chosen to 5
minutes. The standard deviation of the NN intervals (SDNN) was the variable selected to
present HRV, since it was the variable appearing to contain least disturbances in our data.
Delta values were calculated at every measuring point by subtracting the “non-ED-
value” from the “ED-value” for each subject.
∆x min post intake = ED x min post intake – NON-ED x min post intake
In order to demonstrate the progression of the parameters, quotients for every measuring
point were calculated where the baseline value was set as denominator. In “ED after physical
exercise” baseline is in this regard referred as the measuring point immediately after the
workout was ended, whereas in “Comparison between ED and caffeine supplementation”

14
baseline is the value before ingestion. The quotients were then multiplied by 100 to be
presented in percentage.
Statistical methods
All values are reported as mean (standard deviation). Statistical analysis was performed
by the nonparametric alternative Wilcoxon matched pair test, due to the distribution of the
data and the restricted number of subjects participating in the studies. Each “ED-value” was
compared with the “non-ED-value” representing the same time. Since echocardiographic
measurements only occurred one session, cross-over testing for these variables was not
possible. Instead, the values before intake were compared with the values after intake.
Significance was defined as a P-value < 0.05 (two-sided).

15
Results
ED after physical exercise
Heart rate, blood pressure and oxygen saturation
Table 5 shows heart rate, blood pressure and saturation at the different measuring points
with mean differences and P-values included.
Table 5. Results of measurements in heart rate, blood pressure and oxygen saturation.
ED SD Mean difference P-Value
HR [beats/min] Before exercise 71.8 (17.6) 70.7 (15.9) -0.6 (7.4) 0.94
After exercise, before drink 100.9 (10.2) 106.4 (15.4) -6.3 (10.7) 0.01* 30 min post drink 78.8 (13.9) 78.8 (14.5) -1.4 (10.0) 0.57 60 min post drink 76.8 (15.5) 73.4 (13.8) 1.1 (13.0) 0.89
SBP [mmHg] Before exercise 131.1 (11.6) 127.0 (14.9) 2.9 (14.5) 0.50
After exercise, before drink 124.7 (9.4) 123.4 (11.5) 2.0 (7.5) 0.26 30 min post drink 122.9 (14.5) 117.8 (15.4) 3.8 (10.4) 0.23 60 min post drink 127 15.6) 117.4 (13.0) 10.0 (10.9) 0.002*
DBP [mmHg] Before exercise 77.6 (13.1) 75.6 (12.1) 1.7 (10.0) 0.84
After exercise, before drink 77.8 (11.8) 73.3 (8.6) 4.7 (9.3) 0.07 30 min post drink 74.8 (12.1) 70.6 (12.3) 4.6 (8.6) 0.11 60 min post drink 74.4 (14.0) 68.4 (9.9) 6.5 (12.5) 0.11
MAP [mmHg] Before exercise 95.4 (10.7) 92.8 (12.4) 2.1 (10.0) 0.61
After exercise, before drink 93.5 (8.8) 90.0 (8.1) 3.8 (8.1) 0.07 30 min post drink 90.9 (10.9) 86.4 (12.1) 4.3 (6.4) 0.02* 60 min post drink 91.9 (10.9) 84.8 (8.0) 7.7 (8.9) 0.007*
POX [%] Before exercise 98.6 (1.1) 98.9 (0.7) -0.1 (1.4) 0.84
After exercise, before drink 97.4 (1.3) 97.3 (1.7) 0.2 (1.9) 0.73 30 min post drink 98.8 (1.2) 98.9 (1.4) -0.1 (1.4) 0.83 60 min post drink 99.2 (1.0) 98.9 (1.5) 0.2 (1.9) 1.0
Values are reported as mean (standard deviation). Statistical significance is marked with *. HR = heart rate, SBP = systolic blood pressure, DBP = diastolic blood pressure, MAP = mean arterial pressure, POX = oxygen saturation, ED = energy drink, SD = sports drink.
Heart rate was significantly higher after exercise (before drink) in the group ingesting
sports drink (mean difference -6.3, P=0.01). 30 and 60 minutes post drink the difference
between the groups decreased (mean difference -1.2 and 1.1, respectively) although not
statistically significant. Heart rate is shown in fig. 1-3 as means, percental progression and
delta-values.

16
Figure 1.
Heart rate quantified with pulse oximeter at the different measuring points. Lines represent means of the groups. ED = energy drink, SD =
sports drink, HR = heart rate.
Figure 2.
The mean percental development of heart rate after ingestion of ED or SD. Measured value before intake was set as baseline and 100%. The
following values were divided by baseline value and multiplied by 100 to be presented in %. ED = energy drink, SD = sports drink.
6065707580859095
100105110115
Beforeexercise
Exerciseending
30 min postdrink
60 min postdrink
HR
[b
eat
s/m
in]
Heart rate (pulse oximeter)
ED
SD
60
65
70
75
80
85
90
95
100
Exercise ending 30 min post drink 60 min post drink
Pe
rce
nt
Heart rate (%)
ED
SD

17
Figure 3.
Box plot presenting the individual differences in heart rate before and after the exposures.
Bold line = median, Box = lower and upper quartile, Whiskers = smallest and largest observation, Circles = outliers.
Delta = “ED-value” – “SD-value” at the same measuring point for each subject. ED = energy drink, SD = sports drink, HR = Heart rate.
No significant difference in the systolic blood pressure appeared after exercise between
the groups. 60 minutes after ingestion a statistically significant difference was found where
the SBP were 10.0 higher in the group consuming ED (P=0.002). Systolic blood pressure is
shown in fig. 4-6 as means, percental progression and delta-values.
Figure 4.
SBP quantified with sphygmomanometer at the different measuring points. Lines represent means of the groups.
ED = energy drink, SD = sports drink, SBP = systolic blood pressure.
110
115
120
125
130
135
Beforeexercise
Exerciseending
30 min postdrink
60 min postdrink
SBP
[m
mH
g]
Systolic blood pressure
ED
SD

18
Figure 5.
The mean percental development of systolic blood pressure after ingestion of ED or SD. Measured value before intake was set as baseline
and 100%. The following values were divided by baseline value and multiplied by 100 to be presented in %.
ED = energy drink, SD = sports drink.
Figure 6.
Box plot presenting the individual differences in SBP before and after the exposures.
Bold line = median, Box = lower and upper quartile, Whiskers = smallest and largest observation, Circles = outliers.
Delta = “ED-value” – “SD-value” at the same measuring point for each subject. ED = energy drink, SD = sports drink, SBP = systolic blood
pressure.
Measurements in diastolic blood pressure resulted in no significant differences. 60
minutes post drink the DBP is 6.5 mmHg higher in the ED-group, although not statistically
significant. Diastolic blood pressure is shown in fig. 7-9 as means, percental progression and
delta-values.
90
92
94
96
98
100
102
Exercise ending 30 min post drink 60 min post drink
Pe
rce
nt
Systolic blood pressure (%)
ED
SD

19
Figure 7.
DBP quantified with sphygmomanometer at the different measuring points. Lines represent means of the groups.
ED = energy drink, SD = sports drink, DBP = diastolic blood pressure.
Figure 8.
The mean percental development of diastolic blood pressure after ingestion of ED or SD. Measured value before intake was set as baseline
and 100%. The following values were divided by baseline value and multiplied by 100 to be presented in %.
ED = energy drink, SD = sports drink.
Figure 9.
Box plot presenting the individual differences in DBP before and after the exposures.
Bold line = median, Box = lower and upper quartile, Whiskers = smallest and largest observation, Circles = outliers.
Delta = “ED-value” – “SD-value” at the same measuring point for each subject. ED = energy drink, SD = sports drink, DBP = diastolic blood pressure.
60
65
70
75
80
Beforeexercise
Exerciseending
30 min postdrink
60 min postdrink
DB
P [
mm
Hg]
Diastolic blood pressure
ED
SD
88
90
92
94
96
98
100
102
Exercise ending 30 min post drink60 min post drink
Pe
rce
nt
Diastolic blood pressure (%)
ED
SD

20
No significant difference in the mean arterial pressure appeared after exercise between
the groups. 30 minutes post intake MAP was significantly higher in the ED-group (mean
difference 4.3, P=0.02). At 60 minutes post intake the mean difference had increased to 7.7
(P=0.007). Mean arterial pressure is shown in fig. 10-12 as means, percental progression and
delta-values.
Figure 10.
MAP at the different measuring points. Lines represent means of the groups.
ED = energy drink, SD = sports drink, MAP = mean arterial pressure.
Figure 11.
The mean percental development of mean arterial pressure after ingestion of ED or SD. Measured value before intake was set as baseline and
100%. The following values were divided by baseline value and multiplied by 100 to be presented in %.
ED = energy drink, SD = sports drink.
7880828486889092949698
Beforeexercise
Exerciseending
30 min postdrink
60 min postdrink
MA
P [
mm
Hg]
Mean arterial pressure
ED
SD
90
92
94
96
98
100
102
Exercise ending 30 min post drink 60 min post drink
Pe
rce
nt
Mean arterial pressure (%)
ED
SD

21
Figure 12.
Box plot presenting the individual differences in MAP before and after the exposures.
Bold line = median, Box = lower and upper quartile, Whiskers = smallest and largest observation, Circles = outliers.
Delta = “ED-value” – “SD-value” at the same measuring point for each subject. ED = energy drink, SD = sports drink, MAP = mean arterial pressure.
Oxygen saturation decreased slightly after exercise, but was not affected by ingestion of
ED. Saturation is shown in fig. 13 as means.
Figure 13.
Oxygen saturation quantified with pulse oximeter at the different measuring points. Lines represent means of the groups.
ED = energy drink, SD = sports drink.
Post-exercise heart rate recovery
Table 6 shows heart rate measured by individual pulse watches. Mean differences and
P-values are included.
96
97
98
99
100
Beforeexercise
Exerciseending
30 min postdrink
60 min postdrink
Pe
rce
nt
Oxygen saturation
ED
SD

22
Table 6. Results of measurements in heart rate from individual pulse watches.
Min after ingestion -60 -30 -15 0 5 10 15 20
ED 103.4 (28.8) 165.5 (10.3) 132.4 (13.0) 98.7 (11.4) 94.0 (10.6) 90.5 (14.5) 84.1 (9.5) 87.2 (14.2)
SD 99.2 (25.0) 165.4 (9.8) 134.7 (14.7) 95.3 (9.4) 88.4 (11.9) 84.3 (14.5) 82.9 (12.8) 83.8 (11.1)
Mean differance 0.9 (39.5) -0.9 (7.4) -3.2 (11.0) 3.3 (15.3) 4.6 (12.0) 3.9 (15.1) -1.7 (11.4) 0.7 (11.7)
P-Value 0.85 0.59 0.28 0.42 0.19 0.69 0.47 0.53
Min after ingestion 25 30 35 40 45 55 60 65
ED 86.8 (20.6) 80.4 (14.0) 82.3 (13.4) 76.6 (13.8) 77.8 (11.4) 78.1 (10.8) 78.4 (13.6) 75.9 (13.1)
SD 83.8 (11.1) 78.9 (12.0) 81.9 (11.4) 81.4 (12.3) 80.9 (11.1) 79.3 (13.8) 78.8 (13.9) 80.1 (13.9)
Mean differance 2.3 (19.0) -1.5 (13.4) -1.9 (11.3) -7.2 (10.4) -6.5 (11.8) -2.9 (16.9) -2.8 (12.5) -6.5 (14.7)
P-Value 0.73 0.37 0.71 0.02* 0.04* 0.26 0.38 0.17
Values represent heart rate (beats/min) and are reported as mean (standard deviation). Statistical significance is marked with *. ED = energy drink, SD = sports drink.
Statistically significance was found at 40 and 45 minutes after intake where the heart
rate was respectively 7.2 and 6.5 higher in the group consuming sports drink (P=0.02 and
0.04). Post-exercise heart rate recovery was not prolonged after consumption of ED. Fig. 14
shows means of the heart rate from pulse watches.
Figure 14.
Heart rate quantified with pulse watch at the different measuring points. Lines represent means of the groups.
ED = energy drink, SD = sports drink, HR = heart rate.
60708090
100110120130140150160170180
-60 -30 -15 0 5 10 15 20 25 30 35 40 45 55 60 65
HR
[b
eat
s/m
in]
Minutes after ingestion of drinks
Heart rate (pulse watch)
ED
SD
Drinks ingested

23
Heart rate variability
Five participants were given a HRV-recorder each session. Two the recorders fell off
during an exercise and further HRV-registration of the affected subjects did not occur that
session. Hence cross-over analysis was not possible for these two subjects and their data was
therefore excluded. Adequate HRV-data was recorded from three participants, which is
presented as SDNN and summarized in table 7.
Table 7. Results of measurements in heart rate variability (SDNN).
Event Before exercise Exercise start Exercise max Exercise finish ED 96.7 (47.8) 43.9 (25.7) 24.2 (16.5) 44.5 (18.1) SD 62.9 (20.9) 52.9 (22.7) 31.6 (20.6) 54.8 (25.7) Mean differance 33.7 (46.9) -9.0 (47.1) -7.4 (37.1) -10.3 (43.3) P-Value 0.50 0.75 0.75 0.75 Min after drink 30 60 90 120 150
ED 51.3 (10.8) 83.0 (41.7) 109.3 (35.1) 61.2 (6.1) 64.5 (4.5)
SD 49.6 (24.6) 107.6 (77.7) 44.4 (11.6) 49.5 (22.3) 50.2 (25.4)
Mean differance 1.7 (25.6) -24.6 (85.5) 64.9 (40.7) 11.7 (16.3) 14.3 (23.2)
P-Value 1.00 1.00 0.25 0.50 0.50
Values represent SDNN (ms) and are reported as mean (standard deviation). Statistical significance is marked with *. SDNN = standard deviation of NN-intervals, ED = energy drink, SD = sports drink.
HRV decreased during exercise but no significant differences were found after the
ingestion of drinks. Fig. 15 show means of SDNN as an expression of HRV.
Figure 15.
Heart rate variability at different measuring points. Lines represent means of the groups.
SDNN = standard deviation of NN-intervals, ED = energy drink, SD = sports drink
020406080
100120
SDN
N (
ms)
SDNN
ED
SD
Drinks ingested Resting period ends

24
Comparison between ED and caffeine supplementation
Heart rate and blood pressure
Table 8 shows heart rate and blood pressure at the different measuring points with mean
differences and P-values included.
Table 8. Results of measurements in heart rate and blood pressure.
ED Caffeine Mean difference P-Value
HR [beats/min]
Before intake 63.2 (10.1) 63.2 (9.5) 0.0 (8.8) 0.86
30 min post intake 62.3 (9.8) 58.4 (7.8) 3.9 (6.2) 0.13
60 min post intake 61.1 (8.2) 59.9 (8.6) 1.2 (5.0) 0.61
90 min post intake 63.6 (8.8) 61.6 (8.0) 2 (7.0) 0.45
SBP [mmHg]
Before intake 125.7 (15.6) 131.0 (16.1) - 5.3 (7.1) 0.04*
30 min post intake 126.5 (11.9) 131.5 (13.4) - 5 (12.5) 0.40
60 min post intake 125.6 (10.0) 126.4 (13.5) - 0.8 (12.9) 0.87
90 min post intake 129.5 (14.1) 125.2 (13.8) 4.3 (8.7) 0.21
DBP [mmHg]
Before intake 68.1 (10.8) 67.6 (13.0) 0.5 (10.9) 0.99
30 min post intake 74.6 (7.5) 75.3 (7.1) - 0.7 (3.9) 0.61
60 min post intake 75.6 (9.3) 72.0 (8.2) 3.6 (7.0) 0.15
90 min post intake 72.0 (8.2) 73.3 (9.6) -1.3 (7.8) 0.60
MAP [mmHg]
Before intake 87.3 (11.0) 88.7 (12.1) -1.4 (8.9) 0.77
30 min post intake 91.9 (7.6) 94.0 (7.2) -1.8 (9.1) 0.29
60 min post intake 92.3 (8.0) 90.1 (9.0) 2.1 (7.4) 0.36
90 min post intake 91.2 (8.1) 91.9 (8.6) -0.8 (5.7) 0.61
Values are reported as mean (standard devation). Statistical significance is marked with *. HR = heart rate, SBP = systolic blood pressure, DBP = diastolic blood pressure, MAP = mean arterial pressure, ED = energy drink.
Concerning heart rate, no significant differences between ED and caffeine were found.
The heart rate remained relatively unchanged during the influence of ED, whereas it
decreased slightly 30 and 60 minutes after ingestion of caffeine. Heart rate is shown in fig.
16-18 as means, percental progression and delta-values.

25
Figure 16.
Heart rate quantified with pulse oximeter at the different measuring points. Lines represent means of the groups.
ED = energy drink, Caffeine = caffeine supplementation, HR = heart rate.
Figure 17.
The mean percental development of heart rate after ingestion of ED or caffeine. Measured value before intake was set as baseline and 100%.
The following values were divided by baseline value and multiplied by 100 to be presented in %. ED = energy drink, Caffeine = Caffeine supplementation.
Figure 18.
Box plot presenting the individual differences in heart rate before and after the exposures.
Bold line = median, Box = lower and upper quartile, Whiskers = smallest and largest observation, Circles = outliers.
Delta = “ED-value” – “Caffeine-value” at the same measuring point for each subject. ED = energy drink, HR = Heart rate.
55565758596061626364
Before intake 30 minutespost intake
60 minutespost intake
90 minutespost intake
HR
[b
eat
s/m
in]
Heart rate
ED
Caffeine
88
90
92
94
96
98
100
102
Before intake 30 minutespost intake
60 minutespost intake
90 minutespost intake
Pe
rce
nt
Heart rate (%)
ED
Caffeine

26
There was a significant difference in systolic blood pressure between the groups before
intake (SBP was 5.3 mmHg higher in caffeine, P=0.04). In ED group systolic blood pressure
increases from 125.7 before intake to 129.5 mmHg post intake, whereas it decreases from
131.0 to 125.2 mmHg in the caffeine group. At 90 minutes post intake the SBP is 4.3 mmHg
higher in the ED group, although the difference is not statistically significant. Systolic blood
pressure is shown in fig. 19-21 as means, percental progression and delta-values.
Figure 19.
SBP quantified with sphygmomanometer at the different measuring points. Lines represent means of the groups.
ED = energy drink, Caffeine = caffeine supplementation, SBP = systolic blood pressure.
Figure 20.
The mean percental development of systolic blood pressure of ED or caffeine. Measured value before intake was set as baseline and 100%.
The following values were divided by baseline value and multiplied by 100 to be presented in %. ED = energy drink, Caffeine = Caffeine supplementation.
122
124
126
128
130
132
Before intake 30 minutespost intake
60 minutespost intake
90 minutespost intake
SBP
[m
mH
g]
Systolic blood pressure
ED
Caffeine
92
94
96
98
100
102
104
Before intake 30 minutespost intake
60 minutespost intake
90 minutespost intake
Pe
rce
nt
Systolic blood pressure (%)
ED
Caffeine
27
Figure 21.
Box plot presenting the individual differences in SBP before and after the exposures.
Bold line = median, Box = lower and upper quartile, Whiskers = smallest and largest observation, Circles = outliers.
Delta = “ED-value” – “Caffeine-value” at the same measuring point for each subject. ED = energy drink, SBP = systolic blood pressure.
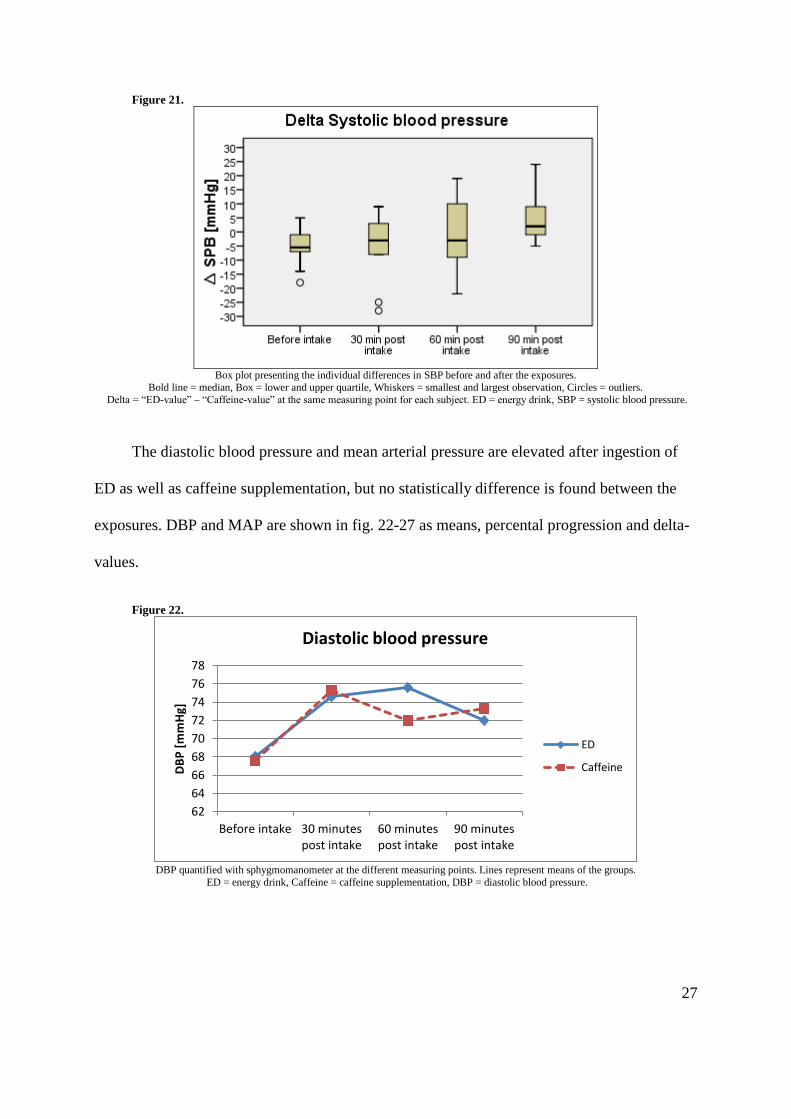
The diastolic blood pressure and mean arterial pressure are elevated after ingestion of
ED as well as caffeine supplementation, but no statistically difference is found between the
exposures. DBP and MAP are shown in fig. 22-27 as means, percental progression and delta-
values.
Figure 22.
DBP quantified with sphygmomanometer at the different measuring points. Lines represent means of the groups.
ED = energy drink, Caffeine = caffeine supplementation, DBP = diastolic blood pressure.
62
64
66
68
70
72
74
76
78
Before intake 30 minutespost intake
60 minutespost intake
90 minutespost intake
DB
P [
mm
Hg]
Diastolic blood pressure
ED
Caffeine

28
Figure 23.
The mean percental development of diastolic blood pressure after ingestion of ED or caffeine. Measured value before intake was set as
baseline and 100%. The following values were divided by baseline value and multiplied by 100 to be presented in %.
ED = energy drink, Caffeine = Caffeine supplementation.
Figure 24.
Box plot presenting the individual differences in DBP before and after the exposures.
Bold line = median, Box = lower and upper quartile, Whiskers = smallest and largest observation, Circles = outliers.
Delta = “ED-value” – “Caffeine-value” at the same measuring point for each subject. ED = energy drink, DBP = diastolic blood pressure.
Figure 25.
MAP at the different measuring points. Lines represent means of the groups.
ED = energy drink, Caffeine = caffeine supplementation, MAP = mean arterial pressure.
90
95
100
105
110
115
120
Before intake 30 minutespost intake
60 minutespost intake
90 minutespost intake
Pe
rce
nt
Diastolic blood pressure (%)
ED
Caffeine
82
84
86
88
90
92
94
96
Before intake 30 minutespost intake
60 minutespost intake
90 minutespost intake
MA
P [
mm
Hg]
Mean arterial pressure
ED
Caffeine

29
Figure 26.
The mean percental development of mean arterial pressure after ingestion of ED or caffeine. Measured value before intake was set as
baseline and 100%. The following values were divided by baseline value and multiplied by 100 to be presented in %.
ED = energy drink, Caffeine = Caffeine supplementation.
Figure 27.
Box plot presenting the individual differences in MAP before and after the exposures.
Bold line = median, Box = lower and upper quartile, Whiskers = smallest and largest observation, Circles = outliers.
Delta = “ED-value” – “Caffeine-value” at the same measuring point for each subject. ED = energy drink, MAP = mean arterial pressure.
Electrocardiography
The ECG of two participants in the ED group and one participant in the caffeine group
was not registered before intake due to technical issues. Their data was not included in
calculation of delta values before intake or percental progression. Table 9 shows QRS
duration, QTc- and PQ-interval at the different measuring points, with mean differences and
P-values included.
96
98
100
102
104
106
108
110
Before intake 30 minutespost intake
60 minutespost intake
90 minutespost intake
Pe
rce
nt
Mean arterial pressure (%)
ED
Caffeine

30
Table 9. Results of measurements in electrocardiography.
ED Caffeine Mean difference P-Value
QTc [ms]
Before intake 415.5 (27.8) 409.2 (23.7) 4.9 (15.4) 0.47
60 min post intake 409.7 (25.5) 409.2 (20.7) 0.5 (10.4) 1.00
PQ [ms]
Before intake 162.3 (21.2) 158.9 (21.3) 6.6 (19.9) 0.63
60 min post intake 169.6 (25.5) 169.4 (23.6) 0.2 (14.3) 0.79
QRS [ms]
Before intake 95.3 (12.4) 94.0 (9.4) 2.6 (5.5) 0.38
60 min post intake 95.8 (10.0) 94.6 (9.9) 1.2 (2.3) 0.22
Values are reported as mean (standard deviation). Statistical significance is marked with *. ED = energy drink.
Measurements of the ECG-variables did not result in any statistically significant
differences between consumption of ED and caffeine supplementation. Before intake, there
was a mean difference of 4.9 ms (higher in the ED group, although not significant P=0.47) in
the QTc-interval, which disappeared 60 minutes after ingestion (mean difference 0.5 P=1.0).
Similar tendency appeared in the PQ-interval where it was 6.6 ms higher in the ED group
before intake, whereas the difference decreased to 0.2 ms 60 minutes after intake (P=0.79).
The QRS-duration remained relatively unchanged in both groups after intake with no
significant difference between them. QRS-duration, QTc- and PQ-intervals are shown in
figure 28-36 as means, percental progression and delta-values.
Figure 28.
QTc-interval at the different measuring points. Lines represent means of the groups.
ED = energy drink, Caffeine = caffeine supplementation.
406
408
410
412
414
416
Before intake 60 minutes post intake
QTc
[m
s]
QTc-interval
ED
Caffeine

31
Figure 29.
The mean percental development of QTc-interval after ingestion of ED or caffeine. Measured value before intake was set as baseline and
100%. The following value was divided by baseline value and multiplied by 100 to be presented in %.
ED = energy drink, Caffeine = Caffeine supplementation.
Figure 30.
Box plot presenting the individual differences in QTC-interval before and after the exposures.
Bold line = median, Box = lower and upper quartile, Whiskers = smallest and largest observation, Circles = outliers.
Delta = “ED-value” – “Caffeine-value” at the same measuring point for each subject. ED = energy drink.
Figure 31.
PQ-interval at the different measuring points. Lines represent means of the groups.
ED = energy drink, Caffeine = caffeine supplementation.
9999,299,499,699,8100
100,2100,4100,6100,8
101
Before intake 60 minutes post intake
Pe
rce
nt
QTc-interval (%)
ED
Caffeine
150
155
160
165
170
175
Before intake 60 minutes post intake
PQ
[m
s]
PQ-interval
ED
Caffeine

32
Figure 32.
The mean percental development of PQ-interval after ingestion of ED or caffeine. Measured value before intake was set as baseline and
100%. The following value was divided by baseline value and multiplied by 100 to be presented in %.
ED = energy drink, Caffeine = Caffeine supplementation.
Figure 33.
Box plot presenting the individual differences in PQ-interval before and after the exposures.
Bold line = median, Box = lower and upper quartile, Whiskers = smallest and largest observation, Circles = outliers.
Delta = “ED-value” – “Caffeine-value” at the same measuring point for each subject. ED = energy drink.
Figure 34.
QRS-duration at the different measuring points. Lines represent means of the groups.
ED = energy drink, Caffeine = caffeine supplementation.
96
98
100
102
104
106
108
Before intake 60 minutes post intake
Pe
rce
nt
PQ-interval (%)
ED
Caffeine
93
93,5
94
94,5
95
95,5
96
Before intake 60 minutes post intake
QR
S [m
s]
QRS-duration
ED
Caffeine

33
Figure 35.
The mean percental development of QRS-duration after ingestion of ED or caffeine. Measured value before intake was set as baseline and
100%. The following value was divided by baseline value and multiplied by 100 to be presented in %. ED = energy drink, Caffeine = Caffeine supplementation.
Figure 36.
Box plot presenting the individual differences in QRS-duration before and after the exposures. Bold line = median, Box = lower and upper quartile, Whiskers = smallest and largest observation, Circles = outliers.
Delta = “ED-value” – “Caffeine-value” at the same measuring point for each subject. ED = energy drink.
Echocardiography
Measurements in echocardiography were only performed during one session. Eight
participants were examined; three ingested caffeine supplementation and five consumed ED.
Hence the sizes of the groups are not equivalent. Mean difference in table 10 is the mean of
the difference between the value after intake and the value before intake for each subject.
Table 10 shows stroke volume, cardiac output and left ventricular strain at the different
measuring points, with mean differences and P-values included.
98
99
100
101
102
103
Before intake 60 minutes post intake
Pe
rce
nt
QRS-duration (%)
ED
Caffeine

34
Table 10. Results of measurements in echocardiography.
Before intake 60 min post intake Mean differance P-Value
Stroke volume [ml]
ED 79.8 (14.4) 81.0 (14.8) 1.2 (15.6) 1.00
Caffeine 57.7 (6.7) 58.0 (6.1) 0.3 (12.7) 1.00
Cardiac output [L/min]
ED 5.2 (1.4) 5.4 (1.4) 0.2 (1.2) 1.00
Caffeine 3.9 (0.66) 3.5 (0.6) -0.4 (0.7) 0.50
Left ventricular strain [%]
ED 20.0 (1.4) 19.1 (2.4) -0.9 (1.2) 0.25
Caffeine 20.5 (1.8) 18.5 (2.7) -2.0 (1.0) 0.25
Values are reported as mean (standard deviation). Statistical significance is marked with *. ED = energy drink. ED = 5 participants, Caffeine = 3 participants.
No statistical significant differences were found in any of the variables examined by
echocardiography. Stroke volume and cardiac output remain relatively unchanged after both
exposures, whereas left ventricular strain decreases with 0.9% (P=0.25) after ED and 2.0%
(P=0.25) after caffeine supplementation. Stroke volume, cardiac output and left ventricular
strain are shown in figure 37-42 as means and percental progression.
Figure 37.
SV at the different measuring points. Lines represent means of the groups.
ED = energy drink, Caffeine = caffeine supplementation, SV = stroke volume.
0
10
20
30
40
50
60
70
80
90
Before intake 60 min post intake
SV [
ml]
Stroke volume
ED
Caffeine

35
Figure 38.
Percental development of stroke volume after ingestion of ED or caffeine. Measured value before intake was set as 100%.
ED = energy drink, Caffeine = Caffeine supplementation.
Figure 39.
CO at the different measuring points. Lines represent means of the groups.
ED = energy drink, Caffeine = caffeine supplementation, CO = cardiac output.
Figure 40.
Percental development of cardiac output after ingestion of ED or caffeine. Measured value before intake was set as 100%.
ED = energy drink, Caffeine = Caffeine supplementation.
98
99
100
101
102
103
104
Before intake 60 min post intake
Pe
rce
nt
Stroke volume (%)
ED
Caffeine
0
1
2
3
4
5
6
Before intake 60 min post intake
CO
[L/
min
]
Cardiac output
ED
Caffeine
80
85
90
95
100
105
110
Before intake 60 min post intake
Pe
rce
nt
Cardiac output (%)
ED
Caffeine

36
Figure 41.
LVS at the different measuring points. Lines represent means of the groups.
ED = energy drink, Caffeine = caffeine supplementation, LVS = left ventricular strain.
Figure 42.
Percental development of left ventricular strain after ingestion of ED or caffeine. Measured value before intake was set as 100%.
ED = energy drink, Caffeine = Caffeine supplementation.
Adverse effects and estimated sleep quality
Ten questionnaires from the ED-group and seven from the caffeine-group were
collected. 40% in the ED-group and 100% in the caffeine-group experienced no adverse
effects. The most common adverse effect was palpitation, which 3 participants experienced
after ED consumption. Other reported adverse effects were headache, nausea and tremor. The
estimated sleep quality (1-5) was relatively equivalent after both exposures. Table 11
summarizes the outcome of the questionnaires.
17
17,5
18
18,5
19
19,5
20
20,5
21
Before intake 60 min post intake
LVS
[%]
Left ventricular strain
ED
Caffeine
84
86
88
90
92
94
96
98
100
102
Before intake 60 min post intake
Pe
rce
nt
Left ventricular strain (%)
ED
Caffeine

37
Table 11. Results of questionnaire on adverse effects and sleep quality.
ED Caffeine
Adverse effect Headache 1 0
Nausea 1 0 Palpitation 3 0
Tremor None
1 4
0 7
Sleep quality (1-5) 4.0 (0.63) 4.2 (0.98)
Adverse effects are reported as number of cases. Sleep quality is reported as mean (standard deviation). 1 = “no sleep,” 5 = “perfect sleep”. ED = energy drink. ED = 10 participants, caffeine = 7 participants.
Discussion
The major findings in our studies were a significant elevation in systolic blood pressure
by 10.0 mmHg (P=0.002) 60 minutes after a post-exercise ingestion of ED, which also
resulted in an increase in mean arterial pressure by 4.3 (P=0.02) and 7.7 (P=0.007) after 30
minutes and 60 minutes, respectively (table 5, page 15). Post-exercise diastolic blood pressure
and heart rate were not significantly increased after consumption of ED. No statistically
significant differences between ED and caffeine supplementation were found regarding blood
pressure or heart rate, although an indication of divergence could be seen 90 minutes after
intake where the SBP was 4.3 mmHg higher with ED than with caffeine (table 8, page 24).
This outcome corresponds with results of previous studies in the field, where ED enhances the
blood pressure, especially systolic blood pressure, but does not affect the heart rate(17, 19)
. A
response which may be ascribed to caffeine, since placebo-controlled trials have shown that
caffeine elevates blood pressure and plasma levels of catecholamines without altering the
heart rate(30-32)
. On the contrary, Franks et al. (2012) demonstrated that ED increased 24-hour
SBP and DBP to a greater extent than an equivalently dosed caffeine control(17)
. This
tendency might be reflected in our trial where SBP was 4.3 mmHg higher with ED than with
caffeine 90 minutes after consumption (table 8, page 24). A possible causation could be the

38
actions of taurine in myocytes, where it alters the intracellular levels of Ca2+
and can
contribute to an enhanced cardiac contractility, thereby increasing the blood pressure(10)
.
This study could not detect any significant differences in heart rate variability between
ED and sports drink after physical exercise. However, as seen in figure 15 (page 23) SDNN
after ED ingestion is decreased a longer period than after SD ingestion, where it first is above
100 ms 90 minutes after ED consumption but 60 minutes after intake of SD. This difference is
not statistically significant and it should be emphasized that our HRV-data only include cross-
over measurements from three participants. The disparity could nevertheless indicate that
vagal reactivation is delayed after exercise when ED is ingested afterwards(25, 26)
. SDNN is the
standard deviation between NN-intervals during the selected sample period (in our case each
sample was set to the length of 5 minutes), and is one of the more basic variables of HRV(25)
.
Wiklund et al.(2009), who also measured HRV during physical exercise in conjunction with
ED, used the more sophisticated HRV-variables High frequency (parasympaticus) and Low
frequency (sympaticus)(24)
. These variables were unfortunately affected by too much
disturbances in our data in order to analyze them. Wiklund et al. found that HRV remained
decreased for a significantly longer period after physical exercise when ED was consumed,
however their study was arranged differently from ours. ED was consumed 30 minutes before
the workout, and not directly afterwards as in ours. The ingested volume of ED was 750 ml,
which was 50% more than in ours (500 ml). Finally, their resting period was better
standardized and stricter, where the participants remained in a supine position for at least one
hour after exercise. These differences may also explain why they detected that ED caused a
prolonged post-exercise heart rate recovery, whereas we did not (as seen in table 6 and figure
14, page 22).

39
Measurements in electrocardiography did not result in any statistical differences
between ingestion of ED and caffeine supplementation. QTc-interval and QRS-duration
remained relatively unchanged after both exposures (figures 28 & 34), whereas PQ-interval
was the ECG-variable that was most affected. Consumption of ED resulted in a 7.3 ms longer
PQ-interval, and caffeine increased the interval by 10.5 ms (table 9, page 30), although no
significant difference was found between the two groups. Hence this finding may be an
indication that caffeine prolongs the PQ-interval. Wiklund et al. (2009) found that PQ-interval
was extended with 12 ms after ingestion of 750 ml ED(24)
.
No significant changes in the echocardiographic variables stroke volume, cardiac output
and left ventricular strain were found after consumption of ED or caffeine. Only five
participants ingesting ED and three ingesting caffeine, and no cross-over analysis, were
examined in these measurements. Stroke volume and cardiac output were not notably affected
by any of the exposures (table 10, page 34), whereas left ventricular strain decreased with 0.9
and 2.0% after ED and caffeine consumption, respectively. Strain can be used as a quantity of
left ventricular function, and is calculated as percent change in dimension. Thus the variable
reflects the extent of ventricular deformation. Decreased left ventricular strain could be
interpreted as reduced myocardial function(33)
. To our knowledge, the correlation between ED
ingestion and ventricular strain has not been previously examined. However, Baum & Weiss
(2001) found that intake of Red Bull containing both taurine and caffeine enhanced the stroke
volume more than a caffeinated Red Bull without taurine, a further suggestion that ED with
taurine affects the inotropy of the heart(22)
.
Remarkably, no subject reported any adverse effects from caffeine ingestion, while 60%
experienced some sort of discomfort after ED, despite the dose of caffeine being 10 mg more
from supplementation than from ED. Although it should be noted that three participants did

40
not submit their questionnaires after the session where they received caffeine. Nevertheless,
ED seem to provoke more adverse effects than caffeine solely, and the reported effects were
similar to those summarized in earlier reviews of the matter(5)
. The most frequent in this study
was palpitation, which was perceived by three subjects (table 11, page 37). Since we could
not detect that heart rate affected by the exposure, this symptom might be a consequence of
increased myocardial contractility.
Limitations
Our hypothesis that ED ingestion results in an increased post-exercise blood pressure
was confirmed, however additional questions can now be raised. As seen in figure 4 (page
17), the increase in SBP is largest 60 minutes after intake which is the last measuring point.
For how long is the post-exercise blood pressure elevated? What physiological impact does an
enhanced post-exercise blood pressure have?
This study failed to prove a significantly prolonged heart rate recovery and decreased
heart rate variability after an exercise where ED was consumed. Following modifications in
the study design are suggested to better examine the hypotheses; consumption of drinks
should be 30 minutes before the workout and not afterwards, the subjects should strictly
remain in a supine position during the post-exercise resting period and the resting period i.e.
the measuring period should last at least two hours.
Statistically significant differences between intake of ED and caffeine supplementation
in heart rate, blood pressure, ECG or echocardiography were not found. If any, the differences
are probably subtle and in order to prove them a better standardization of the study is
required. Firstly, the participants should have been resting on a chair for ten minutes before
baseline measurements. Secondly, the participants should have remained sitting for the whole
session without eating or drinking anything. The difference of 10 mg caffeine between ED

41
and supplementation should have been adjusted, either with more ED or more precise
weighing of caffeine. It should also be noted that we did not analyze the caffeine content of
Red Bull but rather trusted the amount reported by the company (80 mg/250 ml), which has
been reported to actually contain less (66.7 mg/250 ml)(34)
. Finally, there might be a
pharmacokinetic difference in both rate and quantity absorbed between the caffeine in ED and
supplementation. This should have been adjusted through serving the supplementation
dissolved in water.
Another factor which was clearly limiting the possibility that the studies resulted in any
significant findings was the restricted number of participants. 15 subjects and 10 subjects
enrolled in “ED after physical exercise” and “Comparison between ED and caffeine
supplementation”, respectively. A larger number of participants would increase the
probability of Gaussian distributed data, thus resulting in stronger statistical calculations. A
true statistical difference in the data would consequently be more distinct. Further studies are
suggested to include a larger quantity of participants.
Conclusions and Implications
This study demonstrates that consumption of energy drinks after a physical exercise
results in an increase of systolic blood pressure and mean arterial pressure 60 minutes later.
Post-exercise heart rate variability and heart rate recovery are a not altered by the ingestion.
Statistically significant differences between intake of ED and caffeine supplementation in
heart rate, blood pressure, ECG or echocardiography were not found. However, both ED and
caffeine provokes alterations in blood pressure, ECG and echocardiographic variables. Hence
causation with energy drinks is encouraged to individuals with structural or arrhythmic
cardiac disorders, especially in conjunction with physical exercise or alcohol.

42
Populärvetenskaplig sammanfattning
Energidrickor med högt koffeininnehåll säljs runt om i världen sedan milleniumskiftet.
Konsumptionen av dem ökar fortfarande påtagligt, i synnerhet bland yngre individer. Denna
ålderskategori utsätts för intensiv marknadsföring av produkterna, och de uppmanas att inta
dem i samband med fysiskt ansträngande aktiviteter. Det har varnats om att dryckerna skulle
kunna vara orsaken till att flertalet ungdomar har drabbats av allvarliga samt ovanliga
hjärtåkommor. Frågan som har ställts är om det är den anseliga mängden koffein, eller några
av de andra ingridenserna i drycken som skulle kunna vara anledningen. Bland de sistnämna
ingår taurin, vilket numera är ett föremål för intensiv granskning.
Syftet med denna studien var att undersöka vilka påföljder på hjärta-kärlsystemet som
förtäring av energidrycker medför, både under vila och i samband med fysisk aktivitet. Därför
anordnades två olika undersökningar där dessa förhållanden simulerades. I den första
undersökningen fick 15 försökspersoner utföra två identiska spinningpass, och inta
energidryck efter ena passet samt sportdryck efter det andra. Det som undersöktes var hur
återhämtningen av puls och blodtryck påverkades av energidrickorna. Den andra
undersökningen var en jämförelse mellan energidrycker och koffeintabletter, där båda
exponeringar innehöll samma mängd koffein. 10 försökspersoner genomförde två
försökstillfällen, under vilka de fick energidryck ena gången och koffein den andra.
Reaktionen på hjärta-kärlsystemet uppmättes med puls, blodtryck, EKG samt
ultraljudsundersökning av hjärtat.
Det resultat som var statistiskt säkerställt i våran studie var att förtäring av energidryck
efter ett träningspass orsakar ett förhöjt blodtryck efteråt. Det kunde inte påvisas att
pulsåterhämtningen påverkades av drycken. Inte heller kunde det bevisas att energidryck
orsakade en större inverkan på puls, blodtryck, EKG eller ultraljudsundersökning än vad

43
motsvarande mängd koffein framkallar. Vad som däremot kunde observeras var att både
energidrycken och koffeinet orsakade förändringar på dessa mätvariabler. Således uppmanas
framförallt personer med kända hjärtåkommor att vara aktsamma med energidryck, och avstå
från att använda dem tillsammans med fysisk ansträning eller alkohol.

44
References
1. Zucconi S, Volpato C, Adinolfi F, Gandini E, Gentile E, Loi A, et al. Gathering consumption data on specific consumer groups of energy drinks. Supporting Publications: 2013 Available online: www.efsa.europa.eu/publications. 2. Schaffer SW, Shimada K, Jong CJ, Ito T, Azuma J, Takahashi K. Effect of taurine and potential interactions with caffeine on cardiovascular function. Amino acids. 2014;46(5):1147-57. 3. http://energydrink.redbull.com/red-bull-energy-drink [2015-10-07]. 4. Lehtihet M, Beckman Sundh U, Andersson D. Energidryck - farlig eller inte? Fall med svåra symtom har möjligt samband med energidryck - fler fall efterlyses. Läkartidningen. 2006:2738-41. 5. Gunja N, Brown JA. Energy drinks: health risks and toxicity. The Medical journal of Australia. 2012;196(1):46-9. 6. Sanchis-Gomar F, Pareja-Galeano H, Cervellin G, Lippi G, Earnest CP. Energy drink overconsumption in adolescents: implications for arrhythmias and other cardiovascular events. The Canadian journal of cardiology. 2015;31(5):572-5. 7. Di Rocco JR, During A, Morelli PJ, Heyden M, Biancaniello TA. Atrial fibrillation in healthy adolescents after highly caffeinated beverage consumption: two case reports. Journal of medical case reports. 2011;5:18. 8. Scott MJ, El-Hassan M, Khan AA. Myocardial infarction in a young adult following the consumption of a caffeinated energy drink. BMJ case reports. 2011;2011. 9. Wilson RE, Kado HS, Samson R, Miller AB. A case of caffeine-induced coronary artery vasospasm of a 17-year-old male. Cardiovascular toxicology. 2012;12(2):175-9. 10. Holloway C, Kotsanas G, Wendt I. Acute effects of taurine on intracellular calcium in normal and diabetic cardiac myocytes. Pflugers Archiv : European journal of physiology. 1999;438(3):384-91. 11. El Idrissi A, Shen CH, L'Amoreaux W J. Neuroprotective role of taurine during aging. Amino acids. 2013;45(4):735-50. 12. Pasantes Morales H, Schousboe A. Volume regulation in astrocytes: a role for taurine as an osmoeffector. Journal of neuroscience research. 1988;20(4):503-9. 13. Schuller-Levis GB, Park E. Taurine and its chloramine: modulators of immunity. Neurochemical research. 2004;29(1):117-26. 14. Scientific Opinion of the Panel on Food Additives and Nutrient Sources added to Food on a request from the Commission on the use of taurine and D-glucurono-γ-lactone as constituents of the socalled “energy” drinks. European Food Safety Authority, 2009. 15. Echeverri D, Montes FR, Cabrera M, Galan A, Prieto A. Caffeine's Vascular Mechanisms of Action. International journal of vascular medicine. 2010;2010:834060. 16. Opinion of the Scientific Committee on Food on Additional information on “energy” drinks. European Commission, Scientific Committee on Food: 2003 Available online: http://ec.europa.eu/food/fs/sc/scf/out169_en.pdf. 17. Franks AM, Schmidt JM, McCain KR, Fraer M. Comparison of the effects of energy drink versus caffeine supplementation on indices of 24-hour ambulatory blood pressure. The Annals of pharmacotherapy. 2012;46(2):192-9. 18. Grasser EK, Yepuri G, Dulloo AG, Montani JP. Cardio- and cerebrovascular responses to the energy drink Red Bull in young adults: a randomized cross-over study. European journal of nutrition. 2014;53(7):1561-71.

45
19. Worthley MI, Prabhu A, De Sciscio P, Schultz C, Sanders P, Willoughby SR. Detrimental effects of energy drink consumption on platelet and endothelial function. The American journal of medicine. 2010;123(2):184-7. 20. Steinke L, Lanfear DE, Dhanapal V, Kalus JS. Effect of "energy drink" consumption on hemodynamic and electrocardiographic parameters in healthy young adults. The Annals of pharmacotherapy. 2009;43(4):596-602. 21. Svatikova A, Covassin N, Somers KR, Somers KV, Soucek F, Kara T, et al. A Randomized Trial of Cardiovascular Responses to Energy Drink Consumption in Healthy Adults. Jama. 2015;314(19):2079-82. 22. Baum M, Weiss M. The influence of a taurine containing drink on cardiac parameters before and after exercise measured by echocardiography. Amino acids. 2001;20(1):75-82. 23. Ragsdale FR, Gronli TD, Batool N, Haight N, Mehaffey A, McMahon EC, et al. Effect of Red Bull energy drink on cardiovascular and renal function. Amino acids. 2010;38(4):1193-200. 24. Wiklund U, Karlsson M, Ostrom M, Messner T. Influence of energy drinks and alcohol on post-exercise heart rate recovery and heart rate variability. Clinical physiology and functional imaging. 2009;29(1):74-80. 25. Heart rate variability: standards of measurement, physiological interpretation and clinical use. Task Force of the European Society of Cardiology and the North American Society of Pacing and Electrophysiology. Circulation. 1996;93(5):1043-65. 26. Shaffer F, McCraty R, Zerr CL. A healthy heart is not a metronome: an integrative review of the heart's anatomy and heart rate variability. Frontiers in psychology. 2014;5:1040. 27. Cole CR, Blackstone EH, Pashkow FJ, Snader CE, Lauer MS. Heart-rate recovery immediately after exercise as a predictor of mortality. The New England journal of medicine. 1999;341(18):1351-7. 28. Ethical Review of Research http://www.codex.uu.se./en/manniska5.shtml: Centre for Research Ethics & Bioethics, Uppsala University; [updated 2015-10-07]. 29. Koffein http://www.livsmedelsverket.se/livsmedel-och-innehall/kosttillskott/amnen-i-kosttillskott/koffein/: National Food Agency, Sweden; [updated 2015-11-18]. 30. Lovallo WR, Pincomb GA, Sung BH, Passey RB, Sausen KP, Wilson MF. Caffeine may potentiate adrenocortical stress responses in hypertension-prone men. Hypertension. 1989;14(2):170-6. 31. Passmore AP, Kondowe GB, Johnston GD. Renal and cardiovascular effects of caffeine: a dose-response study. Clinical science (London, England : 1979). 1987;72(6):749-56. 32. Pincomb GA, Lovallo WR, Passey RB, Whitsett TL, Silverstein SM, Wilson MF. Effects of caffeine on vascular resistance, cardiac output and myocardial contractility in young men. The American journal of cardiology. 1985;56(1):119-22. 33. Opdahl A, Helle-Valle T, Skulstad H, Smiseth OA. Strain, strain rate, torsion, and twist: echocardiographic evaluation. Current cardiology reports. 2015;17(3):568. 34. McCusker RR, Goldberger BA, Cone EJ. Caffeine content of energy drinks, carbonated sodas, and other beverages. Journal of analytical toxicology. 2006;30(2):112-4.