modeling boundary layer ingestion using a coupled ...openmdao.org/pubs/gray_bli_2017.pdf ·...
TRANSCRIPT

Modeling Boundary Layer Ingestion Using a CoupledAeropropulsive Analysis
Justin Gray*, Charles A. Mader†, Gaetan K.W. Kenway‡, Joaquim R. R. A. Martins §
he single-aisle turboelectric aircraft with an aft boundary layer propulsor aircraft concept is estimated to reduce fuelburn by 12% through a turbo-electric propulsion system with an electrically driven boundary layer ingestion propulsormounted on the fuselage tail cone. This motivates a more detailed study of the boundary layer ingestion propulsordesign, which requires considering the fully coupled airframe propulsion integration problem. However, boundarylayer ingestion studies so far have accounted only for the aerodynamic effects on the propulsion system or vice-versa, but have not considered the two-way coupling. This work presents a new approach for building fully coupledpropulsive-aerodynamic models of boundary layer ingestion propulsion systems. A one-dimensional thermodynamiccycle analysis is coupled to a RANS simulation. We use this aero-propulsive model to assess how the propulsor designaffects the overall performance for a simplified model of the STARC-ABL. The results indicate that both propulsionand aerodynamic effects contribute equally toward the overall performance, and that the fully coupled model yieldssubstantially different results compared to the uncoupled model. Although boundary layer ingestion offers substantialfuel burn savings, it introduces propulsion-dependent aerodynamic effects that need to be accounted for.
Nomenclature()FE quantity computed at the fan exit boundary
()FF quantity computed at the fan-face boundary
()∞ free stream quantity
δ boundary layer height
m mass flow rate
ηa adiabatic efficiency
ηp propulsive efficiency
R residual function
ρ air density
Aref reference wing area
CFfuse force coefficient for forces generated by the fuselage
CFprop force coefficient for forces generated by the propulsor
CFx net force coefficient
dnac nacelle outer diameter
Ffuse force integrated over the fuselage
Fprop force integrated over the propulsor
Fx net force integrated over the body
lref reference length
*Aerospace Engineer NASA Glenn Research Center, PSA Branch, 21000 Brookpark Rd., MS 5-11; Doctoral Candidate Department ofAerospace Engineering, University of Michigan; AIAA Member
†Research Investigator, Department of Aerospace Engineering, AIAA Senior Member‡Aerospace Engineer, Science and Technology Corporation; AIAA Senior Member§Professor, Department of Aerospace Engineering; AIAA Associate Fellow
1 of 17
American Institute of Aeronautics and Astronautics
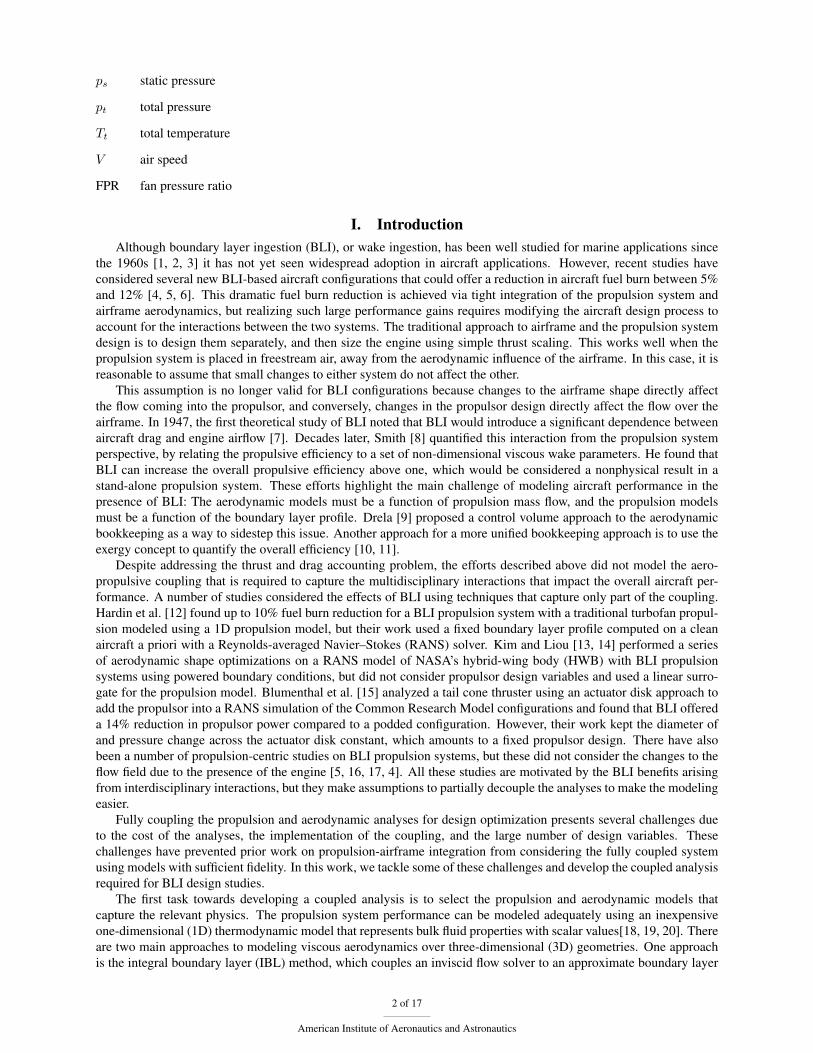
ps static pressure
pt total pressure
Tt total temperature
V air speed
FPR fan pressure ratio
I. IntroductionAlthough boundary layer ingestion (BLI), or wake ingestion, has been well studied for marine applications since
the 1960s [1, 2, 3] it has not yet seen widespread adoption in aircraft applications. However, recent studies haveconsidered several new BLI-based aircraft configurations that could offer a reduction in aircraft fuel burn between 5%and 12% [4, 5, 6]. This dramatic fuel burn reduction is achieved via tight integration of the propulsion system andairframe aerodynamics, but realizing such large performance gains requires modifying the aircraft design process toaccount for the interactions between the two systems. The traditional approach to airframe and the propulsion systemdesign is to design them separately, and then size the engine using simple thrust scaling. This works well when thepropulsion system is placed in freestream air, away from the aerodynamic influence of the airframe. In this case, it isreasonable to assume that small changes to either system do not affect the other.
This assumption is no longer valid for BLI configurations because changes to the airframe shape directly affectthe flow coming into the propulsor, and conversely, changes in the propulsor design directly affect the flow over theairframe. In 1947, the first theoretical study of BLI noted that BLI would introduce a significant dependence betweenaircraft drag and engine airflow [7]. Decades later, Smith [8] quantified this interaction from the propulsion systemperspective, by relating the propulsive efficiency to a set of non-dimensional viscous wake parameters. He found thatBLI can increase the overall propulsive efficiency above one, which would be considered a nonphysical result in astand-alone propulsion system. These efforts highlight the main challenge of modeling aircraft performance in thepresence of BLI: The aerodynamic models must be a function of propulsion mass flow, and the propulsion modelsmust be a function of the boundary layer profile. Drela [9] proposed a control volume approach to the aerodynamicbookkeeping as a way to sidestep this issue. Another approach for a more unified bookkeeping approach is to use theexergy concept to quantify the overall efficiency [10, 11].
Despite addressing the thrust and drag accounting problem, the efforts described above did not model the aero-propulsive coupling that is required to capture the multidisciplinary interactions that impact the overall aircraft per-formance. A number of studies considered the effects of BLI using techniques that capture only part of the coupling.Hardin et al. [12] found up to 10% fuel burn reduction for a BLI propulsion system with a traditional turbofan propul-sion modeled using a 1D propulsion model, but their work used a fixed boundary layer profile computed on a cleanaircraft a priori with a Reynolds-averaged Navier–Stokes (RANS) solver. Kim and Liou [13, 14] performed a seriesof aerodynamic shape optimizations on a RANS model of NASA’s hybrid-wing body (HWB) with BLI propulsionsystems using powered boundary conditions, but did not consider propulsor design variables and used a linear surro-gate for the propulsion model. Blumenthal et al. [15] analyzed a tail cone thruster using an actuator disk approach toadd the propulsor into a RANS simulation of the Common Research Model configurations and found that BLI offereda 14% reduction in propulsor power compared to a podded configuration. However, their work kept the diameter ofand pressure change across the actuator disk constant, which amounts to a fixed propulsor design. There have alsobeen a number of propulsion-centric studies on BLI propulsion systems, but these did not consider the changes to theflow field due to the presence of the engine [5, 16, 17, 4]. All these studies are motivated by the BLI benefits arisingfrom interdisciplinary interactions, but they make assumptions to partially decouple the analyses to make the modelingeasier.
Fully coupling the propulsion and aerodynamic analyses for design optimization presents several challenges dueto the cost of the analyses, the implementation of the coupling, and the large number of design variables. Thesechallenges have prevented prior work on propulsion-airframe integration from considering the fully coupled systemusing models with sufficient fidelity. In this work, we tackle some of these challenges and develop the coupled analysisrequired for BLI design studies.
The first task towards developing a coupled analysis is to select the propulsion and aerodynamic models thatcapture the relevant physics. The propulsion system performance can be modeled adequately using an inexpensiveone-dimensional (1D) thermodynamic model that represents bulk fluid properties with scalar values[18, 19, 20]. Thereare two main approaches to modeling viscous aerodynamics over three-dimensional (3D) geometries. One approachis the integral boundary layer (IBL) method, which couples an inviscid flow solver to an approximate boundary layer
2 of 17
American Institute of Aeronautics and Astronautics

solver.[21, 22, 23]. Alternatively, we can use a fully viscous analysis, such as RANS computational fluid dynamics(CFD). For our work, we choose RANS to ensure the general applicability to complex 3D geometries that includeintersecting surfaces, and highly 3D flows that might include vortices, and boundary layers that are not fully ingested.Although the geometry considered in the present paper is not that complex, we plan to handle more complex cases inthe future.
Aerodynamic performance is highly sensitive to shape changes, and thus a parametrization with a large number ofshape design variables is required [24]. RANS-based optimization with respect to large numbers of design variableshas been made tractable by using gradient-based numerical optimization in conjunction with the adjoint method, whichprovides an efficient way to compute the required gradients [25, 26, 24, 27].
Thus, we propose to couple a 1D thermodynamic model of the propulsor to a RANS model of the airframe andpropulsor geometry to perform BLI studies. To achieve this, we need to develop a coupling method to exchange thedata between the two models and to converge the coupled solution. To leverage the efficiency of gradient-based opti-mization, we also plan to develop a coupled-adjoint approach to compute the derivatives of the coupled system. Thecoupled adjoint approach, originally developed by Martins et al. [28, 29], has been well established for aerostructuralapplications [30, 31, 32], but has not yet been extended to aero-propulsive applications.
The ultimate goal of this research is to develop a fully coupled aero-propulsive multidisciplinary design optimiza-tion (MDO) framework that can be used to study NASA’s STARC-ABL configuration and other airframe-propulsionintegration problems. However, in this paper, we focus on the development of the coupled model, and on the as-sessment of the coupled effects on a simplified geometry of the STARC-ABL configuration. We leverage NASA’sOpenMDAO framework to perform the data exchanges and to solve the coupled system [33]. We then use the coupledmodel to quantify the effects of fan pressure ratio (FPR) on the overall performance of the aero-propulsive system. Ourresults show that with BLI, there is a strong and mutually beneficial interaction between the airframe aerodynamicsand the propulsor. Furthermore, we show that an uncoupled analysis method misses key multidisciplinary interactions,such as propulsion-dependent lift, drag, and pitching moment.
II. The STARC-ABL Aircraft ConfigurationIn 2016, NASA developed a new aircraft configuration called the STARC-ABL—single-aisle turbo-electric aircraft
with an aft boundary layer propulsor—that incorporated BLI into an otherwise conventional configuration by addinga propulsor mounted on the tip of the tail cone. This aircraft is designed to cruise at Mach 0.72 and 37,000 ft with awing area of 1400 ft2. A rendering of this aircraft configuration is shown in Fig. 1. STARC-ABL uses a turbo-electricpropulsion system with wing-mounted turbofan engines that also include electric generators to provide power to anelectric motor powering the BLI propulsor.
Figure 1. NASA’s STARC-ABL aircraft concept, incorporating a hybrid-electric propulsion system and aft-mounted BLI propulsor [4]
In their initial design study, Welstead and Felder [4] conclude that this configuration could offer up to a 12%reduction in fuel burn compared to the same configuration with a conventional propulsion system. For that study, theauthors assume that the BLI propulsor would always run with a fixed power input of 3,500 hp, regardless of the flightspeed, altitude, or throttle setting of the engine (except at very low throttle settings, where the power requirement wasrelaxed). Their propulsor had a FPR of 1.2, and an adiabatic efficiency of 95.6%.
The total thrust of STARC-ABL under-wing engines lapse more severely with altitude when compared to a con-ventional configuration, because they must provide a fixed amount of power to the BLI propulsor. The fixed power
3 of 17
American Institute of Aeronautics and Astronautics
off-take is a smaller percentage of the overall shaft power on the low-speed spool at lower altitudes. The fixed shaftpower to the BLI propulsor also means that at low altitudes—such as take-off—the BLI propulsor does not provideas significant a portion of the overall thrust. However, as the aircraft climbs, the BLI propulsor’s share of the overallthrust increases as well. According to Welstead and Felder [4], the BLI propulsor provides only 20% of the overallthrust during take-off, but towards the end of the climb it provides 44%. This means that the performance of thepropulsor is much more important at cruise than during take-off and climb.
The large share of thrust generated by the BLI propulsor at cruise is ultimately what enables the significant missionfuel burn reduction for this configuration. Therefore, the design of this propulsor is crucial to the overall performanceand viability of the STARC-ABL concept. However, as previously explained, designing a BLI propulsor is challengingbecause of the tight coupling between the propulsion and aerodynamics disciplines.
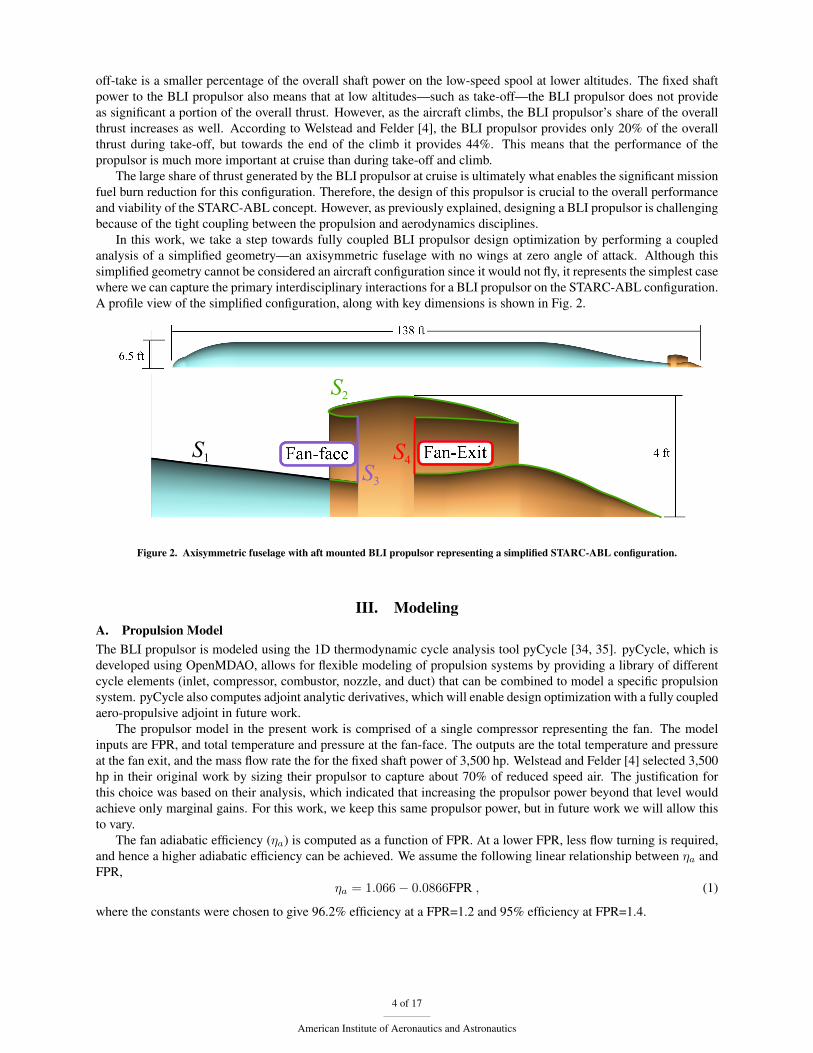
In this work, we take a step towards fully coupled BLI propulsor design optimization by performing a coupledanalysis of a simplified geometry—an axisymmetric fuselage with no wings at zero angle of attack. Although thissimplified geometry cannot be considered an aircraft configuration since it would not fly, it represents the simplest casewhere we can capture the primary interdisciplinary interactions for a BLI propulsor on the STARC-ABL configuration.A profile view of the simplified configuration, along with key dimensions is shown in Fig. 2.
S1
S2
S3S4
Figure 2. Axisymmetric fuselage with aft mounted BLI propulsor representing a simplified STARC-ABL configuration.
III. ModelingA. Propulsion ModelThe BLI propulsor is modeled using the 1D thermodynamic cycle analysis tool pyCycle [34, 35]. pyCycle, which isdeveloped using OpenMDAO, allows for flexible modeling of propulsion systems by providing a library of differentcycle elements (inlet, compressor, combustor, nozzle, and duct) that can be combined to model a specific propulsionsystem. pyCycle also computes adjoint analytic derivatives, which will enable design optimization with a fully coupledaero-propulsive adjoint in future work.
The propulsor model in the present work is comprised of a single compressor representing the fan. The modelinputs are FPR, and total temperature and pressure at the fan-face. The outputs are the total temperature and pressureat the fan exit, and the mass flow rate the for the fixed shaft power of 3,500 hp. Welstead and Felder [4] selected 3,500hp in their original work by sizing their propulsor to capture about 70% of reduced speed air. The justification forthis choice was based on their analysis, which indicated that increasing the propulsor power beyond that level wouldachieve only marginal gains. For this work, we keep this same propulsor power, but in future work we will allow thisto vary.
The fan adiabatic efficiency (ηa) is computed as a function of FPR. At a lower FPR, less flow turning is required,and hence a higher adiabatic efficiency can be achieved. We assume the following linear relationship between ηa andFPR,
ηa = 1.066− 0.0866FPR , (1)
where the constants were chosen to give 96.2% efficiency at a FPR=1.2 and 95% efficiency at FPR=1.4.
4 of 17
American Institute of Aeronautics and Astronautics

B. BLI Aerodynamic ModelThe aerodynamic model uses the RANS solver ADflow [25, 24], which is an efficient viscous adjoint with an in-memory interface to Python that greatly simplifies the integration with OpenMDAO. The axisymmetric geometry ofour simplified geometry allows us to use a small structured multiblock mesh with 170,000 cells to capture the relevantphysics. On a desktop computer with a 3.6 GHz, 4 core, Intel core-I7 processor and 8 GB of memory, this mesh canbe converged 10 orders of magnitude in approximately 2 minutes.
Figure 3. Free-form deformation defining the geometry parametrization. Green nodes are allowed to move while red nodes are fixed.
The fuselage for our model was designed to be similar to that of a Boeing 737-900 in length and diameter. A free-form deformation (FFD) approach [36] was used to parameterize the BLI propulsor diameter. This was accomplishedby defining an FFD that rigidly translates the top of the nacelle up or down to scale the propulsor. Figure 3 showsthe layout of the FFD boxes that parameterize the geometry, where the green nodes are the corners of the boxes thattranslate up and down to scale the nacelle diameter. The red nodes are held fixed to maintain the fuselage and nozzleplug geometry. In future work, additional control points will be added, and both red and green nodes will be able tomove to perform more detailed shape optimization.
The propulsion-related inputs to our model are the diameter of the nacelle (dnac) and the two boundary conditionsthat account for the fan: fan-face and fan-exit boundary conditions, as shown in Fig. 2. At the fan-face, we apply anoutflow boundary condition (flow leaving the CFD domain), where the static pressure is specified. At the fan exit, weapply an inflow boundary condition, where the total pressure and temperature are specified.
We compute the net horizontal force on the body, Fx, by integrating the pressure and viscous forces on all solidsurfaces, and the pressure and momentum flux contributions on the fan-face and fan exit, where all the contributionsare resolved in the x-direction. This integration can be written as follows:
Fx =
∫∫S1
(pn + f visc) · xdS︸ ︷︷ ︸Ffuse
+
∫∫S2
(pn + f visc) · xdS −∫∫
S3
ρ3u23dS +
∫∫S4
ρ4u24dS︸ ︷︷ ︸
Fprop
, (2)
where S1 is the portion of the fuselage surface shown in blue in Fig. 2, S2 is the aft portion of the body shown asthe green outline, S3 represents the fan-face (purple), and S4 is the fan exit (red). As indicated in this equation, wedecompose the total force into Ffuse and Fprop. We do this decomposition to facilitate the discussion of our results, butthis does not imply that fuselage drag, nacelle drag, and thrust can be neatly separated. Neither of these quantities areintegrated over a closed control volume and therefore they do not represent true body forces. Furthermore, for a BLIconfiguration, thrust and drag are no longer independent quantities that can be separated in a meaningful way.
As part of our modeling, we also integrate the mass flow rates across both the fan-face and fan exit, and the mass-averaged total properties at the fan-face. Taking a mass-average of the total properties, as apposed to an arithmetic-average or area-average, is important for keeping a conservative data transfer between the aerodynamic and propulsionanalyses.
C. Podded Configuration Aerodynamic ModelTo provide a consistent point of reference modeled with the same tools and assumptions as the BLI configuration, weconstructed an aerodynamic model that emulates a conventional podded configuration. This model consists of twoseparate simulations: one for the clean fuselage, and another for the podded propulsor, as shown in Fig. 4.
5 of 17
American Institute of Aeronautics and Astronautics
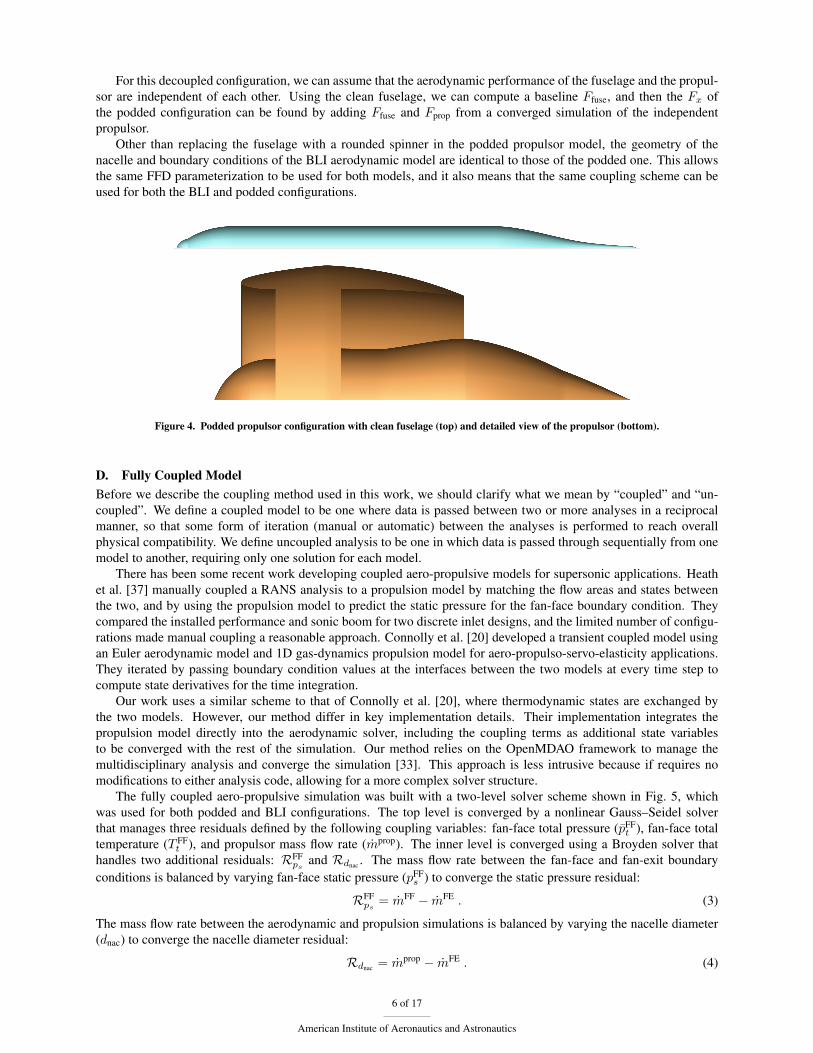
For this decoupled configuration, we can assume that the aerodynamic performance of the fuselage and the propul-sor are independent of each other. Using the clean fuselage, we can compute a baseline Ffuse, and then the Fx ofthe podded configuration can be found by adding Ffuse and Fprop from a converged simulation of the independentpropulsor.
Other than replacing the fuselage with a rounded spinner in the podded propulsor model, the geometry of thenacelle and boundary conditions of the BLI aerodynamic model are identical to those of the podded one. This allowsthe same FFD parameterization to be used for both models, and it also means that the same coupling scheme can beused for both the BLI and podded configurations.
Figure 4. Podded propulsor configuration with clean fuselage (top) and detailed view of the propulsor (bottom).
D. Fully Coupled ModelBefore we describe the coupling method used in this work, we should clarify what we mean by “coupled” and “un-coupled”. We define a coupled model to be one where data is passed between two or more analyses in a reciprocalmanner, so that some form of iteration (manual or automatic) between the analyses is performed to reach overallphysical compatibility. We define uncoupled analysis to be one in which data is passed through sequentially from onemodel to another, requiring only one solution for each model.
There has been some recent work developing coupled aero-propulsive models for supersonic applications. Heathet al. [37] manually coupled a RANS analysis to a propulsion model by matching the flow areas and states betweenthe two, and by using the propulsion model to predict the static pressure for the fan-face boundary condition. Theycompared the installed performance and sonic boom for two discrete inlet designs, and the limited number of configu-rations made manual coupling a reasonable approach. Connolly et al. [20] developed a transient coupled model usingan Euler aerodynamic model and 1D gas-dynamics propulsion model for aero-propulso-servo-elasticity applications.They iterated by passing boundary condition values at the interfaces between the two models at every time step tocompute state derivatives for the time integration.
Our work uses a similar scheme to that of Connolly et al. [20], where thermodynamic states are exchanged bythe two models. However, our method differ in key implementation details. Their implementation integrates thepropulsion model directly into the aerodynamic solver, including the coupling terms as additional state variablesto be converged with the rest of the simulation. Our method relies on the OpenMDAO framework to manage themultidisciplinary analysis and converge the simulation [33]. This approach is less intrusive because if requires nomodifications to either analysis code, allowing for a more complex solver structure.
The fully coupled aero-propulsive simulation was built with a two-level solver scheme shown in Fig. 5, whichwas used for both podded and BLI configurations. The top level is converged by a nonlinear Gauss–Seidel solverthat manages three residuals defined by the following coupling variables: fan-face total pressure (pFF
t ), fan-face totaltemperature (T FF
t ), and propulsor mass flow rate (mprop). The inner level is converged using a Broyden solver thathandles two additional residuals: RFF
psand Rdnac . The mass flow rate between the fan-face and fan-exit boundary
conditions is balanced by varying fan-face static pressure (pFFs ) to converge the static pressure residual:
RFFps
= mFF − mFE . (3)
The mass flow rate between the aerodynamic and propulsion simulations is balanced by varying the nacelle diameter(dnac) to converge the nacelle diameter residual:
Rdnac = mprop − mFE . (4)
6 of 17
American Institute of Aeronautics and Astronautics

RFFpt,RFF
TtpyCycle mprop, pFEt , T FE
t
Broyden dnac, pFFs
Rpropm pFFt , T FF
t Rdnac ,RFFps ADflow
Figure 5. XDSM [38] for the coupled aero-propulsive analysis.
This last residual is formulated based on the assumption of a fixed input shaft power of 3,500 hp. This assumptionprovides a convenient way to compare different propulsor designs. Since they both have the same amount of inputpower, the configuration that provides the highest overall Fx is the most efficient.
Note that an alternate reference point is also possible for which the power (and hence mprop) would be varied toachieve steady flight (Fx = 0). In this case, the design with the lowest power input to the propulsor would be themost efficient. Ultimately, this approach was discarded because part of the STARC-ABL thrust is produced by theunder-wing engines. It is not yet clear what the best thrust split between the under-wing engines and BLI propulsorwould be, and the fixed-power scheme lends itself more naturally to a problem formulation with a variable thrust split.
IV. ResultsWe conducted a trade study by performing a parameter sweep of FPR from 1.2 to 1.35, and then comparing the
performance of the podded configuration to that of the BLI configuration. For the podded configuration, we assumethat changes to the fuselage only affect Ffuse, and changes to the propulsion system only affect Fprop. With BLI, thisassumption is no longer valid, and the performance metric is based on the net force in the axial direction (Fx) on thecombined fuselage-propulsor system. However, it is still useful to examine Fprop and Ffuse to understand how thesequantities vary across the propulsor design space, and how the net performance is achieved.
All forces are nondimensionalized as follows:
CF =2F
ρ∞V 2∞Aref
, (5)
where Aref is the reference wing area for the STARC-ABL aircraft. The values used in the nondimensionalization arelisted in Table 1. This table includes a reference length, lref, whose value is the baseline outer nacelle radius and willbe used to nondimensionalize the coordinates in the boundary layer.
In our convention, the sign of the force indicates the direction of action: Positive values represent forward forcethat would cause acceleration, while negative values represent backward force that would cause deceleration. Note thatwe retain this sign convention even when breaking Fx into Fprop and Ffuse, so it is expected that the Fprop be positiveand Ffuse be negative.
Table 1. Reference values used in the nondimensionalization.
p∞ 3.834 psiρ∞ 0.0008 slug/ft3
V∞ 707.3 ft/secAref 1,400 ft2
lref 4 ft
When working with force coefficients it is common to refer to counts of force, which correspond to 104 × CF .The results presented below show that the BLI system outperforms the conventional podded configuration by at least 5force counts across the range of FPR designs considered, and that the aerodynamics and the propulsive improvements
7 of 17
American Institute of Aeronautics and Astronautics

both contribute equally to the gains. Thus, a fully coupled analysis is necessary to accurately capture the full BLIeffect.
Figure 6. Converged flow solutions for FPR = 1.2 (top), FPR = 1.35 (middle), and the clean fuselage (bottom) designs
The aerodynamic benefit of the BLI configuration is shown qualitatively in Fig. 6, which plots contours of Machnumber. The bottom image represents the clean fuselage, the middle one is a BLI configuration with FPR = 1.35,and the top one is a BLI configuration with FPR = 1.2. As the FPR is reduced for a fixed input power to the fan, themass flow rate increases, requiring a larger nacelle. The diameter of the nacelle has a strong influence on the height ofthe boundary layer on the aft fuselage. The largest nacelle, for FPR = 1.2, also has the thickest boundary layer. Theboundary layer heights (δ) measured at the nacelle lip for the three configurations are listed in Table 2. The boundarylayer grows 15% between the podded configuration and the FPR = 1.35 BLI configuration, while for the FPR = 1.2design it grows by 25%. This variation in the boundary layer profile as a function of the nacelle design demonstratesa sensitivity of the aerodynamics with respect to the propulsion design variable (FPR).
Table 2. Boundary layer height at the nacelle lip for podded and BLI configurations.
Configuration δ (ft) Change
Podded 4.0 0 %BLI with FPR = 1.35 4.6 15%BLI with FPR = 1.20 5.0 25%
A. Net force as a function of FPRThe calculation of CFx
must be handled slightly differently for the podded and BLI configurations. For the poddedconfiguration, the force on the fuselage is constant and is independent of any changes to the pod. Therefore, thecontribution of the fuselage can be computed at the given flight condition, and then combined with the contribution
8 of 17
American Institute of Aeronautics and Astronautics

from the podded propulsor for any given FPR as follows:
CFx= CFprop + CFfuse , (6)
where CFfuse = −0.008321.For the BLI configuration, we compute the net force integration on the whole wetted surface, and fan-face and fan
exit, as detailed in Eqn. (2). A comparison of CFx between the podded and BLI configurations is plotted in Fig. 7.The primary conclusion from Fig. 7 is that BLI offers an additional 24 to 27 of net force counts. That represents a 33%increase relative to the conventional podded configuration. The data also shows two key trends: first, for the poddedconfiguration net force is insensitive to FPR; and second, the BLI configuration clearly performs better at lower FPRdesigns. We can gain further insight into these trends by breaking CF -x down into CFfuse and CFprop to look at thecontributions from each discipline.
11.321
7.962
15.716
Figure 7. Net force on the body (fuselage and propulsor) as a function of design FPR.
B. Propulsor force as a function of FPRFigure 8 shows the variation of the propulsor force with FPR for both podded and BLI configurations. For the poddedconfiguration, where Ffuse is constant, the variation in CF -x is solely due to changes in Fprop at different FPR designs.Figure 8 shows that there is only a 1.4 force count variation in Fprop as a function of FPR for the podded configuration.This result might be surprising if viewed from a purely thermodynamic perspective. Thermodynamics would predictthat Fprop would increase as the FPR is lowered due to higher propulsive efficiency and a higher adiabatic efficiency—defined by Eqn. (1). However, the coupled analysis accounts for both thermodynamic and aerodynamics effects. Whilethe net thrust does go up, the nacelle drag also increases by nearly as much, and hence, the net effect is a fairly flatresponse, with slightly better performance near FPR = 1.25.
The drag increases for lower FPR designs because there is a stronger shock on the outer surface of the nacellefor the larger nacelles, as seen in Fig. 9. The presence of that shock in both configurations indicates that the nacellegeometry is not ideal. In fact, we can see that the same effect is present for the BLI configuration by looking at Fig. 6,where the area of high speed flow is larger for the FPR = 1.2 configuration on top. Although we would normallyexpect the larger nacelle with a correspondingly larger fan to have more drag, it is possible that some of the adverseeffects are mitigated by a better geometry. Future work will use shape optimization to allow for optimal inlet nacelleshaping for each design. However, since this suboptimal inlet design is used for all the cases presented herein, ourperformance comparison is still valid.
The propulsor force trend for the BLI configuration in Fig. 8 is different from the trend in Fig. 7. For FPR = 1.35,the BLI configuration outperforms the podded configuration by 15.8 force counts. For FPR = 1.2, the difference is
9 of 17
American Institute of Aeronautics and Astronautics
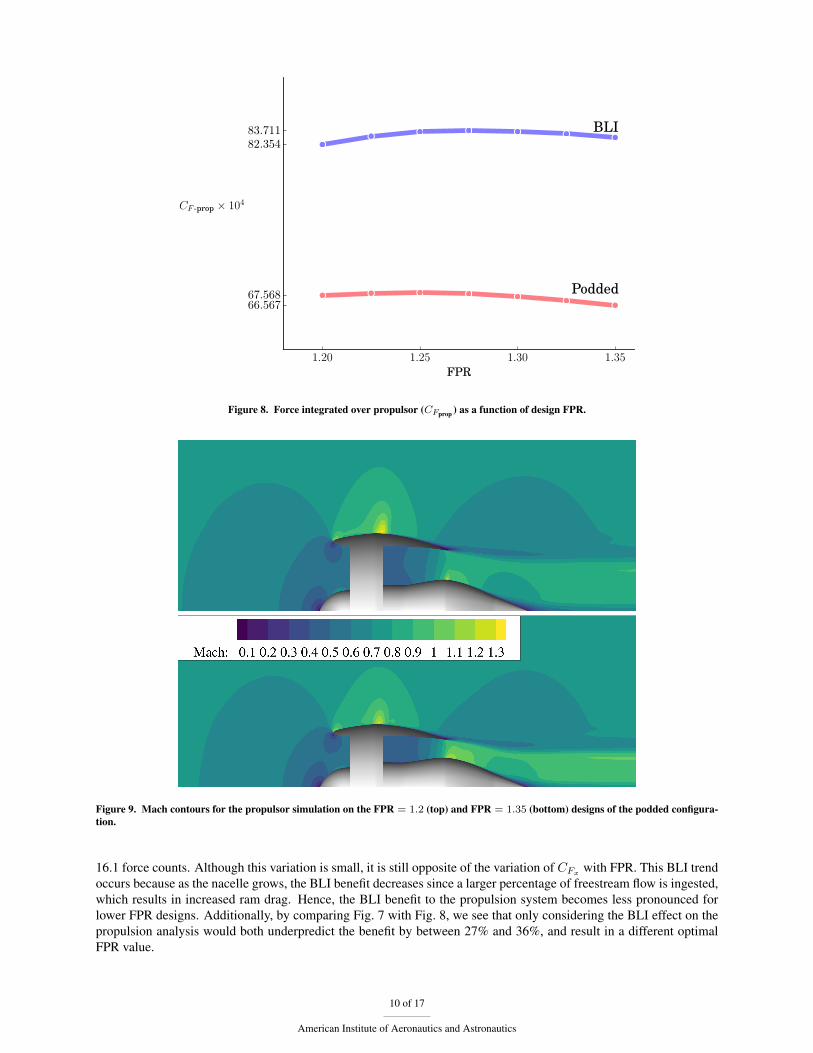
83.71182.354
67.56866.567
Figure 8. Force integrated over propulsor (CFprop ) as a function of design FPR.
Figure 9. Mach contours for the propulsor simulation on the FPR = 1.2 (top) and FPR = 1.35 (bottom) designs of the podded configura-tion.
16.1 force counts. Although this variation is small, it is still opposite of the variation of CFxwith FPR. This BLI trend
occurs because as the nacelle grows, the BLI benefit decreases since a larger percentage of freestream flow is ingested,which results in increased ram drag. Hence, the BLI benefit to the propulsion system becomes less pronounced forlower FPR designs. Additionally, by comparing Fig. 7 with Fig. 8, we see that only considering the BLI effect on thepropulsion analysis would both underpredict the benefit by between 27% and 36%, and result in a different optimalFPR value.
10 of 17
American Institute of Aeronautics and Astronautics

The difference in magnitude and trend between CFprop and CFx highlights the importance of using a fully coupledanalysis to study BLI. Another important difference between the uncoupled and coupled modeling can be seen byexamining the mass-averaged fan-face total pressure, which is defined as
pFFt =
∫ dnac
0pt(y)m(y)dy∫ dnac
0m(y)dy
. (7)
For an uncoupled analysis, where we assume that the aerodynamics are unchanged from the podded configuration,pt(y) and m(y) in Eqn. 7 are extracted from the boundary layer profile of the clean fuselage in the podded configu-ration, and are independent of any propulsion design variable. Therefore, for uncoupled analysis, pFF
t only dependson the nacelle diameter. This type of analysis was used by Welstead and Felder [4] in their study of the STARC-ABLconfiguration, and by Liu et. al [16] and Laskaridis et al. [17] in their studies of a HWB turbo-electric distributedpropulsion configuration.
When the analysis is fully coupled, pFFt and m are not only a function of the nacelle diameter, but a function of the
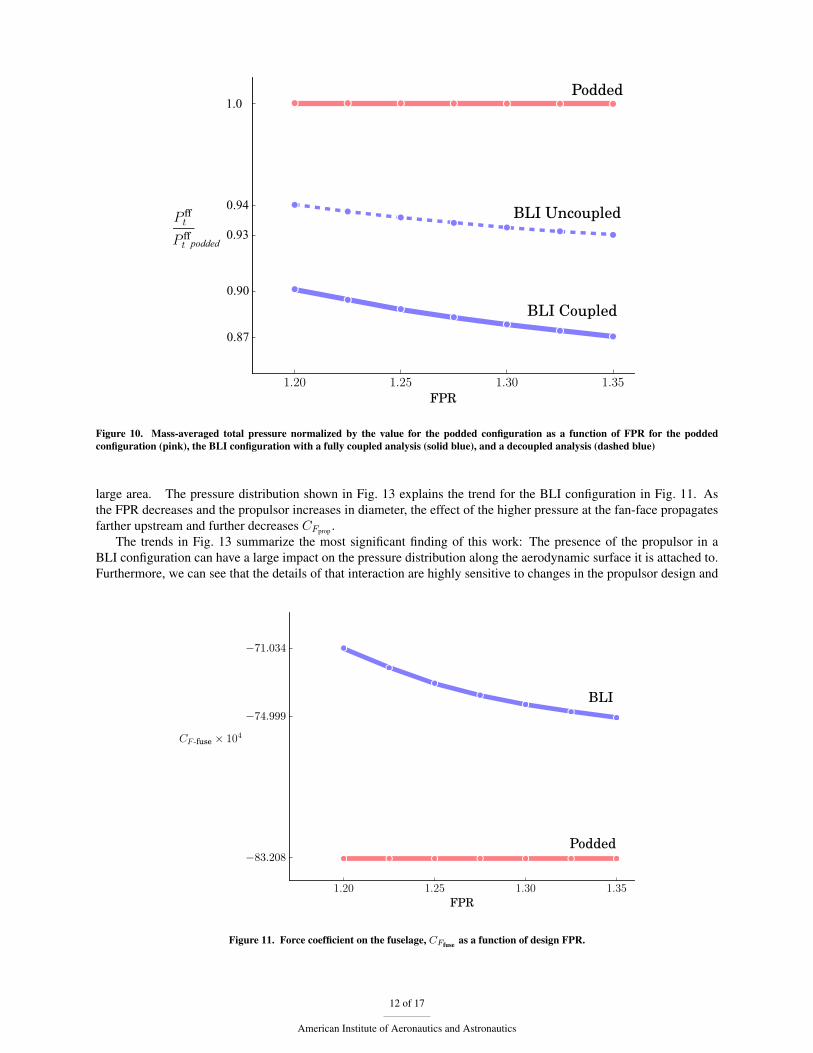
propulsor design as well, through the FPR.Figure 10 compares pt as a function of FPR between podded configuration and the BLI configuration. The BLI
results are computed using both uncoupled, and coupled analyses. For the podded configuration, pFFt is independent
of FPR, since the inlet just ingests from the freestream. The BLI configuration uncoupled analysis (dashed blue line),does capture the inverse relationship of pFF
t with FPR, but it overpredicts pFFt by between 4% and 6% compared to the
coupled method (solid blue line).This overprediction is significant: For an electrically driven propulsor, a 5% lower pt means a that the nozzle
pressure ratio decreases by the same percentage, and the result is a similar decrease in thrust. This effect would beeven more pronounced for a BLI design using a conventional turbofan, where the additional total pressure loss wouldhave a direct impact on the overall pressure ratio and thermal efficiency of the engine. Thus, it is crucial to considerthe aerodynamic changes caused by the presence of the propulsor using a coupled analysis.
C. Fuselage force as a function of FPRFigure 11 shows the aerodynamic contribution to the overall performance. The podded data is constant by definition,since there is no aerodynamic interaction between the propulsor and the fuselage. The BLI configuration has betterCFfuse for all designs by at least 8.2 force counts. However, unlike the forces on the propulsor, CFfuse for the BLIconfiguration exhibits a strong variation with FPR. From the FPR = 1.35 design to the FPR = 1.2 design, the CFfuse
improves by an additional 4.0 counts. The total variation in CFfuse is larger than the total variation in CFprop observed inFig. 8, indicating that the aerodynamic performance is more sensitive to FPR—a propulsor design variable—than tothe propulsor performance.
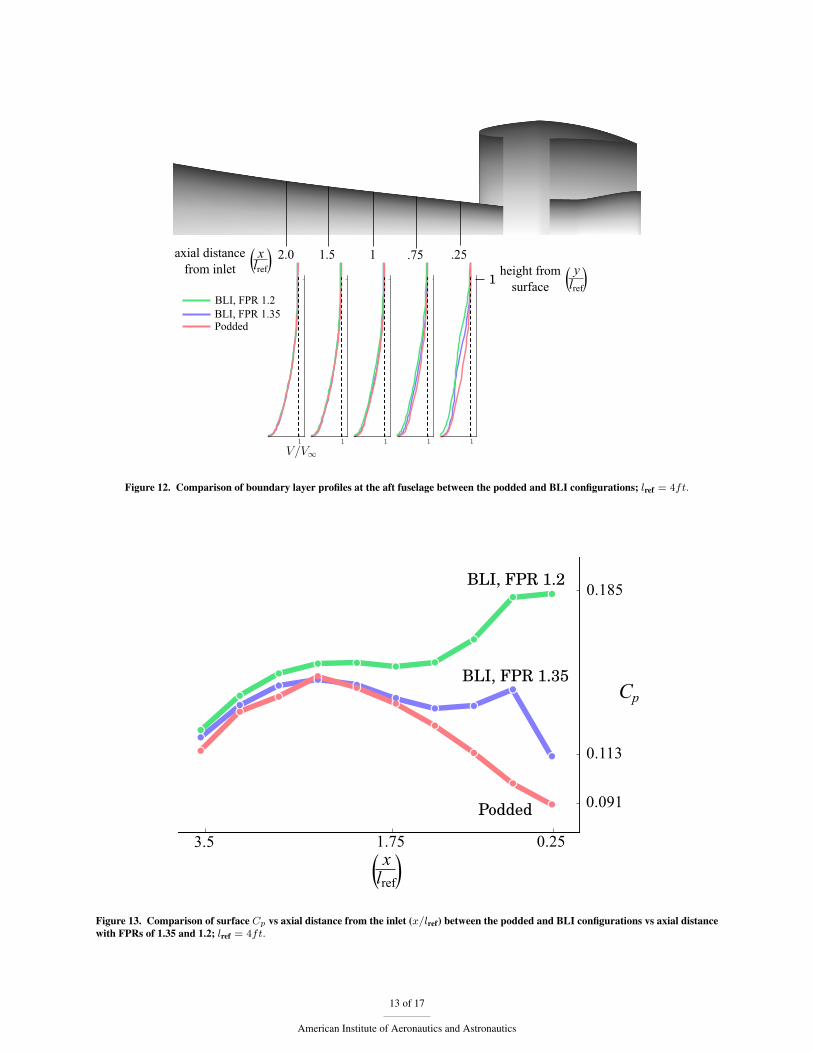
The sensitivity of the aerodynamics to FPR in the BLI configuration is due to variations in the flow field in theaft fuselage. We can see this effect qualitatively in Fig. 6. The actual velocity profiles for the podded configuration,and the BLI configuration for FPRs of 1.35 and 1.2 are shown in Fig. 12, where all distances are normalized by thebaseline nacelle outer radius, lref = 4 ft. We see that the propulsor slows down the flow near the surface, and that thiseffect extends to about one nacelle radius forward of the fan-face. Also, the larger propulsor for the FPR = 1.2 designhas a more significant impact on the flow than the smaller propulsor for FPR = 1.35.
The boundary layer profiles demonstrate that the flow on the aft fuselage is influenced by the aft propulsor, andhence provide an aerodynamic justification for the results shown in Fig. 10. These profiles explain why the coupledanalysis predicts a lower pFF
t than the uncoupled analysis. Even for the uncoupled analysis, the dashed-blue line inFig. 10 shows a loss of total pressure that varies with FPR, and thus with nacelle diameter as well. However, theuncoupled analysis assumes that the boundary layer velocity profile is fixed and independent of the propulsor design.The fully coupled analysis captures the change in the boundary layer as the propulsor diameter changes, which furtherlowers the total pressure compared to what the uncoupled analysis predicts. The lower flow speeds in the boundarylayer might also partially explain the reduced CFprop in the BLI configuration. However, the difference in boundarylayer profiles only propagates about one nacelle radius forward, and qualitatively does not seem to indicate a significantreduction in viscous losses to justify the full effect seen in CFprop .
To better understand the aerodynamic cause for the change inCFprop , we examined theCp distribution on the surfaceof the aft fuselage. Figure 13 confirms that there is a significant difference in the pressure along the aft fuselage, but italso shows that the effect reaches farther upstream on the fuselage than the variation in boundary layer profiles. TheCp near the fan-face changes by 50%, but even at 3.5 nacelle radii away from the inlet, there are still differences in theCp. Hence, the surface pressure effects of the BLI propagate much farther forward than the changes in the velocityprofile would suggest. Even small variations in Cp can have a large effect on the body forces, since they act over a
11 of 17
American Institute of Aeronautics and Astronautics
podded
1.0
0.94
0.93
0.90
0.87
Figure 10. Mass-averaged total pressure normalized by the value for the podded configuration as a function of FPR for the poddedconfiguration (pink), the BLI configuration with a fully coupled analysis (solid blue), and a decoupled analysis (dashed blue)
large area. The pressure distribution shown in Fig. 13 explains the trend for the BLI configuration in Fig. 11. Asthe FPR decreases and the propulsor increases in diameter, the effect of the higher pressure at the fan-face propagatesfarther upstream and further decreases CFprop .
The trends in Fig. 13 summarize the most significant finding of this work: The presence of the propulsor in aBLI configuration can have a large impact on the pressure distribution along the aerodynamic surface it is attached to.Furthermore, we can see that the details of that interaction are highly sensitive to changes in the propulsor design and
71.034
74.999
83.208
Figure 11. Force coefficient on the fuselage, CFfuse as a function of design FPR.
12 of 17
American Institute of Aeronautics and Astronautics
xl
Figure 12. Comparison of boundary layer profiles at the aft fuselage between the podded and BLI configurations; lref = 4ft.
xl
Figure 13. Comparison of surface Cp vs axial distance from the inlet (x/lref) between the podded and BLI configurations vs axial distancewith FPRs of 1.35 and 1.2; lref = 4ft.
13 of 17
American Institute of Aeronautics and Astronautics

shaft input power, which affects the static pressure distribution.Our results show that there is an inverse relationship between the change in the mean static pressure on the fuselage
and FPR, but this relationship could be altered by varying other aspects of the propulsor design not considered here.The fan-face static pressure—which affects the static pressure distribution on the aft fuselage—is a function of boththrottle setting and inlet design. Throttling down would increase the fan-face static pressure and thus mean staticpressure, while throttling up would decrease it. Even for a fixed FPR and throttle setting, the inlet design could stillallow an extra degree of design freedom. By making the inlet more or less diffusive you can alter the interdisciplinarycoupling between the fan-face static pressure and the aft fuselage static pressure distribution. Such inlet design changeswould have an impact on propulsor performance, but the multidisciplinary effects would allow aero-propulsive tradesto seek highest overall system efficiency.
V. ConclusionsWe presented a new approach for building coupled aero-propulsive analyses of BLI propulsion systems using a
1D cycle model and a RANS aerodynamic model. The approach was implemented in the OpenMDAO framework,using pyCycle and ADflow for the propulsion and aerodynamic analyses, respectively. A simplified version of NASA’sSTARC-ABL configuration was modeled, and a parameter sweep of propulsor FPR from 1.2 to 1.35 was performedto study the coupled performance of the aft-mounted BLI propulsor and characterize the contributions from eachdiscipline.
The coupled analysis shows that BLI offers at least 24 force counts of increased performance relative to the poddedconfiguration across the FPR range. This represents a 23% increase in thrust relative to the 67 force counts of thrustfor the podded configuration, which clearly demonstrates the large potential for performance improvement due to BLIin this configuration.
The trends were further analyzed by breaking the net force down into aerodynamic and propulsive contributions.The breakdown of the improvements shows that 8 to 12 force counts were due to aerodynamics and 16 counts weredue to propulsion. Thus, the BLI configuration benefits from aerodynamics and propulsion are essentially of equalimportance. These results demonstrate the need for a fully coupled model to predict the performance of the BLIconfiguration, since considering only propulsion or only aerodynamics would only achieve a fraction of the possibleimprovement.
The BLI benefit to the propulsion system arises primarily from a decrease in incoming momentum flux (a reductionin ram drag). The thrust data presented here shows that this benefit is only a weak function of FPR because of theoffsetting thermodynamic improvements and nacelle drag increases. It is possible that a more refined nacelle geometrywould alleviate some of the drag penalties for the lower FPR designs shown here, and thus change the trend withrespect to FPR, but the general effect of decreased ram drag would persist.
The BLI benefit to the aerodynamics was due to higher mean static pressure along the aft section of the fuselagerelative to the clean fuselage in the podded configuration, and this higher pressure was caused by the influence of theBLI fan. In the podded configuration the fan-face static pressure is higher than the local static pressure on the aftsection of the clean fuselage. When the propulsor is moved down onto the fuselage the relatively higher fan-face staticpressure is able to favorably alter the mean static pressure on the aft-fuselage without adversely affecting the pressureforces on the propulsor.
The reduced ram-drag on the propulsor combined with the increased mean static pressure along the aft fuselagecombine to create the mutually beneficial affects in the BLI configuration. While the propulsion effect was slightlylarger in magnitude, the aerodynamic effect was far more sensitive to FPR. This occurred because, with a fixed inputshaft power, the FPR effectively determines the nacelle diameter (i.e., a lower FPR means a larger nacelle). Thediameter of the nacelle had a direct effect on how far upstream the BLI effects propagated and meant that lower FPRdesigns had a much larger aerodynamic effect and a strong multidisciplinary coupling.
The variation in pressure along the surface of the aft fuselage indicates that BLI propulsion systems can have astrong impact on the static pressure distribution of the associated aerodynamic surfaces. For the STARC-ABL config-uration, this yields a decrease in drag, but other configurations, such as the MIT D8 or the turbo-electric distributedpropulsion HWB, could potentially see additional aerodynamic effects. For these aircraft, the variation in the surfacepressure caused by the BLI propulsion system could cause not only propulsion-dependent drag effects, but also lift andpitching moments. This means that BLI could ultimately result in throttle-dependent angle of attack and trim settings.
The overall performance of the BLI configuration depends heavily on both propulsion and aerodynamic perfor-mance and each discipline strongly impacts the other. Both propulsion and aerodynamic performance are impacted bydesign choices from the other discipline. In this work, we considered only a single propulsor design variable(FPR).However, given the strength of the coupling demonstrated by the results the overall performance is likely to be sen-
14 of 17
American Institute of Aeronautics and Astronautics

sitive to other variables, such as fuselage geometry, nacelle geometry, inlet design, and shaft input power. Therefore,to achieve optimal overall performance, a careful balance between aerodynamic and propulsive considerations is re-quired. We will address this in future work, where we will refine this concept using design optimization with agradient-based algorithm and coupled-adjoint analytic derivatives to simultaneously optimize propulsion and aerody-namics design variables.
AcknowledgmentsThe authors would like to acknowledge Bret Naylor, Kenneth Moore, and the rest of the NASA Glenn OpenM-
DAO development team, who have spent countless hours building the framework that has enabled this research. Wewould also like to thank James Felder, of the NASA Glenn Research Center, for lending his time and expertise tomany discussions regarding the propulsion system design of the STARC-ABL configuration. We also gratefully ac-knowledge NASA’s Aeronautics Research Mission Directorate Transformational Tools and Technologies (TTT) andthe Advanced Air Transport Technologies (AATT) projects for their continued support of this work.
15 of 17
American Institute of Aeronautics and Astronautics

References[1] Betz, A. and Albring, W., “Introduction to the Theory of Flow Machines,” ZAMM - Journal of Applied Mathe-
matics and Mechanics / Zeitschrift fr Angewandte Mathematik und Mechanik, Vol. 47, No. 2, 1967, pp. 140–141.doi:10.1002/zamm.19670470224.
[2] Wislicenus, G. F., “Hydrodynamics and Propulsion of Submerged Bodies,” Journal of the American Rocket Society, Vol. 30,December 1960, pp. 1140–1148.
[3] Gearhart, W. S. and Henderson, R. E., “Selection of a Propulsor for a Submersible System,” Journal of Aircraft, Vol. 3, No. 1,1966, pp. 84–90.
[4] Welstead, J. R. and Felder, J. L., “Conceptual Design of a Single-Aisle Turboelectric Commercial Transport with FuselageBoundary Layer Ingestion,” 54th AIAA Aerospace Sciences Meeting, AIAA 2016-1027, 2016. doi:10.2514/6.2016-1027.
[5] Felder, J. L., Kim, H. D., and Brown, G. V., “Turboelectric Distributed Propulsion Engine Cycle Analysis for Hybrid-Wing-Body Aircraft,” 47th AIAA Aerospace Sciences Meeting including The New Horizons Forum and Aerospace Exposition, AIAA2009-1132, 2009. doi:10.2514/6.2009-1132.
[6] Daggett, D. L., Kawai, R., , and Friedman, D., “Blended Wing Body Systems Studies: Boundary Layer Ingestion Inlets WithActive Flow Control,” Tech. Rep. NASA/CR-2003-212670, NASA Langley Research Center, December 2003.
[7] Smith, A. M. O. and Roberts, H. E., “The Jet Airplane Utilizing Boundary Layer Ingestion for Propulsion,” Journal ofAeronautical Sciences, Vol. 14, No. 2, 1947, pp. 97–109.
[8] Smith, L. H., “Wake Ingestion Propulsion Benefit,” Journal of Propulsion and Power, Vol. 9, No. 1, February 1993, pp. 74–82.doi:10.2514/6.1991-2007.
[9] Drela, M., “Power Balance in Aerodynamic Flows,” AIAA Journal, Vol. 47, No. 7, 2009, pp. 1761–1771. doi:10.2514/1.42409.
[10] Arntz, A., Atinault, O., and Merlen, A., “Exergy-Based Formulation for Aircraft Aeropropulsive Performance Assessment:Theoretical Development,” AIAA Journal, Vol. 53, No. 6, 2015, pp. 1627–1639. doi:10.2514/1.J053467.
[11] Arntz, A. and Atinault, O., “Exergy-Based Performance Assessment of a Blended WingBody with Boundary-Layer Inges-tion,” AIAA Journal, Vol. 53, No. 12, 2015, pp. 3766–3776. doi:10.2514/1.J054072.
[12] Hardin, L., Tillman, G., Sharma, O., Berton, J., and Arend, D., “Aircraft System Study of Boundary Layer Ingesting Propul-sion,” 48th AIAA/ASME/SAE/ASEE Joint Propulsion Conference and Exhibit, AIAA-2012-2993, 2012. doi:10.2514/6.2012-3993.
[13] Kim, H. and Liou, M.-S., “Optimal Inlet Shape Design of N2B Hybrid Wing Body Configuration,” Proceedings of the 48thAIAAASME/SAE/ASEE Joint Propulsion Conference and Exhibit, AIAA-2012-3917, 2012. doi:10.2514/6.2012-3917.
[14] Kim, H. and Liou, M.-S., “Optimal Shape Design of Mail-Slot Nacelle on N3X Hybrid Wing-Body Configuration,” Proceed-ings of the 31st AIAA Applied Aerodynamics Conference, AIAA-2013-2413, 2013. doi:10.2514/6.2013-2413.
[15] Blumenthal, B., Elmiligui, A. A., Geiselhart, K., Campbell, R. L., Maughmer, M. D., and Schmitz, S., “Computational In-vestigation of a Boundary-Layer Ingestion Propulsion System for the Common Research Model,” 46th AIAA Fluid DynamicsConference, Aviation Forum, AIAA 2016-3812, 2016. doi:10.2514/6.2016-3812.
[16] Liu, C., Doulgeris, G., Laskaridis, P., and Singh, R., “Thermal cycle analysis of turboelectric distributed propulsionsystem with boundary layer ingestion,” Aerospace Science and Technology, Vol. 27, No. 1, 2013, pp. 163 – 170.doi:http://dx.doi.org/10.1016/j.ast.2012.08.003.
[17] Laskaridis, P., Pachidis, V., and Pilidis, P., “Opportunities and challenges for distributed propulsion and boundary layeringestion,” Aircraft Engineering and Aerospace Technology, Vol. 86, No. 6, 2014, pp. 451–458. doi:10.1108/AEAT-05-2014-0067.
[18] Jones, S., An Introduction to Thermodynamic Performance Analysis of Aircraft Gas Turbine Engine Cycles Using the Numer-ical Propulsion System Simulation Code, 2007, NASA TM-2007-214690.
[19] Perullo, C., Trawick, D., Clifton, W., Tai, J. C., and Mavris, D. N., “Development of a suite of hybrid electric propulsionmodeling elements using NPSS,” ASME Turbo Expo 2014: Turbine Technical Conference and Exposition, 2014.
[20] Joseph W. Connolly, Pawel Chwalowski, M. D. S. J.-r. C. W. A. S. J. J. M. and Kopasakis, G., “Towards an Aero-Propulso-Servo-Elasticity Analysis of a Commercial Supersonic Transport,” 15th Dynamics Specialists Conference, AIAA SciTechForum, 2016. doi:http://dx.doi.org/10.2514/6.2016-1320.
16 of 17
American Institute of Aeronautics and Astronautics

[21] Drela, M. and GILES, M., “Viscous-inviscid analysis of transonic and low Reynolds number airfoils,” AIAA Journal, Vol. 25,No. 10, 1987, pp. 1347–1355. doi:10.2514/3.9789.
[22] Lock, R. C. and Williams, B. R., “Viscous-inviscid interactions in external aerodynamics,” Progress in Aerospace Sciences,Vol. 24, 1987, pp. 51–171.
[23] Drela, M., “Three-Dimensional Integral Boundary Layer Formulation for General Configurations,” 21st AIAA ComputationalFluid Dynamics Conference, Fluid Dynamics and Co-located Conferences, AIAA 2013-2437, 2014. doi:10.2514/6.2013-2437.
[24] Lyu, Z., Kenway, G. K. W., and Martins, J. R. R. A., “Aerodynamic Shape Optimization Investigations of the CommonResearch Model Wing Benchmark,” AIAA Journal, Vol. 53, No. 4, April 2015, pp. 968–985. doi:10.2514/1.J053318.
[25] Lyu, Z., Kenway, G. K., Paige, C., and Martins, J. R. R. A., “Automatic Differentiation Adjoint of the Reynolds-AveragedNavier–Stokes Equations with a Turbulence Model,” 21st AIAA Computational Fluid Dynamics Conference, San Diego, CA,Jul. 2013. doi:10.2514/6.2013-2581.
[26] Lyu, Z. and Martins, J. R. R. A., “Aerodynamic Design Optimization Studies of a Blended-Wing-Body Aircraft,” Journal ofAircraft, Vol. 51, No. 5, September 2014, pp. 1604–1617. doi:10.2514/1.C032491.
[27] Chen, S., Lyu, Z., Kenway, G. K. W., and Martins, J. R. R. A., “Aerodynamic Shape Optimization of the Com-mon Research Model Wing-Body-Tail Configuration,” Journal of Aircraft, Vol. 53, No. 1, January 2016, pp. 276–293.doi:10.2514/1.C033328.
[28] Martins, J. R. R. A., Alonso, J. J., and Reuther, J. J., “High-Fidelity Aerostructural Design Optimization of a SupersonicBusiness Jet,” Journal of Aircraft, Vol. 41, No. 3, 2004, pp. 523–530. doi:10.2514/1.11478.
[29] Martins, J. R. R. A., Alonso, J. J., and Reuther, J. J., “A Coupled-Adjoint Sensitivity Analysis Method forHigh-Fidelity Aero-Structural Design,” Optimization and Engineering, Vol. 6, No. 1, March 2005, pp. 33–62.doi:10.1023/B:OPTE.0000048536.47956.62.
[30] Kenway, G. K. W., Kennedy, G. J., and Martins, J. R. R. A., “Scalable parallel approach for high-fidelity steady-state aeroe-lastic analysis and adjoint derivative computations,” AIAA Journal, Vol. 52, 2014, pp. 935–951. doi:10.2514/1.J052255.
[31] Kenway, G. K. W. and Martins, J. R. R. A., “Multipoint High-fidelity Aerostructural Optimization of a Transport AircraftConfiguration,” Journal of Aircraft, Vol. 51, 2014, pp. 144–160. doi:10.2514/1.C032150.
[32] Liem, R. P., Kenway, G. K. W., and Martins, J. R. R. A., “Multimission Aircraft Fuel Burn Minimization via MultipointAerostructural Optimization,” AIAA Journal, Vol. 53, 2015, pp. 104–122. doi:10.2514/1.J052940.
[33] Gray, J. S., Hearn, T. A., Moore, K. T., Hwang, J. T., Martins, J. R. R. A., and Ning, A., “Automatic Evaluation of Multidisci-plinary Derivatives Using a Graph-Based Problem Formulation in OpenMDAO,” 15th AIAA/ISSMO Multidisciplinary Anal-ysis and Optimization Conference, American Institute of Aeronautics and Astronautics, August 2014. doi:10.2514/6.2014-2042.
[34] Hearn, D. T., Hendricks, E., Chin, J., Gray, J., and Moore, D. K. T., “Optimization of Turbine Engine Cycle Analysis withAnalytic Derivatives,” 17th AIAA/ISSMO Multidisciplinary Analysis and Optimization Conference, part of AIAA Aviation2016 (Washington, DC), 2016. doi:10.2514/6.2016-4297.
[35] Gray, J., Chin, J., Hearn, T., Hendricks, E., Lavelle, T., and Martins, J. R. R. A., “Thermodynamics For Gas Turbine Cy-cles With Analytic Derivatives in OpenMDAO,” 57th AIAA/ASCE/AHS/ASC Structures, Structural Dynamics, and MaterialsConference, AIAA SciTech. doi:10.2514/6.2016-0669.
[36] Kenway, G. K., Kennedy, G. J., and Martins, J. R. R. A., “A CAD-Free Approach to High-Fidelity Aerostructural Optimiza-tion,” Proceedings of the 13th AIAA/ISSMO Multidisciplinary Analysis Optimization Conference, No. AIAA 2010-9231, FortWorth, TX, Sept. 2010. doi:10.2514/6.2010-9231.
[37] Heath, C. M., Slater, J. W., and Rallabhandi, S. K., “Inlet Trade Study for a Low-Boom Aircraft Demonstrator,” Journal ofAircraft, 2016. doi:DOI: 10.2514/1.C034036.
[38] Lambe, A. B. and Martins, J. R. R. A., “Extensions to the Design Structure Matrix for the Description of MultidisciplinaryDesign, Analysis, and Optimization Processes,” Structural and Multidisciplinary Optimization, Vol. 46, 2012, pp. 273–284.doi:10.1007/s00158-012-0763-y.
17 of 17
American Institute of Aeronautics and Astronautics