carbon stock estimation in peat swamp forest area of ...forclime.org/merang/rss report...
TRANSCRIPT

Carbon Stock Estimation of Merang Kepayang Area
1
Delegation of the European Commission to Indonesia, Singapore and Brunei Darussalam
South Sumatra Forest Fire Management Project (SSFFMP)
Draft Report
International Consultancy on
Carbon Stock Estimation in Peat Swamp Forest Area of Merang - Kepayang
by
RSS – Remote Sensing Solutions GmbH Wörthstraße 49 81667 München
GERMANY Phone: +49-89-48 95 47 66 Fax: +49-89-48 95 47 67
http://www.rssgmbh.de Email: [email protected]
Prepared by: Florian Moder Florian Siegert
Peter Schlessinger
Date of Consultancy: 11.08.2007 to 05.09.2008 PALEMBANG 04.09.2008

Carbon Stock Estimation of Merang Kepayang Area
2
PREFACE
The South Sumatra Forest Fire Management Project (SSFFMP) is a technical co-operation project jointly funded, in terms of the financing memorandum IDN/RELEX/1999/0103, by the European Commission and by the Government of the Republic of Indonesia through the Ministry of Forestry (MoF).
This report has been completed in accordance with the project’s Second annual Work Plan (AWP II) and
in fulfillment of Activity 3.1.1.3 “conduct a land cover, landuse and peat distribution mapping study in the priority areas, and train counterparts / target groups on-the-job”
and activity 4.1.2 “to provide technical assistance on management & organization to relevant agencies to support improvements to the fire detection and early warning system”
to achieve Result 3 “to create capacities and support initiatives to bring land and natural resources under sustainable management” and Result 4 “to support government and non-government organizations to establish systems to monitor the impact of improved fire management on the environment and people and the results of the work place in the public domain”
to realize the five-year project purpose, which is to “Aid and facilitate the establishment of a coordinated system of fire management at province, district, sub district and village level throughout South Sumatra province in which all involved stakeholders, including the private sector, work together to reduce the negative impact of fire on the natural and social environment.”
This report has been prepared with financial assistance from the Commission of the European Community. The opinions, views and recommendations expressed are those of the author and in no way reflect the official opinion of the Commission.
The report has been prepared by:
MSc. Florian Moder
The report is acknowledged and approved for circulation by the Project Co-Directors when duly signed below.
Palembang, 05.09.2008
Dr. Ir. Dodi Supriadi Dr. Karl-Heinz Steinmann National Co-Director EU Co-Director
Carbon Stock Estimation of Merang Kepayang Area
3
ACKNOWLEDGEMENTS I would like to thank the team leader Dr. Karl Heinz Steinmann and his team members especially the GIS Section of the South Sumatra Fire Management Project for the pleasant work atmosphere in Palembang. I enjoyed a great hospitality in Palembang. Thank you all very much. Terima kasih. ABBREVIATION BMU Bundesministeriums für Umwelt, Naturschutz und Reaktorsicherheit
– Federal Ministry for the Environment, Nature Conservation and Nuclear Safety
BPKH Balai Pemantapan Kawasan Hutan - Forest Mapping Agency C Carbon CDM Clean Development Mechanism CO2 Carbon Dioxide COP Conference of Parties DBH Diameter Breast Height Dinas Kehutanan Ministry of Forestry FDR Fire Danger Rating FIS Fire Information System FTA Fire Threat Analysis GHG Green House Gas GIS Geographical Information System GPS Global Positioning System Gt giga tonne ha hectare HPH Hak Pengusahaan Hutan - logging concession
HPT Hutan Produksi Terbatas - limited production forest HTI Hutan Tanaman Industri – palm oil concession IPCC Intergovernmental Panel on Climate Change km kilometre LCCS Land Cover Classification System Lidar Light Detection and Ranging - optical remote sensing to find range
and/or other information of a distant target m meter MAI Mean Annual Increment of tree growth MODIS Moderate Resolution Imaging Spectroradiometer Mt mega tonne REDD Reducing emissions from deforestation and degradation in
developing countries RHM Rimba Hutani Mas – Concessionaire belonging to Sinar Mas Group RTRWN Rencana Tata Ruang Wilayah National - National Spatial Planning

Carbon Stock Estimation of Merang Kepayang Area
4
Agency RTRWP Rencana Tata Ruang Wilayah Propinsi - Provincial Spatial Planning
Agency SRTM Shuttle Radar Topography Mission SSFFMP South Sumatra Forest Fire Management Project t tonne UNFCCC United Nations Framework Convention on Climate Change

Carbon Stock Estimation of Merang Kepayang Area
5
Executive Summary Deforestation and forest degradation in Merang have been driven by destructive logging and forest clearance – both illegal and legal – for development of agricultural land and plantations. CO2 emissions caused by deforestation, forest degradation and peat decomposition were estimated for the years from 1997 to 2007. These estimates are based on medium resolution satellite data (Landsat) and field measurements. This approach may significantly over- or underestimate the actual emissions because, for many processes, sufficiently detailed data on carbon stocks and carbon emissions (stock decrease) were not available for the past (and present). However, considering all possible errors and uncertainties the results indicate the order of magnitude of the emissions scenario and provide valuable information for decision makers and stakeholders. The carbon stock of the Merang Peat Dome Forest was calculated based on peat corings, conducted by the University of Palembang. The peat dome stores approximately 102 Mt C. The maximum peat depth is about 6 m and averages about 1.3 m. The carbon stored above ground was calculated to be about 24 Mt C in 2007; however, the carbon release in the recent last ten years was 66 Mt CO2 due to peat fires, with peaks in the years 1997 and 2006. Another big carbon emission factor in the last 20 years was peat oxidation caused by lowering of the water table (peat draining) and land use change. Oxidation was calculated to have emitted about 26 Mt CO2, tending to increase as a result of ongoing conversion of peat forest to acacia and palm oil plantations. The current ongoing land use change process, also known as the “business as usual scenario”, predicts an overall tripled yearly net emission of CO2 (from 6 Mt to 18 Mt/year) due to the systematic conversion of the peat forest to plantation. Net emission could be reduced by 4 Mt CO2 per year through a potential project implementation of the BMU (Federal Ministry for the Environment, Nature Conservation and Nuclear Safety) in cooperation with concessionaires.
Carbon Stock Estimation of Merang Kepayang Area
6
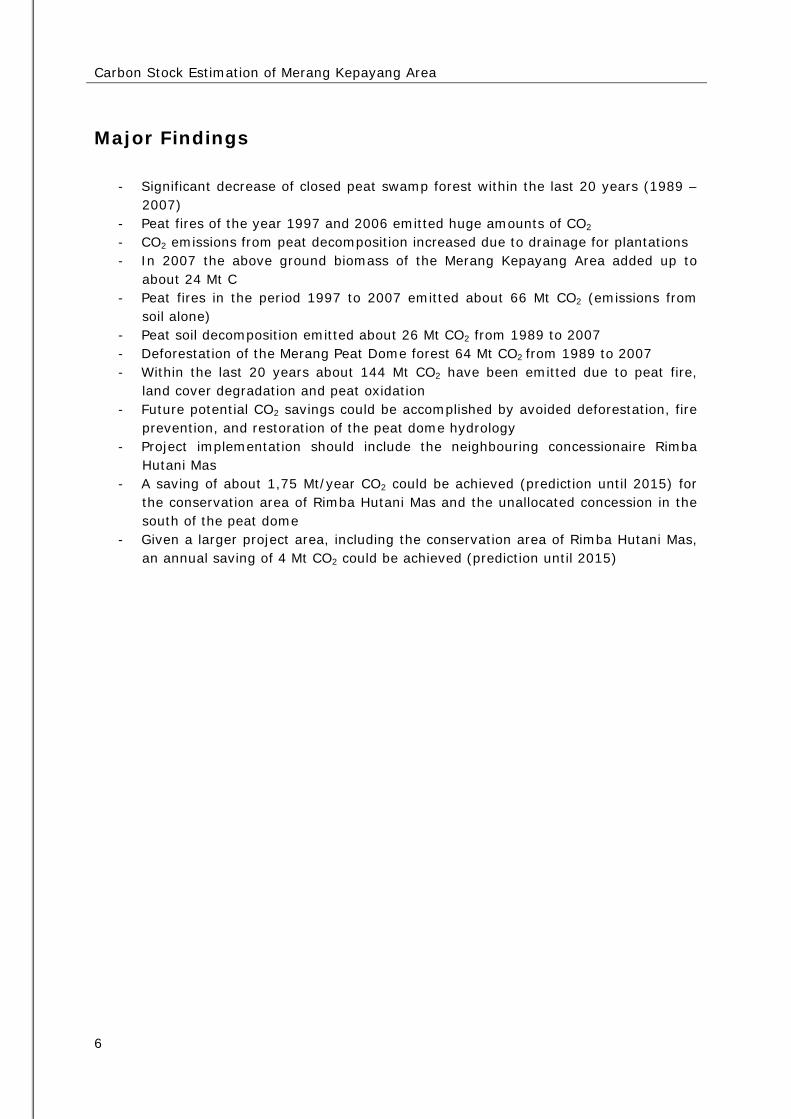
Major Findings
- Significant decrease of closed peat swamp forest within the last 20 years (1989 – 2007)
- Peat fires of the year 1997 and 2006 emitted huge amounts of CO2 - CO2 emissions from peat decomposition increased due to drainage for plantations - In 2007 the above ground biomass of the Merang Kepayang Area added up to
about 24 Mt C - Peat fires in the period 1997 to 2007 emitted about 66 Mt CO2 (emissions from
soil alone) - Peat soil decomposition emitted about 26 Mt CO2 from 1989 to 2007 - Deforestation of the Merang Peat Dome forest 64 Mt CO2 from 1989 to 2007 - Within the last 20 years about 144 Mt CO2 have been emitted due to peat fire,
land cover degradation and peat oxidation - Future potential CO2 savings could be accomplished by avoided deforestation, fire
prevention, and restoration of the peat dome hydrology - Project implementation should include the neighbouring concessionaire Rimba
Hutani Mas - A saving of about 1,75 Mt/year CO2 could be achieved (prediction until 2015) for
the conservation area of Rimba Hutani Mas and the unallocated concession in the south of the peat dome
- Given a larger project area, including the conservation area of Rimba Hutani Mas, an annual saving of 4 Mt CO2 could be achieved (prediction until 2015)

Carbon Stock Estimation of Merang Kepayang Area
7
Recommendations The current study, conducted for SSFFMP in 2008, highlights the driving factors of the emissions of the greenhouse gas relevant CO2, the current carbon stock, and future estimation of CO2 emissions of the Merang Kepayang Forest, based on different scenarios. The SSFMP project itself focuses on an extension with the objective of establishing a REDD Pilot prior to 2012, as suggested during the World Climate Conference in Bali 2007. For such a REDD Pilot, it is necessary to estimate the CO2 savings that might be achieved by sustainable land use in comparison with a “business as usual scenario”. To do so, it is necessary to determine reliable figures on the current carbon stock and changes in area. The study uses the current carbon status to develop future carbon dioxide emissions based on the previous land conversion factors. The above- and below ground biomass carbon stock, however, requires a much more detailed assessment in order to satisfy the REDD requirements (IPCC conform). For that, the following suggestions are given: The below ground biomass was calculated using data collected during several peat coring surveys. Due to severe restrictions in accessibility, the corings were not distributed equally on the Merang peat dome as it would be required for precise 3D modeling. No corings are available for the south, where the project area is allocated. As a consequence, the average peat depth is only 1.3 meters, which is a severe underestimate. It is therefore recommended, to conduct further peat corings in the planned project area as already described by Ballhorn in a previous report for SSFFMP (Ballhorn, 2007). A new method to determine peat depth was developed recently by the Technical University of Munich, which uses electrical resistance measurements in the peat soil to determine peat depth. This method has been tested successfully by RSS in boreal peat domes. This method is much more accurate than peat coring (measurements every 8 meters instead of every 500-1000 meters) and quicker to perform. If Merang becomes a CDM or REDD pilot, it is strongly recommended to assess peat carbon stock using this method. Peat loss and correlated CO2 emissions due to peat fires should be also monitored closely. It is desired to reduce uncontrolled fires to a minimum. The burn depth of fire in peat soils relates to a complex set of factors, such as humidity of the organic soil, organic content, location, and depth of the water table; peat fire burn depths are therefore very difficult to estimate due to the unavailability of data and the variability of the peat ecosystem. Nevertheless, it is necessary to monitor ongoing processes. For peat loss due to peat fires, it is recommended to pound sticks of mild steel into to the organic floor, evenly-spaced on a regular grid of known positions. After each fire event, the degree of peat loss can be measured by the height of the steel posts above the ground. Peat decomposition due to oxidative processes is mainly related to the depth of the water

Carbon Stock Estimation of Merang Kepayang Area
8
table in the organic soil layer. The anthropogenic regulation (decrease) of the water table, as in drainage for plantations, has an impact on the hydrology of the whole peat dome. This process can only be roughly estimated using published data from other peat ecosystems. In situ measurements will improve these estimates and it is therefore recommended that the project regularly monitor the level of the water table. The above ground carbon stock also requires a detailed assessment in the field. To meet Tier 3 requirements, necessary for a REDD project, as requested by IPCC Guidelines (IPCC, 2007), a forest inventory has to be conducted and permanent forest plots have to be established. The above ground biomass and the 3D surface topology of the peat dome can be determined in much more detail by using LIDAR measurements. This approach uses an airborne system that radiates laser pulses to the ground and records first and last reflections from its surface. The spatiotemporal pattern of each measured location on the ground, as well as reflections from the surface of the vegetation are recorded. These measurements are captured at a very high spatial resolution (depending on the laser system and altitude – with 1 to 16 measurements per m2). The aerial survey should be conducted in transects, as the topography of the peat dome is very regular and can be interpolated by spatial modeling. This also reduces the costs of such a survey and analysis. The aboveground biomass can be calculated from the difference between the surface and terrain model using the forest inventory data as reference. Using LIDAR it will also be possible to measure peat loss after fire over larger areas using field measurements as a reference. This advanced approach was validated in peat domes in Kalimantan and is recommended in the event of large fires.

Carbon Stock Estimation of Merang Kepayang Area
9
Table of content:
Introduction 13 1. Driving factors for changes in land use management practice under the baseline
scenario that contribute to carbon stock changes in the project area 15 2. Carbon dioxide emission estimation of the Merang-Kepayang ecosystem based on
remotely sensed data and field measurements 18 2.1. Data Sources 18
2.1.1. GIS Data 18 2.1.2. Peat extent, thickness and carbon stock 18 2.1.3.Landsat TM 20 2.1.4. Landuse BPKH 20 2.1.5. Hot Spot 20
2.2. Analysis 21 2.3. Above ground carbon stock 21 2.4. Calculation of carbon loss due to drainage and land cover conversion 24 2.5. Emissions from peat burning 26 2.6. Total emissions and carbon content of the Merang Peat Dome 27
3. Estimations of future CO2 emissions on the basis of a “business as usual scenario” and after the implementation of emissions reduction measures implemented by the project 31 3.1. Business as usual scenario 34 3.2. Implementation of a small project for reducing emissions 36 3.3. Implementation of a large project for reducing emissions 36 3.4. REDD 37
Deliverables 40
References 41
ANNEX I 43
ANNEX II 46
ANNEX III: 49
ANNEX IV 52

Carbon Stock Estimation of Merang Kepayang Area
10
List of Figures: Figure 1: Location of the Merang peat dome (combination of different map sources
(Ballhorn, 2007)) .................................................................................. 13 Figure 2. MPDF degradation from 1989 to 2007 in percentage .................................. 15 Figure 3. Pristine Peat Swamp Forest with closed canopy closure, superimposed on
Landsat TM of the year 1989 .................................................................. 16 Figure 4. Disturbed Peat Swamp Forest with open canopy closure, superimposed on
Landsat TM of the year 2007 .................................................................. 16 Figure 5. Map from RTRWN (National Spatial Planning Agency) stating, that the Merang
Peat Forest is allocated to Hutan Lindung (protected forest) (Peraturan Pemerintah no 26 tahun 2008) ............................................................... 17
Figure 6. Available peat depth corings (green dots) for Merang peatland. ................... 19 Figure 7. 3D peat model - Merang bedrock model (Mott, 2006) ................................. 19 Figure 8. Landsat TM; taken on 09/06/1989 ........................................................... 20 Figure 9. Landsat TM; taken on 01/09/1999 ........................................................... 20 Figure 10. Landsat TM; taken on 27/06/2007 ......................................................... 20 Figure 11. Land cover distribution on peat soil in the Merang Kepayang project area .... 22 Figure 12. Annual CO2 emission in relation to land cover .......................................... 25 Figure 13. CO2 emissions due to peat fires and affected areas, from 1997 to 2007 ....... 27 Figure 14. Calculation of net emission in Mt of CO2 due to of land cover changes on
organic soil; values below zero indication sequestration of organic material ... 28 Figure 15. Calculation of net emission in Mt of CO2 due to land cover changes on organic
soil and mineral soil .............................................................................. 29 Figure 17. Concession borders within the area Merang ............................................. 31 Figure 18. Palm oil concessions (status 28/08/08) .................................................. 33 Figure 19. "Business as usual" scenario, land changes of remaining 78,000 ha (Rücker,
2008) ................................................................................................. 34 Figure 20. Small project scenario and potential REDD relevant annual CO2 saving of 1.74
Mt ...................................................................................................... 38 Figure 21. Large project scenario and potential REDD relevant annual CO2 saving of 3.98
Mt ...................................................................................................... 38 Figure 22: Different Scenarios and related emission factors on an annual basis ........... 39

Carbon Stock Estimation of Merang Kepayang Area
11
List of Tables: Table 1. Land cover classes, area in ha and biomass in tonnes C on peat soil within the
area Merang-Kepayang............................................................................ 23 Table 2. Emission factors from peat decomposition (organic matter) .......................... 25 Table 3. Calculation of net emission in Mt of CO2 due to land cover changes on organic
soil ....................................................................................................... 28 Table 4. Calculation of net emission in Mt of CO2 due to land cover changes on organic
soil and mineral soil ................................................................................ 29 Table 5. Concessions within the area Merang and status of concession (status 28/08/08)
............................................................................................................ 32 Table 6. Status of palm oil concessions within the area Merang-Kepayang (status
28/08/08) ............................................................................................. 33 Table 7. Distribution of land use classes, considering different scenarios (Rücker, 2008);
arrows indicate the tendency in land change (up = increase; down = decrease)............................................................................................................ 34
Table 8. Predicted changes until 2015 in ha (Rücker, 2008) ...................................... 35 Table 9. "Business as usual" Scenario and related CO2 emissions in Mt ...................... 35 Table 10. Small project scenario and related CO2 emissions in Mt .............................. 36 Table 11. Large project scenario and related CO2 emissions in Mt .............................. 37
Carbon Stock Estimation of Merang Kepayang Area
12
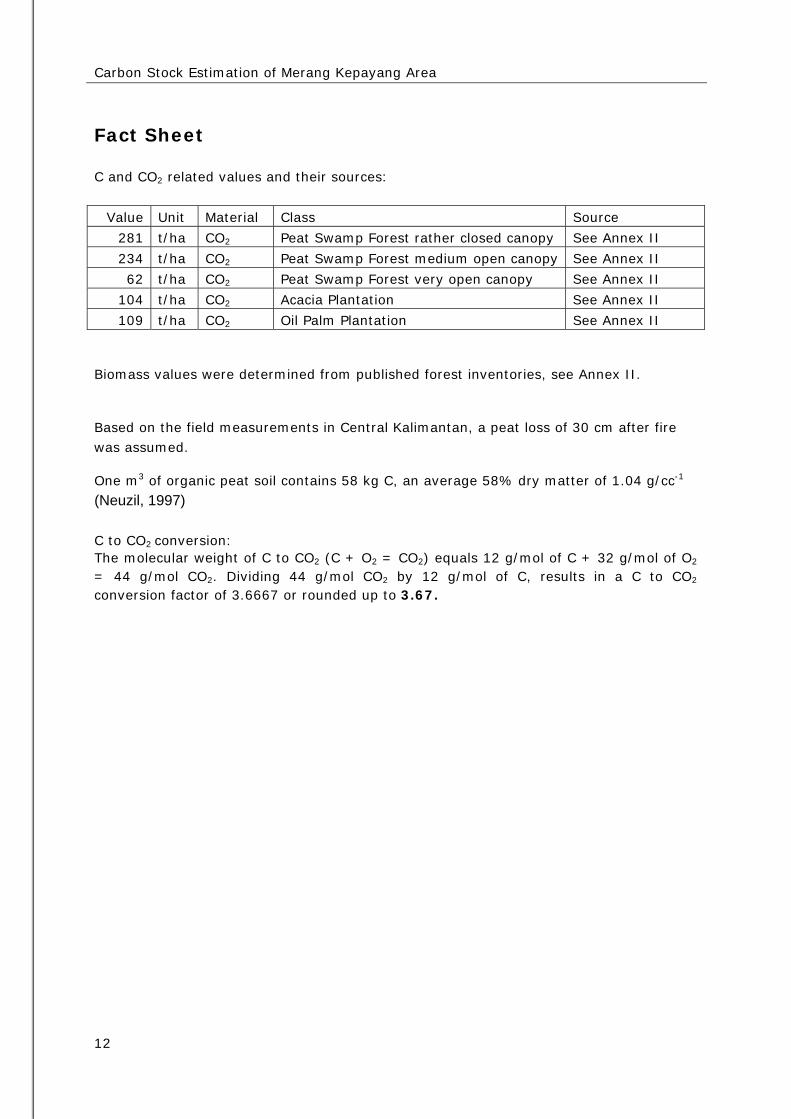
Fact Sheet C and CO2 related values and their sources:
Value Unit Material Class Source
281 t/ha CO2 Peat Swamp Forest rather closed canopy See Annex II
234 t/ha CO2 Peat Swamp Forest medium open canopy See Annex II
62 t/ha CO2 Peat Swamp Forest very open canopy See Annex II
104 t/ha CO2 Acacia Plantation See Annex II
109 t/ha CO2 Oil Palm Plantation See Annex II
Biomass values were determined from published forest inventories, see Annex II.
Based on the field measurements in Central Kalimantan, a peat loss of 30 cm after fire was assumed.
One m3 of organic peat soil contains 58 kg C, an average 58% dry matter of 1.04 g/cc-1 (Neuzil, 1997) C to CO2 conversion: The molecular weight of C to CO2 (C + O2 = CO2) equals 12 g/mol of C + 32 g/mol of O2 = 44 g/mol CO2. Dividing 44 g/mol CO2 by 12 g/mol of C, results in a C to CO2 conversion factor of 3.6667 or rounded up to 3.67.

Carbon Stock Estimation of Merang Kepayang Area
13
Introduction Peat domes are under special focus lately due to their importance as carbon sinks and stores and their role in the carbon cycle between the earth’s surface and the atmosphere (Immirzi et. al.,1992; Hooijer et al., 2006). Forested peat lands in South East Asia store at least 42,000 Megatones (C content of 58 kg/m3) of soil carbon, covering an area of about 26 Million hectares (corresponding to 70% of all tropical peatlands) (Rieley et al., 1996). About 76% of this peat coverage is located in Indonesia. Peats and their related vegetation above ground represent a sensitive ecosystem, which has undergone severe changes in the last 20 years due to anthropogenic influences; the changes have resulted in the emission of the green house relevant gas CO2 and a severe loss of biodiversity. Two major reasons for this manmade ecosystem alteration, peat degradation, are:
1. aerobic decomposition of the peat material caused by a change in the ratio of water to organic matter, due to anthropogenic disturbance, such as land use change, and,
2. peat fires, occurring in degraded peat lands, emitting CO2.
The province of South Sumatra / Indonesia has 24 peat domes with an overall estimated below ground biomass of 3.23 Gt C, covering an area of about 6130 km2. The Merang peat dome is the largest in South Sumatra, covering an area of 1400km2 with an estimated carbon content of 0.1 Gt (Ballhorn, 2007).
Figure 1: Location of the Merang peat dome (combination of different map sources (Ballhorn, 2007))

Carbon Stock Estimation of Merang Kepayang Area
14
Importance of Carbon Emission Calculation The UNFCCC Conference in Bali in 2007 established the political framework for the policy process “Reducing emissions from deforestation and degradation in developing countries” (REDD). Participating parties confirmed the urgent need to take further action to reduce emissions from deforestation and forest degradation and adopted a work program for further methodological work. That program focuses on assessments of changes in forest cover and associated greenhouse gas emissions, methods to demonstrate reductions of emissions from deforestation and the estimation of the amount of emission reductions from deforestation. REDD itself is considered to be an important component of a future climate change regime beyond 2012, in terms of mitigation and adaptation. In this way, REDD can be seen as a tool not just for mitigating climate change, but also for conserving biodiversity and a range of ecosystem services of global and local interest. The recent passage by the Indonesian Ministry of Forestry of a law implementing procedures for reducing emissions from deforestation and degradation, demonstrates the seriousness of the Indonesian Government to implement the REDD mechanism for their forests. The regulation governs implementation procedures for REDD, location requirements, proponents, implementation procedures, accounting, monitoring, reporting, verification, and certification issues for REDD projects in Indonesia. REDD projects, however, will start from the year 2012; meanwhile, pilot projects will be established for testing mechanism procedures. This study focuses on the analysis of the existing carbon stock for the Merang Kepayang area, the driving factors of carbon losses and development of a core estimation of how much carbon might be saved by extending the project activities in this area, by SSFFMP or an equivalent organization.

Carbon Stock Estimation of Merang Kepayang Area
15
1. Driving factors for changes in land use management practice under the baseline scenario that contribute to carbon stock changes in the project area
The Merang Peat Dome Forest (MPDF) underwent intense changes in land cover over the last 20 years. The forest itself has been selectively logged since the late 70s as a limited production forest (HPH). The timber concessions extracted tradable timber with a diameter above 60 cm. These activities were stopped in the late 90s due to limited profitability. The existing infrastructure established by the HPHs led to increased activity by illegal loggers, due to facilitated access. Rafts carrying both processed and unprocessed logs (non sinking and sinking in combination) have been observed in the Sungai Merang, the Sungai Beruhun, and Sungai Buring for several years now. Small rivers such as the River Buring have been dammed to facilitate transport, and hence, it is possible to float the timber even in the dry season.
Figure 2. MPDF degradation from 1989 to 2007 in percentage Almost 75% of the closed canopy peat swamp forest has been degraded. The conversion of Peat Swamp Forest with a closed canopy structure to Peat Swamp Forest, with a medium or even open canopy structure has resulted from illegal logging activity, timber extraction and thinning of canopy closure.

Carbon Stock Estimation of Merang Kepayang Area
16
Figure 3. Pristine Peat Swamp Forest with closed canopy closure, superimposed on Landsat TM of the year 1989
Figure 4. Disturbed Peat Swamp Forest with open canopy closure, superimposed on Landsat TM of the year 2007
Fire Prior to human intervention, peat fires generally did not occur in pristine peat swamp forest ecosystems (Saharajo, 1999), likely as a result of the high humidity; however, during the past 20 years fires have been occurring with increasing frequency in all land cover types. Many of these fires, ignited to clear land, spread uncontrolled (Wetlands International, 2004). A lower water table abets peat fires. Drainage, deforestation, and/or severe dry seasons caused by El Niño or La Niña years are responsible for a decrease in the water table. The organic layer dries out progressively and becomes fuel for fires. Those peat fires causing severe haze threaten human health, affecting both the national and international economy (ADB, 1999), emit huge amounts of CO2 and other gases into the atmosphere. With increasing degradation and human exploitation of the peat forest, fires are becoming more likely, due to easier access and the disturbed peat ecosystem. Another important driver of land cover change is the existence of concessionaires, especially those with oil palm and forest concessions (HTI), located in the Merang Kepayang area. According to Keputusan President (Presidential Decree), the release of concessions on peat can only be permitted, if the peat is deeper than 3 meters. Local

Carbon Stock Estimation of Merang Kepayang Area
17
authorities (e.g. RTRWP) consider the Merang Peat dome as a peat with less than 3 meters depth on which concessions can be issued. To date, land clearing for palm oil concessions on the western part of the MPDF have already begun and forest concessions have been released on almost the whole MPDF; only small pieces have yet been unallocated (status as of August 2008). Peat domes do not provide optimal growing conditions for palm oil and forest plantations; however, they are the favoured choice due to their unclaimed land use status. Mineral soils, correlated to higher production, often underlay areas of severe land use conflicts, forcing the concessionaires to provide costly community development programs to generate alternative incomes for local inhabitants. Unclear, and partly incompatible, land use planning triggers land use conflicts. There seems to be little or no coordination between different departments such as Dinas Kehutanan (responsible for Forest Concessions), Dinas Pertanaan (responsible for Palm Oil Concessions), and RTRWN (National Spatial Planning Agency) on both a district as well as a governmental level. The land use status itself is partly unclear and concessions released by local authorities are non-compliant with decrees published in Jakarta (see Figure 5 page 17). The map of RTRWN shows the Mearang Kepayang Area as “Hutan Lindung” (protected forest), whereas the authorities (RTRWP) on the district level consider it as “Hutan Produksi” (production forest) and allocated several concessions in the MPDF area. This contradictory land use planning may occur because the map of RTRWN has not yet been affirmed by a decision letter of the Ministry in Jakarta, which is necessary to implement the status stated in the map by RTRWN.
Figure 5. Map from RTRWN (National Spatial Planning Agency) stating, that the Merang Peat Forest is allocated to Hutan Lindung (protected forest) (Peraturan Pemerintah no 26 tahun 2008)

Carbon Stock Estimation of Merang Kepayang Area
18
2. Carbon dioxide emission estimation of the Merang-Kepayang ecosystem based on remotely sensed data and field measurements
The estimation of carbon stocks and related assessment of carbon losses follows the 2006 IPCC Guidelines for National Greenhouse Gas Inventories in order to provide a comparable study in accordance to international standards. To estimate current carbon stocks, all quantifiable losses of carbon should be considered (dependent on the existenceof data and field surveys conducted). The following analysis steps have been undertaken:
1. Calculation of above ground biomass based on the years 1989, 1999 and 2007 based on satellite imagery
2. Determination of CO2 emissions from different land uses on peat soil 3. Determination of CO2 emissions due to peat fires
2.1. Data Sources The study was carried out using available spatial and quantitative data collected during the consultancy and previous studies of the SSFFMP project.
2.1.1. GIS Data For this analysis, GIS data sources representing different sources and points in time were provided, including:
• RTRWP 2006 – Provincial Spatial Plan; • RTRWP SK 76 2001 –Provincial Spatial Plan from 2001 until 2006; • RTRWK Muba: forest part of current district level; • HTI 2007: Covering forest concessions (current status); and, • HPH 1990: Covering oil palm concessions.
2.1.2. Peat extent, thickness and carbon stock
The peat extent and thickness was derived from studies conducted in 2007 (Ballhorn, 2007) and 2006 (Mott, 2006) by RSS. The maps of peat dome thickness and peat soil were compiled from different sources. The peat soil and peat dome map of South Sumatra province produced by Repprot formed the base map for the study. Repprot was a development project, funded by Great Britain, whose objective was to assist the transmigration effort of the Indonesian government. The extent of the peat soil and the peat dome of Repprot were compared with a peat land map of South Sumatra province produced by Wetlands International. Wetlands International is the biggest non-profit organization dedicated solely to

Carbon Stock Estimation of Merang Kepayang Area
19
wetland conservation and its sustainable management. Both sources were delineated using remote sensing data, such as SRTM, Landsat and Spot images of the South Sumatra province and the mapped peat extent combined with peat depth corings (conducted by the University of Palembang).
Figure 6. Available peat depth corings (green dots) for Merang peatland. Below ground carbon stock was calculated using a three-dimensional bed rock model for the year 2007 and about 80 peat corings undertaken by the University of Palembang (Ballhorn, 2007). The result showed that the Merang peat dome has a volume of about 1.79 km³, corresponding to 102 Mt of carbon. The maximum peat depth is about 6 m, while the average depth is approx. 1.3 m. The current unequal distribution of drilling samples lead to an underestimation of the total carbon amount because depth measurements are missing for significant parts of the peat dome. The 3D model assumes for these areas to be shallow peat.
Figure 7. 3D peat model - Merang bedrock model (Mott, 2006)

Carbon Stock Estimation of Merang Kepayang Area
20
2.1.3. Landsat TM Three different subsets of Landsat TM images for the same corresponding area were analyzed for the year 1989, 1999 and 2007. The spatial resolution of Landsat TM is 30 by 30 m. The image for the year 1989 has a data gap of 12% and 1999 of 4% within the Merang peat footprint.
Figure 8. Landsat TM; taken on 09/06/1989
Figure 9. Landsat TM; taken on 01/09/1999
Figure 10. Landsat TM; taken on 27/06/2007
2.1.4. Landuse BPKH Land use data for the year 2003 was provided by BPKH (Balai Pemantapan Kawasan Hutan). It was and validated/updated using Landsat scenes as a reference.
2.1.5. Hot Spot Hotspot data of the NOAA AVHRR and MODIS sensors were analyzed in order to estimate the affected area of the MPDF on peat soil. Those systems detect active burning fires with a spatial resolution of about 1 km2. To estimate the fire-affected area each recorded hotspot coordinate was converted to an area of 1 km² equivalent to the approximate spatial resolution of the sensor and was intersected with the land cover classification for the year 2007. This does not mean that the resulting burnt area is necessarily the same size; fires may cover the entire square km or only a small fraction. It has been shown, however, that there is a good correlation between burnt areas determined from hotspots and burnt areas derived from high resolution Landsat imagery (Langner et al., 2007, Mettinen et al., 2007). The area estimate is conservative, because the burnt area is often underestimated using the hotspot approach: 1.) fires are detected only once or twice a day, and rapidly spreading fires escape recording; 2.) smoke from the fire often impedes the detection of hotspots; 3.) and ground fires within forests are sometimes not hot enough to be detected from

Carbon Stock Estimation of Merang Kepayang Area
21
space. Areas of overlapping hotspots were considered to have been burned only once.
2.2. Analysis The existing carbon stock of the Merang peat dome has been calculated using the data described in 2.1 Data Sources2.1 (page 18). Project data was used in order to distinguish between vegetation on peat and non-peat, as well as to estimate the peat oxidation and determine the outline of the peat dome and the peat soil. IPCC suggests three approaches to estimate emissions/removals of greenhouse gases, referred as “Tiers”. The tiers are numbered from 1 to 3, and correlated with increasing data requirements and complexity. All three tiers conform to IPCC’s desired good practice conceptions of transparency, completeness, consistency, comparability and accuracy. Tier 1 is the most basic, and is related to predefined biomass stocks, mean annual increment of tree growth (MAI), and continental forest types. These values may be obtained from the IPCC Emission Factor Data Base; however, they provide a restricted resolution of biomass estimation due to the simplified assumption that the emission is directly emitted after deforestation. A gain-loss approach is applied by using default equations. Tier 2 differs from tier 1 in that MAI and biomass values are taken from existing, in situ forest inventories. All nonforest relevant biomass data may be obtained from the EFDB. Tier 3 can be described as the strictest approach, due to the fact that the biomass estimates must be derived from long term measurements of trees on permanent plots and calibrated models. For all other classes, region-specific stratified data can be used.
2.3. Above ground carbon stock IPCC defines good practice as using the highest possible tier. This study applies Tier 2 level criteria by using country-specific emissions factors and carbon changes for forest biomass estimation. These data were determined by using the median of published biomass values and were calibrated / verified by field survey data collected in the target area. This approach does contain uncertainties due to variations in growing conditions, the underlying resolution of the satellite images, and the accessibility of certain regions. Lidar data and aerial photos would provide a better estimation, however, their use would necessitate higher cost and a much more time-consuming evaluation due to the higher information content of the underlying data. The assessment of existing carbon stock was based on a land cover classification for the year 2003 provided by BPKH. The classification was validated and supplemented by SSFFMP using Landsat TM images from the years 1989, 1999 and 2007, this was necessary to update the classification of the corresponding images. In a second step, the
Carbon Stock Estimation of Merang Kepayang Area
22
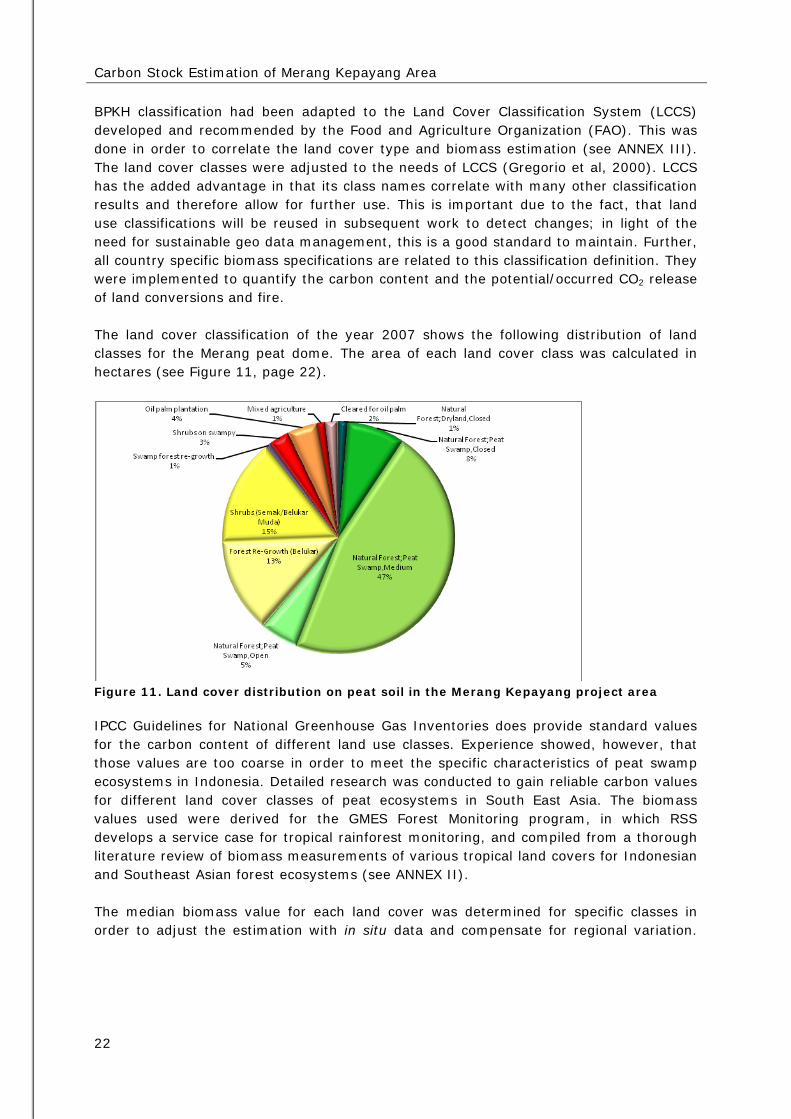
BPKH classification had been adapted to the Land Cover Classification System (LCCS) developed and recommended by the Food and Agriculture Organization (FAO). This was done in order to correlate the land cover type and biomass estimation (see ANNEX III). The land cover classes were adjusted to the needs of LCCS (Gregorio et al, 2000). LCCS has the added advantage in that its class names correlate with many other classification results and therefore allow for further use. This is important due to the fact, that land use classifications will be reused in subsequent work to detect changes; in light of the need for sustainable geo data management, this is a good standard to maintain. Further, all country specific biomass specifications are related to this classification definition. They were implemented to quantify the carbon content and the potential/occurred CO2 release of land conversions and fire. The land cover classification of the year 2007 shows the following distribution of land classes for the Merang peat dome. The area of each land cover class was calculated in hectares (see Figure 11, page 22).
Figure 11. Land cover distribution on peat soil in the Merang Kepayang project area IPCC Guidelines for National Greenhouse Gas Inventories does provide standard values for the carbon content of different land use classes. Experience showed, however, that those values are too coarse in order to meet the specific characteristics of peat swamp ecosystems in Indonesia. Detailed research was conducted to gain reliable carbon values for different land cover classes of peat ecosystems in South East Asia. The biomass values used were derived for the GMES Forest Monitoring program, in which RSS develops a service case for tropical rainforest monitoring, and compiled from a thorough literature review of biomass measurements of various tropical land covers for Indonesian and Southeast Asian forest ecosystems (see ANNEX II). The median biomass value for each land cover was determined for specific classes in order to adjust the estimation with in situ data and compensate for regional variation.

Carbon Stock Estimation of Merang Kepayang Area
23
The carbon fraction of dry matter was chosen to be 50%, as recommended by IPCC. This was the maximum effort feasible within the short time frame of this consultancy. A more detailed and precise calculation would require long term measurements and detailed forest inventories. An additional uncertainty is that the resolution of the remote sensing data used (about 30 by 30 m) doesn’t permit a more detailed assessment. Alternatively, Lidar and near infrared aerial images could be used in order to achieve higher accuracy. The following equation was used to calculate the biomass for a certain point of time (2007) (simplified from IPCC, 2006):
Where: C = total carbon in biomass, in t A = area of land of certain land use class, in ha V = merchantable growing stock volume, in m3/ha BCEF = biomass conversion and expansion factor CF = carbon fraction of dry matter This resulted in the following carbon content of the MPDF in the year 2007 (see Table 1): Table 1. Land cover classes, area in ha and biomass in tonnes C on peat soil within the area Merang-Kepayang
Land Cover Summe von Area_ha Total Carbon (tonnes C)
Natural Forest;Dryland,Closed 13,749 2,522,937
Natural Forest;Dryland,Open 22 793
Natural Forest;Peat Swamp,Closed 18,959 2,663,746
Natural Forest;Peat Swamp,Medium 110,294 12,904,344
Natural Forest;Peat Swamp,Open 11,714 363,120
Natural Forest;Swamp,Open 511 11,235
Natural Forest;Mangrove,Medium 11,672 817,032
Forest Re-Growth (Belukar) 39,958 599,368
Shrubs (Semak/Belukar Muda) 58,515 877,718
Swamp forest re-growth 5,755 86,322
Shrubs on swamp 7,826 117,388
Acacia plantation 1,615 83,984
Oil palm plantation 23,072 1,257,430
Rubber plantation 8,703 957,332
Mixed agriculture 11,943 334,414
Cleared for Acacia 4,969 0
Cleared for oil palm 4,636 0

Carbon Stock Estimation of Merang Kepayang Area
24
Cleared 1,121 0
Burnt 4,034 0
Water body 1,849 0
340,915 23,597,161 The data in Table 1 clearly show where the major portion of the carbon is stored. The largest class, “Natural Forest, Peat Swamp Medium Closed”, with an overall area of about 110,000 ha (47% of the MPDF), contains 12.9 Mt of biomass (about 57% of the overall carbon content). Next largest is Natural Forest; Peat Swamp Closed class, with an area of 19.000 ha and biomass of 2.7 Mt, even though the area is comparably small. This is indicative of the high biomass content of nearly undisturbed forest.
2.4. Calculation of carbon loss due to drainage and land cover conversion Peat undergoes oxidation processes when exposed (deforested) and drained. Decomposition of the organic material is only possible when aerobic conditions prevail, created by lowering the water table. The peat, however, undergoes temporally-limited natural variations of water saturation. Land cover conversion or drainage reduces the sustainability of the water table, leading to a decomposition process and subsequent CO2
emission. The formula for calculating CO2 emissions due to the oxidation of organic matter is given by IPCC. The simplified formula is as follows:
Organic
where: L = annual organic content lost from drained organic soils, in t CO2/ha/y A = land area of drained organic soils, in ha EF = emission factor, in t CO2/ha/y In order to estimate the peat decomposition, emissions factors for different land cover classes were estimated. Those emission factors were correlated with different land cover classes and drainage regimes, based on literature reviews and results of long-term studies in Sarawak and Central Kalimantan (Uryu, Y. et al. 2008) in relation to the drainage depth. The emission values were averaged and assigned to perspective land cover cases.

Carbon Stock Estimation of Merang Kepayang Area
25
Table 2. Emission factors from peat decomposition (organic matter) Land Cover Class Avg.
Drainage Depth (cm)
Mean (in t CO2/ha/y)
Median (in t
CO2/ha/y)
SD (in t CO2/ha/y)
Max (in t CO2/ha/y)
Min (in t CO2/ha/y)
Acacia plantation 53 85 84 41 165 5 Oil palm plantation
53 85 84 41 165 5
Smallholder oil palm plantation
53 85 84 41 165 5
Cleared land 21 29 26 9 48 22 “Waste” land 21 29 26 9 48 22 Other land covers 21 29 26 9 48 22 Estimated CO2 emissions from peat oxidation were calculated using emission factors from Table 2 for three different land cover classifications (see 2.1.4 Landuse BPKH) from the years 1989, 1999 and 2007. Missing areas were extrapolated excluding water bodies. The accumulated emissions of the last 18 years from the Merang peat dome is estimated to be 26 Mt, with a potential maximum emission of 43 Mt CO2. This corresponds to an average loss of 350,000 t C of peat per year, with a potential maximum loss of 590,000 t C due to oxidative processes.
Figure 12. Annual CO2 emission in relation to land cover

Carbon Stock Estimation of Merang Kepayang Area
26
Uncertainties in these emissions calculations due to peat decomposition are: - The weather phenomena, El Niño and El Niña, cause interannual variations in the
water table height; - All CO2 measurements were taken on the surface, so the carbon sequestration by
regrowth was not considered; - The published and project survey measurements of CO2 fluxes represent a single
snapshot in time for drainage. Few long term studies of carbon flux in peat domes exist, however, the variability of published values is high (standard deviation). Nonetheless, the applied method and underlying assumptions / data represent a reasonable starting point.
2.5. Emissions from peat burning The spatio-temporal occurrence of peat fires and their affected areas were analyzed for the years 1997 to 2007. All hotpots of the medium resolution satellite system MODIS and NOAA AVHRR sensors were superimposed on the Landsat TM images and the land cover classification. The spatio-temporal occurrence was analyzed by comparing the affected land class and the land class resulting from the fire event. The emission due to peat fires was calculated as follows:
Fire
where: L = annual organic content lost from burned organic soils, in kg C/ha/y A = land area of burned organic soils, in m2 D = affected depth of organic soil, in m (using a constant value of 0,3 m) C = C content of organic soil, 58 kg/m3 (Neuzil, 1997) The hotspot data is provided in coordinates of longitude and latitude. To calculate the area affected by fire, a 1 by 1 km buffer was allocated around each validated hotspot; in this way, the annual affected area of peat fire was estimated. Several measurements taken in Tumbang, Nusa Taruna, Kalampangan and Sebangau showed that an average of 30 cm in depth of the peat layer is affected during a peat fire. The affected fire area and the resulting CO2 emissions were calculated. The average carbon content of one cubic meter of peat is 58 kg Carbon (Neuzil, 1997).

Carbon Stock Estimation of Merang Kepayang Area
27
Figure 13. CO2 emissions due to peat fires and affected areas, from 1997 to 2007 1997 was an “El-Niño” year, which can be seen in the extent of the affected burned peat area. About 38.000 ha of peat soil was burned, causing a CO2 release of 33 Mt. Most of the burned area had been covered by forest.
2.6. Total emissions and carbon content of the Merang Peat Dome The total emissions and carbon content of the MPDF was summed up as previously described using relevant factors, whereas emissions due to vegetative fires were not considered. Changes in carbon stocks of biomass were calculated by applying the Stock-Difference method provided by IPCC (IPCC, 2006). The formula looks like this:
Stock-Difference Method
where:
= Difference in C content
C = C content t = certain point of time Results of the calculation:

Carbon Stock Estimation of Merang Kepayang Area
28
Table 3. Calculation of net emission in Mt of CO2 due to land cover changes on organic soil
1989 - 1999
1999 - 2007
1989 - 2007
Emission by deforestation/degradation 41.27 0.00 41.27 Emission by non forest degradation 0.00 4.27 4.27 Emission by peat decomposition 4.50 21.19 25.69 Emission by peat fire 33.00 33.40 66.40
Total emissions 78.77 58.86 137.63
Sequestration -3.42 -11.05 -14.47
Net emissions 75.35 47.81 123.16
Figure 14. Calculation of net emission in Mt of CO2 due to of land cover changes on organic soil; values below zero indication sequestration of organic material The emission from the Merang Kepayang area sums up as in the next table (including organic soil + mineral soil).

Carbon Stock Estimation of Merang Kepayang Area
29
Table 4. Calculation of net emission in Mt of CO2 due to land cover changes on organic soil and mineral soil
1989 - 1999
1999 - 2007
1989 - 2007
Emission by deforestation/degradation 64.52 0.00 64.52 Emission by non forest degradation 0.00 11.60 11.60 Emission by peat decomposition 4.50 21.19 25.69 Emission by peat fire 33.00 33.40 66.40
Total emissions 102.01 66.19 168.20
Sequestration -9.47 -14.65 -24.12
Net emissions 92.55 51.54 144.09
Figure 15. Calculation of net emission in Mt of CO2 due to land cover changes on organic soil and mineral soil Emissions of peat fires and peat decomposition, compared across both Figures remain lthe same, due to the fact that Figure 15 does contain the emissions of Figure 14 which is already located on peat soil. The emissions from forest degradation in the period of years 1999 – 2007 in both Figures remains zero because the sequestration is larger than the emission itself, despite a loss of forested land. Large patches of forest recovered in comparison to the time period 1989 to 1999. Uncertainties are due to:
- Missing data and extrapolation of the years 1989 and 1999 - Interpretation of the map - Classification algorithms - Haze and clouds
The data from 1989 and 1999 should be considered carefully, caveated by the

Carbon Stock Estimation of Merang Kepayang Area
30
uncertainties mentioned prior, however, the calculation of 2007 itself is considered to be representative as requested by the tender of the project.

Carbon Stock Estimation of Merang Kepayang Area
31
3. Estimations of future CO2 emissions on the basis of a “business as usual scenario” and after the implementation of emissions reduction measures implemented by the project
The estimation of future CO2 emissions of the Merang Kepayang area was predicted as far as the year 2015. This prediction uses the current status of land cover distribution and land use for the year 2007 as a starting point. Two additional scenarios of land cover distribution and their related changes were calculated besides the “business as usual” scenario. The scenarios differed in terms of the extent and land use practice of the potential protected area under the contribution of the BMU project in cooperation with concessionaires (see Rücker, 2008). All scenarios assume that the forest will be converted to plantations because they are already allocated to the concessionaires as described in Table 5.
Figure 16. Concession borders within the area Merang Notice: Block numbers of HPH and HTI are given in this report individually; they do not correspond to public identification tags.

Carbon Stock Estimation of Merang Kepayang Area
32
Table 5. Concessions within the area Merang and status of concession (status 28/08/08) Block Number Concession Name Status 1 Pakerin allocated 2 Wahana Lestari Makmur allocated 3 Rimba Hutani Mas allocated 4 Rimba Hutani Mas allocated 5 Rimba Hutani Mas SK in process 6 Tiesico Cahaya Pertiwi allocated 7 Paramitra Mulia Langgeng allocated 8 Wahana Lestari Makmur No SK 9 Paramitra Mulia Langgeng allocated 10 Sumber Hijau Permai allocated 11 - unallocated 12 Bumi Persada Permai allocated 13 - unallocated 14 - unallocated
Block 4 is already allocated to Rimba Hutani Mas (RHM), a member of the Sinar Mas Group. RHM stated that 15,000 ha of Block 4 will be kept as a conservation area (about 22% of the allocated area). Degraded peat forest will be combined with enrichment planting. For the northern Block 5, a recommendation has been already published to assign the concession to RHM as well. Consequently, the RHM concession will cover the major area of the MPDF itself. Indonesian law requires allocation of at least 10% of a concession to forest conservation and use of a maximal production area of 70%. The remaining 20% contains community forest, infrastructure, etc. RHM must lower the water table by 30 to 40 cm in order to optimise the growing conditions for Acacia Crassicarpa. The drainage will be not as severe, as it is necessary, for Acacia Mangium, which needs much drier growing conditions. The rotation period is about 5 to 8 years. Further channels of 3 m depth and about 8 m width for timber extraction are planned. The annual conversion rate to plantation will be around 15,000 ha/year including final opening and planting. As a result, the complete conversion of the Block 4 is planned to take about 4 years and should be completed by 2012. Block 5 is smaller and overlaps with already existing smallholder agriculture and oil palm plantations; however, the remaining forests, excluding small holder farming areas that are already in existence will be converted at the same speed as Block 4. In addition to acacia plantations, palm oil plantations will be established in the non-forest area. This conversion is already underway; however, documents of the RTRWP indicate an expansion of the palm oil plantations on peat soil.

Carbon Stock Estimation of Merang Kepayang Area
33
The allocation of concessions in the Merang Kepayang area are considered in the scenario design to be a static input quantity; all scenarios differ in terms of land use practice and intensity.
Figure 17. Palm oil concessions (status 28/08/08) Table 6. Status of palm oil concessions within the area Merang-Kepayang (status 28/08/08) Number Concession Name Status 1 PT. SWADAYA BAKTI NEGARAMAS allocated 2 PT. MENTARI SUBUR ABADI allocated 3 PT. MENTARI SUBUR ABADI allocated 4 PT. PANCA TIRTA BUDI AGUNG allocated 5 PT. PANCA TIRTA BUDI AGUNG allocated 6 PT. PANCA TIRTA BUDI AGUNG allocated
The changes in each land cover and their driving forces were described and analyzed (Rücker, 2008). The foci of the calculations in Table 7 were to estimate potential carbon emissions and carbon savings for the different scenarios, in the event of project implementation.

Carbon Stock Estimation of Merang Kepayang Area
34
Table 7. Distribution of land use classes, considering different scenarios (Rücker, 2008); arrows indicate the tendency in land change (up = increase; down = decrease)
annual change Status 2007
"Business as usual" Project Impact (ha) Project small Project large
Land Cover 2015 Project small Project large 2015 2015
Mixed agriculture + Rubber 7% 16,628 23,414
-2,011 -2,343 21,402 21,071
Oil palm plantation 0% 4,002 4,002
0 0 4002 4,002
Natural Forest;Dryland,Closed
-25% 1,986 0
790 983 790 983
Natural Forest;Peat Swamp,Closed + Medium
-4% 29,935 19,535
5,130 7,065 24,665 26,600
Natural Forest;Peat Swamp,Open
5% 8,755 11,955
-404 -2,122 11,552 9,834
Non Vegetation 0% 2,245 2,245
-1,367 -2,125 877 120
Secondary Re-growth 2% 14,935 17,335
-2,138 -1,459 15,197 15,877
78,485 78,486 78,486 78,486
3.1. Business as usual scenario The previously described changes apply to all scenarios, however, the business as usual scenario assumes that the remaining area (as opposed to the concession area) is undergoing similar changes and threats as they occurred within the last 20 years. Those types of developments were projected into the future through the year 2015. Illegal timber extraction and peat fires occur at the same intensity and temporal regularity as they did in the past 20 years. Police investigation into illegal logging is non-existent and “business as usual” resumes. The deforestation speed stays the same as between 1999 and 2007. The peat itself will undergo severe decomposition and fires. In accordance to the existing spatial planning, the surrounding landscape was converted in accordance to the existing spatial planning, such as oil palm and acacia plantations.
Figure 18. "Business as usual" scenario, land changes of remaining 78,000 ha (Rücker, 2008)

Carbon Stock Estimation of Merang Kepayang Area
35
Table 8. Predicted changes until 2015 in ha (Rücker, 2008)
Land Cover annual change 2007 2015
Mixed agriculture + Rubber 7% 16,628 23,414
Oil palm plantation 0% 4,002 4,002
Natural Forest;Dryland,Closed -25% 1,986 0 Natural Forest;Peat Swamp,Closed + Medium -4% 29,935 19,535
Natural Forest;Peat Swamp,Open 5% 8,755 11,955
Non Vegetation 0% 2,245 2,245
Secondary Re-growth 2% 14,935 17,335
78,485 78,486 The calculation results in the following final land cover distribution: 57,000 ha under conservation 132,000 ha conversion to HTI 76,000 ha conversion to oil palm 79,000 ha unmanaged area
344,000 ha From this: 149,270 ha will undergo severe drainage (30 cm and deeper) 14,650 ha will undergo drainage (less than 30 cm) This leads to the following calculation of CO2 emissions, by applying the method introduced in the chapter Analysis page 21). Table 9. "Business as usual" Scenario and related CO2 emissions in Mt
Base ‐ Line Scenario 1989 ‐ 1999 1999 ‐ 2007 2007 ‐ 2015
Emission by deforestation/degradation 64.52 0.00 40.57 Emission by non forest degradation 0.00 11.60 0.00 Emission by peat decomposition 4.50 21.19 104.00
Emission by peat fire 33.00 33.40 33.00
Total emissions 102.01 66.19 177.58
Sequestration ‐9.47 ‐14.65 ‐32.07
Net emissions 92.55 51.54 145.50

Carbon Stock Estimation of Merang Kepayang Area
36
3.2. Implementation of a small project for reducing emissions This scenario differs from “business as usual” by assigning unallocated block 14, containing about 25,000 ha, to the project. It was assumed, that the logging activities in the area can be gradually reduced and stopped completely within 3 years. The same was assumed for the protected area of the concession. Fires and lowering of the water table were reduced to a minimum in order to avoid sustainability impacts. The burned scars originating from the year 2006 in Block 15 are assumed to have been replanted and combined with enrichment planting. Further assumption is that This process will be completed by the year 2015, when the area is covered by peat forest, of open and mainly medium crown closure. The estimation of land cover classes is as follows: 83,000 ha under conservation 132,000 ha conversion to HTI 76,000 ha conversion to oil palm 53,000 ha unmanaged area
344,000 ha From this: 149,270 ha undergo severe drainage (30 cm and deeper) 14,650 ha will undergo drainage (less than 30 cm) Based on the land cover distribution, CO2 emission is estimated to be as follows: Table 10. Small project scenario and related CO2 emissions in Mt
Small Project 1989 - 1999 1999 - 2007 2007 - 2015 Emission by deforestation/degradation 64.52 0.00 37.66 Emission by non forest degradation 0.00 11.60 0.00 Emission by peat decomposition 4.50 21.19 103.35
Emission by peat fire 33.00 33.40 22.00
Total emissions 102.01 66.19 163.02
Sequestration -9.47 -14.65 -31.45
Net emissions 92.55 51.54 131.57
3.3. Implementation of a large project for reducing emissions Block 15 of 25,000 ha will have the same conditions as the small project scenario, under control of the BMU project. This area will have been combined with the 17,000 ha of RHM, allocated as protected forest, on which partly enrichment planting will take place.

Carbon Stock Estimation of Merang Kepayang Area
37
Illegal logging will have been reduced to a minimum, due to strong law enforcement and in the interest of the private company, because of concern for its reputation and resulting economic losses. Effective fire management of both the protected, as well as the plantation area will be assumed and the occurring peat fires are limited to two fire events, promoted by the weather phenomena “El Niño”. The pressure on the peat forest in the north by smallholder farmers will be reduced to a minimum due to an effective community development program. Estimated distribution of land cover of a large project in the year 2015: 123,000 ha under conservation 115,000 ha conversion to HTI 76,000 ha conversion to oil palm 30,000 ha unmanaged area
344,000 ha From this: 132,670 ha undergo severe drainage (30 cm and deeper) 14,910 ha will undergo drainage (less than 30 cm) Based on the land cover distribution CO2 emission is estimated to be as follows: Table 11. Large project scenario and related CO2 emissions in Mt
Large Project 1989 - 1999 1999 - 2007 2007 - 2015 Emission by deforestation/degradation 64.52 0.00 36.82 Emission by non forest degradation 0.00 11.60 0.00 Emission by peat decomposition 4.50 21.19 92.26
Emission by peat fire 33.00 33.40 16.00
Total emissions 102.01 66.19 145.07
Sequestration -9.47 -14.65 -31.40
Net emissions 92.55 51.54 113.67
3.4. REDD REDD aims to reduce emissions by implementing CO2-saving schemes. The CO2 saving is calculated by comparing the emissions of the “Business as usual” scenario, also called the “Base-line” scenario, with the effects of CO2 emissions implemented by the project. In the study conducted for SSFFMP, two scenarios were designed (see sections 3.2 Implementation of a small project for reducing emissions, page 36, and 3.3 Implementation of a large project for reducing emissions, page 36). Both of these are compared with the “Base-line” scenario. The difference of CO2 emissions between the

Carbon Stock Estimation of Merang Kepayang Area
38
“Base-line” scenario and the Project scenario (small or large) is the reduction in emissions, which can be traded.
Figure 19. Small project scenario and potential REDD relevant annual CO2 saving of 1.74 Mt
Figure 20. Large project scenario and potential REDD relevant annual CO2 saving of 3.98 Mt Implementation of a small project, with all its limitations, may produce an annual emissions reduction of 1.74 Mt. This value is a estimation, based on the available data and current policy. For a REDD implementation, a much more detailed estimation is necessary. Please refer to the recommendations (page 5). By comparing all three scenarios, a potential project impact becomes visible. Figure 21 on page 39, demonstrates that the peat decomposition due to oxidative processes comprises the lion’s share of the overall emissions. To reduce sustainable the emission, it is necessary avoiding of lowering the water table, resulting from any forest to plantation conversion (forest as well oil palm). This is indicated in tentative numbers of the last bar in the chart, titled “Total Protection”.

Carbon Stock Estimation of Merang Kepayang Area
39
Figure 21: Different Scenarios and related emission factors on an annual basis

Carbon Stock Estimation of Merang Kepayang Area
40
Deliverables Draft report comprising major findings and recommendations agreed upon with the Teamleader of the SSFFMP Project Management Unit (PMU) in electronic and printed version Presentation of Approach & Results in a Powerpoint presentation Final report in electronic and printed (6 pcs.) version and Time Sheets
All original and processed / analyzed data and GIS data on CD-ROM

Carbon Stock Estimation of Merang Kepayang Area
41
References ADB (Asian Development Bank)/BAPPENAS (National Development Planning Agency) Causes, Extent, Impact and Costs of 1997/98 Fires and Drought Final Report, Annex 1 and 2, Planning for Fire Prevention and Drought Management Project (Asian Development Bank TA 2999-INO Fortech, Pusat Pengembangan Agribisnis, Margueles Poyry, Jakarta, Indonesia, 1999). Ballhorn, U. 2007. PEAT DOME MAPPING & ANALYSIS - Compilation of the Projects Peat Data. Final Report. Palembang. SSFFMP Gregorio A., Jansen L. (2000). Land Cover Classification System (LCCS): Classification Concepts and User Manual. Rome. FAO Hooijer, A., et al. 2006. PEAT-CO2. Assessment of CO2 emissions from drained peatlands in SE Asia. Delft Hydraulics Report Q3943 Immirzi, C.P., Maltby, E., Clymo, R.S. 1999. The global status of peatlands and their role in carbon cycling, Report No. 11, Wetlands Research Group, Friends of the Earth, London IPCC, 2006. IPCC Guidelines for National Greenhouse Gas Inventories. Hayama, Kanagawa JAPAN Langner, A., Miettinen, J. and Siegert, F. (2007) Land cover change 2002-2005 in Borneo and the role of fire derived from MODIS imagery. Global Change Biology, 13, pp. 2329-2340. Maltby E., Immirzi C.P. (1993). Carbon dynamics in peatlands and other wetland soils - regional and global perspectives, Chemosphere, 27 (6), pp 999 – 1023 Miettinen J., A. Langner & F. Siegert (2007). Burnt area estimation for the year 2005 in Borneo using multi-resolution satellite imagery. International Journal of Wildland Fire, 2007, 16, 45–53; Bechteler, A. & F. Siegert (2004). Recurrent fires in tropical peatlands in Central Kalimantan. In: Proceedings of the 12th International Peat Congress: Wise Use of Peatlands, Vol.1: pp 607-614. Mott, C. 2006. PEAT DOME MAPPING & ANALYSIS - Part II – Refinement of the 3D-model. Final Report. Palembang. SSFFMP Murdiyarso (2005). Carbon forestry: who will benefit? proceedings of Workshop on Carbon Sequestration and Sustainable Livelihoods, held in Bogor on 16-17 February 2005. CIFOR, Bogor, Indonesia. 74-91. ISBN: 979-3361-73-5. Neuzil, S.G. 1997. Biodiversity and Sustainability of Tropical Peatlands (eds Rieley, J.O. and Page, S.E.), Samara, Cardigan, UK, 55-72. Rielely, J.O., Ahmad-Shah, A-A., Brady, M.A. 1996. The extent and nature of tropical peat swamps, In Tropical Lowland Peatlands of Southeast Asia, Proceeedings of a Workshop on Integrated Planning and Management of Tropical Lowland Peatlands held at

Carbon Stock Estimation of Merang Kepayang Area
42
Cisarua, Indonesia, 3-8 July 1992, Maltby, E., Immirzi, C.P., Safford, R.J. (eds.), IUCN, Gland, Switzerland Rücker, 2008. Threat Analysis to Forest Coverage in Peat Swamp Forest in South Sumatra. Final Report. Palembang. SSFFMP Saharjo, B. H. 1999. The role of human activities in Indonesian forest fire problems. In: Suhartoyo, H. and Toma, T. (eds.) Impacts of fire and human activities on forest ecosystems in the tropics (Proceedings of 3rd International Symposium on Asian Tropical Forest Management), 141-149. PUSREHUT, Mulawarman University, Samarinda,Indonesia. Uryu, Y. et al. 2008. Deforestation, Forest Degradation, Biodiversity Loss and CO2 Emissions in Riau, Sumatra, Indonesia. WWF Indonesia Technical Report, Jakarta, Indonesia Wetlands International, (2004). Maps of the peatland distribution and carbon content
Carbon Stock Estimation of Merang Kepayang Area
43
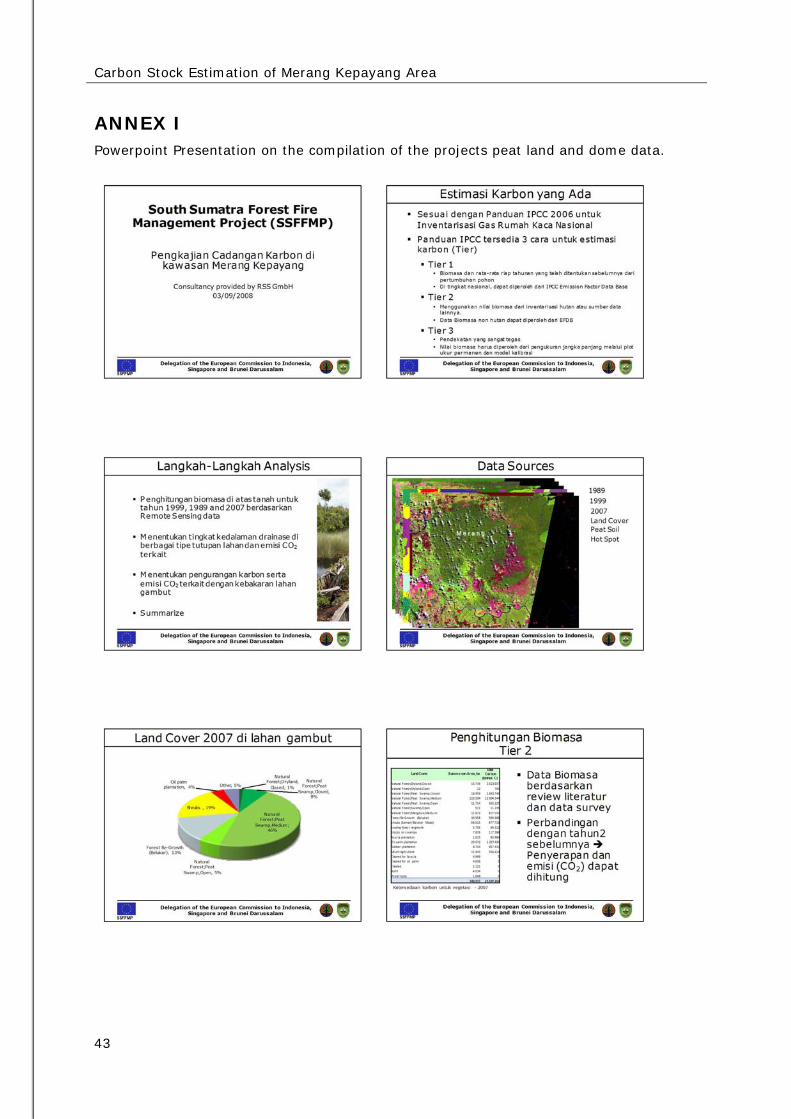
ANNEX I Powerpoint Presentation on the compilation of the projects peat land and dome data.

Carbon Stock Estimation of Merang Kepayang Area
44

Carbon Stock Estimation of Merang Kepayang Area
45

Carbon Stock Estimation of Merang Kepayang Area
46
ANNEX II
Land Cover Class Class description Region Literature Source
Biomass Specifications [t/ha]
Biomass used for Calculations [t/ha]
Dry Lowland Forest rather closed canopy
mixed dipterocarps-dense stocking, flat to undulating Sarawak Brown (1997) 355,0 367
mixed dipterocarps-medium stocking, flat to mountainous Sarawak Brown (1997) 305,0
old-growth dipterocarp Philippines Brown (1997) 445,0 closed-broadleaf tropical forest Indonesia Lasco (2002) 508,0 natural forest Indonesia Hairiah et al. (2001) 508,0 medium humus podzol Sarawak Bruenig (1977) 452,0 shallow humus podzol Sarawak Bruenig (1977) 350,0 evergreen needleleaf forest Asia Michel et al. (2005) 367,0 evergreen broadleaf forest Asia Michel et al. (2005) 233,5 deciduous needleleaf forest Asia Michel et al. (2005) 189,0 deciduous broadleaf forest Asia Michel et al. (2005) 200,0 mixed forest Asia Michel et al. (2005) 222,5
tropical forest Malaysia Brown and Gaston (1996) 230,0
primary forest Central Kalimantan, Barito Ulu Brearly et al. (2004) 358,0
primary forest East Kalimantan Prakoso (2006) 155,5 lowland forest Indonesia Garzuglia et al (2003) 240,0
lowland evergreen rainforest Malaysia, Pasoh MacKinnon et al. (1996) 664,0
lowland evergreen rainforest Malaysia, Pasoh MacKinnon et al. (1996) 475,0
lowland evergreen rainforest broad ridge crest Sarawak, Mula MacKinnon et al.
(1996) 650,0
lowland evergreen rainforest valley alluvium Sarawak, Mula MacKinnon et al.
(1996) 250,0
lowland evergreen rainforest over limestone Sarawak, Mula MacKinnon et al.
(1996) 380,0
lowland evergreen rainforest heath forest Sarawak, Mula MacKinnon et al.
(1996) 470,0
kerangas Borneo MacKinnon et al. (1996) 470,0
mixed dipterocarp Borneo MacKinnon et al. (1996) 650,0
limestone Borneo MacKinnon et al. (1996) 380,0
Asia tropical forest undisturbed Asia Brown et al. (1993) 438,0 tropical rain forest Asia insular Asia IPCC (2006) 350,0 Dry Lowland Forest medium open canopy
forest fallow Malaysia, Peninsular Brown (1997) 140,0 264
logged dipterocarp Philippines Brown (1997) 335,0 commercial logging Indonesia Hairiah et al. (2001) 300,0 logged forest Sumatra, Pasir Mayang Prasetyo et al. (2000) 310,4
old secondary forest Central Kalimantan, Barito Ulu Brearly et al. (2004) 264,0
secondary forest East Kalimantan Prakoso (2006) 89,0

Carbon Stock Estimation of Merang Kepayang Area
47
Asia tropical forest disturbed Asia Brown et al. (1993) 248,0 Dry Lowland Forest very open canopy
burnt primary forest East Kalimantan Prakoso (2006) 73,0 73
Peat Swamp Forest rather closed canopy
mixed swamp forest central Kalimantan Waldes and Page (2001) 312 281
low pole forest central Kalimantan Waldes and Page (2001) 249
tall interior forest central Kalimantan Waldes and Page (2001) 643
shallow peat bog Sarawak Bruenig (1977) 246 Peat Swamp Forest medium open canopy
- - - - 234
Peat Swamp Forest very open canopy
- - - - 62
Swamp Forest rather closed canopy
freshwater swamp Malaysia, Peninsular Brown (1997) 220,0 220
swamp forest Indonesia Garzuglia et al (2003) 211,0
alluvial Borneo MacKinnon et al. (1996) 250,0
Swamp Forest medium open canopy
disturbed freshwater swamp Malaysia, Peninsular Brown (1997) 285,0 173
logged freshwater swamp Malaysia, Peninsular Brown (1997) 185,0 logged freshwater swamp forest Malaysia Brown et al. (1989) 161,7 disturbed freshwater swamp forest Malaysia Brown et al. (1989) 99,2 Swamp Forest very open canopy
- - - - 44
Mangrove Forest rather closed canopy
mangrove forest Indonesia Garzuglia et al (2003) 187 187
Mangrove Forest medium open canopy
- - - - 140
Mangrove Forest very open canopy / Young Mangrove
- - - - 37
Accacia Plantation / Young Accacia Plantation
broadleaf plantation Asia IPCC (2006) 220 207
Acacia decurrens Willd (12 years) Indonesia Suharlan et al. (1993) 194 104 Coconut Plantation coconut plantation Malaysia Henson (2005) 80 80
Rubber Plantation broadleaf plantation Asia IPCC (2006) 220 220
Small Holder Rubber
Paraserianthes Paraserianthes falcataria (12 years) Indonesia Suharlan et al. (1993) 242 242 Oil Palm Plantation / Young Oil Palm Plantation
oil palm plantation South East Asia IPCC (2006) 136 109
Small Holder Oil Palm / Small

Carbon Stock Estimation of Merang Kepayang Area
48
Holder Young Oil Palm Plantation Forest Re-growth (Belukar) / Forest Re-growth on Swampy / Grassland / Hutan Kota / Mixed Garden / Overgrowing Clear cut-Shrubs / Shrubs (Semak/Belukar Muda) / Shrubs on Swampy
Imperate cylindrica Indonesia de Groot et al. (2005) 5 30 Grassland Sumatra, Pasir Mayang Prasetyo et al. (2000) 12
Grassland tropics Murdiyasso and Wasrin (1995) 30
Grassland Asia Michel et al. (2005) 13
Woodland Asia Michel et al. (2005) 100 Wooded grassland Asia Michel et al. (2005) 33 Closed shrubland Asia Michel et al. (2005) 72 Open shrubland Asia Michel et al. (2005) 16
Savannah tropics Murdiyasso and Wasrin (1995) 80
Savannah tropics Murdiyasso and Wasrin (1995) 200
Bush/shrub Sumatra, Pasir Mayang Prasetyo et al. (2000) 30 Swamp Grasses / Fernland
- - - - 44
Mixed Agriculture / Paddy Field
Cropland Asia Michel et al. (2005) 51,0 56
Cultivated lands and secondary vegetation in, Sumatra, Pasir Mayang Prasetyo et al. (2000) 71,0
Upland rice/bush falllow rotation Indonesia Hairiah et al. (2001) 148,0 Cash crops plantation Sumatra, Pasir Mayang Prasetyo et al. (2000) 56,0 Paddy field Sumatra, Pasir Mayang Prasetyo et al. (2000) 15,0
Water Body - - - - - Cleared / Cleared post Accacia harvested / Cleared, for Oil Palm Plantation / Airport / Sand Mining / Sediment / Settlement / Town / Factory
- - - - -

Carbon Stock Estimation of Merang Kepayang Area
49
ANNEX III:
ID
VegType ForestType
CanopyClosure
LCCS Closure
% Land coverClassName Land coverClassDescription LCCS_Code LCCS_Level
1
Natural Forest
Dryland Closed closed >65% Natural Forest;Dryland,Closed Closed Forest 20005 A3A10
2
Natural Forest
Dryland Medium open 65-15% Natural Forest;Dryland,Medium Open Forest (Woodland) 20013 A3A11
3
Natural Forest
Dryland Open sparse 15-5% Natural Forest;Dryland,Open Sparse trees 20052 A3A14
5
Natural Forest
Peat Swamp
Closed closed >65% Natural Forest;Peat Swamp,Closed Forest - Peatswamp Soils: Subsurface: Histosols 40003-N1114 A3A12-N1114
6
Natural Forest
Peat Swamp
Medium open 65-15% Natural Forest;Peat Swamp,Medium
Woodland - Peatswamp Soils: Subsurface: Histosols
40007-N1114 A3A13-N1114
7
Natural Forest
Peat Swamp
Open sparse 15-5% Natural Forest;Peat Swamp,Open Sparse - Peatswamp Soils: Subsurface: Histosols
40027-N1114 A3A16-N1114
8
Natural Forest
Swamp Closed closed >65% Natural Forest;Swamp,Closed ClosedShrubs - Swamp Soils: Subsurface: Histosols
40009-N1114 A4A12-N1114
9
Natural Forest
Swamp Medium open 65-15% Natural Forest;Swamp,Medium OpenShrubs - Swamp Soils: Subsurface: Histosols
40011-N1114 A4A13-N1114
10
Natural Forest
Swamp Open sparse 15-5% Natural Forest;Swamp,Open Sparse - Swamp Soils: Subsurface: Histosols 40029-N1114 A4A16-N1114
11
Natural Forest
Mangrove Closed closed >65% Natural Forest;Mangrove,Closed Forest - Mangrove: Water Quality: Brackish 40003-R2 A3A12-R2
12
Natural Forest
Mangrove Medium open 65-15% Natural Forest;Mangrove,Medium Woodland - Mangrove: Water Quality: Brackish 40007-R2 A3A13-R2
13
Natural Forest
Mangrove Open sparse 15-5% Natural Forest;Mangrove,Open Sparse - Mangrove: Water Quality: Brackish 40027-R2 A3A16-R2
14
Natural Forest
Mangrove >65% Young Mangrove Closed Shrubs - Mangrove: Water Quality: Brackish
40009-R2 A4A12-R2
15
Secondary Re-growth
Forest Re-Growth (Belukar) Closed Shrubland (Thicket) 20017 A4A10
16
Secondary Re-growth
>65% Shrubs (Semak/Belukar Muda) Closed Shrubland (Thicket) 20017 A4A10
17
Secondary Re-growth
Swamp forest re-growth ClosedShrubs - Swamp Soils: Subsurface: Histosols
40009-N1114 A4A12-N1114

Carbon Stock Estimation of Merang Kepayang Area
50
18
Secondary Re-growth
Shrubs on swampy ClosedShrubs - Swamp Soils: Subsurface: Histosols
40009-N1114 A4A12-N1114
19
Secondary Re-growth
>65% Swamp grasses/Fernland Closed Grasslands Soils: Subsurface: Histosoils 40017-N1114 A6A12-N1114
20
Secondary Re-growth
Overgrowing clear-cut shrubs Sparse Shrubs 20055 A4A14
21
Secondary Re-growth
>65% Grassland Closed Grasslands 20033 A6A10
22
Cultivated Young Acacia plantation Shrub Crop(s): Acacia: Crop Cover: Plantation(s)
10013-S1001W7 A2-S1001W7
23 Cultivated Acacia plantation Tree Crop(s): Acacia: Crop Cover: Plantation(s) 10001-S1001W7 A1-S1001W7
26
Cultivated Young oil palm plantation Shrub Crop(s): Oil Palm: Crop Cover: Plantation(s)
10013-S0909W7 A2-S0909W7
27
Cultivated Oil palm plantation Tree Crop(s): Oil Palm: Crop Cover: Plantation(s)
10001-S0909W7 A1-S0909W7
28 Cultivated Small holder oil palm Tree Crop(s): Oil Palm: Crop Cover: Orchard(s) 10001-S0909W8 A1-S0909W8
29
Cultivated Small holder young oil palm plantation
Shrub Crop(s): Oil Palm: Crop Cover: Orchard(s)
10013-S0909W8 A2-S0909W8
30
Cultivated Mosaic of small holder oil palm and rubber
Tree Crop(s): Dominant Crop: Hevea: 2nd Crop:Oil Palm: Crop Cover: Orchard(s)
10001-S0905S0909W8
A1-S0905S0909W8
31 Cultivated Rubber plantation Tree Crop(s): Hevea: Crop Cover: Plantation(s) 10001-S0905W7 A1-S0905W7
32 Cultivated Small holder rubber Tree Crop(s): Hevea: Crop Cover: Orchard(s) 10001-S0905W8 A1-S0905W8
33
Cultivated Coconut plantation Tree Crop(s): Coconut: Crop Cover: Plantation(s)
10001-S1001W7 A1-S1001W7
34 Cultivated Mixed agriculture Herbaceous Crop(s) 10025 A3
35 Cultivated Mixed garden
Small Sized Field(s) Of Herbaceous Crop(s) (2 add. Crops: Tree and Shrub Crops with Simultaneous Period). Crop type: Food Crops
10110-12663--S1 A3B2B5C2-C4C9C17C14C17-S1
36 Cultivated Paddy field Graminoid Crop(s): flooded 3001 A1
Graminoid Crop(s): flooded: Rice 3001-S0308 A1-S0308
37 Non Vegetation
Cleared for Acacia Consolidated Material(s) 6001 A1
38 Non Vegetation
Cleared for oil palm Consolidated Material(s) 6001 A1
39 Non Vegetation
Cleared Consolidated Material(s) 6001 A1

Carbon Stock Estimation of Merang Kepayang Area
51
40 Non Vegetation
Sand mining Non-Built Up Areas: extraction site 5004-2 A2-A6
41 Non Vegetation
Burnt Consolidated Material(s) 6001 A1
42 Non Vegetation
Sediment Consolidated Material(s) 6001 A1
43 Non Vegetation
Water body Natural Waterbodies 8001 A1
44 Non Vegetation
Town Built Up Areas: town = medium density 5003-14 A4-A13A15
45 Non Vegetation
Settlement Built Up Areas: settlement = low density 5003-15 A4-A13A16
46 Non Vegetation
Factory Built Up Areas: heavy industry 5003-8--A21 A4-A12-A21
47 Non Vegetation
Airport Built Up Areas: airport 5003-8--A30 A4-A12-A30
48 Non Vegetation
Fishpond Artificial Waterbodies: shallow (fishpond?) 7013-5 A1B1C2-A5
49 Non Vegetation
Mill-oil Built Up Areas: light industry 5003-8--A27 A4-A12-A27
50 Non Vegetation
No data No Data No Data No Data

Carbon Stock Estimation of Merang Kepayang Area
52
ANNEX IV

Carbon Stock Estimation of Merang Kepayang Area
53

Carbon Stock Estimation of Merang Kepayang Area
54