carbon stock density in planted versus natural pinus ... · original paper carbon stock density in...
TRANSCRIPT

ORIGINAL PAPER
Carbon stock density in planted versus natural Pinus massonianaforests in sub-tropical China
Long-Chi Chen1,2& Meng-Jie Liang1,3 & Si-Long Wang1,2,4
Received: 25 August 2015 /Accepted: 26 January 2016 /Published online: 9 March 2016# INRA and Springer-Verlag France 2016
Abstract& Key message Carbon stock density was quite similar inplanted vs natural forest of Masson’s pine (Pinusmassoniana Lamb.) in China across three ages (7, 15,and 50 years). The stock in the standing trees was largerin planted than in natural forests, but this difference wascompensated by larger stocks in the soil and the debris ofnatural forests.& Context Most studies on the carbon stocks are focused onmanagement strategies to maximize carbon stocks. We stilllack data comparing planted vs natural conifer forests.& Aims We compared carbon storage in the different compart-ment (vegetation, soil, debris) along a chronosequence ofMasson’s pine plantations vs natural forests.& Methods We investigated 58 Masson’s pine (Pinusmassoniana Lamb.) forest stands (20 m×50 m plots), that
differ in stand management (planted and natural forests) andage (young, middle-aged, and mature ages) and then calculat-ed the carbon stock densities of vegetation biomass (tree,shrub, and herb), debris, and soil.& Results The carbon stock densities in the planted and naturalMasson’s pine forest ecosystems ranged from 78 to210 Mg ha−1 and from 97 to 177 Mg ha−1 respectively. Thecarbon stock densities in the vegetation were significantlygreater in planted forests than in natural forests. A lower car-bon stock density in debris and soil alleviated the increase ofbiomass carbon stock densities in planted vs natural forests,leading to similar carbon stock densities at ecosystem level.The carbon stock densities in the vegetation increased withage, whereas those of debris and soil remained stable.& Conclusions Planted forests of Masson’s pine sequestersimiliar amounts of carbon at ecosystem level to those in nat-ural forests, reinforcing the idea that planted pine forests cancontribute to the mitigation of greenhouse gas emission.
Keywords Planted forest . Natural forest . Carbon stockdensity . Carbon sequestration . Soil organic carbon
1 Introduction
Due to the expansion of forests, forest practices such as affor-estation and reforestation seem to be effective measures forsequestering carbon from the atmosphere and mitigating glob-al climate change (Winjum and Schroeder 1997).Afforestation and reforestation are also proposed in Article3.3 of the Kyoto Protocol as effective methods of carbon se-questration. In contrast to the decreasing land areas of primaryforest and other naturally regenerated forests, the land areas ofplanted forests are increasing, making up to approximately7 % of the global forest area (FAO 2010). Between 2000
Shuqing Zhao
Contribution of the co-authors Long-Chi Chen designed theexperiment, wrote the manuscript, participated to the field work, andperformed the statistical analysis in SPSS. Meng-Jie Liang gave a contri-bution to form all tables and figures. Si-Long Wang coordinated theresearch project, provided funding to this experiment, and supervisedthe final version of the manuscript
* Si-Long [email protected]
1 Institute of Applied Ecology, Chinese Academy of Sciences,Shenyang 110164, China
2 Huitong Experimental Station of Forest Ecology, Chinese Academyof Science, Huitong 418307, China
3 University of Chinese Academy of Science, Beijing 100039, China4 Wenhua Road 72, Shenhe District, Shenyang, Liaoning
Province 110016, China
Annals of Forest Science (2016) 73:461–472DOI 10.1007/s13595-016-0539-4
and 2010, the global area of planted forest increased by ap-proximately 5 million hectares per year, and most of themwere established through afforestation (FAO 2010). As a re-sult of its ongoing afforestation efforts, China’s afforestation isnow the largest in the world, constituting more than 26 % ofthe world-wide planted forest area (Del Lungo et al. 2006).The annual net gain in planted forest area in China has in-creased by 2 million hectares per year during the period1990–2000 and by an average of 3 million hectares per yearsince 2000 (FAO 2010). The area of the planted forests alsoaccounts for approximately 31.7 % of the total forest area inChina (State Forestry Administraiton 2009) and continues toincrease because of the Grain for Green Program of China(Liu et al. 2008). Moreover, afforestation offers a great poten-tial for atmospheric CO2 sequestration. Following afforesta-tion, carbon stocks in the above- and below-ground plant bio-mass in planted forests increase significantly with forest age(Niu and Duiker 2006). Although soils accumulate less carbonat a slower rate than the aboveground biomass (Jandl et al.2007), soils can contribute approximately 30 % of the totalcarbon sequestered in afforested ecosystems, as suggested bya synthesis of afforestation chronosequences in northwesternEurope (Vesterdal et al. 2006). Consequently, planted forestsplay an increasingly important role in carbon sequestration inChina. Studies on the carbon stock density of planted forests,especially when compared with that of natural forests, willdeepen our understanding of the role of planted forests incarbon sequestration.
With the decrease in the land area of natural forests and theincrease in the land area of planted forests, the need to deter-mine whether the planted forests exhibit ecosystem productiv-ity and carbon stock similar to those of natural forests hasdrawn much attention (Chen et al. 2005; Guo and Ren 2014;Liao et al. 2010; Perez-Quezada et al. 2011; Thornley andCannell 2000). Whether carbon sequestration is greater in nat-ural or in planted forests is debated. Thornley and Cannell(2000) found that regular forest management strategies, suchas harvesting (removal of 10 or 20 % of woody biomass), cangain both a high timber yield and high carbon storage, andthen sequester carbon. This is attributed to higher lightinterception and net primary productivity, higher litter inputto the soil giving high soil carbon and N2 fixation, and lowermaintenance respiration than in the undisturbed forest. Guoand Ren (2014) reported that plantations exhibit much higherproductivity, and thus, much higher carbon sequestration ratesthan natural forests. However, Liao et al. (2010) suggestedthat the ecosystem carbon stock of plantations is reduced by28 % compared with the natural forests. Perez-Quezada et al.(2011) also reported that carbon pools in an arid shrub land arehigher under natural conditions than under afforested condi-tions. The above-mentioned information on the differences incarbon sequestration of natural and planted forests may havebeen misguided by many factors; thus, opposing results were
obtained. The first factor is the tree species. Different treespecies exert different effects on the improvement of produc-tivity and carbon sequestration (Tang and Li 2013;Wang et al.2013). Broadleaved tree species can usually sequester greateramounts of carbon than coniferous tree species (Wang et al.2013), thereby leading to the higher carbon stocks stored inecosystems following afforestation of hardwoods, such asEucalyptus, than afforestation of softwoods, such as pine (Liet al. 2012). Most of the natural forests reported in the abovementioned studies are natural broadleaved forests dominatedby native broadleaved tree species. However, the most com-mon tree species in planted forests are coniferous tree species,such as Cunninghamia lanceolata, Pinus caribaea,P. massoniana, P. radiata, and Picea abies (Liao et al.2010). The second factor is forest management. Thornleyand Cannell (2000) suggested that management regimesmaintaining a continuous canopy cover and mimickingregular natural forest intervention are likely to gain the bestcombination of highwood yield and carbon storage. Stand agecan also affect the calculation of carbon stock of forests. Guoand Ren (2014) suggested that stand ages can explain thedifferences in the performance of planted and natural forests.They found that the productivity of plantations is twice that ofnatural forests because the plantations are still in their earlystages of succession. However, the comparison of the carbonstocks of planted and natural forests of different ages leads to abiased or even erroneous result. Stand condition can also affectforest productivity and carbon sequestration. Moreover, clay-rich soils (>33 %) exhibit a greater capacity to accumulate soilorganic carbon than soil with lower clay content (<33 %)(Laganière et al. 2010). For the above reasons, most of theprevious comparisons are incomplete and the scenario of nat-ural broadleaved forests versus planted coniferous forests isusually missing, leading to a biased result that influences ourknowledge on which between the planted forests with man-agement practices and natural forests sequester more carbon.
Masson’s pine (P. massoniana Lamb.) is native to Chinaand is widely distributed in the northern latitudes (Yang et al.2011). Although few studies have reported on the stand bio-mass ofMasson’s pine forests in China (Ding andWang 2001;Liu 1996;Mo et al. 1999), none of them has directly comparedthe carbon stock densities of planted and natural Masson’spine forests at various ages. The comparison of carbon stockdensities of planted and natural pine forests could redefine therole of planted and natural forests in carbon sequestration,leading to a conclusion concerning which one has more po-tential in mitigating climate change, in order to better increasecarbon sink of management forests. To compare the carbonstock densities of planted and natural forests, we selected 58plots of planted and natural Masson’s pine forests in a series ofstands at different ages. We hypothesized that planted forestsexhibit fundamental differences in terms of carbon stock den-sity and distribution pattern from the natural forests, such as
462 L.-C. Chen et al.
more carbon stock density stored in planted forests than innatural forests, and these differences are mainly caused bystand treatments and forest management. The study specifical-ly aims to quantify the carbon stock densities and their pro-portions in the planted and natural Masson’s pine forests atdifferent ages, and to determine the changes of their carbonstock densities following a chronosequence. A comparison ofthe changes of carbon stock densities between planted andnatural Masson’s pine forest ecosystems with age is criticalin understanding the role of reforestation and afforestation inmitigating global climate change.
2 Materials and methods
2.1 Site description and plot selection
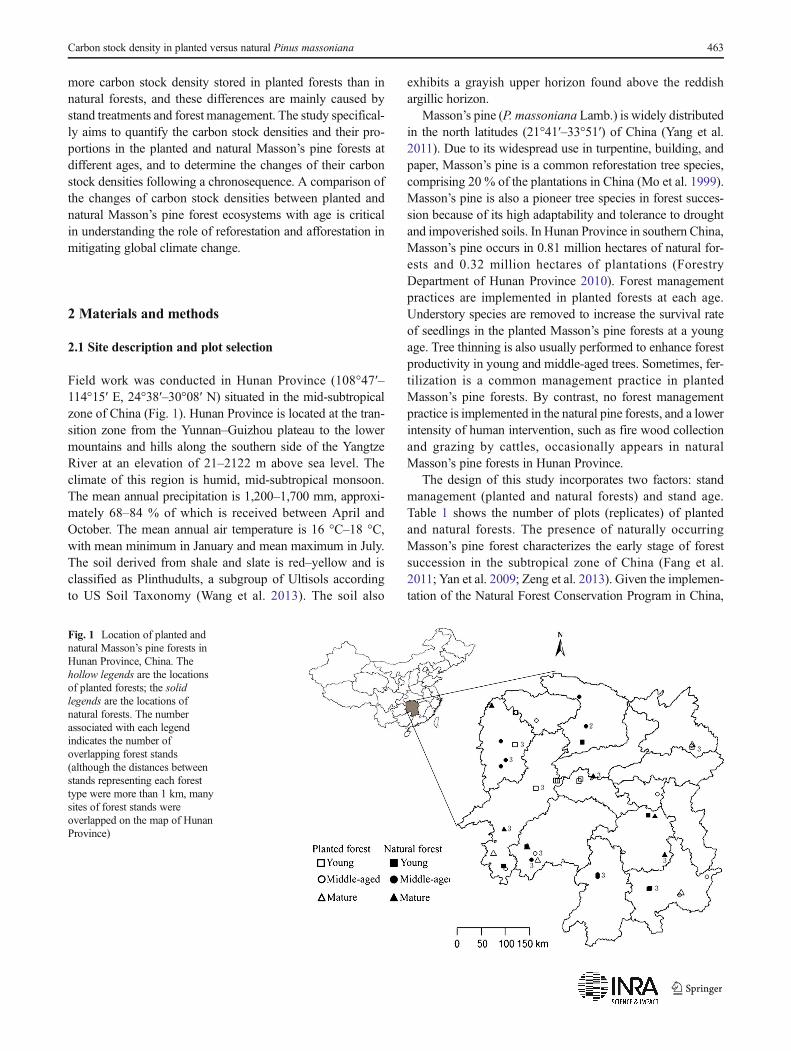
Field work was conducted in Hunan Province (108°47′–114°15′ E, 24°38′–30°08′ N) situated in the mid-subtropicalzone of China (Fig. 1). Hunan Province is located at the tran-sition zone from the Yunnan–Guizhou plateau to the lowermountains and hills along the southern side of the YangtzeRiver at an elevation of 21–2122 m above sea level. Theclimate of this region is humid, mid-subtropical monsoon.The mean annual precipitation is 1,200–1,700 mm, approxi-mately 68–84 % of which is received between April andOctober. The mean annual air temperature is 16 °C–18 °C,with mean minimum in January and mean maximum in July.The soil derived from shale and slate is red–yellow and isclassified as Plinthudults, a subgroup of Ultisols accordingto US Soil Taxonomy (Wang et al. 2013). The soil also
exhibits a grayish upper horizon found above the reddishargillic horizon.
Masson’s pine (P. massoniana Lamb.) is widely distributedin the north latitudes (21°41′–33°51′) of China (Yang et al.2011). Due to its widespread use in turpentine, building, andpaper, Masson’s pine is a common reforestation tree species,comprising 20 % of the plantations in China (Mo et al. 1999).Masson’s pine is also a pioneer tree species in forest succes-sion because of its high adaptability and tolerance to droughtand impoverished soils. In Hunan Province in southern China,Masson’s pine occurs in 0.81 million hectares of natural for-ests and 0.32 million hectares of plantations (ForestryDepartment of Hunan Province 2010). Forest managementpractices are implemented in planted forests at each age.Understory species are removed to increase the survival rateof seedlings in the planted Masson’s pine forests at a youngage. Tree thinning is also usually performed to enhance forestproductivity in young and middle-aged trees. Sometimes, fer-tilization is a common management practice in plantedMasson’s pine forests. By contrast, no forest managementpractice is implemented in the natural pine forests, and a lowerintensity of human intervention, such as fire wood collectionand grazing by cattles, occasionally appears in naturalMasson’s pine forests in Hunan Province.
The design of this study incorporates two factors: standmanagement (planted and natural forests) and stand age.Table 1 shows the number of plots (replicates) of plantedand natural forests. The presence of naturally occurringMasson’s pine forest characterizes the early stage of forestsuccession in the subtropical zone of China (Fang et al.2011; Yan et al. 2009; Zeng et al. 2013). Given the implemen-tation of the Natural Forest Conservation Program in China,
Fig. 1 Location of planted andnatural Masson’s pine forests inHunan Province, China. Thehollow legends are the locationsof planted forests; the solidlegends are the locations ofnatural forests. The numberassociated with each legendindicates the number ofoverlapping forest stands(although the distances betweenstands representing each foresttype were more than 1 km, manysites of forest stands wereoverlapped on the map of HunanProvince)
Carbon stock density in planted versus natural Pinus massoniana 463
finding planted Masson’s pine forests established on clearednatural forests is challenging. Thus, the Masson’s pine forestplantations we selected were commonly established afterclear-cutting and slash-burning the existing Chinese fir plan-tation, even if they were different from the land-use history ofnatural Masson’s pine forests. The stand ages used in studiesare as follows: young (≤10 years), middle-aged (>10 and ≤20 years), and mature (> 20 years), which are consistent withthose used by the State Forestry Administration of China. Inaddition, the distance between stands representing each foresttype was more than 1 km (Fig. 1). Table 1 shows the maincharacteristics of each chronosequence.
At present, the tree species composition of the planted andnatural Masson’s pine forests is dominated by P. massonianaLamb. The dominant shrub species in the planted pine forestsinclude Quercus glandulifera var. brevipetiolata Nakai,Loropetalum chinense, and Q. fabri Hance. Those in the nat-ural pine forests include Q. glandulifera var. brevipetiolataNakai, L. chinense , Liquidambar formosana , andCastanopsis sclerophylla (Lindl.) Schott. The dominant herbspecies in the planted pine forests include Saccharumarundinaceum, Imperata cylindrical (Linn.) Beauv., andDicranopteris dichotoma, and those in the natural pine forestsinclude I. cylindrical (Linn.) Beauv, Dryopteris fuscipes, andD. dichotoma.
2.2 Aboveground and belowground biomass calculation
The area of each plot was 1,000 m2 (20 m×50 m). In October2011, all plots were intensively surveyed, and the communitystructure, elevation, slope, forest age, and canopy density wererecorded. The diameter at breast height (DBH) of each tree
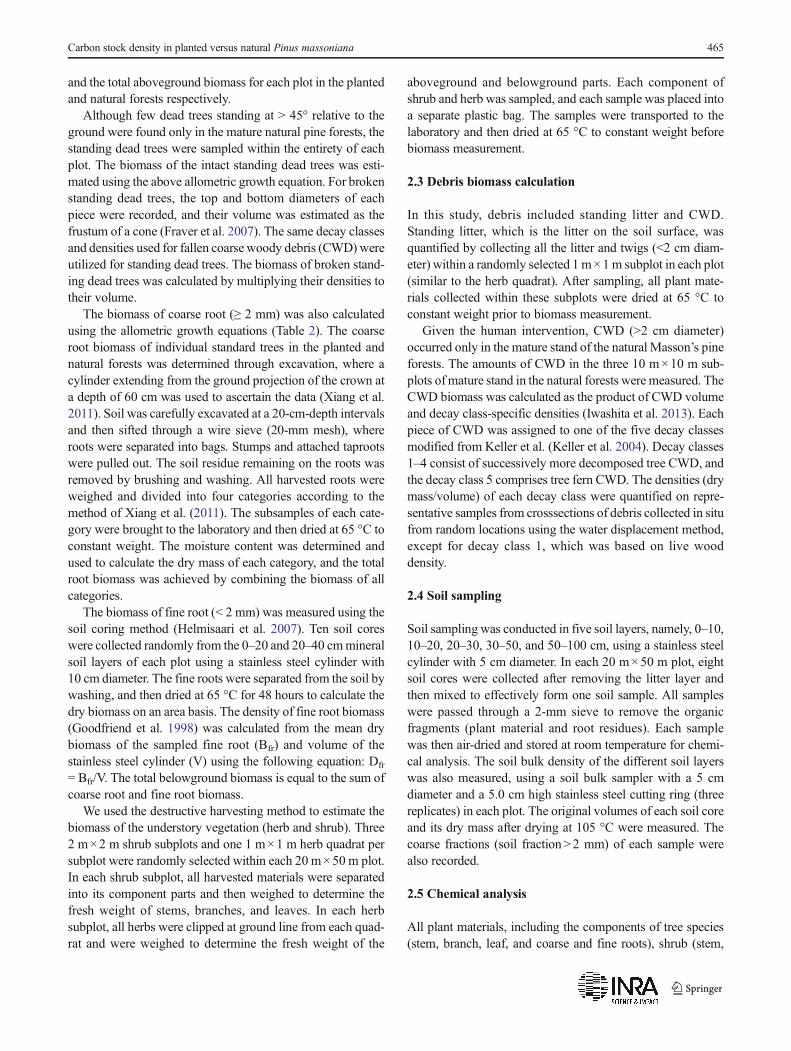
(DBH≥5 cm at 1.3 m above ground) and height were record-ed for all trees in each plot. We used the allometric growthequations for Masson’s pine to quantify the total biomass andthe biomass of the different plant components (e.g., stem,branch, leaf, and root) of each tree. To establish the equation,we selected and harvested 53 standard trees. The DBH of allstandard trees ranged from 4.6 cm to 67.1 cm and their agesranged from 4 years old to 115 years old. Analysis of covari-ance indicated that significant differences exist between theallometric growth equations of the planted and naturalMasson’s pines. Thus, the allometric growth equations of theplanted and natural Masson’s pines were established using 25stems from the planted forests and 28 stems from the naturalforests respectively (Table 2). We used the allometric growthequations of the planted and natural trees to estimate theaboveground biomass (stem, branch, and leaf) of each tree
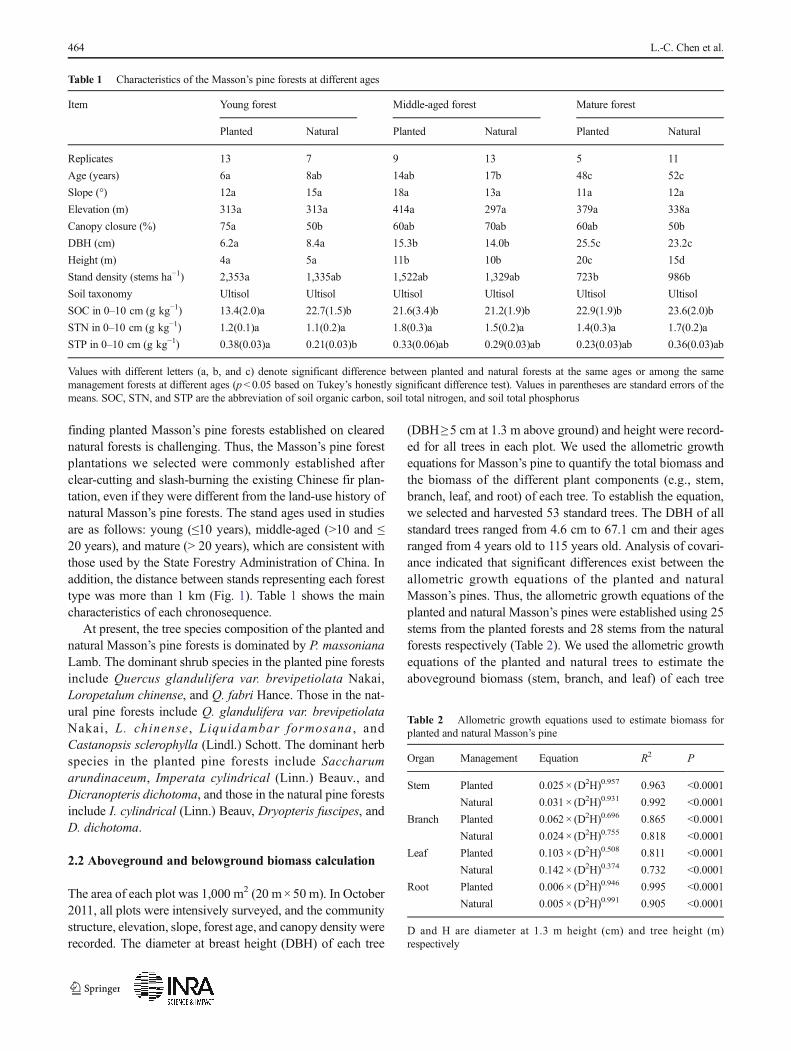
Table 1 Characteristics of the Masson’s pine forests at different ages
Item Young forest Middle-aged forest Mature forest
Planted Natural Planted Natural Planted Natural
Replicates 13 7 9 13 5 11
Age (years) 6a 8ab 14ab 17b 48c 52c
Slope (°) 12a 15a 18a 13a 11a 12a
Elevation (m) 313a 313a 414a 297a 379a 338a
Canopy closure (%) 75a 50b 60ab 70ab 60ab 50b
DBH (cm) 6.2a 8.4a 15.3b 14.0b 25.5c 23.2c
Height (m) 4a 5a 11b 10b 20c 15d
Stand density (stems ha−1) 2,353a 1,335ab 1,522ab 1,329ab 723b 986b
Soil taxonomy Ultisol Ultisol Ultisol Ultisol Ultisol Ultisol
SOC in 0–10 cm (g kg−1) 13.4(2.0)a 22.7(1.5)b 21.6(3.4)b 21.2(1.9)b 22.9(1.9)b 23.6(2.0)b
STN in 0–10 cm (g kg−1) 1.2(0.1)a 1.1(0.2)a 1.8(0.3)a 1.5(0.2)a 1.4(0.3)a 1.7(0.2)a
STP in 0–10 cm (g kg−1) 0.38(0.03)a 0.21(0.03)b 0.33(0.06)ab 0.29(0.03)ab 0.23(0.03)ab 0.36(0.03)ab
Values with different letters (a, b, and c) denote significant difference between planted and natural forests at the same ages or among the samemanagement forests at different ages (p< 0.05 based on Tukey’s honestly significant difference test). Values in parentheses are standard errors of themeans. SOC, STN, and STP are the abbreviation of soil organic carbon, soil total nitrogen, and soil total phosphorus
Table 2 Allometric growth equations used to estimate biomass forplanted and natural Masson’s pine
Organ Management Equation R2 P
Stem Planted 0.025 × (D2H)0.957 0.963 <0.0001
Natural 0.031 × (D2H)0.931 0.992 <0.0001
Branch Planted 0.062 × (D2H)0.696 0.865 <0.0001
Natural 0.024 × (D2H)0.755 0.818 <0.0001
Leaf Planted 0.103 × (D2H)0.508 0.811 <0.0001
Natural 0.142 × (D2H)0.374 0.732 <0.0001
Root Planted 0.006 × (D2H)0.946 0.995 <0.0001
Natural 0.005 × (D2H)0.991 0.905 <0.0001
D and H are diameter at 1.3 m height (cm) and tree height (m)respectively
464 L.-C. Chen et al.
and the total aboveground biomass for each plot in the plantedand natural forests respectively.
Although few dead trees standing at > 45° relative to theground were found only in the mature natural pine forests, thestanding dead trees were sampled within the entirety of eachplot. The biomass of the intact standing dead trees was esti-mated using the above allometric growth equation. For brokenstanding dead trees, the top and bottom diameters of eachpiece were recorded, and their volume was estimated as thefrustum of a cone (Fraver et al. 2007). The same decay classesand densities used for fallen coarse woody debris (CWD)wereutilized for standing dead trees. The biomass of broken stand-ing dead trees was calculated by multiplying their densities totheir volume.
The biomass of coarse root (≥ 2 mm) was also calculatedusing the allometric growth equations (Table 2). The coarseroot biomass of individual standard trees in the planted andnatural forests was determined through excavation, where acylinder extending from the ground projection of the crown ata depth of 60 cm was used to ascertain the data (Xiang et al.2011). Soil was carefully excavated at a 20-cm-depth intervalsand then sifted through a wire sieve (20-mm mesh), whereroots were separated into bags. Stumps and attached taprootswere pulled out. The soil residue remaining on the roots wasremoved by brushing and washing. All harvested roots wereweighed and divided into four categories according to themethod of Xiang et al. (2011). The subsamples of each cate-gory were brought to the laboratory and then dried at 65 °C toconstant weight. The moisture content was determined andused to calculate the dry mass of each category, and the totalroot biomass was achieved by combining the biomass of allcategories.
The biomass of fine root (< 2 mm) was measured using thesoil coring method (Helmisaari et al. 2007). Ten soil coreswere collected randomly from the 0–20 and 20–40 cmmineralsoil layers of each plot using a stainless steel cylinder with10 cm diameter. The fine roots were separated from the soil bywashing, and then dried at 65 °C for 48 hours to calculate thedry biomass on an area basis. The density of fine root biomass(Goodfriend et al. 1998) was calculated from the mean drybiomass of the sampled fine root (Bfr) and volume of thestainless steel cylinder (V) using the following equation: Dfr
= Bfr/V. The total belowground biomass is equal to the sum ofcoarse root and fine root biomass.
We used the destructive harvesting method to estimate thebiomass of the understory vegetation (herb and shrub). Three2 m×2 m shrub subplots and one 1 m×1 m herb quadrat persubplot were randomly selected within each 20 m×50 m plot.In each shrub subplot, all harvested materials were separatedinto its component parts and then weighed to determine thefresh weight of stems, branches, and leaves. In each herbsubplot, all herbs were clipped at ground line from each quad-rat and were weighed to determine the fresh weight of the
aboveground and belowground parts. Each component ofshrub and herb was sampled, and each sample was placed intoa separate plastic bag. The samples were transported to thelaboratory and then dried at 65 °C to constant weight beforebiomass measurement.
2.3 Debris biomass calculation
In this study, debris included standing litter and CWD.Standing litter, which is the litter on the soil surface, wasquantified by collecting all the litter and twigs (<2 cm diam-eter) within a randomly selected 1m×1m subplot in each plot(similar to the herb quadrat). After sampling, all plant mate-rials collected within these subplots were dried at 65 °C toconstant weight prior to biomass measurement.
Given the human intervention, CWD (>2 cm diameter)occurred only in the mature stand of the natural Masson’s pineforests. The amounts of CWD in the three 10 m×10 m sub-plots of mature stand in the natural forests were measured. TheCWD biomass was calculated as the product of CWD volumeand decay class-specific densities (Iwashita et al. 2013). Eachpiece of CWD was assigned to one of the five decay classesmodified from Keller et al. (Keller et al. 2004). Decay classes1–4 consist of successively more decomposed tree CWD, andthe decay class 5 comprises tree fern CWD. The densities (drymass/volume) of each decay class were quantified on repre-sentative samples from crosssections of debris collected in situfrom random locations using the water displacement method,except for decay class 1, which was based on live wooddensity.
2.4 Soil sampling
Soil sampling was conducted in five soil layers, namely, 0–10,10–20, 20–30, 30–50, and 50–100 cm, using a stainless steelcylinder with 5 cm diameter. In each 20 m×50 m plot, eightsoil cores were collected after removing the litter layer andthen mixed to effectively form one soil sample. All sampleswere passed through a 2-mm sieve to remove the organicfragments (plant material and root residues). Each samplewas then air-dried and stored at room temperature for chemi-cal analysis. The soil bulk density of the different soil layerswas also measured, using a soil bulk sampler with a 5 cmdiameter and a 5.0 cm high stainless steel cutting ring (threereplicates) in each plot. The original volumes of each soil coreand its dry mass after drying at 105 °C were measured. Thecoarse fractions (soil fraction>2 mm) of each sample werealso recorded.
2.5 Chemical analysis
All plant materials, including the components of tree species(stem, branch, leaf, and coarse and fine roots), shrub (stem,
Carbon stock density in planted versus natural Pinus massoniana 465
branch, and leaf), herb (aboveground and belowground), litter,and CWD of the different decay classes, were dried at 65 °Cfor two days and then ground to 0.25 mm before chemicalanalysis of organic carbon content. The soil samples wereair-dried at room temperature for 1 week and then ground to0.25 mm before chemical analysis. The carbon concentrationsof the plant and soil samples were measured using a C/Nanalyzer (Elementar, Germany).
2.6 Calculation and statistical analysis
The carbon stocks in the tree, shrub, herb, and woody debriswere estimated by multiplying their measured biomass to theircorresponding carbon concentrations. The soil carbon stockdensity (Cs, Mg ha−1) in each soil layer was calculated basedon soil organic carbon concentration (Cc, g kg−1), sampleddepth (D, cm), and bulk density (BD, g cm−3) using the fol-lowing equation:Cs = BD × D × Cc/10. The total soil carbonstock density was the sum of the carbon stock of each soillayer.
The characteristics of the Masson’s pine forests, such asage, slope, elevation, canopy closure, DBH, tree height, standdensity, plant biomass, and debris and soil carbon stock den-sities and their proportions in the planted and natural forestswere compared through ANOVA using SPSS StatisticsRelease 15.0 (SPSS Inc.). Tukey’s honestly significant differ-ence test was performed as a post-hoc test to separate themeans when significant differences exist. Significance levelswere set at p<0.05 in all statistical analyses.
3 Results
3.1 Biomass carbon stock density
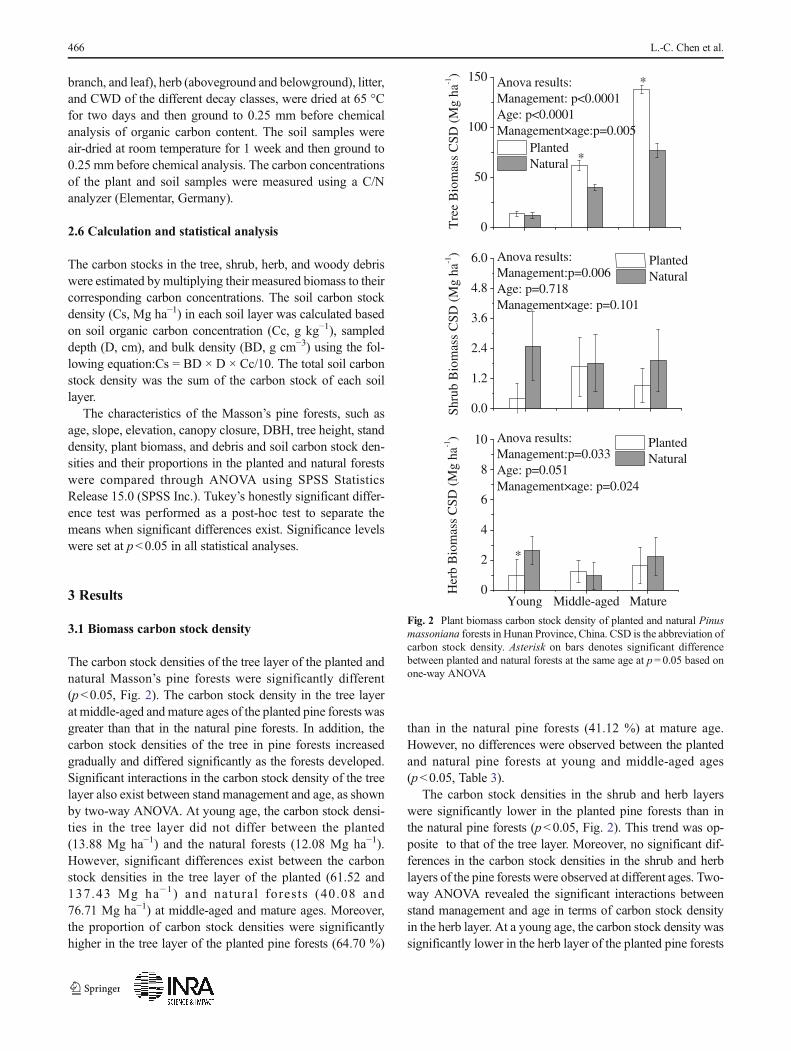
The carbon stock densities of the tree layer of the planted andnatural Masson’s pine forests were significantly different(p<0.05, Fig. 2). The carbon stock density in the tree layerat middle-aged and mature ages of the planted pine forests wasgreater than that in the natural pine forests. In addition, thecarbon stock densities of the tree in pine forests increasedgradually and differed significantly as the forests developed.Significant interactions in the carbon stock density of the treelayer also exist between stand management and age, as shownby two-way ANOVA. At young age, the carbon stock densi-ties in the tree layer did not differ between the planted(13.88 Mg ha−1) and the natural forests (12.08 Mg ha−1).However, significant differences exist between the carbonstock densities in the tree layer of the planted (61.52 and137.43 Mg ha−1) and natural forests (40.08 and76.71 Mg ha−1) at middle-aged and mature ages. Moreover,the proportion of carbon stock densities were significantlyhigher in the tree layer of the planted pine forests (64.70 %)
than in the natural pine forests (41.12 %) at mature age.However, no differences were observed between the plantedand natural pine forests at young and middle-aged ages(p<0.05, Table 3).
The carbon stock densities in the shrub and herb layerswere significantly lower in the planted pine forests than inthe natural pine forests (p<0.05, Fig. 2). This trend was op-posite to that of the tree layer. Moreover, no significant dif-ferences in the carbon stock densities in the shrub and herblayers of the pine forests were observed at different ages. Two-way ANOVA revealed the significant interactions betweenstand management and age in terms of carbon stock densityin the herb layer. At a young age, the carbon stock density wassignificantly lower in the herb layer of the planted pine forests
0
50
100
150
*
*
Tre
e B
iom
ass
CSD
(M
g ha
-1)
Planted Natural
Anova results:Management: p<0.0001Age: p<0.0001Management×age:p=0.005
0.0
1.2
2.4
3.6
4.8
6.0
Shru
b B
iom
ass
CSD
(M
g ha
-1)
Planted Natural
Anova results:Management:p=0.006Age: p=0.718Management×age: p=0.101
Young Middle-aged Mature0
2
4
6
8
10
*
Anova results:Management:p=0.033Age: p=0.051Management×age: p=0.024
Her
b B
iom
ass
CSD
(M
g ha
-1) Planted
Natural
Fig. 2 Plant biomass carbon stock density of planted and natural Pinusmassoniana forests in Hunan Province, China. CSD is the abbreviation ofcarbon stock density. Asterisk on bars denotes significant differencebetween planted and natural forests at the same age at p= 0.05 based onone-way ANOVA
466 L.-C. Chen et al.
(0.98Mg ha−1) than in the natural pine forests (2.64Mg ha−1),although the carbon stock density did not vary between theplanted (1.25 and 1.61Mg ha−1) and natural pine forests (0.95and 2.22 Mg ha−1) at middle-aged and mature ages. In addi-tion, the proportion of carbon stock density was significantlylower in the shrub layer of the planted pine forests (0.43 %)than in the natural pine forests (1.14 %) at mature age, and nodifference was observed between the planted and natural for-ests at young and middle-aged ages (p<0.05, Table 3). Nosignificant difference in the proportions of carbon stock den-sity in the herb layer was also observed between the plantedand natural pine forests at all ages.
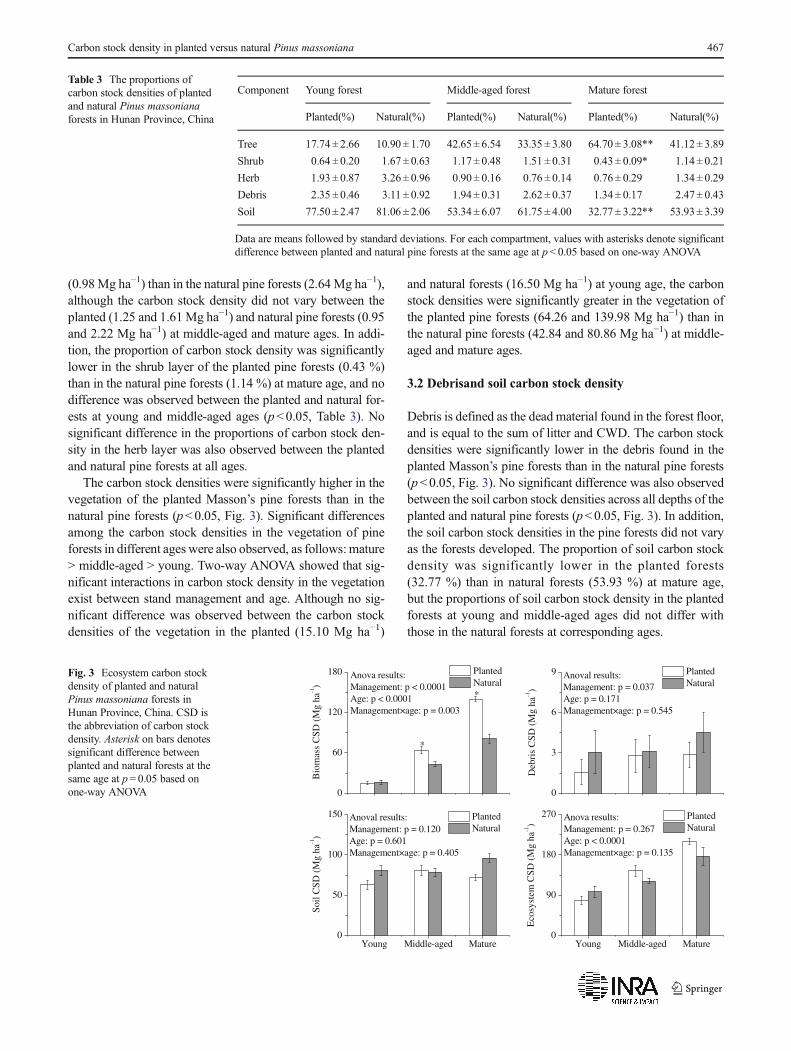
The carbon stock densities were significantly higher in thevegetation of the planted Masson’s pine forests than in thenatural pine forests (p<0.05, Fig. 3). Significant differencesamong the carbon stock densities in the vegetation of pineforests in different ages were also observed, as follows:mature> middle-aged > young. Two-way ANOVA showed that sig-nificant interactions in carbon stock density in the vegetationexist between stand management and age. Although no sig-nificant difference was observed between the carbon stockdensities of the vegetation in the planted (15.10 Mg ha−1)
and natural forests (16.50 Mg ha−1) at young age, the carbonstock densities were significantly greater in the vegetation ofthe planted pine forests (64.26 and 139.98 Mg ha−1) than inthe natural pine forests (42.84 and 80.86 Mg ha−1) at middle-aged and mature ages.
3.2 Debrisand soil carbon stock density
Debris is defined as the dead material found in the forest floor,and is equal to the sum of litter and CWD. The carbon stockdensities were significantly lower in the debris found in theplanted Masson’s pine forests than in the natural pine forests(p<0.05, Fig. 3). No significant difference was also observedbetween the soil carbon stock densities across all depths of theplanted and natural pine forests (p<0.05, Fig. 3). In addition,the soil carbon stock densities in the pine forests did not varyas the forests developed. The proportion of soil carbon stockdensity was significantly lower in the planted forests(32.77 %) than in natural forests (53.93 %) at mature age,but the proportions of soil carbon stock density in the plantedforests at young and middle-aged ages did not differ withthose in the natural forests at corresponding ages.
Table 3 The proportions ofcarbon stock densities of plantedand natural Pinus massonianaforests in Hunan Province, China
Component Young forest Middle-aged forest Mature forest
Planted(%) Natural(%) Planted(%) Natural(%) Planted(%) Natural(%)
Tree 17.74 ± 2.66 10.90 ± 1.70 42.65± 6.54 33.35 ± 3.80 64.70 ± 3.08** 41.12± 3.89
Shrub 0.64 ± 0.20 1.67± 0.63 1.17± 0.48 1.51 ± 0.31 0.43± 0.09* 1.14± 0.21
Herb 1.93 ± 0.87 3.26± 0.96 0.90± 0.16 0.76 ± 0.14 0.76± 0.29 1.34± 0.29
Debris 2.35 ± 0.46 3.11 ± 0.92 1.94± 0.31 2.62 ± 0.37 1.34± 0.17 2.47± 0.43
Soil 77.50 ± 2.47 81.06 ± 2.06 53.34± 6.07 61.75 ± 4.00 32.77 ± 3.22** 53.93± 3.39
Data are means followed by standard deviations. For each compartment, values with asterisks denote significantdifference between planted and natural pine forests at the same age at p< 0.05 based on one-way ANOVA
0
60
120
180
*
*
Anova results:Management: p < 0.0001Age: p < 0.0001Management×age: p = 0.003
Bio
mas
s C
SD (
Mg
ha-1
)
Planted Natural
0
3
6
9
Deb
ris
CSD
(M
g ha
-1)
Planted Natural
Anoval results:Management: p = 0.037Age: p = 0.171Management×age: p = 0.545
Young Middle-aged Mature0
50
100
150 Anoval results:Management: p = 0.120Age: p = 0.601Management×age: p = 0.405
Soi
l CS
D (
Mg
ha-1
)
Planted Natural
Young Middle-aged Mature0
90
180
270 Anova results:Management: p = 0.267Age: p < 0.0001Management×age: p = 0.135
Eco
syst
em C
SD (
Mg
ha-1)
Planted Natural
Fig. 3 Ecosystem carbon stockdensity of planted and naturalPinus massoniana forests inHunan Province, China. CSD isthe abbreviation of carbon stockdensity. Asterisk on bars denotessignificant difference betweenplanted and natural forests at thesame age at p= 0.05 based onone-way ANOVA
Carbon stock density in planted versus natural Pinus massoniana 467
3.3 Carbon stock density in forest ecosystem
The carbon stock densities of the planted and natural pineforest ecosystems are not significantly different (p<0.05,Fig. 3). Moreover, the carbon stock densities in the plantedand natural pine forest ecosystems increased gradually andthen differed significantly as the forests developed.
4 Discussion
4.1 Biomass carbon stock density
Vegetation is a very important carbon pool in forests (Fanget al. 2005). The carbon stock density in the vegetation of theplanted Masson’s pine forests increased from 15.1 Mg ha−1 to140.0 Mg ha−1 as the forests developed. These values arefound within the range of biomass carbon stock density(8.4–145.7 Mg ha−1) reported for the Masson’s pine forestsin China (Huang et al. 2008, 2013; Wu et al. 2012). By con-trast, the biomass carbon stock density in the natural Masson’spine forests ranged from 16.5Mg ha−1 to 80.9Mg ha−1, whichexceeded the range of the biomass carbon stock density (20.4–64.4 Mg ha−1) reported for the natural pine forests in HubeiProvince (Pang et al. 2014). The biomass carbon stock densitywere significantly greater in the planted than in natural pineforests, especially in mature age. The changes of carbon stockdensities in the vegetation of planted forests at young andmiddle-aged ages compared to mature age were 124.88 and75.72 Mg ha−1, and they were much larger than that of naturalforests (64.36 Mg ha−1 for young and 38.02 Mg ha−1 formidle-aged). This result is consistent with that obtained byGuo and Ren (2014), who suggested that planted forestsexihibit much higher productivity and thus much highercarbon sequestration rates than natural forests. Huang et al.(2008) also found that the annual increment of carbon stocksis much greater in planted forests than that in natural forests inSichuan Province in China. The differences in the biomasscarbon stock density of the planted and natural pine forestswere due to several reasons. First, the allelometric growthequations for the planted and natural Masson’s pine varied(Table 2). Being the most important component of vegetation,the tree biomass exerts much influence on the carbon stockdensity in the vegetation. Typically, we used each allelometricgrowth equation for planted and natural Masson’s pine; treebiomass of planted pine was more than that of natural pine.For example, if the DBH and height of a pine tree are 15.3 cmand 11 m, by using each equation, the tree biomass of theplanted and natural pine are 76.3 and 70.1 kg respectively.Second, the management intensity in the planted and naturalpine forests varied. Management practices (higher interven-tion intensity) are usually implemented in the planted pineforests; however, lower intensity of human intervention, such
as fire wood collection and grazing by cattles, is practised inthe natural pine forests. Increased management intensity hasbeen shown to enhance the yield and carbon storage of bio-mass (Wade et al. 2010). In subtropical China, the understoryplants in the planted pine forest at young age are usually re-moved to improve the pine tree’s survival rate. Understoryremoval affects tree growth and increases carbon stock densityin the vegetation (Wu et al. 2013). Thinning and fertilizationregimes are also common management practices. Thinningregimes increase the carbon stock density in total above-ground biomass (Finkral and Evans 2008; Garcia-Gonzaloet al. 2007). Because thinning is a usual management practice,the stand densities of the planted pine forests decrease signif-icantly as the forests develop. However, our study found thatthe stand densities of the natural forests did not change as theforests developed (Table 1). Fertilization also increases the netprimary productivity and net ecosystem productivity(Sampson et al. 2006). However, in this study, soil total nitro-gen of planted pine forests was similiar to that of natural for-ests, and the difference in soil total phosphorus was onlyfound in planted and natural forests at young age, but not atother ages. It indicated that soil fertility was not the cause ofdifference in carbon stock densities in the vegetation betweenplanted and natural pine forests. Thus, management practices,such as understory control and thinning, resulted in an in-crease in forest productivity and timber product in HunanProvince and enhanced the biomass carbon stock density inthe planted forests. These data indicate that more atmosphericcarbon are sequestered in the vegetation biomass carbon of thethe planted pine forest than of the natural pine forest.
Stand age is one of the factors that controls forest ecosys-tem biomass and is commonly positively related to biomasscarbon stock density of forest ecosystems (Du et al. 2013; Guoand Ren 2014). Stand age can explain the significantly in-creased carbon stock density in the vegetation of the plantedand natural pine forests as the forests develop. Being the mostimportant component of vegetation, the tree biomass increasessignificantly with the increase in stand age, resulting in theincrease in carbon stock density in the vegetation as the forestsdevelop. This study found significant interactions betweenstand management and age in terms of tree and carbon stockdensity in the vegetation. The carbon stock densities of thetrees and other forms of vegetation in the planted and naturalforests did not differ at young age, although they were signif-icantly greater in the planted forests than in natural forests atlater ages, especially at mature age. This difference was alsocaused by the differences in the allelometric growth equationof the planted and natural Masson’s pine trees. The resultsindicated that prolonged rotation time of pine plantation isbeneficial in sequestering carbon and in mitigating global cli-mate change.
Although the tree biomass contributed the largest propor-tion of vegetation biomass in these forests, the shrub and herb
468 L.-C. Chen et al.
biomass also accounted for 0.6–13.2 % and 1.1–23.2 % re-spectively. This study also found low contribution of under-story biomass, although it comprises one-third of the totalvegetation biomass at young age. Du et al. (2013) reportedthat biomass of the understory is approximately five times thatof the tree in the planted Masson’s pine forest at 5 years old.Thus, the shrub and herb components can not be ignored whenestimating carbon stocks in Masson’s pine forests, especiallyat young age. Significant differences were also observed in theinteraction between stand management and age in terms ofcarbon stock density in the herb layer. In addition, the carbonstock density in the herb layer was significantly lower in theplanted forests than in the natural forests at young age, but didnot differ at middle-aged and mature ages. This result iscaused by removal of the understory in the planted forests atyoung age. However, Wu et al. (2013) reported that understo-ry removal increases carbon stock density in the vegetation.Thus, the trade-off of understory removal on herb and carbonstock densities in the vegetation of forest ecosystems is veryimportant in carbon sequestration.
4.2 Carbon stock density in the debris
Litter (or debris) is an important source of the soil carbon pool(Osono et al. 2014) and affects the soil carbon stock density(Muller et al. 2009). The carbon stock densities in the debris inthe planted Masson’s pine forests ranged from 1.6 Mg ha−1to2.9 Mg ha−1 and were significantly lower than those in thenatural pine forests (3.0Mg ha−1 to 4.5Mg ha−1). The changesof carbon stock densities in the debris of planted forests atyoung and middle-aged ages compared to mature age were1.30 and 0.09 Mg ha−1 respectively, and were less than that ofnatural forests, which were 1.47 and 1.40 Mg ha−1. This find-ing is consistent with the results of Du et al. (2013) and Panget al. (2014). The litter carbon stock in planted pine forestsreported by Du et al. (2013) ranges from 1.6 Mg ha−1 to3.0 Mg ha−1 and is lower than that reported by Pang et al.(2014), who found that litter carbon stock density in naturalpine forests ranged from 1.7 Mg ha−1 to 4.2 Mg ha−1. Thisfinding may be attributed to the management treatments im-plemented in the planted forests and to the absence of humanintervention in the natural forests. Reforestation followingclear-cutting and slash-burning is a traditional silviculturalpractice in South China (Guo et al. 2006). The debris on standfloor is transformed mostly into CO2, and is released into theatmosphere following slash-burning. Approximately10 Mg ha−1 carbon in debris (harvest residues) is directly lostin volatile forms resulting from burning (Yang et al. 2005),thereby reducing the carbon stock density in the debris inplanted pine forests. In addition, litter management in plantedpine forests also affects the carbon stock density in the debris.Debris are usually collected and used as burning material,
resulting in reduced carbon stock density in the debris inplanted pine forests.
4.3 Soil carbon stock density
Globally, over two-thirds of the carbon pools in forest ecosys-tems are contained in soil (Dixon et al. 1994). This studyfound that the carbon pools stored in soils across all depthsaccounted for 32.8–77.5 % and 53.9–81.1 % of the carbonpools in the planted and natural pine forest ecosystems respec-tively. This finding is consistent with the results of Pang et al.(2014), who found that 55.1–65.6 % of forest ecosystem car-bon is stored in soil. Although soil carbon stock densities inpine forests tended to increase as forests developed, they didnot differ in the pine forests at young, middle-aged, and ma-ture ages, possibly because the slight changes in soil carbonstock density did not affect the overall soil carbon pool. Thesedata indicated that the soil carbon pool is relatively stable anddoes not readily change within a short term. Compared withthat of the soil carbon pool, the role of vegetation biomasscarbon pool in mitigating global climate change is strongerbecause the carbon stock density in the vegetation changessignificantly as the forests develop.
Although the soil carbon stock densities in the planted andnatural pine forests did not differ, that in the planted pineforests tended to decrease compared with that in the naturalforests. The changes of soil carbon stock densities of plantedpine forests at young and middle-aged ages compared to ma-ture age were 8.96 and -8.03 Mg ha−1, and were less thanthose of natura l fores ts , which were 15.25 and17.68 Mg ha−1. This indicated that there was a larger carbonsequestration potential in soil of natural pine forests comparedto planted forests. Land-use history is possibly one of thefactors causing the difference in soil carbon stock densitiesbetween the planted and natural pine forests. In this study,the planted pine forests were all established after clear-cutting and slash-burning of the existing Chinese fir planta-tions, whereas the natural pine forests were established natu-rally. Afforestation of the Chinese fir plantation has beenshown to decrease soil carbon stock density compared withthe natural broadleaved forest (Chen et al. 2013). Moreover,Yang et al. (2005) reported that approximately 7 Mg ha−1 oftopsoil carbon is lost by the slash-burning of Chinese fir plan-tations. In Australia, soil carbon loss in radiata pine planta-tions after burning is estimated to be 2.4 Mg ha−1 (Turner andLambert 2000). Thus, afforesting pine forests in Chinese firplantations after slash-burning may result in soil carbon loss.In addition, management practices, such tree thinning andslash-burning, which are implemented in planted pine forestsexert different effects on soil carbon. Studies have reportedthat management practices such as prescribed fire, mechanicaltreatment, and thinning do not affect soil carbon stock density(Boerner et al. 2008; Liang et al. 2013; Nilsen and Strand
Carbon stock density in planted versus natural Pinus massoniana 469
2008). However, other studies have reported that managementpractices do affect soil carbon stock density of planted forests(Tian et al. 2010; Wu et al. 2013). Thinning regimes increasessoil carbon storage in Masson’s pine forests (Tian et al. 2010).Wu et al. (2013) suggested that understory removal decreasessoil carbon storage in Cinnamomum camphora forests. Thisfinding is attributed to several reasons. First, the manner bywhich these management practices, such as thinning, under-story removal, slash-burning, and fertilization, were imple-mented varies. Thus, they exert different effects on soil carbonstock density. Second, the degree of implementation of thesemanagement practices varies. Thinning intensity slightly af-fects the carbon stock in red pine, whereas increasing themanagement intensity greatly reduces carbon stock in north-ern hardwoods (Powers et al. 2011). Lastly, the tree speciesvary. For example, thinning reduces the carbon stock densityin aboveground biomass in P. ponderosa forest (Finkral andEvans 2008), but increases the carbon stock density inP. sylvestris and P. abies forests (Garcia-Gonzalo et al. 2007).
Overall, more carbon is sequestered in the carbon biomassof the planted Masson’s pine forests than that of the naturalpine forests. However, no significant difference exists be-tween the carbon stock density of the two pine forest ecosys-tems, because of the decrease of carbon stock densities in soiland debris of planted forests compared to natural forests.Selecting and optimizing the forest management practices inplantations will increase soil carbon stock density in theplanted forest, which is a very important process in carbonsequestration and global climate change mitigation. The po-tential of the Masson’s pine forests in Hunan Province, China,to sequester carbon is enormous given the growing area of theplanted forests and the changes in carbon uptake with standdevelopment. Moreover, selecting the appropriate manage-ment practices can help achieve this goal.
5 Conclusion
The carbon stock densities in the planted and natural Masson’spine forest ecosystems ranged from 78 Mg ha−1 to210 Mg ha−1 and from 97 Mg ha−1 to 177 Mg ha−1 respec-tively, of which 15–140 and 17–81 Mg ha−1 biomass valuesare the carbon stock densities in the planted and natural forestsrespectively. In addition, the biomass carbon stock densitieswere much greater in the planted pine forests than in the nat-ural pine forests. By contrast, the carbon stock densities in thedebris were lower in the planted forests than in the naturalforests. However, the soil carbon stock densities in the plantedand natural pine forests did not differ, although a decreasetrend of soil carbon stock densities appeared in planted forestscompared to natural forests. The decrease of carbon stockdensities in the debris and soil of planted forests comparedto natural forests counteracted the increase of biomass carbon
stock densities, and resulted in no difference in carbon stockdensities between planted and natural forests at ecosystemlevel. The biomass carbon stock densities of pine forests in-creased significantly as the forests developed, although nochange was observed in the debris and soil carbon stock den-sities. These results indicate that the potential of the matureMasson’s pine forests to sequester carbon is enormous.Moreover, the planted forests can sequester more biomasscarbon than the natural forests. The key is to understand andoptimize forest management practices aimed at increasing for-est carbon sinks.
Acknowledgments We gratefully acknowledge Shi-Jian Deng, BingFan, Wei-Dong Zhang, and Hai-Jun Yang for their valuable assistancein the field survey. We are grateful to the assistance of Professor EmeritusJohn A. Helms, College of Natural Resources, University of California,Berkeley, for his valuable comments.We greatly appreciate the commentsof the reviewers and the editor, which have substantially enhanced thequality of the manuscript.
Compliance with ethical standards
Funding This study was supported by the Strategic Priority ResearchProgram of the Chinese Academy of Sciences (XDA05050205) and theNational Basic Research Program of China (973 program no.2012CB416905).
References
Boerner REJ, Huang JJ, Hart SC (2008) Fire, thinning, and the carboneconomy: effects of fire and fire surrogate treatments on estimatedcarbon storage and sequestration rate. For Ecol Manag 255:3081–3097. doi:10.1016/j.foreco.2007.11.021
Chen GS, Yang YS, Xie JS, Guo JF, Gao R, Qian W (2005) Conversionof a natural broad-leafed evergreen forest into pure plantation forestsin a subtropical area: effects on carbon storage. Ann For Sci 62:659–668. doi:10.1051/forest.2005073
Chen GS, Yang ZJ, Gao R, Xie JS, Guo JF, Huang ZQ, Yang YS (2013)Carbon storage in a chronosequence of Chinese fir plantations insouthern China. For Ecol Manag 300:68–76. doi:10.1016/j.foreco.2012.07.046
Del LungoA, Ball J, Carle J (2006) Global planted forests thematic study:results and analysis. FAO Planted Forests and Trees Working Paper38. FAO, Rome
Ding GJ, Wang PC (2001) Study on change laws of biomass and produc-tivity of Masson pine forest plantation. Biomass and productivity ofstand ar different ages. For Res Sin 15:54–60
Dixon RK, Brown S, Houghton RA, Solomon AM, Trexler MC,Wisniewski J (1994) Carbon pools and flux of global forest ecosys-tems. Science 263:185–190
Du H, Song TQ, Zeng FP, Wen YG, Peng WX (2013) Biomass and itsallocation in Pinus Massoniana plantation at different stands ages ineast Guangxi. Acta Bot Bor Occid Sin 33:394–400
Fang JY, Oikawa T, Kato T, Mo WH, Wang ZH (2005) Biomass carbonaccumulation by Japan’s forests from 1947 to 1995. GlobBiogeochem Cycles 19:Gb2004. doi:10.1029/2004gb002253
FangHJ, YuGR, Cheng SL, Zhu TH, Zheng JJ,Mo JM, Yan JH, LuoYQ(2011) Nitrogen-15 signals of leaf-litter-soil continuum as a possible
470 L.-C. Chen et al.
indicator of ecosystem nitrogen saturation by forest succession andN loads. Biogeochemistry 102:251–263. doi:10.1007/s10533-010-9438-1
Food and Agricultural Organization of the United Nations (2010) Globalforest resources assessment 2010. FAO, Rome
Finkral AJ, Evans AM (2008) Effects of a thinning treatment on carbonstocks in a northern Arizona ponderosa pine forest. For Ecol Manag255:2743–2750. doi:10.1016/j.foreco.2008.01.041
Forestry Department of Hunan Province PRC (2010) Hunan provinceforest inventory database. Forestry Department of HunanProvince, China
Fraver S, Ringvall A, Jonsson GB (2007) Refining volume estimates ofdown woody debris. Can J For Res 37:627–633
Garcia-Gonzalo J, Peltola H, Briceno-Elizondo E, Kellomaki S (2007)Changed thinning regimes may increase carbon stock under climatechange: a case study from a Finnish boreal forest. Clim Chang 81:431–454. doi:10.1007/s10584-006-9149-8
GoodfriendWL, Olsen MW, Frye RJ (1998) Decomposition of seawater-irrigated halophytes: implications for potential carbon storage. PlantSoil 202:241–250. doi:10.1023/a:1004360422347
Guo Q, Ren H (2014) Productivity as related to diversity and age inplanted versus natural forests. Glob Ecol Biogeogr 23:1461–1471.doi:10.1111/geb.12238
Guo JF, Yang YS, Chen GS, Xie JS, Lin P (2006) Soil C and N poolsin Chinese fir and evergreen broadleaf forests and their changeswith slash burning in mid-subtropical China. Pedosphere 16:56–63
Helmisaari HS, Derome J, Nojd P, Kukkola M (2007) Fine root biomassin relation to site and stand characteristics in Norway spruce andScots pine stands. Tree Physiol 27:1493–1504
Huang CD, Zhang J, Yang WQ, Tang X, Zhao AJ (2008) Dynamics offorest carbon stock in Sichuan province and Chongqing city. ActaEcol Sin 28:966–975
Huang SL, Xu HQ, Lin N, Zeng HD, Liu ZC, Chen WH, Wang L, YangRR (2013) Remote-sensing estimate of the carbon storage of sub-tropical Pinus massoniana forest in the Hetian Basin of countyChangting, China. Acta Ecol Sin 33:2992–3001
Iwashita DK, Litton CM, Giardina CP (2013) Coarse woody debris car-bon storage across a mean annual temperature gradient in tropicalmontane wet forest. For Ecol Manag 291:336–343. doi:10.1016/j.foreco.2012.11.043
Jandl R, Lindner M, Vesterdal L, Bauwens B, Baritz R, Hagedorn F,Johnson DW, Minkkinen K, Byrne KA (2007) How strongly canforest management influence soil carbon sequestration? Geoderma137:253–268. doi:10.1016/j.geoderma.2006.09.003
Keller M, Palace M, Asner GP, Pereira R, Silva JNM (2004) Coarsewoody debris in undisturbed and logged forests in the easternBrazilian Amazon. Glob Chang Biol 10:784–795. doi:10.1111/j.1529-8817.2003.00770.x
Laganière J, Angers DA, Paré D (2010) Carbon accumulation in agricul-tural soils after afforestation: a meta-analysis. Glob Chang Biola 16:439–453. doi:10.1111/j.1365-2486.2009.01930.x
Li DJ, Niu SL, Luo YQ (2012) Global patterns of the dynamics of soilcarbon and nitrogen stocks following afforestation: a meta-analysis.New Phytol 195:172–181. doi:10.1111/j.1469-8137.2012.04150.x
Liang F, Jia ZK, Ma LY (2013) The effects of thinning on carbon stocksand fluxes in a Chinese arborvitae plantation. For Chron 89:199–204. doi:10.5558/tfc2013-038
Liao CZ, Luo YQ, Fang CM, Li B (2010) Ecosystem carbon stock influ-enced by plantation practice: implications for planting forests as ameasure of climate change mitigation. Plos One 5:e10867. doi:10.1371/journal.pone.0010867
Liu Q (1996) Studies of the biomass and productivity of differentage-group Pinus massoniana plantation. J Centr South ForUniv 16:47–51
Liu J, Li S, Ouyang Z, Tam C, Chen X (2008) Ecological and socioeco-nomic effects of China’s policies for ecosystem services. PNAS 105:9477–9482. doi:10.1073/pnas.0706436105
Mo JM, Brown S, Kong GH, Zhang YC, Lenart M (1999) Nutrientdistribution and cycling of a Masson’s pine planted forest inDinghushan. Acta Ecol Sin 19:635–640
Muller M, Alewell C, Hagedorn F (2009) Effective retention of litter-derived dissolved organic carbon in organic layers. Soil BiolBiochem 41:1066–1074. doi:10.1016/j.soilbio.2009.02.007
Nilsen P, Strand LT (2008) Thinning intensity effects on carbon andnitrogen stores and fluxes in a Norway spruce (Picea abies (L.)Karst.) stand after 33 years. For Ecol Manag 256:201–208. doi:10.1016/j.foreco.2008.04.001
Niu X, Duiker SW (2006) Carbon sequestration potential by afforestationof marginal agricultural land in the Midwestern U.S. For EcolManag 223:415–427. doi:10.1016/j.foreco.2005.12.044
Osono T, Azuma J, Hirose D (2014) Plant species effect on the decom-position and chemical changes of leaf litter in grassland and pine andoak forest soils. Plant Soil 376:411–421
Pang H, Wang X, Zhang J, Zheng L, Cui H (2014) Characteristics ofcarbon storage and carbon density of Pinus massoniana naturalforests in Hubei Province, China. J Northeast For Univ 42:40–43
Perez-Quezada JF, Delpiano CA, Snyder KA, Johnson DA, Franck N(2011) Carbon pools in an arid shrubland in Chile under naturaland afforested conditions. J Arid Environ 75:29–37. doi:10.1016/j.jaridenv.2010.08.003
Powers M, Kolka R, Palik B, McDonald R, Jurgensen M (2011) Long-term management impacts on carbon storage in Lake States forests.For Ecol Manag 262:424–431. doi:10.1016/j.foreco.2011.04.008
Sampson DA, Waring RH, Maier CA, Gough CM, Ducey MJ, JohnsenKH (2006) Fertilization effects on forest carbon storage and ex-change, and net primary production: a new hybrid process modeltor stand management. For Ecol Manag 221:91–109. doi:10.1016/j.foreco.2005.09.010
State Forestry Administration PRC (2009) The bulletin of China’s forestresource: the Seventh National Forest Resources Inventory. ChinaForestry Press, Beijing
Tang GY, Li K (2013) Tree species controls on soil carbon sequestrationand carbon stability following 20 years of afforestation in a valley-type savanna. For Ecol Manag 291:13–19. doi:10.1016/j.foreco.2012.12.001
Thornley JHM, Cannell MGR (2000) Managing forests for wood yieldand carbon storage: a theoretical study. Tree Physiol 20:477–484
Tian DL, Peng YY, Yan WD, Fang X, Kang WX, Wang GJ, Chen XY(2010) Effects of thinning and litter fall removal on fine root pro-duction and soil organic carbon content in Masson pine plantations.Pedosphere 20:486–493
Turner J, Lambert M (2000) Change in organic carbon in forest plantationsoils in eastern Australia. For Ecol Manag 133:231–247
Vesterdal L, Rosenqvist L, van der Salm C, Groenenberg B-J, JohanssonM-B, Hansen K (2006) Carbon sequestration in soil and biomassfollowing afforestation: experiences from oak and Norway sprucechronosequences in Denmark, Sweden, and the Netherlands. In:Heil G, Muys B, Hansen K (eds) Environmental effects of affores-tation in North-Western Europe from field observations to decisionsupport. Springer, Berlin, pp 19–51
Wade ASI, Asase A, Hadley P, Mason J, Ofori-Frimpong K, Preece D,Spring N, Norris K (2010) Management strategies for maximizingcarbon storage and tree species diversity in cocoa-growing land-scapes. Agric Ecosyst Environ 138:324–334. doi:10.1016/j.agee.2010.06.007
Wang QK, Wang SL, Zhong MC (2013) Ecosystem carbon storage andsoil organic carbon stability in pure and mixed stands ofCunninghamia lanceolata and Michelia macclurei. Plant Soil 370:295–304. doi:10.1007/s11104-013-1631-2
Carbon stock density in planted versus natural Pinus massoniana 471

Winjum JK, Schroeder PE (1997) Forest plantations of the world: theirextent, ecological attributes, and carbon storage. Agric For Meteorol84:153–167. doi:10.1016/s0168-1923(96)02383-0
Wu T, Peng C, Tian DL, Yan WD (2012) Spatial distribution of carbonstorage in a 13-year-old Pinus massoniana forest ecosystem inChangsha City, China. Acta Ecol Sin 32:4034–4042
WuY-C, Li Z-C, Cheng C-F, Liu R-J,WangB, Geri L-T (2013) Effects ofunderstory removal on forest carbon storage in Cinnamomumcamphora plantation ecosystem. Chin J Plant Ecol 37:142–149.doi:10.3724/sp.j.1258.2013.00015
Xiang WH, Liu SH, Deng XW, Shen AH, Lei XD, Tian DL, Zhao MF,Peng CH (2011) General allometric equations and biomass alloca-tion of Pinus massoniana trees on a regional scale in southern China.Ecol Res 26:697–711
Yan JH, Zhang DQ, Zhou GY, Liu JX (2009) Soil respiration associatedwith forest succession in subtropical forests in Dinghushan
Biosphere Reserve. Soil Biol Biochem 41:991–999. doi:10.1016/j.soilbio.2008.12.018
Yang YS, Guo J, Chen G, Xie J, Gao R, Li Z, Jin Z (2005) Carbon andnitrogen pools in Chinese fir and evergreen broadleaved forests andchanges associated with felling and burning in mid-subtropicalChina. For Ecol Manag 216:216–226. doi:10.1016/j.foreco.2005.05.030
Yang HX, Wang SL, Zhang JW, Fan B, Zhang WD (2011) Biomassand nutrients of Pinus massoniana plantations in southernChina: simulations for different managing practices. J FoodAgr Environ 9:689–693
Zeng ZQ,Wang SL, Zhang CM, Gong C, Hu Q (2013) Carbon storage inevergreen broad-leaf forests in mid-subtropical region of China atfour succession stages. J For Res 24:677–682. doi:10.1007/s11676-013-0404-3
472 L.-C. Chen et al.