understorey vegetation and the crown … · bandara et al. — biomass allocation and crown...
TRANSCRIPT
Bandara et al. — Biomass allocation and crown architecture of Pinus radiata 139
New Zealand Journal of Forestry Science 34(2): 139–157 (2004)
UNDERSTOREY VEGETATION AND THECROWN ARCHITECTURE OF
PINUS RADIATA SEEDLING AND CLONAL TREESIN AN AGROFORESTRY SYSTEM
G. D. BANDARA, D. J. MEAD,Soil, Plant and Ecological Science Division,
P. O. Box 84, Lincoln University, New Zealand
and D. WHITEHEAD*Landcare Research,
P. O. Box 69, Lincoln 8152, New Zealand
(Received for publication 13 February 2001; revisions 23 March 2004, 21 December 2004)
ABSTRACTCrown characteristics of 4-year-old Pinus radiata D.Don originating from
seedlings and clonal trees propagated by tissue culture, and growing in the presenceand absence of an understorey of lucerne (Medicago sativa L.), in an agroforestryexperiment were investigated to explain differences in foliage efficiency between thetreatments.
There was no difference in the tree height between selected sample trees for anyof the treatments, but the diameter at breast height (1.4 m above ground-level) andthe total tree biomass were larger for the clonal trees than for the trees originatingfrom seedlings in the no-understorey treatment. The distribution of biomass withinthe crown showed marked differences between treatments. Branch basal area and thenumber of medium-sized branches were greater for the clonal trees than for theseedling trees, and foliage area per unit branch basal area was lower for the clonaltrees than the seedling trees. Internode length was longer and the crown shape ratiohigher for the clonal trees than the seedling trees. These differences in crownarchitecture resulted in differences in foliage area distribution within the crown,possibly leading to differences in the fraction of solar radiation intercepted.
The allocation of above-ground biomass was changed, resulting in an increase inthe stem wood fraction and a decrease in the branch fraction for trees growing withthe lucerne understorey, compared with trees with no understorey present. Foliagearea per unit branch basal area was lower for trees grown with the lucerne understoreythan in the no-understorey treatment and these changes were more pronounced for theseedling than for the clonal trees. These results confirm that the competitive effectsof understorey vegetation result in changes in the growth patterns of trees, includingthe allocation of biomass to above-ground components.
Keywords: biomass allocation; competition; foliage distribution; canopy architecture;agroforestry.
* Corresponding author
140 New Zealand Journal of Forestry Science 34(2)
INTRODUCTION
A plantation programme based on the selection of superior clonal trees of Pinus radiataoffers the possibility of large gains in growth compared with trees derived from seedlings(Shelbourne 1991). However, clonal trees grown from cuttings by tissue culture may showdifferences in canopy architecture distinct from seedling trees of the same chronologicalage (Fielding 1970; Burdon & Bannister 1985; Eldridge & Spencer 1988) due to differencesin physiological age. Crown architecture determines foliage display, foliage distribution,and canopy foliage area density. These, in turn, influence light interception, canopytranspiration, water and nutrient distribution, and subsequently carbon assimilation (Jahnke& Lawrence 1965; Kellomäki et al. 1984; Whitehead 1986; Grace 1988; Kuuluvainen etal. 1988). The distribution of foliage mass within the forest canopy and within individualcrowns (Wang et al. 1990; Whitehead et al. 1990; Maguire & Bennett 1996) has been usedto explain the differences in growth between individual trees (Pulkkinen 1991; Hees & VanBartelink 1993).
Previous studies have also shown that characteristics of crown structure are highlycorrelated with tree productivity (Velling & Tigerstedt 1984; Knowles & West 1986;Kuuluvainen et al. 1988; Pulkkinen 1991). Many environmental factors are known to affectcrown development in P. radiata (Linder et al. 1987; Carson & Inglis 1988; Raison et al.1992; Burdon et al. 1997). Further, growth rate of P. radiata is reduced when water andnutrients are restricted by environmental conditions (Mead & Mansur 1993; Yunusa et al.1995a) or when there is competition for resources by understorey vegetation (Richardsonet al. 1996, 2002; Watt, Whitehead, Richardson, Mason, & Leckie 2003). This may alsoresult in changes in growth rate and patterns of biomass allocation between tree components(Mead et al. 1984; Snowdon & Benson 1992; Gautam et al. 2003; Watt, Whitehead, Mason,Richardson, & Kimberley 2003). A number of studies have demonstrated that genotype,propagation method, and environment affect crown structure and tree growth (Kuuluvainenet al. 1988; Menzies & Klomp 1988; West 1988; Hinckley et al. 1992). To explaindifferences in productivity of trees propagated using tissue culture or as seedlings, it isnecessary to determine the response of canopy architecture and tree growth to water andnutrient availability in relation to competition from understorey vegetation.
This study was carried out to compare the above-ground biomass production andallocation patterns in large trees originating from seed and a tissue culture clone in relationto understorey competition, and to investigate the variations in crown architecture resultingfrom the differences in biomass allocation. The results were used to explain the relationshipbetween crown architecture and previously observed higher foliage efficiency (E, biomassincrement per year per unit foliage mass) in the different treatments (Bandara 1997).
MATERIALS AND METHODS
Site, Trial Design, and Materials
The site, trial design, and materials have been described in detail by Mead et al. (1993).Briefly, the soil was Templeton silt loam, medium- to free-draining with 320 mm water-holding capacity in the top metre of the profile. The mean annual temperature was 11°C andlong-term mean (± standard deviation) annual rainfall was 660 ± 40 mm. The P. radiata

Bandara et al. — Biomass allocation and crown architecture of Pinus radiata 141
trees were planted in 1990 in a split-plot design with three blocks. The main plots consistedof five understorey pasture treatments plus a no-understorey control treatment. For thisstudy, lucerne, the most competitive of the understorey species (Mead et al. 1993), and theno-understorey treatments were selected for the measurements. Within these main plotswere subplots consisting of trees from five types of planting material. Four of these wereclones derived from tissue culture and the fifth was seedlings from the “850” selection.Clone 3, set 11/8: full sib of “875” clones 7×292, and the seedling trees were used in thisstudy. The growth and form ratings (Hammond 1995) expected for the clonal and seedlingtrees were about 17 and 14, respectively. The clonal trees were 6 years old from seed whenplanted and 10 years old from seed when the measurements were made. The seedling treeswere 4 years old when the measurements were made (5 years after germination). Treespacing was 600 stems/ha, the trees had not been pruned, and crown inter-tree competitionwas not apparent. The pasture understorey was grazed by sheep in the spring and autumnand the maximum canopy height was 200–300 mm, so the competitive effects of theunderstorey were considered to be attributable solely to nutrients and water availability.
Biomass Measurements
Twelve sample trees (representing the two planting material types, the two understoreytreatments and three replicates) were selected for detailed measurements of crownarchitecture. The sample trees were selected to give a range in diameter at breast height(1.4 m above ground level) D, for each treatment. Before these trees were felled forestimation of biomass, 30 fascicles from each age class and from each tree were collectedfrom all over the crown. These fascicles were stored in a refrigerator and used later forspecific needle area measurements (following Beets 1977). Tree heights, crown diameters,and mean branch tip height for each branch cluster were measured using a telescopicmeasuring pole in the field. The selected trees were then felled and brought to the laboratoryand set upright for measurements of maximum crown width. An average-sized samplebranch from each branch cluster of sample trees was selected for detailed measurements.In order to estimate the foliage area and its distribution for these sample branches,measurements of height of the branch cluster, horizontal distance from the tree stem to theproximal end of the branch, basal diameter (50 mm from the point of attachment), andlength for each age class of foliage were recorded. Also, the distance from the base of thesample branch, basal diameter, and length for each age class of foliage were measured forall second-order branches. Second-order branches were removed and separated into ageclasses, and their fresh mass was recorded. The first-order sample branches were thenseparated into age classes and their fresh mass was recorded. All the components of thesesample branches (branch portions separated by age classes) were oven dried at 65°C,separated into foliage and branch wood, and weighed. All remaining branches in eachcluster were then removed and branch basal diameters were measured. The foliage andbranches were separated into age classes and fresh mass was recorded for each branchcluster. Finally, to obtain the dry mass of stem wood and stem bark, the total stem was firstweighed green, then 30-mm-thick discs were taken at 400-mm intervals along the tree stemand weighed. These subsamples were separated into wood and bark, dried at 65°C, andweighed. Total dry mass of stem and crown components was calculated using the ratio offresh to dry mass from the subsamples.
142 New Zealand Journal of Forestry Science 34(2)
From the dry mass of foliage and specific needle area, estimated from the fasciclesamples collected before trees were felled, the foliage area was calculated and presented onan all-surfaces-area basis (Grace 1987).
The vertical distribution of foliage area for a tree was reconstructed from each samplebranch. Foliage area density was calculated in 100-mm vertical intervals, based on thegeometric space occupied by the branch, the position of first- and second-order branches,and foliage mass. Using this foliage area distribution for the sample branch, foliage areadistribution for branch clusters was calculated for 100-mm vertical intervals, knowing theposition of each branch in each cluster.
A split-plot design was used for all the analysis of variance (ANOVA), with understoreytreatment as a main plot and planting materials as the subplots.
Branch Diameter DistributionBranches of each tree were classified into six diameter classes. Class 1 comprised
branches 0–10 mm diameter; Class 2, 11–20 mm; Class 3, 21–30 mm; Class 4, 31–40 mm;Class 5, 41–50 mm; and Class 6, ≥ 51 mm. The Weibull distribution was fitted to the branchdiameter class distribution for each tree, where the frequency of branches (f) for each branchdiameter class (d) given by Rennolls et al. (1985) is:
c d–b c–1 d–b c ƒ (d) = – –––– exp––––– (1)
a a a The three parameters a, b, and c are used to describe the shape of the distribution where
a is a scale parameter related to the range of branch diameter classes, b is a locationparameter describing the minimum value of the distribution or the minimum of the diameterclass, and c determines the skewness of the distribution.
The parameters were estimated for each tree and ANOVA was used to test forsignificant differences between treatments. Further, these parameters were subjected tocovariance analysis with D as a covariate, to study whether tree size influenced the branchdiameter distribution.
Stem Internode LengthAll the internodes in each sample tree were classified into three internode length classes.
Class 1 was internodes 0–300 mm; Class 2, 310–600 mm; and Class 3, >600 mm.Differences in the numbers of internodes for each internode classes between treatmentswere tested using ANOVA.
Branch Basal Area and Foliage Area RelationshipBranch foliage area and branch basal area were related by linear regression, and the
differences between treatments in intercepts and slopes from the relationships were testedusing ANOVA. Branch basal area was regressed against the natural logarithm of branchlength and comparison of the parameters between treatments was undertaken usingANOVA.
Vertical Foliage Area DistributionTo analyse the vertical foliage area distribution for each tree and remove the effects of
differences in tree size, foliage area at a given height was normalised against the maximum
Bandara et al. — Biomass allocation and crown architecture of Pinus radiata 143
vertical foliage area and the height of each interval was normalised for total tree height. Anexponential curve was fitted to the data (Kellomäki et al. 1980; Wang et al. 1990). Thenormalised foliage area distribution is expressed as
F = (p + qh) rh (2)where F is the normalised foliage area at normalised height h, and p, q, and r are theparameters. The location of the maximum value of the function (Fm) or the position ofmaximum foliage area within a normalised crown was calculated from
p lFm = – –– – –––– (3)
q ln r Differences in the parameters p, q, and r and Fm were tested using ANOVA.
In this paper, the conventional p≤0.05 was not used as the criterion for significantdifferences because there were only 4 and 2 degrees of freedom for the subplots and mainplot errors, respectively. We considered p<0.1 a useful indicator of a treatment effect (Steel& Torrie 1980) but have included the actual probability of significant differences so thatreaders can make their own interpretation. All statistical analyses were done using theGenStat statistical package (GenStat 2000).
RESULTS
Details of Sample TreesMean heights of the 12 sample trees ranged from 4 to 6 m but treatment effects were not
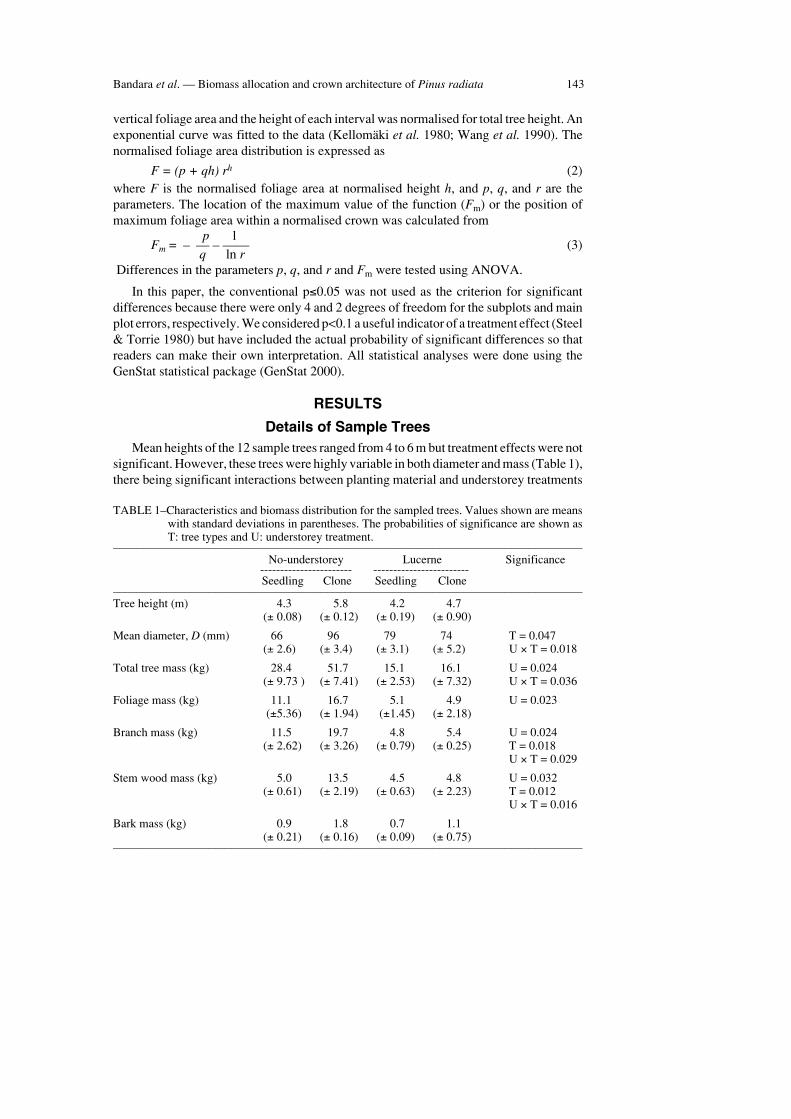
significant. However, these trees were highly variable in both diameter and mass (Table 1),there being significant interactions between planting material and understorey treatments
TABLE 1–Characteristics and biomass distribution for the sampled trees. Values shown are meanswith standard deviations in parentheses. The probabilities of significance are shown asT: tree types and U: understorey treatment.
––––––––––––––––––––––––––––––––––––––––––––––––––––––––––––––––––––––––––––––– No-understorey Lucerne Significance----------------------- ------------------------Seedling Clone Seedling Clone
–––––––––––––––––––––––––––––––––––––––––––––––––––––––––––––––––––––––––––––––Tree height (m) 4.3 5.8 4.2 4.7
(± 0.08) (± 0.12) (± 0.19) (± 0.90)
Mean diameter, D (mm) 66 96 79 74 T = 0.047(± 2.6) (± 3.4) (± 3.1) (± 5.2) U × T = 0.018
Total tree mass (kg) 28.4 51.7 15.1 16.1 U = 0.024(± 9.73 ) (± 7.41) (± 2.53) (± 7.32) U × T = 0.036
Foliage mass (kg) 11.1 16.7 5.1 4.9 U = 0.023(±5.36) (± 1.94) (±1.45) (± 2.18)
Branch mass (kg) 11.5 19.7 4.8 5.4 U = 0.024(± 2.62) (± 3.26) (± 0.79) (± 0.25) T = 0.018
U × T = 0.029
Stem wood mass (kg) 5.0 13.5 4.5 4.8 U = 0.032(± 0.61) (± 2.19) (± 0.63) (± 2.23) T = 0.012
U × T = 0.016
Bark mass (kg) 0.9 1.8 0.7 1.1(± 0.21) (± 0.16) (± 0.09) (± 0.75)
–––––––––––––––––––––––––––––––––––––––––––––––––––––––––––––––––––––––––––––––
144 New Zealand Journal of Forestry Science 34(2)
for D and total tree mass. The diameter of clonal trees in the no-understorey treatment wassignificantly larger than that for the seedling trees, but seedling and clonal trees had similardiameters in the lucerne understorey treatment. Mean total tree dry mass for the seedlingand the clonal trees in the no-understorey was 28 kg and 52 kg, respectively. Both theseedling and the clonal trees weighed about 15 kg in the lucerne understorey treatment.
There was no significant difference (p=0.176) in foliage mass between the seedling andthe clonal trees (Table 1), but trees in the lucerne understorey had 64% less foliage massthan trees in the no-understorey treatment. The seedling trees in the no-understoreytreatment had 12 kg of branches and the clonal trees had 71% more branch mass than theseedling trees. Both the seedling and the clonal trees in the lucerne understorey treatmenthad about 5 kg of branch wood (interaction p=0.029). Similarly, the seedling trees in theno-understorey treatment had 5 kg of stem wood and the clonal trees had 170% more stemwood than the seedling trees. Both the seedling and the clonal trees in lucerne understoreytreatment had about 5 kg of branch wood (interaction p=0.016). There was no significantdifference between treatments in bark mass (p=0.256).
Proportional Allocation of Biomass
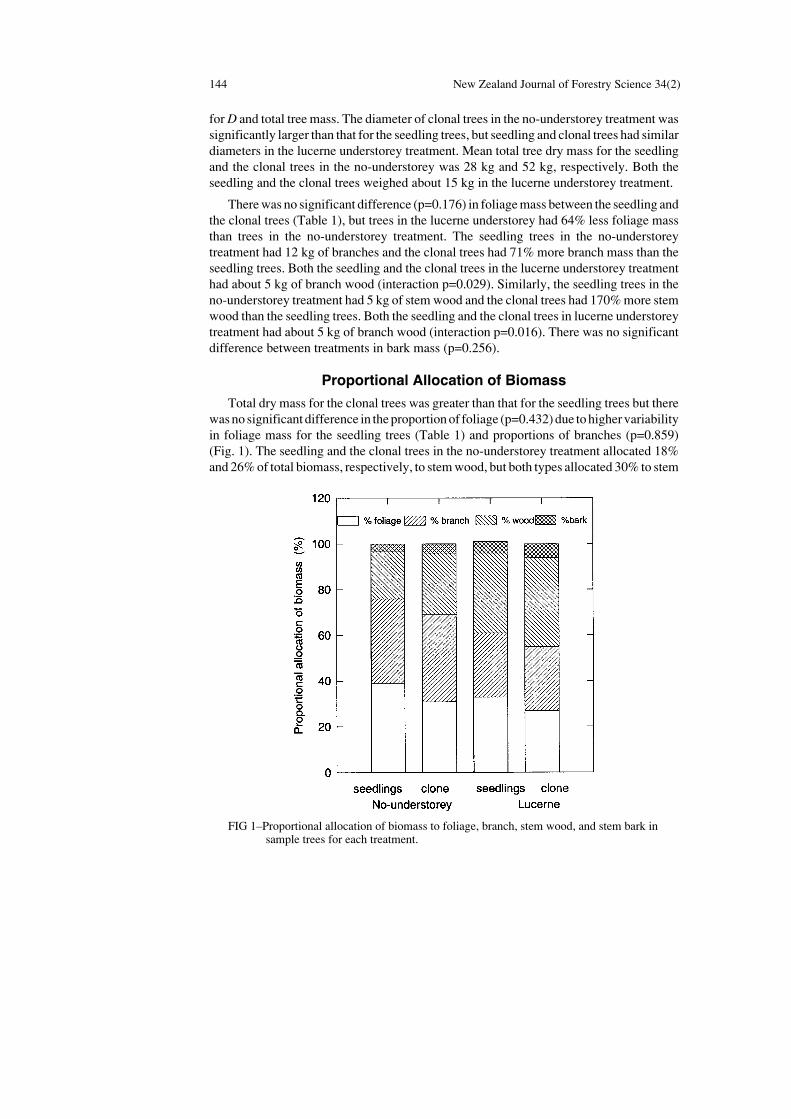
Total dry mass for the clonal trees was greater than that for the seedling trees but therewas no significant difference in the proportion of foliage (p=0.432) due to higher variabilityin foliage mass for the seedling trees (Table 1) and proportions of branches (p=0.859)(Fig. 1). The seedling and the clonal trees in the no-understorey treatment allocated 18%and 26% of total biomass, respectively, to stem wood, but both types allocated 30% to stem
FIG 1–Proportional allocation of biomass to foliage, branch, stem wood, and stem bark insample trees for each treatment.
Bandara et al. — Biomass allocation and crown architecture of Pinus radiata 145
wood in the lucerne understorey treatment (interaction p=0.086) (Fig. 1). Presence of thelucerne understorey also resulted in changes in the proportional allocation to branch wood(p=0.004). Trees in the lucerne understorey treatment had 33% of their total mass allocatedto branch wood, compared to 40% in the no-understorey treatment (Fig. 1). The biomassproportion allocated to foliage was not significantly altered by the understorey treatment(p=0.112).
Crown Characters
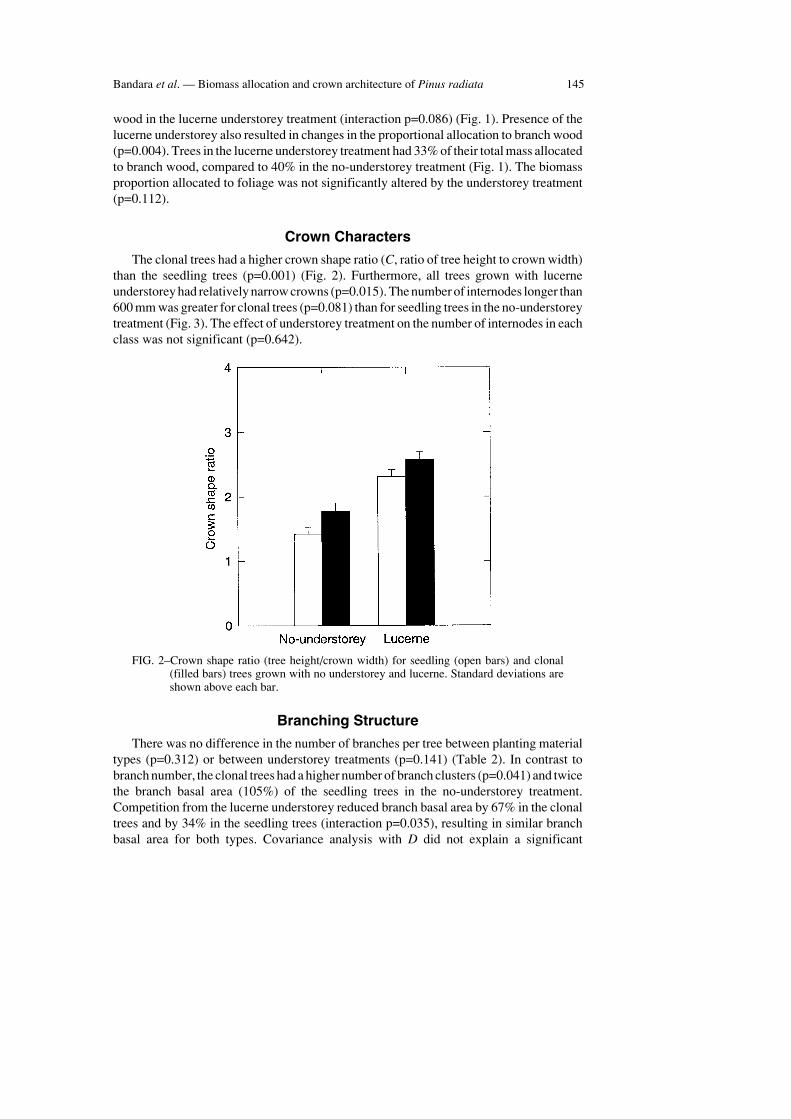
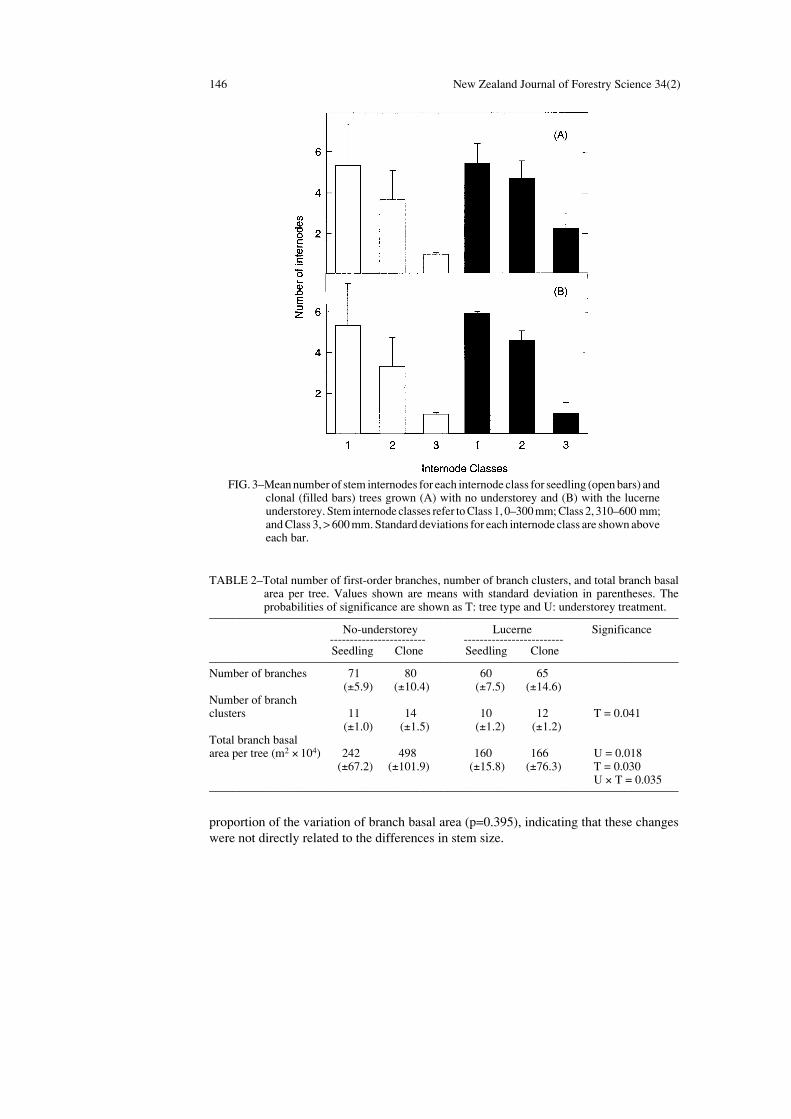
The clonal trees had a higher crown shape ratio (C, ratio of tree height to crown width)than the seedling trees (p=0.001) (Fig. 2). Furthermore, all trees grown with lucerneunderstorey had relatively narrow crowns (p=0.015). The number of internodes longer than600 mm was greater for clonal trees (p=0.081) than for seedling trees in the no-understoreytreatment (Fig. 3). The effect of understorey treatment on the number of internodes in eachclass was not significant (p=0.642).
FIG. 2–Crown shape ratio (tree height/crown width) for seedling (open bars) and clonal(filled bars) trees grown with no understorey and lucerne. Standard deviations areshown above each bar.
Branching Structure
There was no difference in the number of branches per tree between planting materialtypes (p=0.312) or between understorey treatments (p=0.141) (Table 2). In contrast tobranch number, the clonal trees had a higher number of branch clusters (p=0.041) and twicethe branch basal area (105%) of the seedling trees in the no-understorey treatment.Competition from the lucerne understorey reduced branch basal area by 67% in the clonaltrees and by 34% in the seedling trees (interaction p=0.035), resulting in similar branchbasal area for both types. Covariance analysis with D did not explain a significant
146 New Zealand Journal of Forestry Science 34(2)
proportion of the variation of branch basal area (p=0.395), indicating that these changeswere not directly related to the differences in stem size.
FIG. 3–Mean number of stem internodes for each internode class for seedling (open bars) andclonal (filled bars) trees grown (A) with no understorey and (B) with the lucerneunderstorey. Stem internode classes refer to Class 1, 0–300 mm; Class 2, 310–600 mm;and Class 3, > 600 mm. Standard deviations for each internode class are shown aboveeach bar.
TABLE 2–Total number of first-order branches, number of branch clusters, and total branch basalarea per tree. Values shown are means with standard deviation in parentheses. Theprobabilities of significance are shown as T: tree type and U: understorey treatment.
––––––––––––––––––––––––––––––––––––––––––––––––––––––––––––––––––––––––––––––– No-understorey Lucerne Significance
------------------------ -------------------------Seedling Clone Seedling Clone
–––––––––––––––––––––––––––––––––––––––––––––––––––––––––––––––––––––––––––––––Number of branches 71 80 60 65
(±5.9) (±10.4) (±7.5) (±14.6)Number of branchclusters 11 14 10 12 T = 0.041
(±1.0) (±1.5) (±1.2) (±1.2)Total branch basalarea per tree (m2 × 104) 242 498 160 166 U = 0.018
(±67.2) (±101.9) (±15.8) (±76.3) T = 0.030U × T = 0.035
–––––––––––––––––––––––––––––––––––––––––––––––––––––––––––––––––––––––––––––––
Bandara et al. — Biomass allocation and crown architecture of Pinus radiata 147
Branch Diameter Class Distribution
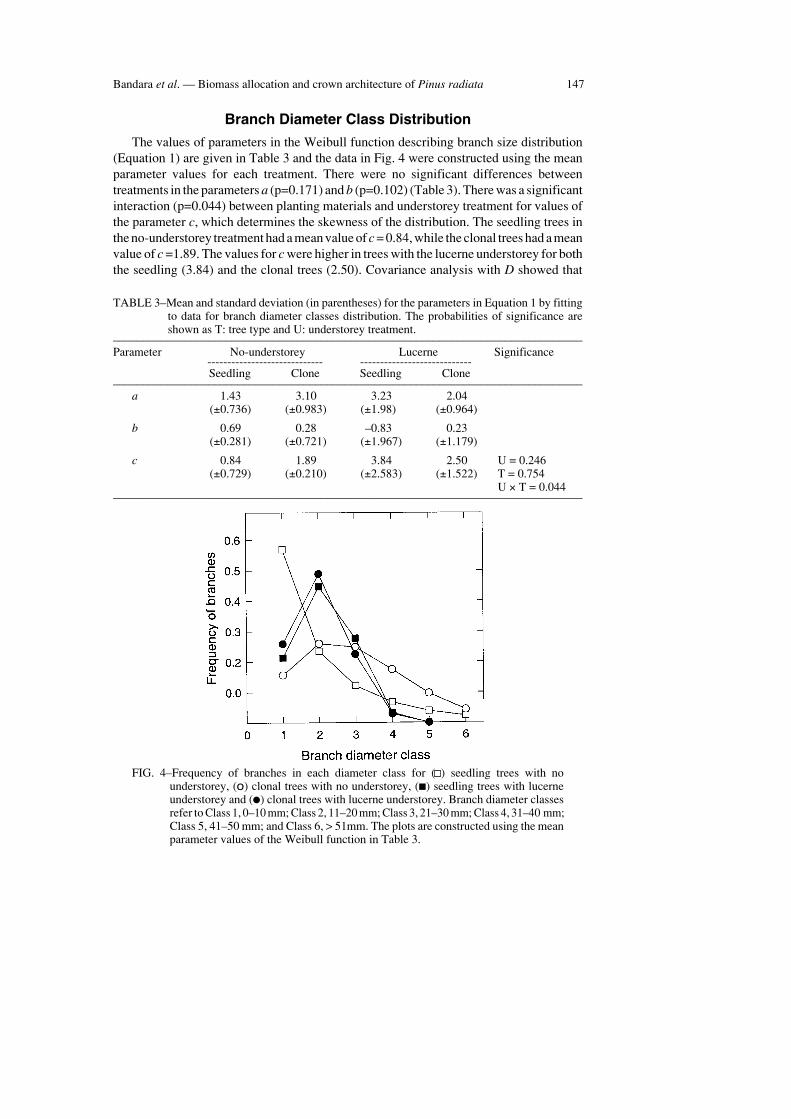
The values of parameters in the Weibull function describing branch size distribution(Equation 1) are given in Table 3 and the data in Fig. 4 were constructed using the meanparameter values for each treatment. There were no significant differences betweentreatments in the parameters a (p=0.171) and b (p=0.102) (Table 3). There was a significantinteraction (p=0.044) between planting materials and understorey treatment for values ofthe parameter c, which determines the skewness of the distribution. The seedling trees inthe no-understorey treatment had a mean value of c = 0.84, while the clonal trees had a meanvalue of c =1.89. The values for c were higher in trees with the lucerne understorey for boththe seedling (3.84) and the clonal trees (2.50). Covariance analysis with D showed that
TABLE 3–Mean and standard deviation (in parentheses) for the parameters in Equation 1 by fittingto data for branch diameter classes distribution. The probabilities of significance areshown as T: tree type and U: understorey treatment.
–––––––––––––––––––––––––––––––––––––––––––––––––––––––––––––––––––––––––––––––Parameter No-understorey Lucerne Significance
----------------------------- ----------------------------Seedling Clone Seedling Clone
–––––––––––––––––––––––––––––––––––––––––––––––––––––––––––––––––––––––––––––––a 1.43 3.10 3.23 2.04
(±0.736) (±0.983) (±1.98) (±0.964)
b 0.69 0.28 –0.83 0.23(±0.281) (±0.721) (±1.967) (±1.179)
c 0.84 1.89 3.84 2.50 U = 0.246(±0.729) (±0.210) (±2.583) (±1.522) T = 0.754
U × T = 0.044–––––––––––––––––––––––––––––––––––––––––––––––––––––––––––––––––––––––––––––––
FIG. 4–Frequency of branches in each diameter class for ( ) seedling trees with nounderstorey, (o) clonal trees with no understorey, (■) seedling trees with lucerneunderstorey and (●) clonal trees with lucerne understorey. Branch diameter classesrefer to Class 1, 0–10 mm; Class 2, 11–20 mm; Class 3, 21–30 mm; Class 4, 31–40 mm;Class 5, 41–50 mm; and Class 6, > 51mm. The plots are constructed using the meanparameter values of the Weibull function in Table 3.
148 New Zealand Journal of Forestry Science 34(2)
diameter did not explain a significant proportion of the variation in parameters a, b, and c(p=0.409, p=0.174, and p=0.144, respectively), indicating that these were poorly related tothe stem size of the trees.
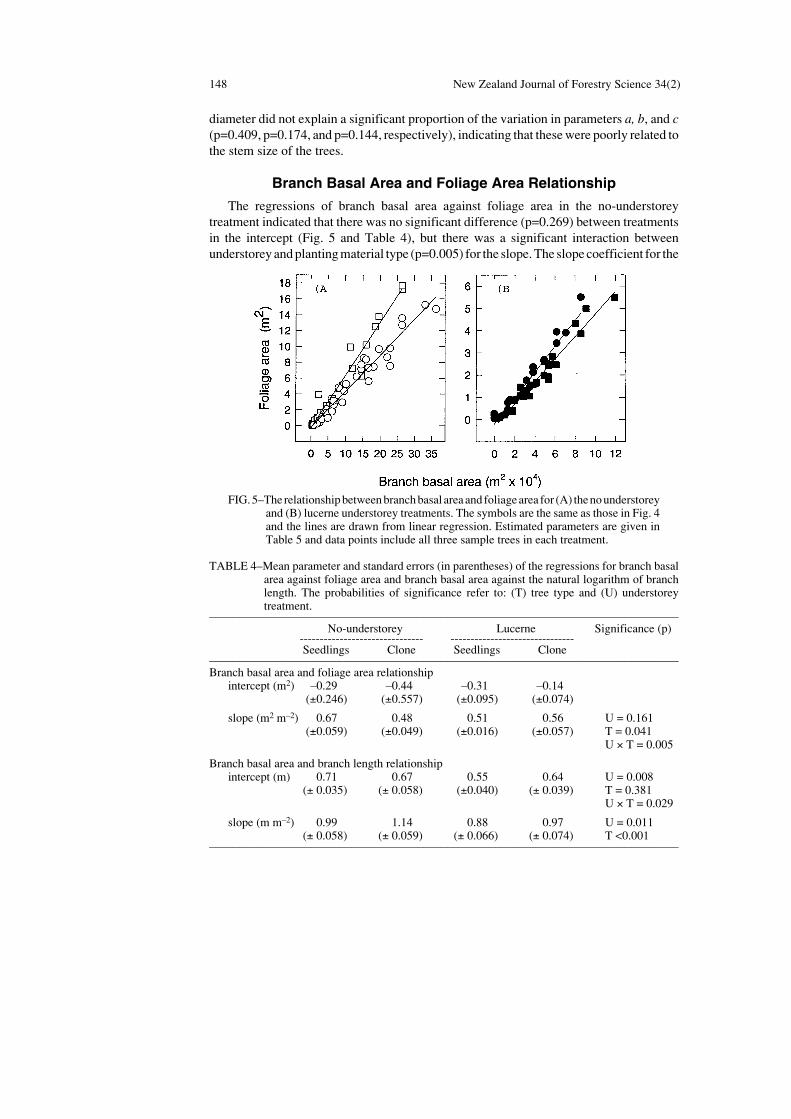
Branch Basal Area and Foliage Area Relationship
The regressions of branch basal area against foliage area in the no-understoreytreatment indicated that there was no significant difference (p=0.269) between treatmentsin the intercept (Fig. 5 and Table 4), but there was a significant interaction betweenunderstorey and planting material type (p=0.005) for the slope. The slope coefficient for the
TABLE 4–Mean parameter and standard errors (in parentheses) of the regressions for branch basalarea against foliage area and branch basal area against the natural logarithm of branchlength. The probabilities of significance refer to: (T) tree type and (U) understoreytreatment.
––––––––––––––––––––––––––––––––––––––––––––––––––––––––––––––––––––––––––––––– No-understorey Lucerne Significance (p)
------------------------------- -------------------------------Seedlings Clone Seedlings Clone
–––––––––––––––––––––––––––––––––––––––––––––––––––––––––––––––––––––––––––––––Branch basal area and foliage area relationship
intercept (m2) –0.29 –0.44 –0.31 –0.14(±0.246) (±0.557) (±0.095) (±0.074)
slope (m2 m–2) 0.67 0.48 0.51 0.56 U = 0.161(±0.059) (±0.049) (±0.016) (±0.057) T = 0.041
U × T = 0.005
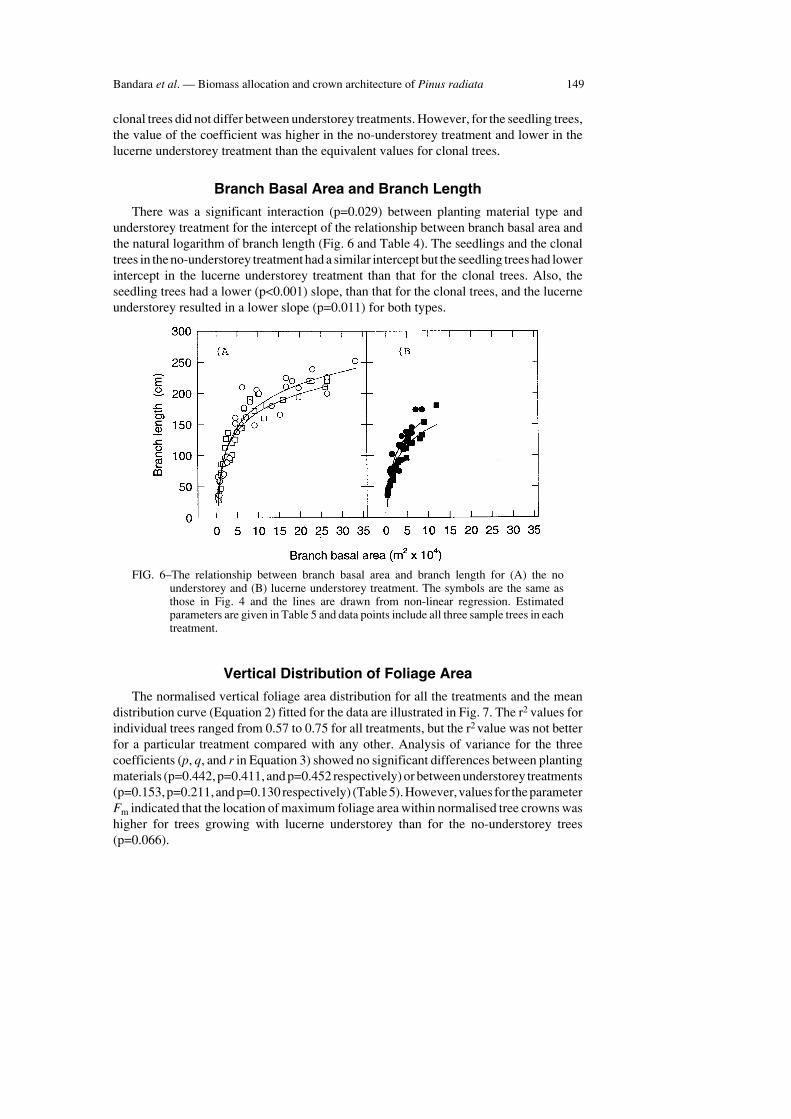
Branch basal area and branch length relationshipintercept (m) 0.71 0.67 0.55 0.64 U = 0.008
(± 0.035) (± 0.058) (±0.040) (± 0.039) T = 0.381U × T = 0.029
slope (m m–2) 0.99 1.14 0.88 0.97 U = 0.011(± 0.058) (± 0.059) (± 0.066) (± 0.074) T <0.001
–––––––––––––––––––––––––––––––––––––––––––––––––––––––––––––––––––––––––––––––
FIG. 5–The relationship between branch basal area and foliage area for (A) the no understoreyand (B) lucerne understorey treatments. The symbols are the same as those in Fig. 4and the lines are drawn from linear regression. Estimated parameters are given inTable 5 and data points include all three sample trees in each treatment.
Bandara et al. — Biomass allocation and crown architecture of Pinus radiata 149
clonal trees did not differ between understorey treatments. However, for the seedling trees,the value of the coefficient was higher in the no-understorey treatment and lower in thelucerne understorey treatment than the equivalent values for clonal trees.
Branch Basal Area and Branch Length
There was a significant interaction (p=0.029) between planting material type andunderstorey treatment for the intercept of the relationship between branch basal area andthe natural logarithm of branch length (Fig. 6 and Table 4). The seedlings and the clonaltrees in the no-understorey treatment had a similar intercept but the seedling trees had lowerintercept in the lucerne understorey treatment than that for the clonal trees. Also, theseedling trees had a lower (p<0.001) slope, than that for the clonal trees, and the lucerneunderstorey resulted in a lower slope (p=0.011) for both types.
FIG. 6–The relationship between branch basal area and branch length for (A) the nounderstorey and (B) lucerne understorey treatment. The symbols are the same asthose in Fig. 4 and the lines are drawn from non-linear regression. Estimatedparameters are given in Table 5 and data points include all three sample trees in eachtreatment.
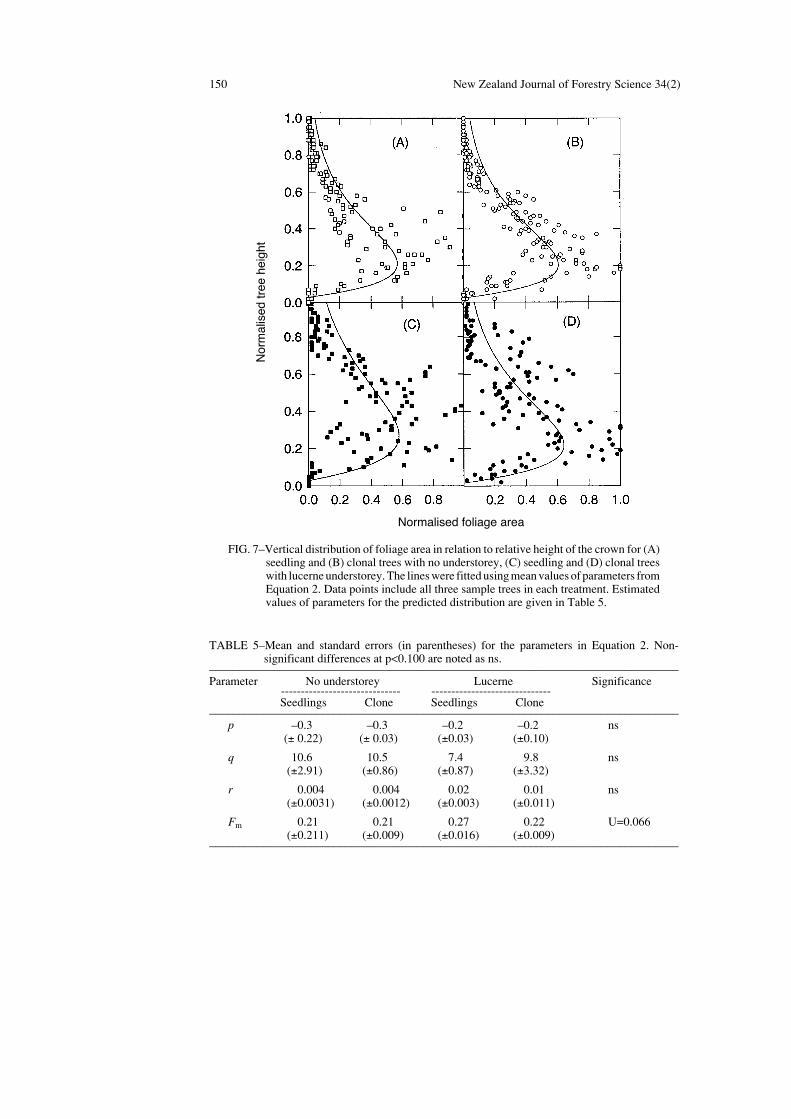
Vertical Distribution of Foliage Area
The normalised vertical foliage area distribution for all the treatments and the meandistribution curve (Equation 2) fitted for the data are illustrated in Fig. 7. The r2 values forindividual trees ranged from 0.57 to 0.75 for all treatments, but the r2 value was not betterfor a particular treatment compared with any other. Analysis of variance for the threecoefficients (p, q, and r in Equation 3) showed no significant differences between plantingmaterials (p=0.442, p=0.411, and p=0.452 respectively) or between understorey treatments(p=0.153, p=0.211, and p=0.130 respectively) (Table 5). However, values for the parameterFm indicated that the location of maximum foliage area within normalised tree crowns washigher for trees growing with lucerne understorey than for the no-understorey trees(p=0.066).
150 New Zealand Journal of Forestry Science 34(2)
FIG. 7–Vertical distribution of foliage area in relation to relative height of the crown for (A)seedling and (B) clonal trees with no understorey, (C) seedling and (D) clonal treeswith lucerne understorey. The lines were fitted using mean values of parameters fromEquation 2. Data points include all three sample trees in each treatment. Estimatedvalues of parameters for the predicted distribution are given in Table 5.
TABLE 5–Mean and standard errors (in parentheses) for the parameters in Equation 2. Non-significant differences at p<0.100 are noted as ns.
–––––––––––––––––––––––––––––––––––––––––––––––––––––––––––––––––––––––––––––––Parameter No understorey Lucerne Significance
------------------------------ ------------------------------Seedlings Clone Seedlings Clone
–––––––––––––––––––––––––––––––––––––––––––––––––––––––––––––––––––––––––––––––p –0.3 –0.3 –0.2 –0.2 ns
(± 0.22) (± 0.03) (±0.03) (±0.10)
q 10.6 10.5 7.4 9.8 ns(±2.91) (±0.86) (±0.87) (±3.32)
r 0.004 0.004 0.02 0.01 ns(±0.0031) (±0.0012) (±0.003) (±0.011)
Fm 0.21 0.21 0.27 0.22 U=0.066(±0.211) (±0.009) (±0.016) (±0.009)
–––––––––––––––––––––––––––––––––––––––––––––––––––––––––––––––––––––––––––––––
Normalised foliage area
Nor
mal
ised
tree
hei
ght
Bandara et al. — Biomass allocation and crown architecture of Pinus radiata 151
DISCUSSIONThe growth rate of trees in the no-understorey treatment was comparable with other
studies in P. radiata from high-quality sites (Beets & Pollock 1987). Even though diameterat breast height and total tree mass for the clonal trees in the no-understorey treatment werelarger than values for the seedling trees, the seedling trees had similar foliage mass andlower branch mass. Beets & Pollock (1987) observed that allocation of dry matterproduction to the various components in P. radiata was largely related to age. Withincreasing age, allocation of biomass to foliage and fine roots decreased, while allocationto branches, stem bark, and stem wood increased. Therefore our differences in biomassallocation between the clonal trees and seedling trees (Fig. 1) may be due to differences inphysiological age or maturation state of the clonal trees. The clonal trees were 10 years oldat the time of sampling, compared to 5 years for the seedling trees
Branch basal area per tree was greater for the clonal trees than that for the seedlings(Table 2) and covariance analysis with tree diameter, D, did not explain a significantamount of the variation in total branch basal area (p=0.395). This indicated that higherbranch basal area in the clonal trees was not related solely to the larger stem size. Therelationship between branch basal area and foliage area (Fig. 5) indicated that the area offoliage for a given branch basal area was less for clonal trees that that for seedling trees.Also, for a given branch basal area, branch length was longer for clonal trees than that forthe seedling trees (Fig. 6). The length of branch at the base with no foliage present was lessthan 50 mm for all the treatments (data not shown). Therefore, for a given branch size, therewas less foliage area per unit branch length on the clonal trees than for the seedling trees.The significant interaction between planting material and understorey treatment for theparameter c in the Weibull function (Table 3) indicated that the distribution patterns ofbranch diameters in the no-understorey treatment were different for the seedling and theclonal trees. The value of c = 0.84 in the seedling trees indicated that there was a negativeexponential pattern of branch diameter distribution, with a large number of small branches.In contrast, the value of c = 1.89 for clonal trees indicated that the distribution was skewedwith more branches in the intermediate size classes. Covariance analysis of c with treediameter, D, showed that the branch diameter distribution differences between treatmentswere not strongly related to size differences between the trees. Also, for the clonal trees, thebranches were distributed on a larger number of branch clusters (Table 2). There were moreinternodes longer than 600 mm on the clonal trees (Fig. 3).
In contrast to the clonal trees, the internode length of the seedling trees was shorter, therewere fewer branch clusters, and a larger number of small branches (Table 2, Fig. 3 and 4).However, there was no significant difference in the vertical distribution of foliage areabetween planting material types. The difference between the seedling and the clonal treesin the distribution of branch basal area within the crown (Fig. 4), foliage distribution withinthe branches (Fig. 5), and the crown shape ratio (Fig. 2) resulted in differences in thehorizontal distribution of foliage area in the tree crown.
The sample trees were selected from an experiment based on a split-plot design withunderstorey treatment as the main plot. Therefore, within the plots the environmentalfactors apart from solar radiation, such as water and nutrients, were expected to be similarfor all trees. The amount of radiation intercepted by an individual tree is determined mainlyby its crown architecture, particularly by the foliage distribution (Whitehead et al. 1990).
152 New Zealand Journal of Forestry Science 34(2)
Knowles & West (1986) observed that competition for solar radiation within the tree couldoccur in P. radiata even at an early stage of growth. Therefore the faster growth rate andhigher value of E (Bandara 1997) of the clonal trees compared with the seedling trees waslikely due to less self-shading of foliage resulting from differences in branching structure.The higher crown shape ratio in the clonal trees (Fig. 2) also resulted in less self-shadingin the clonal trees than the seedling trees, as narrow crowns intercept more radiation thanwider crowns of the same size (Kuuluvainen & Pukkala 1987). Higher values of E in theclonal trees (Bandara 1997) are unlikely to be due to a higher light use efficiency, as studiesat the site (Bandara 1997) and elsewhere (Linder 1985; Grace et al. 1987) have shown thatlight use efficiency remains constant when trees are supplied with adequate water andnutrients.
Lucerne understorey resulted in reduced tree growth compared to the no-understoreytreatment (Mead et al. 1993; Peri et al. 2002) (Table 1). Foliage and branch mass werereduced proportionately more than the reduction in total above-ground mass and this wasmore pronounced in the clonal trees than in the seedling trees (Table 1). When trees weregrown with the lucerne understorey, the competition for water and nutrients (Mead &Mansur 1993; Yunusa et al. 1995b) resulted in substantially less foliage and branch wood.The presence of the understorey resulted in marked soil water deficit in the later part of thegrowing season (reported by Yunusa et al. 1995b). Thus, changes in the crown characteristicsof trees growing in the understorey treatment compared with those in the no-understoreytreatment were most likely the result of water deficit and to a lesser degree nutrient stressat this site (Mead & Mansur 1993; Yunusa et al. 1995b). This conclusion is consistent withother studies at similar dryland sites for young (Watt, Whitehead, Richardson, Mason, &Leckie 2003) and old (Richardson et al. 2002) P. radiata stands.
The sample trees selected from the lucerne understorey treatment had the same numberof branches, number of branch clusters, and stem internode classes as the trees in the no-understorey treatment (Table 2 and Fig. 3). This indicates that the developmental growthphase of the trees was not affected by the water deficit due to the presence of theunderstorey. Bollmann et al. (1986) showed that water stress was unlikely to affect needleinitiation in the developmental phase. However, the presence of the understorey had animpact on the growth phase of the trees, resulting in lower foliage and branch stem and barkmass than trees in the no-understorey treatment (Table 1). There were also changes tobiomass allocation within the crown, with trees in the lucerne understorey treatmentallocating less biomass to branches. Furthermore, the distribution of branch diameters inthe seedling trees became more skewed, resulting in more medium-size branches. Thelucerne understorey also resulted in a low branch basal area for trees from both plantingmaterial types, with the reduction more marked in the clonal trees than in the seedling trees(Table 2). This supports findings by Watt, Whitehead, Mason, Richardson, & Kimberley(2003) in young P. radiata trees that the marked occurrence of drought due to the presenceof understorey vegetation resulted in increased allocation of dry matter to stems at theexpense of foliage and branches.
In comparison to the no-understorey treatment, the lucerne understorey resulted in lessfoliage area per unit branch basal area (Fig. 5) and the changes were more marked in theseedling than the clonal trees. This reduction in foliage area, attributed to seasonal waterdeficits in trees with the lucerne understorey (Yunusa et al. 1995b), was consistent with
Bandara et al. — Biomass allocation and crown architecture of Pinus radiata 153
those reported by Myers (1988). The values of C (Fig. 2) and Fm (Table 5) were higher forthe trees growing with the lucerne understorey, resulting in an increase in foliage efficiency(Bandara 1997), probably due to differences in light interception.
Interactions between planting material type and understorey were observed for foliagearea per unit branch basal area, branch basal area and branch length relationship, totalbranch basal area per tree, the pattern of branch diameter distribution, and total biomassallocated to stem wood proportion. Foliage area per unit branch basal area and branchlength per unit branch basal area were reduced more in the seedling than in the clonal treesin the lucerne understorey treatment. Branch basal area per tree was reduced more in theclonal than in the seedling trees, but branch diameter distribution pattern was changed morein the seedling trees. So, the presence of the lucerne understorey reduced all these charactersbut the degree of change was different between planting materials. This indicates that thegrowth phase of trees, during which time the allocation of biomass to components occurs,is modified by environmental effects. For example, a competitive understorey, irrespectiveof whether seedlings or clonal materials are present, can lead to smaller branches. It hasbeen observed that higher growth rates of P. radiata on fertile farm sites often producelarger branches, thus reducing the quality of wood produced (Knowles 1992; Maclaren1993), and the effects are greater at wide tree spacing where there is little inter-treecompetition. Managers often manipulate tree spacing to control the rate of growth ofindividual trees, crown development, branch size, and hence wood quality (Maclaren1993). Our study shows that branch size distribution can be manipulated by the use of anappropriate understorey, rather than by maintaining a high number of trees per unit area toensure small branch sizes.
Pinus radiata growth is determined principally by the availability of water and nutrients(Myers & Talsma 1992; Mead & Mansur 1993; Yunusa et al. 1995b), by interceptedradiation (Grace et al. 1987; Yunusa et al. 1995b), and by genetic factors (Burdon et al.1997). Allocation of biomass into tree components is affected by genotype (Madgwick1983), by water and nutrient availability (Snowdon & Benson 1992; Beets & Whitehead1996), and by tree age (Beets & Pollock 1987). This study shows that the proportion ofbiomass allocated to wood and branches differs with planting material type and thepresence or absence of understorey vegetation. Therefore, managers may be able to reducethe allocation of biomass to branches thus increasing the proportion of the stem wood. Thischange in allocation could partly offset the loss in stem growth in agroforestry systems dueto understorey competition for water and nutrients. The study also illustrates the importanceof evaluating agroforestry systems in detail, taking into account the effects of understoreyon tree form and growth habits as well as productivity.
In conclusion, this study showed that tree characteristics determined during thedevelopmental phase, such as number of branches and branch clusters, were different forclonal and seedling trees but not for the presence or absence of understorey vegetation.However, characteristics determined during the growth phase were altered by both plantingmaterial type and understorey treatment through differences in the proportional allocationof biomass to foliage, branches, and stem wood. Such changes can affect wood quality,since branch size is a strong determinant of timber quality. Forest managers therefore havetwo ways of regulating tree growth patterns without altering tree spacing — i.e., selectionof improved planting materials (e.g., trees derived from physiologically aged cuttings or

154 New Zealand Journal of Forestry Science 34(2)
tissue-cultured clones) and managing the understorey so that competition for water andnutrients results in higher allocation of biomass to stem wood without a reduction inproductivity.
Analysis of the distribution of biomass within the crown has shown that, with similarproportions of foliage or branches in trees, there can be differences in biomass distributionwithin the crown. This can result in differences in radiation interception resulting in higherfoliage efficiency. The value of foliage efficiency for the seedling trees was 25% lower thanthat for the clonal trees and in the lucerne treatment foliage efficiency was increased in theseedling trees by 43% and the clonal trees by 39% (Bandara 1997). These differences arelikely to have important implications for pruning strategies in P. radiata. The removal ofbranches during pruning may have different effects on growth losses leading to the need fordifferent pruning strategies for trees growing in an agroforestry system compared to thosefor trees growing in forest plantations (Bandara et al. 1999).
ACKNOWLEDGMENTSWe thank Dr K. Pollock, Dr Mike Proe, Damian Byrne, and Sue Thomson for their assistance with
the biomass measurements, and Lincoln University and the New Zealand Foundation for Research,Science and Technology for partial funding of this work. We acknowledge the helpful suggestionsof Dr C. Frampton and Dr R. Sedcole on statistical analysis.
REFERENCESBANDARA, G.D. 1997: Planting material and environment interaction on crown architecture and
tree productivity of Pinus radiata D. Don. Ph.D. Thesis, Lincoln University, New Zealand.
BANDARA, G.D.; WHITEHEAD, D.; MEAD, D.J.; MOOT, D.J. 1999: Effects of pruning andunderstorey vegetation on crown development, biomass increment and above-ground carbonpartitioning in Pinus radiata D. Don trees growing at a dryland agroforestry site. ForestEcology and Management 124: 241–254.
BEETS, P. 1977: Determination of the fascicle surface area for Pinus radiata. New Zealand Journalof Forestry Science 7: 397–407.
BEETS, P.N.; POLLOCK, D.S. 1987: Accumulation and partitioning of dry matter in Pinus radiataas related to stand age and thinning. New Zealand Journal of Forestry Science 17: 246–271.
BEETS, P.N.; WHITEHEAD, D. 1996: Carbon partitioning in Pinus radiata stands in relation tofoliage nitrogen status. Tree Physiology 16: 131–138.
BOLLMANN, M.P.; SWEET, G.B.; ROOK, D.A.; HALLIGAN, E.A. 1986: The influence oftemperature, nutrient status, and short drought on seasonal initiation of primordia and shootelongation in Pinus radiata. Canadian Journal of Forest Research 16: 1019–1029.
BURDON, R.D.; BANNISTER, M.H. 1985: Growth and morphology of seedlings and juvenilecuttings in six populations of Pinus radiata. New Zealand Journal of Forestry Science 15: 123–134.
BURDON, R.D.; HONG, S.O.; SHELBOURNE, C.J.A.; JOHNSON, I.G.; BUTCHER, T.B.;BOOMSMA, D.B.; VERRYN, S.D.; CAMERON, J.N.; APPLETON, R. 1997: Internationalgene pool experiments in Pinus radiata: Patterns of genotype-site interaction. New ZealandJournal of Forestry Science 27(2): 101–125.
CARSON, M.J.; INGLIS, C.S. 1988: Genotype and location effects on internode length of Pinusradiata in New Zealand. New Zealand Journal of Forestry Science 18: 267–279.

Bandara et al. — Biomass allocation and crown architecture of Pinus radiata 155
ELDRIDGE, K.G.; SPENCER, D.J. 1988: Field performances of cuttings in Australia. Pp. 42–55 inMenzies, M.I.; Aimers, J.P.; Whitehouse, L.J. (Ed.) “Workshop on Growing Radiata Pine fromCuttings”, Rotorua, 5–7 May 1986. New Zealand Ministry of Forestry, Forest ResearchInstitute, FRI Bulletin No.135.
FIELDING, J.M. 1970: Trees grown from cuttings compared with trees grown from seedlings (Pinusradiata ). Silvae Genetica 19: 54–63.
GAUTAM, M.K.; MEAD, D. J.; CLINTON, P.W.; CHANG, S.X. 2003: Biomass and morphologyof Pinus radiata coarse root components in a sub-humid temperate silvopastoral system. ForestEcology and Management 177: 387–397.
GENSTAT 2000: Release 4.2, Fifth edition, Lawes Agricultural Trust.
GRACE, J.C. 1987: Theoretical ratio between “ one-sided ” and total surface area for pine needles(Note). New Zealand Journal of Forestry Science 17: 292–294.
–––––1988: Effect of foliage distribution within tree crowns on intercepted radiant energy andphotosynthesis. Pp. 153–159 in Werger, M.J.A.; van der Aart, P.J.M.; During, H.J.; Verhoeven,J.T.A. (Ed.) “Plant Form and Vegetation Structure”, SPB Academic Publishing, The Hague.
GRACE, J.C.; JARVIS, P.G.; NORMAN, J.M. 1987: Modelling the interception of solar radiantenergy in intensively managed stands. New Zealand Journal of Forestry Science 17: 193–209.
HAMMOND, D. 1995: “Forestry Handbook”. New Zealand Institute of Forestry, Rotorua.
HEES, A.F.M.; Van BARTELINK, H.H. 1993: Needle area relationship of Scots pine in TheNetherlands. Forest Ecology and Management 58: 19–31.
HINCKLEY, T.M.; BRAATNE, J.; CEULEMANS, R.; CLUM, P.; DUNLAP, J.; NEWMAN, D.;SMIT, B.; SCARASCIA – MUGNOZZA, G.; VOLKENBURGH, E.V. 1992: Growth dynamicsand canopy structure. Pp. 1–34 in Mitchell, C.P.; Ford-Robertson, J.B.; Hinckley, T. (Ed.)“Ecophysiology of Short Rotation Forest Crops”, Elsevier Science Publication.
JAHNKE, L.S.; LAWRENCE, D.B. 1965: Influence of photosynthetic crown structure on potentialproductivity of vegetation based primarily on mathematical models. Ecology 46: 319–326.
KELLOMÄKI, S.; OKER-BLOM, P.; KUULUVAINEN, T. 1984: The effect of crown and canopystructure on light absorption and distribution in a tree stand. Pp. 107–115 in Tigerstedt, P.M.A.;Puttonen, P.; Koski, V. (Ed.) “Crop Physiology of Forest Trees”, Proceedings of an internationalconference on Managing Forest Trees as Cultivated Plants, Helsinki University Press, Finland.
KELLOMÄKI, S.; HARI, P.; KANNINEN, M.; ILONEN, P. 1980: Ecophysiological studies onyoung Scots pine stands: ii Distribution of needle biomass and its application in approximatinglight conditions inside the canopy. Silva Fennica 14: 243–257.
KNOWLES, R.L. 1992: Why we shouldn’t grow 100 s/ha. New Zealand Tree Grower 13(2): 17.
KNOWLES, R.L.; WEST, G.G. 1986: The use of crown length to predict the effects of pruning andthinning in Pinus radiata. Pp. 104–117 in Fujimori, T.; Whitehead, D. (Ed.) “Crown andCanopy Structure in Relation to Productivity”, Forestry and Forest Product Research Institute,Japan.
KUULUVAINEN, T.; PUKKALA, T. 1987: Effect of crown shape and tree distribution on the spatialdistribution of shade. Agricultural and Forest Meteorology 40: 215–231.
KUULUVAINEN, T.; KANNINEN, M.; SALMI, J. 1988: Tree architecture in young Scots pine:properties, spatial distribution and relationships of components of tree architecture. SilvaFennica 22: 147–161.
LINDER, S. 1985: Potential and actual production in Australian forest stands. Pp. 11–35 inLandsberg, J.J.; Parsons, W. (Ed.) “Research for Forest Management”, CSIRO, Melbourne.
LINDER, S.; BENSON, M.L.; MYERS, B.J.; RAISON, R.J. 1987: Canopy dynamics and growth ofPinus radiata. I. Effects of irrigation and fertilisation during a drought. Canadian Journal ofForest Research 17: 1157–1165.
MACLAREN, J.P. 1993: Radiata pine growers’ manual. New Zealand Forest Research Institute, FRIBulletin No.184.
156 New Zealand Journal of Forestry Science 34(2)
MADGWICK, H.A.I. 1983: Differences in growth and weight of genotypes of pine with specialreference to clones of Pinus radiata. New Zealand Journal of Forestry Science 13: 115–124.
MAGUIRE, D.A.; BENNETT, W.S. 1996: Patterns in vertical distribution of foliage in young coastalDouglas-fir. Canadian Journal of Forest Research 26: 1991–2005.
MEAD, D.J.; MANSUR, I. 1993: Vector analysis of foliage data to study competition for nutrientsand moisture: An agroforestry example. New Zealand Journal of Forestry Science 23: 27–39.
MEAD, D.J.; DRAPER, D.; MADGWICK, H.A.I. 1984: Dry matter production of a young stand ofPinus radiata: Some effects of nitrogen fertiliser and thinning. New Zealand Journal ofForestry Science 14: 97–108.
MEAD, D.J.; LUCAS, R.J.; MASON, E.G. 1993: Studying interactions between pastures and Pinusradiata in Canterbury’s subhumid temperate environment: The first two years. New ZealandForestry 38: 26–31.
MENZIES, M.I.; KLOMP, B.K. 1988: Effects of parent age on growth and form of cuttings, andcomparison with seedlings. Pp. 18–41 in Menzies, M.I.; Aimers, J.P.; Whitehouse, L.J. (Ed.)“Workshop on Growing Radiata Pine from Cuttings”, Rotorua, 5–7 May 1986. New ZealandMinistry of Forestry, Forest Research Institute, FRI Bulletin No.135.
MYERS, B.J. 1988: Water stress integral — a link between short-term stress and long-term growth.Tree Physiology 4: 315–323.
MYERS, B.J.; TALSMA, T. 1992: Site water balance and tree water status in irrigated and fertilisedstands of Pinus radiata. Forest Ecology and Management 52: 17–42.
PERI, P.L.; MASON, E.G.; POLLOCK, K.M.; VARELLA, A.C.; MEAD, D.J. 2002: Early growthand quality of radiata pine in a silvopastoral system in New Zealand. Agroforestry Systems 55:207–219.
PULKKINEN, P. 1991: Crown form and harvest increment in pendulous Norway spruce. SilvaFennica 25: 207–214.
RAISON, R.J.; MYERS, B.J.; BENSON, M.L. 1992: Dynamics of Pinus radiata foliage in relationto water and nitrogen stress: I. Needle production and properties. Forest Ecology andManagement 52: 139–158.
RENNOLLS, K.; GEARY, D.N.; ROLLINSON, T.J.D. 1985: Characterizing diameter distributionby the use of the Weibull distribution. Forestry 58: 57–66.
RICHARDSON, B.; WHITEHEAD, D.; McCRACKEN, I.J. 2002: Root-zone water storage andgrowth of Pinus radiata in the presence of a broom understorey. New Zealand Journal ofForestry Science 32: 208–220.
RICHARDSON, B.; VANNER, A.; RAY, J.; DAVENHILL, N.; COKER, G. 1996: Mechanisms ofPinus radiata growth suppression by some common forest weed species. New Zealand Journalof Forestry Science 26: 421–437.
SHELBOURNE, C.J.A. 1991: Clonal testing Pinus radiata in New Zealand. Pp. 25–40 in Miller, J.T.(Ed.) “Proceedings of FRI/NZFP Forests Ltd ClonalForestry Workshop” 1–2 May 1989,Rotorua, New Zealand. New Zealand Ministry of Forestry, Forest Research Institute, FRIBulletin No. 160.
SNOWDON, P.; BENSON, M.L. 1992: Effect of combinations of irrigation and fertilisation on thegrowth and above-ground biomass production of Pinus radiata. Forest Ecology and Management52: 87–116.
STEEL, R.G.D.; TORRIE, J.H. 1980: “Principles and Procedures of Statistics. A BiometricalApproach”. Second edition. McGraw-Hill, New York. 633 p.
VELLING, P.; TIGERSTEDT, P.M.A. 1984: Harvest index in a progeny test of Scots pine withreference to the model of selection. Silva Fennica 18: 21–32.
WANG, Y.P.; JARVIS, P.G.; BENSON, M.L. 1990: Two-dimensional needle-area density distributionwithin the crowns of Pinus radiata. Forest Ecology and Management 32: 217–237.

Bandara et al. — Biomass allocation and crown architecture of Pinus radiata 157
WATT, M.S.; WHITEHEAD, D.; MASON, E.G.; RICHARDSON, B.; KIMBERLEY, M.O. 2003:The influence of weed competition for light and water on growth and dry matter partitioningof young Pinus radiata, at a dryland site. Forest Ecology and Management 183: 363–376.
WATT, M.S.; WHITEHEAD, D.; RICHARDSON, B.; MASON, E.G.; LECKIE, A.C. 2003:Modelling the influence of weed competition on the growth of young Pinus radiata at a drylandsite. Forest Ecology and Management 178: 271–296.
WEST, G.G. 1988: Cuttings compared with seedlings, for agroforestry. Pp. 139–146 in Menzies,M.I.; Aimers, J.P.; Whitehouse, L.J. (Ed.) “Workshop on Growing Radiata Pine fromCuttings”, Rotorua, 5–7 May 1986. New Zealand Ministry of Forestry, Forest ResearchInstitute, FRI Bulletin No.135.
WHITEHEAD, D. 1986: Dry matter production and transpiration by Pinus radiata stands in relationto canopy architecture. Pp. 243–262 in Fujimori, T.; Whitehead, D. (Ed.) “Crown and CanopyStructure in Relation to Productivity”, Forestry and Forest Product Research Institute, Japan.
WHITEHEAD, D.; GRACE, J.C.; GODFREY, M.J. 1990: Architectural distribution of foliage inindividual Pinus radiata D. Don crowns and the effects of clumping on radiation interception.Tree Physiology 7: 135–155.
YUNUSA, I.A.M.; MEAD, D.J.; LUCAS, R.J.; POLLOCK, H.M. 1995a: Process studies in a Pinusradiata - pasture agroforestry system in a subhumid temperature environment. II. Analysis ofdry matter yield in the third year. Agroforestry Systems 32: 185–204.
YUNUSA, I.A.M.; MEAD, D.J.; POLLOCK, K.M.; LUCAS, R.J. 1995b: Process studies in a Pinusradiata -pasture agroforestry system in a subhumid temperate environment. I. Water use andlight interception in the third year. Agroforestry Systems 32: 163–183.
158 New Zealand Journal of Forestry Science 34(2)
New Zealand Journal of Forestry Science 34(2): 158–174 (2004)
ECONOMIC EVALUATION OF IMPLEMENTINGIMPROVED STEM SCANNING SYSTEMS ONMECHANICAL HARVESTERS/PROCESSORS
HAMISH MARSHALL and GLEN MURPHYForest Engineering Department
Oregon State University, Corvallis, Oregon, USA
(Received for publication 31 March 2004; revision 28 October 2004)
ABSTRACTUse of mechanical harvesting/processing systems in timber harvesting is increasing
worldwide, with advantages in terms of increasing productivity and safety. However,despite these systems giving operators access to advanced computer and measuringsystems, their ability to extract the maximum value from a tree is, on average, lessthan motor manual log bucking systems. The productivity, cost, and value recoveryof several simulated procedures for scanning and bucking Pseudotsuga menziesii(Mirb.) Franco (Douglas fir) and Pinus ponderosa Lawson & C.Lawson (ponderosapine) trees were evaluated from a log seller’s perspective. The procedures evaluatedwere (a) conventional operating where quality changes and bucking decisions weremade by the machine operator, (b) an automatic full scan of the stem prior tooptimisation and bucking, and (c) partial scanning where a portion of the stem wasscanned and then qualities and dimensions were forecast before the optimal buckingtook place. After subtracting costs, the net value improvement for the automatedscanning procedures over the conventional procedure ranged from –7% to 8%. Thebest net value improvement for both species was obtained using the procedure thatfully scans the stem prior to bucking. Breakeven capital investment costs for newscanning, forecasting, and optimisation equipment ranged between zero andUS$2,120,000 depending on tree species, markets, scanning speed, volume scalingrules, and scanning procedure.
Keywords: value recovery; mechanical harvesters/processors; productivity; cost;scanning.
INTRODUCTION
The adoption of mechanical timber harvesting systems is increasing worldwide. Thesesystems allow stems to be delimbed, bucked, sorted, and sometimes felled by a singlemachine. In Scandinavia, almost 90% of logging is carried out using mechanical harvestingsystems (Nordlund 1996). Within the last 10 years, the number of harvesters and processorssold in eastern Canada increased from 200 to 900 (Godin 2000). In Australia, by the late1980s mechanisation had almost eliminated motor-manual felling in Pinus radiata D.Don(radiata pine) thinning operations (Raymond 1988). Factors causing this shift from thetraditional motor manual harvesting systems to mechanical harvesting systems include the