carbon report 2020
TRANSCRIPT

Carbon Report 2020#OneEarth’s annual Net Zero and sustainability benchmark
Connect with Purpose

Decarbonising operations
2

OneWeb | Carbon Report 2020 | November | Copyright © 2021 OneWeb. All rights reserved.3
“The single biggest challenge that humanity faces right now is climate change. I believe that space, if used responsibly, will help us forge a more sustainable world for everyone everywhere. OneWeb’s low Earth orbit connectivity can be the catalyst and driver of systemic change as societies look to decarbonise their economies. The level of capability, passion, and commitment to this cause shared among the people I work with across the organisation, and with our partners, is profound.”OneWeb CEO Neil Masterson
Companies don’t innovate. People do.

4
Contents
Executive SummaryIntroduction 06Carbon baseline - 2019 07Carbon results - 2020 08How did we do? 09
ReportVerification and Methodology 12Vision 12 Objective and Scope 12 Definitions 12
Measuring our Impact 13 Scope 1 emissions 14Scope 2 emissions 15Scope 3 emissions 16Carbon footprint summary 20Green house gas (GHG) impact 21Carbon cost of LEO satellites 22GHG projections 2020 - 2030 23 Targets and Improvements 24
Supporting DocumentsSource materials 26
5
Executive Summary

OneWeb | Carbon Report 2020 | November | Copyright © 2021 OneWeb. All rights reserved.6
Carbon Report 2020 Introduction Aim At OneWeb we are committed to reducing our impact on the natural world and seeking opportunities to utilise our technology for positive change, to build a more sustainable world for future generations.
In 2019, we embarked upon our path towards Net Zero; a future where any green house gases we produce are balanced by absorption. We are committed to achieving this in a responsible manner: we do not want to simply “off-set” our impact but aim to reduce our emissions wherever possible. Our 2020 report builds upon our inaugural baseline 2019 report.
Overview Each year the Telecommunications industry uses 3% of all global energy while the datacentres used to power digital services produce 2% of annual green house gas emissions, putting the sector on-par with the aviation industry.
The next decade will be critical for shaping humanity’s future in the face of environmental risks and societal inequalities. Improving connectivity and closing the digital divide across the world will be a critical part of the “green infrastructure” required for forging a more sustainable world for everyone, everywhere. Three billion people across the planet live without access to connectivity. 2020 highlighted the importance of connectivity for everyone, whether for accessing healthcare, for learning and education, or e-commerce.
Connectivity will play a further role in the transition to Net Zero. It can remove the need to travel, reducing the associated emissions, whilst helping business sectors - from agriculture to aviation and maritime - decarbonise.”
The events of 2020 have had an immediate impact on our emissions. We have seen a decrease in travel-related green house gasses and energy consumption in our offices, whilst emissions linked to working from home and the continued growth of business operations such as satellite manufacture and launches have increased, compared to our 2019 baseline.

OneWeb | Carbon Report 2020 | November | Copyright © 2021 OneWeb. All rights reserved.7
Carbon Report 2020 2019 Carbon Baseline
2019 Emissions:10,195 Tonnes CO2e
1,699 TonnesCO2e/Satellite*Based On 6 Satellites
26 TonnesCO2e/OneWebber*based on avg 389 FTEs
Energy used:10 Gwh
The first measurement of our carbon footprint was in 2019, where we measured our impact across Scope 1, 2 and 3 emissions* in line with the Green House Gas (GHG) Protocol. The following graphics show the total market based GHG emissions for 2019, and our ten highest areas of impact.
*See Page 12 for definitions

160 TonnesCO2e/Satellite*based on 110 satellites
89 TonnesCO2e/OneWebber*based on ave 198 FTEs
Energy used:16.8 Gwh
OneWeb | Carbon Report 2020 | November | Copyright © 2021 OneWeb. All rights reserved.8
Carbon Report 2020 2020 ResultsFollowing our baseline year, we identified areas of improvement to further widen our scope of measurement. This included adding data such as expensed corporate travel, insurance, and embedded carbon within our satellites.
For 2020, we measured our impact across Scope 1, 2 and 3 emissions in line with the Green House Gas (GHG) Protocol. The following table shows the total market based GHG emissions for 2020.
020 GHG Emissions:17,599 Tonnes CO2e

OneWeb | Carbon Report 2020 | November | Copyright © 2021 OneWeb. All rights reserved.9
Carbon Report 2020 How did we do?Findings:
= 89 tonnes CO2e
Global travel:
Corporate: 75% CO2e saving Commuting: 67% CO2e saving
Office waste segregation
• Recycling & Glass• Toner, Batteries, and WEE• Food & Coffee • General Waste
Coffee waste used to make biofuel
Satellite footprint
Nature based solutions
Satellite carbon footprint
130.21 tonnes CO2e / satellite • Embedded carbon in materials• Energy in manufacture• Transportation and launch • Emissions from launch
UK offices:
Electricity: 15% CO2e savingGas: 32% CO2e saving
US office:
Electricity: 12% CO2e saving
Office IT
Equipment bought: 43% CO2e saving

10
Report

OneWeb | Carbon Report 2020 | November | Copyright © 2021 OneWeb. All rights reserved.11
Carbon Report 2020Author: Ben Knight, Facilities Manager & Head of Sustainability, OneWeb
Report Date: 7th April 2021
Verified By: Carbon Footprint LTD
Verifiers: Georgina Whitlock, Senior Environmental Consultant, Grace Parker, Environmental Consultant
Report Reviewed By: Katie Elmer, Senior Sustainability Consultant
Authorised By: John Buckley, Managing Director
Inventory Period: 1st January 2020 to 31st December 2020
Verification Standard: ISO 14064-3: 2019
Calculation Methodology: GHG Protocol
Contributors: OneWeb: Heidi Dillard, Matt Malinsky, Massimiliano Ladovaz, Luke Walsh, Sandra Cameron, Lucio Caporicci, Jenny Barna, John Martincic, Jason Phillips, Shubh Kaur,
Chansely Ker, Asad Naqvi, Ben Wolo, Bency Philip, Reggie Forster, Javier Santolaria, Olly Christmas, Dominic Ngo, Dale Grossman, Will Mansfield.
OneWeb Satellites: Brian Valentine, Patricia McMahon, Amy Goodrich, Jurgen Bohnlein.

OneWeb | Carbon Report 2020 | November | Copyright © 2021 OneWeb. All rights reserved.12
Carbon Report 2020 VerificationVisionAt OneWeb we recognize the importance
of operating in a responsible and sustainable manner to build a better future for the generations ahead who will benefit from our service. To minimize our impact on the natural environment we are committed to reducing our green house gas (GHG) emissions and reaching Net Zero; where total GHG emissions are equal to absorption.
Objective and Scope• Identify and measure GHG emissions from our critical business
operations including both direct and indirect (Scope 1, 2 and 3 GHG emissions)
• Utilise the process to identify areas in which we can strengthen and widen our calculation over coming years
• Externally verify our calculations in line with the Green House Gas Protocol
• Where actual use-data is not available, we will use worse-case scenarios for estimating our impact in line with best practice
• Where market-based data is not available, we will use location-based data
• We will use IEA and DEFRA Emission Factors for our calculations
• We will consolidate emissions via operational control approach
Glossary of Terms• Scope 1: All direct GHG Emissions from the activities of our
organisation or under our control, such as fuel combustion, fleet vehicles and air-conditioning
• Scope 2: Indirect emissions from electricity consumption
• Scope 3: All other indirect emissions from activities of the organisation, occurring from sources that we do not own or control
• Green house gases: Water vapor (H2O), Carbon dioxide (CO2), Methane (CH4), Nitrous oxide (N2O), Ozone (O3), Chlorofluorocarbons (CFCs), Hydrofluorocarbons (includes HCFCs and HFCs)
• Global Warming Potentials: Each GHG has its own Global Warming Potential (GWP) which is its ability to trap extra heat in the atmosphere over time relative to carbon dioxide (CO2). This is defined by the IPCC in the Fifth Assessment Report (AR5).
• CO2e: Carbon Dioxide Equivalent, encompassing all GHGs.
• Tonne: Metric tonne (1000kg)
• Market Based vs Location Based: Where calculating emissions from energy consumption, we will show both market based (using supplier specific data) and location based (data based on the geographical location of the site)

13
Data for our operations in 2020 was collected across the business, including energy consumption, launch vehicle data sheets, travel (both business travel and commuting), embedded carbon in supply chains, waste, and logistics. These measurements are summarized below across Scopes 1, 2, and 3. Full calculations are available in the supporting documents.
Carbon Report 2020 Measuring Our Impact

OneWeb | Carbon Report 2020 | November | Copyright © 2021 OneWeb. All rights reserved.14
Carbon Report 2020 Scope 1 emissions1.1 London GeneratorThe UK Generator is a OneWeb-owned diesel generator, which provides back-up power in the event of a power failure. It is run during regular maintenance visits, producing emissions from the burning of diesel.
2020 emissions: 1 Tonne CO2e
1.2 London Purchased Energy – Gas UseThe London office uses gas to provide heating and hot water, producing emissions from the burning of the gas. This is provided to the building by the landlord and charged to us for our usage by the management company.
2020 emissions: 80.34 tonnes CO2e2020 vs 2019 savings: 32%
1.3 London HVAC – Refrigerant Gas LossThe London office heating, ventilation, and air-conditioning (HVAC) system uses R410A refrigerant gas. Should this leak into the atmosphere, this has a Global Warming Potential of 2088, whereby 1kg of R410A = 2088kg CO2E. The maximum potential loss and actual recorded loss for 2019 was:
Potential 2020 emissions: 473.56 tonnes CO2eActual 2020 emissions: none
1.5 London Gas Fire Suppression SystemThe London server room uses a gas fire suppression system which uses Novec 1230. The gas does not deplete ozone (ODP 0) and has a GWP of 1 over 80 years, equivalent to that of carbon dioxide (1kg Novec = 1kg CO2E). The maximum potential loss and actual recorded loss for 2019 was:
Potential 2020 emissions: 022 tonnes CO2eActual 2020 emissions: none
Scope 1 Total: 81.34 Tonnes CO2e
Diesel generator
Gas fire suppression system
Air-conditioning

OneWeb | Carbon Report 2020 | November | Copyright © 2021 OneWeb. All rights reserved.15
Carbon Report 2020 Scope 2 emissions2.1 London Energy Consumption - Electricity consumedThe UK facility is located within a multi-tenanted building which houses our general office alongside the operational centres and a data centre. The building uses both electricity and gas, for which we receive usage data from the landlord for our premises. Below is both the location and market-based emissions from electricity use.
2020 Emissions Location-based: 78.74 tonnes CO2e Market-based: 107.71 tonnes CO2e 2020 vs 2019 savings: 15%
2.2 Virginia Office (Boro Station) Energy Consumption – Electricity consumedThe Virginia office is a multi-tenanted building, with the OneWeb demise split across multiple floors using electricity as the energy source. We receive energy data for the whole tower and pro-rata the energy used based on our floor space. Below is both the location and market-based calculations.
Location-based: 722.29 Tonnes CO2e Market-based: 722.29 Tonnes CO2e2020 vs 2019 reduction: 12%
2.3 Florida Office Energy ConsumptionOur Florida office was a smaller office within a multi tenanted building which closed in March 2020. The calculation is based on of the 2019 baseline.
Location-based: 20.5 Tonnes CO2e Market-based: 20.5 Tonnes CO2e
2.4 California Office Energy ConsumptionOur California office was a smaller office within a multi tenanted building which closed in March 2020. The calculation is based on of the 2019 baseline.
Location-based: 10.25 Tonnes CO2e Market-based: 10.25 Tonnes CO2e
2.5 SNP and TT&C Sites – Electricity consumedOur satellite network portals (SNPs) and TT&C Sites are a critical aspect to the business linking the satellites to the network. They use electricity to move the antennas and support the data centres. Each site has a maximum load value which we have used to calculate the maximum annual energy usage and therefore the maximum location and market-based emissions.
Location-based: 1,628.55 Tonnes CO2e Market-based: 1,628.55 Tonnes CO2e2020 vs 2019 increase: 187%
Scope 2 Total: 2,489.3 Tonnes CO2e
London Office
Florida Office
Purchased electricity

OneWeb | Carbon Report 2020 | November | Copyright © 2021 OneWeb. All rights reserved.16
Carbon Report 2020 Scope 3 emissions3.1 Florida Factory Energy Consumption – Purchased ElectricityThe OWS (OneWeb Satellites) factory in Florida manufactures’ our satellites. The factory uses electricity as primary energy source and has a backup gas heating system. We receive energy use data from OWS. Below is both the location and market-based calculations for emissions from electricity consumption.
Location-based: 1828.28 Tonnes CO2e Market-based: 1828.28 Tonnes CO2e2020 vs 2019 increase: 43%
3.2 Florida Factory Energy Consumption - Gas UseThe Florida Factory has a back-up gas HVAC system, which came into service in 2020.
Total annual emissions: 149.44 Tonnes CO2e
3.3 Travel: BusinessOur corporate travel is managed by an external partner who provide us with detailed statistics on our GHG emissions resulting from global flights, hotel stays and car hire.
Total annual emissions: 723.93 Tonnes CO2e2020 vs 2019 reduction: 75% 3.4 Travel: Business (expensed)In addition to the managed business travel, some employees book and expense their own travel. For 2020, this calculation was based on the spend-based-method, combining air travel, accommodation, and vehicle use.
Total annual emissions: 2,228.94 Tonnes CO2e
3.5 Travel: Employee CommutingIn 2019 we conducted a survey to calculate the GHG impact of our employees commuting to work. Our calculations were based on an employee commuting for 5 days a week across 48 weeks. For car journeys, we used both emission factors (g/km) and MPG where emissions data is not available. We received data for 188 out of 516 employees, so calculated a pro-rata estimate based on our maximum 2019 employee number.
In 2020, it was not possible to carry out a survey, and so we calculated a pro-rata estimate based on employee numbers commuting to work.
Total Pro Rata Based for 2020: 285.16 Tonnes CO2e2020 vs 2019 reduction: 67%
3.6 Homeworking EmissionsWith the majority of employees working from home in 2020, homeworking emissions is a key addition to our impact. We have used an average power consumption per employee, and calculated emissions based on location.
Total location based annual emissions: 17.83 Tonnes CO2e
Employee Commuting
Homeworking
Business Travel

OneWeb | Carbon Report 2020 | November | Copyright © 2021 OneWeb. All rights reserved.17
Carbon Report 2020 Scope 3 emissions (continued)3.7 LaunchOur launches are conducted by a third party and are a vital aspect of our business. The CO2e emissions are calculated from the fuel burn using the fuel quantities obtained from data sheets. We have used the emission factor for Aviation Turbine Fuel as a basis of the RP-1 fuel used and included Radiative Forcing to account for the unknown impact of emissions in the upper atmosphere. In 2020, we carried out three launches.
Total annual emissions: 818.83 Tonnes CO2e2020 vs 2019 increase: 163%
3.8 Launch LogisticsThe carbon-cost of shipping our satellites from the factory in Florida to the three launch sites is based on both the road transport and the flights used.
We have based the flight calculations on the fuel-burn method, using Aviation Fuel as the basis for calculation with the fuel burn of the AN124 aircraft, and included Radiative Forcing to account for the unknown impact of emissions on the upper atmosphere. The below calculation is for three launches in 2020.
Total annual emissions: 8,156.86 Tonnes CO2e
3.9 Data CentresWe use several data centres across the US and UK provided and managed by third parties. The data centres use electricity to run the servers, and we have calculated our energy use from maximum loading estimates. In 2020, five of the six of the data centres were powered by 100% renewables.
Location-based: 744.65 Tonnes CO2e Market-based: 84.10 Tonnes CO2e2020 vs 2019 reduction: 91%
3.10 UK WasteFor our UK office we receive monthly waste statistics. We are “zero waste to landfill” – with elements such as our food and coffee waste being turned in to biofuel – so we have no direct GHG (specifically, Methane) from landfill. However, the logistics impact has been calculated from the weight and distance to the respective waste processing plants.
Total annual emissions: 30.31 Tonnes CO2e2020 vs 2019 reduction: 47%
3.11 US WasteFor our US office we currently receive no waste statistics. We have therefore calculated the emissions on a pro-rata basis by number of employees in comparison to the UK office.
Total annual emissions: 39.71 Tonnes CO2e
Aviation Fuel
Aviation Fuel
Biofuel

OneWeb | Carbon Report 2020 | November | Copyright © 2021 OneWeb. All rights reserved.18
Carbon Report 2020 Scope 3 emissions (continued)
User Terminal
Telephone & connectivityy use
IT Equipment
3.12 Embedded Carbon: Purchased IT EquipmentWe purchase a large quantity of IT equipment within our business, including iPhones and laptops. The embedded carbon was calculated from purchases and the product data sheets.
Total annual emissions: 53.73 Tonnes CO2e2020 vs 2019 reduction: 44%
3.13 Embedded Carbon: Telephone & Connectivity UseWe use service providers for connectivity and telephones and have calculated the emissions using the Spend-Based-Method.
Total annual emissions: 115.60 Tonnes CO2e
3.14 Embedded Carbon: Hardware PurchasesWe purchase additional hardware and have calculated the embedded emissions using the Spend-Based Method.
Total annual emissions: 39.75 Tonnes CO2e
3.15 London Office Energy Consumption – Purchased Electricity – Transportation & DistributionTransportation and Distribution emissions for electricity use in the London office, based on received use data from the landlord.
Total annual emissions: 6.52 Tonnes CO2e2020 vs 2019 reduction: 15%
3.16 Virginia Office Energy Consumption – Purchased Electricity – Transportation & DistributionTransportation and Distribution emissions for electricity use in the Virginia office, based on received data from the landlord.
Total annual emissions: 43.04 Tonnes CO2e2020 vs 2019 reduction: 14%
3.17 Florida Factory Energy Consumption – Purchased Electricity – Transportation & DistributionTransportation and Distribution emissions for electricity use in the Florida factory, based on received data from the OneWeb Satellites Team.
Total annual emissions: 89.94 Tonnes CO2eThis is a 16% increase from the 2019 baseline.3.18 LogisticsWe use various logistics providers to ship equipment globally and calculated the resulting emissions using the Spend-Based Method.
Total annual emissions: 147.86 Tonnes CO2e
3.19 Product Embedded Carbon: User TerminalOur User-terminals will allow customers to access our connectivity. The embedded carbon in the materials of a UT was calculated by using data provided by the manufacturer.
Total annual emissions: 0.73 Tonnes CO2e
OneWeb | Carbon Report 2020 | November | Copyright © 2021 OneWeb. All rights reserved.19
Carbon Report 2020 Scope 3 emissions (continued)
User Terminal
LEO Satellite network
Satellites
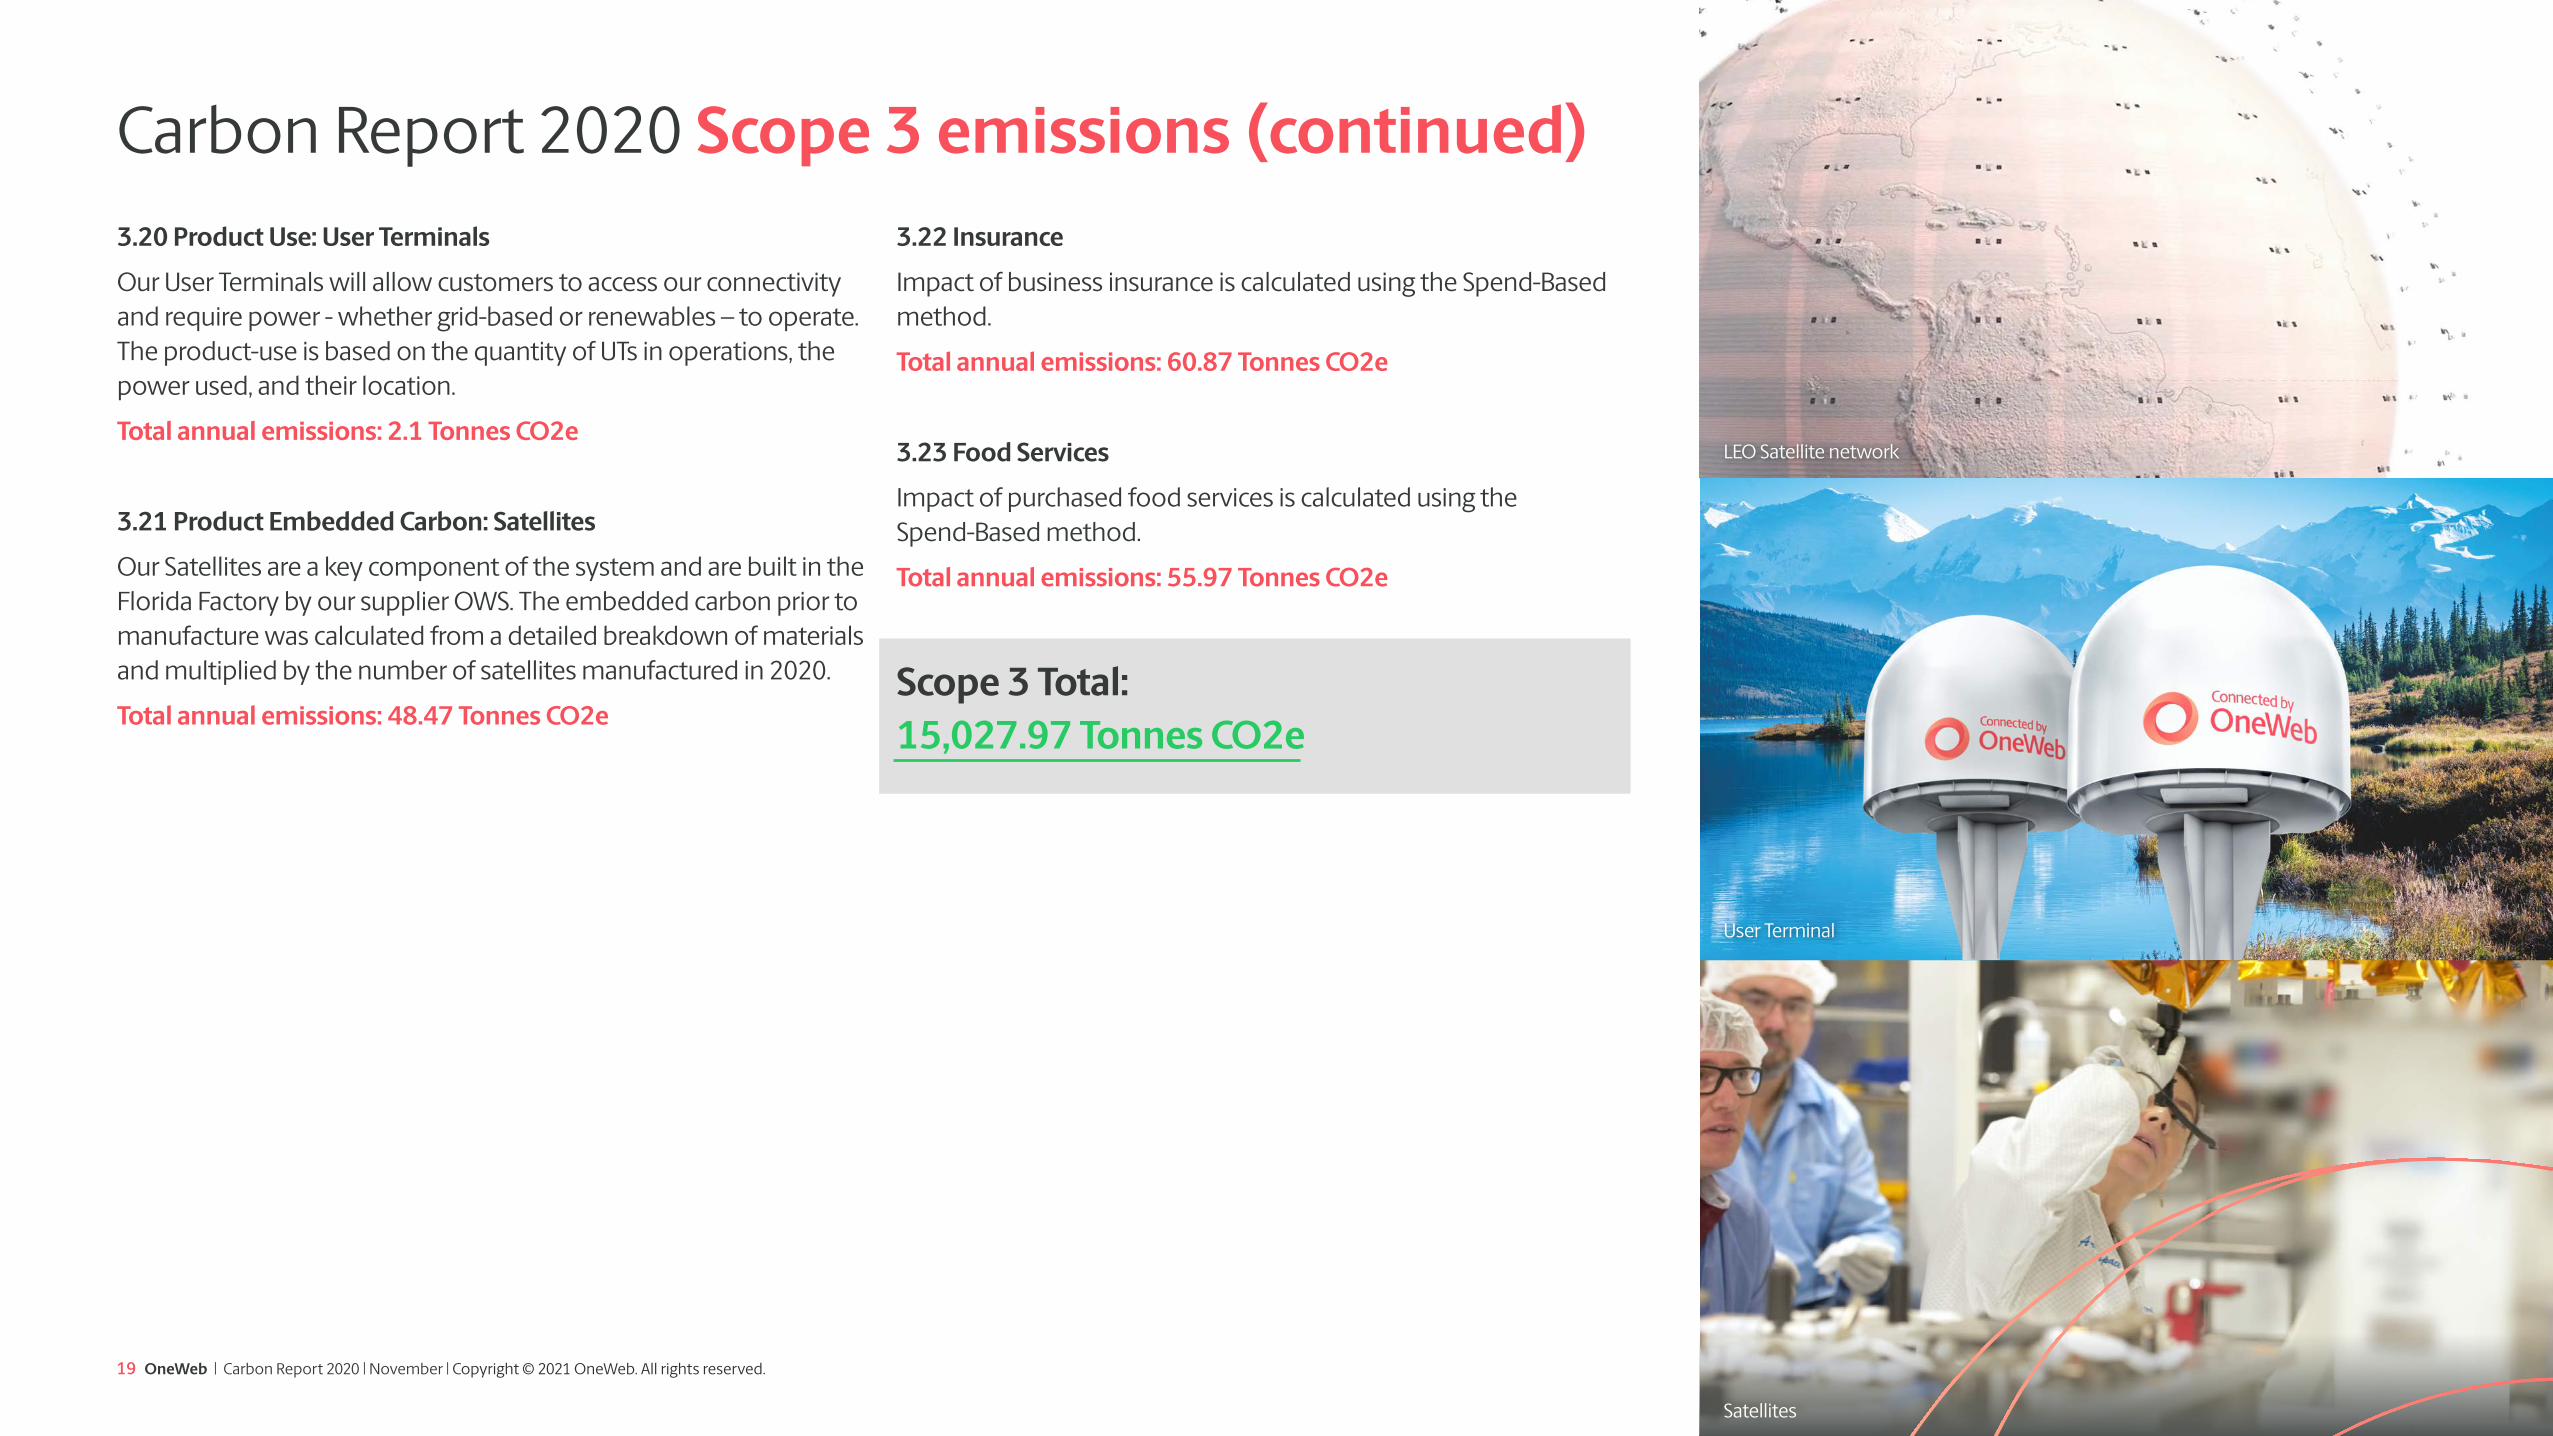
3.20 Product Use: User TerminalsOur User Terminals will allow customers to access our connectivity and require power - whether grid-based or renewables – to operate. The product-use is based on the quantity of UTs in operations, the power used, and their location.
Total annual emissions: 2.1 Tonnes CO2e
3.21 Product Embedded Carbon: SatellitesOur Satellites are a key component of the system and are built in the Florida Factory by our supplier OWS. The embedded carbon prior to manufacture was calculated from a detailed breakdown of materials and multiplied by the number of satellites manufactured in 2020.
Total annual emissions: 48.47 Tonnes CO2e
3.22 InsuranceImpact of business insurance is calculated using the Spend-Based method.
Total annual emissions: 60.87 Tonnes CO2e
3.23 Food ServicesImpact of purchased food services is calculated using the Spend-Based method.
Total annual emissions: 55.97 Tonnes CO2e
Scope 3 Total: 15,027.97 Tonnes CO2e

160 TonnesCO2e/Satellite*based on 110 satellites
89 TonnesCO2e/OneWebber*based on avg 198 FTEs
Energy used:16.8 Gwh
Emissions: 17,599 Tonnes CO2e
OneWeb | Carbon Report 2020 | November | Copyright © 2021 OneWeb. All rights reserved.20
Carbon Report 2020 Carbon Footprint SummaryThe combination of the above emissions equates to a total market-based Green House Gas impact (carbon footprint) in 2020 of:

OneWeb | Carbon Report 2020 | November | Copyright © 2021 OneWeb. All rights reserved.21
Carbon Report 2020 Green house gas (GHG) impact

OneWeb | Carbon Report 2020 | November | Copyright © 2021 OneWeb. All rights reserved.22
Carbon Report 2020 Carbon cost of LEO satellites The measuring of carbon across the company allows for an assessment of the carbon-cost of one of our satellites, based on current attainable data.
No. of satellites launched: 104
CO2e impact per satellite:
Embedded carbon 0.47 tonnesEnergy in manufacture 12.67 tonnesShipment to launch 109.19 tonnes Launch emissions 7.87 tonnes Energy in use 0 tonnes End of life 0 tonnes (leave-no-trace design)

OneWeb | Carbon Report 2020 | November | Copyright © 2021 OneWeb. All rights reserved.23
Carbon Report 2020 GHG projections 2020 - 2030 Allowing for projected future growth within the business – and assuming no reducing actions are taken within our operations – the estimated increase in emissions (in parallel with cumulative emissions) over the next decade is shown below. This includes:
• The addition of further SNPs and therefore increased power consumption
• The addition of customer use of user terminals
• Increased frequency of launches increasing emissions from launch and launch logistics
• Increased employee numbers increasing travel and purchased IT equipment
• The addition of further out of scope elements to our calculations.
• The manufacture of additional satellites
OneWeb | Carbon Report 2020 | November | Copyright © 2021 OneWeb. All rights reserved.24
We aim to increase the accuracy and range of scope of our 2021 calculations by improving data collection across the following business areas:
Scope 2:✓ Improve data collection for Florida factory energy use (electricity and gas)
✓ Improve accuracy of SNP energy use through actual-use data collection
✓ Include SNP distribution and transportation emissions
✓ Consider using state-based emission factors for the US sites
Scope 3:
✓Improve data for employee commuting via surveys
✓Collect power consumption data for datacentres
✓Collect US Waste data
✓Collect logistics data to avoid spend-based data
✓Collect wider supply chain data to avoid spend-based data
Improving the accuracy and range of our 2021 calculations will enable us to better understand our impact and improve our Net Zero strategy.
Carbon Report 2020 Targets and Improvements

25
Source materials

OneWeb | Carbon Report 2020 | November | Copyright © 2021 OneWeb. All rights reserved.26
The following documents show the workings and data sources for all the calculations. Full versions of all documents are available for viewing.
✓ OneWeb Carbon Footprint 2020 - Calculations Incorporating calculations for offices, factory, launch, business travel, data centres, generators, embedded carbon and waste
✓ OneWeb 2020 Carbon Footprint - SNP & TT&C Detailed calculations for energy consumption and emissions at all SNP and TT&C sites
✓ OneWeb 2020 Carbon Footprint - Employee Commuting Calculations of emissions resulting for employee commuting
✓ OneWeb 2020 Carbon Footprint – HVAC and Gas Suppression Calculations of emissions relating to HVAC and Gas Suppression Systems
✓ OneWeb 2020 Carbon Footprint – Launch Logistics Dedicated calculation for launch logistics
✓ OneWeb Carbon Footprint 2020 – Scope 3: UTs and Sats Detailed calculations for the embedded carbon in the UTs and satellites
✓ OneWeb Business Travel Data Data set for business travel
✓ Data Sheets: Soyuz Launch Vehicle, iPhone, Lenovo Laptop, Apple Macbook Data sheet for launch vehicle calculations
Carbon Report 2020 Source materials

Connect with Purpose Connect with Purpose Supporting technology for Net Zero and more sustainable change
[email protected] | oneweb.net
OneWeb | Carbon Report 2020 | November | Copyright © 2021 OneWeb. All rights reserved.