carbon dioxide removal from anaesthetic gas circuits using ... integr… · carbon dioxide removal...
TRANSCRIPT
Ana Filipa Fernandes Vaz Portugal
Carbon Dioxide Removal from Anaesthetic Carbon Dioxide Removal from Anaesthetic Carbon Dioxide Removal from Anaesthetic Carbon Dioxide Removal from Anaesthetic
Gas Circuits Using Absorbent Membrane Gas Circuits Using Absorbent Membrane Gas Circuits Using Absorbent Membrane Gas Circuits Using Absorbent Membrane
ContactorsContactorsContactorsContactors
Dissertation presented for the degree of
Doctor of Philosophy in Chemical and Biological Engineering
by
University of Porto
Supervisors:
Adélio Miguel Magalhães Mendes
Fernão Domingos de Montenegro Baptista Malheiro de Magalhães
LEPAE −−−− Chemical Engineering Department Faculty of Engineering
University of Porto
Porto, February 2009


Acknowledgements
I would like to express my gratitude to the Portuguese Foundation for Science and
Technology (FCT) for the PhD grant, reference SFRH/BD/16621/2004 and for the
financial support through the project POCTI/EQU/45182/2002. I am also grateful to the
European commission for the project Growth GRD1-2001-40257.
My acknowledgments go to my supervisors Prof. Adélio Mendes and Prof. Fernão de
Magalhães for giving me the opportunity and conditions to perform the present work,
for the scientific suggestions and recommendations and for the trust and
encouragement.
I am grateful to everybody from the OOIP group, in the Netherlands for the hospitality,
for the generosity on sharing their knowledge and for their skilled technical support.
Special thanks to Peter and Prof. Geert Versteeg - your teachings were essential for the
proceeding of this work. Thanks very much also to the true friends I made there which
never hesitate to aid me whenever I needed!
My gratitude goes also to my colleagues from the lab for their help and contribution to
the present work, for their support and, of course, for standing me singing or
complaining during my experimental work.
I would like to expand this acknowledgement to the staff of LEPAE (spetially
LEPAE/AMP) and of the Chemical Engineering department at FEUP for their kindness
and assistance.
Thanks very much to the people from E319 for the counsels and encouragement and
above all, for the good humour and friendship extended far beyond labour time... you
provided the best working environment I could ever find!
Thanks to all my friends; those which helped me with fruitful discussions and
recommendations, those with whom I’ve shared my PhD quotidian, and those which,
even when not directly related to this task, made me keep the necessary confidence and

good mood to move further. Special thanks to Tiago and his family who was also my
family during a significant part of this process.
For their unconditional support and for being so very special, I would like to
acknowledge my family. Particularly, I thank my aunts Maria Luisa Portugal Basílio, on
the subject “Carbon dioxide capture and sequestration”, Ana Portugal Crespo de
Carvalho, on the subject “Anaesthesia”, and Ana Paula Vaz Fernandes, on the subject
“How to deal with a PhD”.
Finally, always above all and above everything, thanks to my closest family: my Father,
my Mother and André, for supporting, for believing, for being this amazing example
that I am so proud of... for all possible reasons. Anything or any me would ever be
possible without you!!!

Preface
The present work was carried out at the Laboratory of Processes, Environmental and
Energy Engineering (LEPAE), in the Chemical Engineering Department of the Facu.lty
of Engineering – University of Porto (FEUP), between 2003 and 2009, under the
framework of the projects POCTI/EQU/45182/2002 (funded by the Fundação para a
Ciência e Tecnoologia) and European Growth Project GRD1-2001-40257 – SpecSep
(funded by the European Commission). This thesis contains different papers that were
written and published or submitted for publication in international journals during the
development of the PhD work.


I
Contents
Figure captions ……………………………………………………………. V Table captions …………………………………………………………….. XI Abstract …………………………………………………………………….. XV Sumário ………… ………………………………………………………….. XVII Résumé …………………………………………………………………… ... XX
Part I
1. Introduction ………………………………………………………. 3
1.1. Anaesthesia………………………………………………….. 3
1.2. Hollow Fiber absorbent Membrane Contactors………….. 6 1.3. Selection of Liquid Absorbents for CO2 Removal from
Anaesthetic Gas Circuits …………………………............. 10 1.4. Motivation and Outline of the Thesis……………………… 12 1.5. References………………………....................................... 15
Part II
2. Characterization of potassium glycinate for carb on
dioxide absorption purposes ……………………….............. 25
Abstract……………………………………………………............ 25
2.1. Introduction………………………………………................. 26
2.2. Zwitterion Reaction Mechanism ………………………...... 27
2.3. Mass Transfer................................................................... 30
2.4. Experimental…………………………………….................. 32
2.5. Results and Discussion ………………………………........ 36
2.6. Conclusions………………………………........................... 49
2.7. Nomenclature………………………………………............. 49
2.8. References………………………………………................. 52
2.A. Appendix - Experimental kinetic data…………………...... 56

II
3. Carbon dioxide absorption kinetics in potassium
threonate.......................................... ...................................... 65
Abstract……………………………………………...................... 65
3.1. Introduction……………………………………..................... 66
3.2. Reaction Mechanism........................................................ 67
3.3. Mass Transfer……………………………………................ 69
3.4. Physical Properties........................................................... 70
3.5. Experimental……………………………………………........ 72
3.6. Results and Discussion ……………………………………. 76
3.7. Conclusions……………........……………………............... 86
3.8. Nomenclature……….…………………………………......... 87
3.9. References………………………………………................. 89
3.A. Appendix - Experimental kinetic data............................... 94
Part III
4. Solubility of carbon dioxide in aqueous solution s of
amino acid salts ……………………………………………....... 101
Abstract……………………………………………………............ 101
4.1. Introduction………………………………………………...... 102
4.2. Modelling.......................................................................... 104
4.3. Experimental…………………………………………........... 108
4.4. Results and Discussion…………………………………...... 110
4.5. Conclusions………………………………………………..... 126
4.6. Nomenclature………………………………………………... 127
4.7. References………………………………………………....... 128
Part IV
5. Carbon dioxide removal from anaesthetic gas circ uits
using absorbent membrane contactors with amino acid
salt solutions ……………………………………...................... 137
Abstract…………………………………………………............... 137
5.1. Introduction……………………………………..................... 138

III
5.2. Mass Transfer with Chemical Reaction............................ 140
5.2.1. Chemical reaction........................................................... 140
5.2.2. Analogy to conventional mass transfer models.............. 142
5.2.3. Mathematical model........................................................ 146
5.2.4. Numerical resolution strategy......................................... 151
5.3. Results and Discussion.................................................... 152
5.3.1. Model validation.............................................................. 152
5.3.2. Performance of a membrane contactor for CO2 removal
from anaesthesia breathing circuits.......................................... 156
5.4. Conclusions.......…………………………………………...... 165
5.5. Nomenclature...........................................……………...... 166
5.6. References........…………………………………………...... 168
5.A. Appendix - Spatial discretization method......................... 175
Part V
6. General conclusions and Future Work ……………....... ....... 181
6.1. General Conclusions……………………………................. 181
6.2. Suggestions for Future Work…………………………........ 185
Appendix A. Details on the Experimental Setups Used ................... 187


V
Figure Captions
Figure 1.1 Schematic representation of the 2CO mass transfer in a hollow
fiber............................................................................................... 7
Figure 2.1 Simplified scheme of the experimental set-up............................. 34
Figure 2.2 2CON as a function of
2COP at 298 K for a potassium glycinate
concentration of 0.587 M............................................................. 36
Figure 2.3 Experimental Henry constants of 2N O in water and in
potassium glycinate solutions as a function of temperature.
Comparison with the solubility in water determined by
Versteeg and Van Swaaij (1988).................................................. 38
Figure 2.1 Parity plot of experimental enhancement factor and the
DeCoursey approximation........................................................... 45
Figure 2.5 Overall absorption kinetic constant as a function of potassium
glycinate concentration and for different temperatures:
experimental values and model lines. Solid lines correspond to
the model that takes into account the ionic strength and dashed
lines to the zwitterion model........................................................ 47
Figure 2.6 Apparent absorption kinetic constants as a function of
potassium glycinate concentration and at different
temperatures: experimental values and model lines. Solid lines
correspond to the model that takes into account the ionic
strength and dashed lines to the zwitterion model........................ 47
Figure 2.7 Figure 2.7 - Brønsted plot of Penny and Ritter (1983) at 293,
298 and 303 K – Comparison with the present work................... 48
Figure 3.1 Chemical structure of potassium threonate.................................. 67
Figure 3.2 Experimental set-up sketch.……………………….……………. 75
Figure 3.3 Sechenov plots of the 2N O solubility in potassium threonate
solutions........................................................................................ 78
VI
Figure 3.4 Threonate anion specific parameter as a function of
temperature................................................................................... 79
Figure 3.5 Comparison of 2CO absorption flux in potassium threonate,
potassium glycinate and diethanolamine (DEA) solutions at 1
M and 298 K (all measurements were performed in the setup
presented in Figure 3.2)................................................................ 82
Figure 3.6 Logarithmic plot of the overall absorption kinetic constant as a
function of the potassium threonate concentration -
Experimental values and model curves........................................ 85
Figure 3.7 Semi-log plot of the apparent absorption kinetic constant,
app ov Sk k C= , as a function of the solution ionic strength -
Experimental values and model curves........................................ 85
Figure 4.1 Experimental set-up sketch........................................................... 108
Figure 4.2 Semi-log plot of the solubility of 2CO in aqueous solutions of
MEA 2.5 M, at 313 K - comparison with results from
literature………………………………………………………… 110
Figure 4.3 Semi-log plot of the experimental solubility of 2CO in aqueous
solutions of potassium glycinate, 1.0 -3mol dm⋅ - comparison
with the results from Song et al. (2006) for an aqueous solution
of sodium glycinate 1.06 -3mol dm⋅ , at 313 and 323 K............... 111
Figure 4.4 Semi-log plot of the experimental solubility of 2CO in 3.0 M
aqueous solutions of potassium glycinate - comparison with the
results from Song et al. (2006) for an aqueous solution of
sodium glycinate 3.09 M, at 303, 313 and 323 K......................... 115
Figure 4.5 Solution loading as a function of the 2CO equilibrium partial
pressure in aqueous solutions of potassium glycinate at 313 K -
comparison with MEA at 2.5 M. Solid lines are provided to
make the figure clearer and do not correspond to theoretical
model results................................................................................. 117

VII
Figure 4.6 Semi-log plot of the experimental solubility of 2CO in aqueous
solutions of potassium threonate and potassium glycinate with
concentrations 1.0 M at 313 K..................................................... 118
Figure 4.7 Effect of changing the carbamate hydrolysis and amine
deprotonation equilibrium constants independently on the
predicted 2COP versus loading curves…………………………... 119
Figure 4.8 Effect of changing the carbamate hydrolysis and amine
deprotonation equilibrium constants simultaneously on the
predicted 2COP versus loading curves…………………………... 119
Figure 4.9 Solubility of 2CO in potassium glycinate solutions at 293 K –
experimental values and model curves…………………………. 124
Figure 4.10 Parity plot of the predicted and experimental loadings of 2CO
in solution for all data analysed………………………………… 124
Figure 4.11 Species concentrations as a function of loading for a potassium
glycinate solution, 1.0 M, at 313 K obtained using the
Deskmukh-Mather model. Note that points are not
experimental data but simulation results……………………….. 125
Figure 5.1 Sketch of a closed anaesthetic breathing circuit using hollow
fiber membrane contactors for 2CO removal............................... 139
Figure 5.2 Absorption flux of 2CO in water as a function of Gz –
numerical model (NM) and conventional model (CM) results.
Simulation conditions: 0.196ε = , 7/ 5.818 10L MGz Rτ⋅ = × ,
0.833Am = , -3, 40.34 mol mg TC = ⋅ .............................................. 152
Figure 5.3 E vs Ha plot for reactions (34), (35) and(36) – numerical
(NM) and conventional (CM) models results. Simulation
conditions: 412.63Gz= , / 19.795L GRτ = , 5/ 1.36 10L MRτ = × ,
0.196ε = , 1Am = , * 1BD = , -3, 41.6 mol mg TC = ⋅ , , 5MB feedC =
and 0.8K = .................................................................................. 154

VIII
Figure 5.4 Radial profiles at the fiber outlet for pseudo first order (PFO)
and instantaneous reaction (IR) regimes, for a direct second
order reaction – equation (34). Simulation conditions: Laminar
flow, 412.63Gz= , / 19.795L GRτ = , 5/ 1.36 10L MRτ = × ,
0.196ε = , 1Am = , * 1BD = , -3, 41.6 mol mg TC = ⋅ , , 5MB feedC = . 155
Figure 5.5 Radial profiles at the fiber outlet for pseudo first order (PFO)
and instantaneous reaction (IR) regimes, for a direct second
order reaction – equation (35). Simulation conditions: Laminar
flow, 412.63Gz= , / 19.795L GRτ = , 5/ 1.36 10L MRτ = × ,
0.196ε = , 1Am = , * 1BD = , -3, 41.6 mol mg TC = ⋅ , , 5MB feedC =
and 0.8K = .................................................................................. 155
Figure 5.6 Axial profiles along the contactor for co- and counter-current
operation and for different LQ and 2 ,RNH feedC . Simulation
conditions: 0.196ε = , Rshell= 2 × 10⁻² m ..…………………….. 160
Figure 5.7 Influence of the contact area on the 2CO molar fraction at the
contactor exit for different 2 ,RNH feedC and LQ and for counter-
current operation........................................................................... 161
Figure 5.8 Influence of the amino acid salt feed concentration liquid flow
rate on the 2CO concentration at the contactor exit for different
LQ and for co- and counter-current operations –
20.8796 mA = . Lines are for improving the read........................ 163
Figure 5.9 Influence of the liquid flow rate on the 2CO concentration at
the contactor exit for different 2 ,RNH feedC and for co- and
counter-current operations – 20.8796 mA = . Lines are for
improving the read........................................................................ 164
Figure 5.A1 Schematic representation of the spatial discretization and cell
mass balance................................................................................. 176

IX
Figure A1 Setup used for the physical absorption and kinetics
measurements of 2CO in potassium glycinate (Chapter 2) - the
gas vessel and pressure controller are located behind the panel.. 188
Figure A2 Detail of the setup - stirred reactor (liquid volume: 600 cm3,
reactor diameter: 9.09 cm)............................................................ 189
Figure A3 Setup used for the determination of the physical absorption and
reaction kinetics of 2CO in potassium threonate (Chapter 3)
and for the equilibrium measurements of 2CO in potassium
glycinate (Chapter 4) - liquid volume: 50 cm3, reactor diameter:
3.87 cm......................................................................................... 190
Figure A4 Comparison of the experimental results obtained using the
setup at Porto University and using the setup from Twente
University..................................................................................... 191


XI
Table Captions
Table 1.1 Structural formulas of the amino acids characterized in the
present dissertation...................................................................... 14
Table 2.1 Densities of potassium glycinate solutions - ( )-3kg mρ ⋅ ……… 37
Table 2.2 Experimental Henry constants of 2N O in potassium glycinate
solutions....................................................................................... 37
Table 2.3 Sechenov’s constants for solubility of 2N O in aqueous
potassium glycinate solutions...................................................... 39
Table 2.4 Sechenov’s constants for solubility of 2CO in aqueous
potassium glycinate solutions...................................................... 40
Table 2.5 Henry constants of 2CO in potassium glycinate solutions
computed based on the Sechenov’s model -
( )2
3 -1Pa m molCOH ....................................................................... 40
Table 2.6 Viscosity and diffusivity of 2N O and 2CO in potassium
glycinate solutions........................................................................ 41
Table 2.7 Experimental values of the overall kinetic constant assuming
pseudo-first order behaviour........................................................ 42
Table 2.8 Computed values of SD used to calculate E∞ -
( )10 2 -110 m sSD × ⋅…………………………………………….... 44
Table 2.9 Ha and minimum values of E∞ used for computing ovk
assuming PFO.............................................................................. 44
Table 2.10 Experimental values of the overall kinetic constants of
potassium glycinate calculated using the DeCoursey equation -
( )-1sovk ......................................................................................... 45
Table 2.A1 Kinetic data of the reaction of 2CO with potassium glycinate at
0.0994 M and 298 K..................................................................... 57

XII
Table 2.A2 Kinetic data of the reaction of 2CO with potassium glycinate at
0.299 M and 293 K....................................................................... 57
Table 2.A3 Kinetic data of the reaction of 2CO with potassium glycinate at
0.299 M and 298 K....................................................................... 58
Table 2.A4 Kinetic data of the reaction of 2CO with potassium glycinate at
0.299 M and 303 K....................................................................... 58
Table 2.A5 Kinetic data of the reaction of 2CO with potassium glycinate at
0.587 M and 293 K....................................................................... 59
Table 2.A6 Kinetic data of the reaction of 2CO with potassium glycinate at
0.587 M and 298 K....................................................................... 59
Table 2.A7 Kinetic data of the reaction of 2CO with potassium glycinate at
0.587 M and 303 K....................................................................... 60
Table 2.A8 Kinetic data of the reaction of 2CO with potassium glycinate at
0.999 M and 293 K....................................................................... 60
Table 2.A9 Kinetic data of the reaction of 2CO with potassium glycinate at
0.999 M and 298 K....................................................................... 61
Table 2.A10 Kinetic data of the reaction of 2CO with potassium glycinate at
0.999 M and 303 K....................................................................... 61
Table 2.A11 Kinetic data of the reaction of 2CO with potassium glycinate at
1.984 M and 293 K....................................................................... 62
Table 2.A12 Kinetic data of the reaction of 2CO with potassium glycinate at
1.984 M and 298 K....................................................................... 63
Table 2.A13 Kinetic data of the reaction of 2CO with potassium glycinate at
1.984 M and 303 K....................................................................... 63
Table 2.A14 Kinetic data of the reaction of 2CO with potassium glycinate at
3.005 M and 298 K....................................................................... 64
Table 3.1 Densities and viscosities of potassium threonate solutions…...... 77

XIII
Table 3.2 Henry constants of 2N O and 2CO in water and in potassium
threonate solutions. All values are experimental except for 2CO
in potassium threonate solutions that were computed based on
Sechenov’s model - ( )3 1Pa m molH −⋅ ⋅ ………………………... 77
Table 3.3 Sechenov constants and specific parameters of Schumpe model
for the solubility of 2N O and 2CO in potassium threonate
solutions....................................................................................... 79
Table 3.4 Diffusion coefficient of 2N O , 2CO and potassium threonate in
potassium threonate solutions computed based on the Stokes-
Einstein relation - ( )10 2 110 m sD −× ⋅ ............................................ 80
Table 3.5 Physical mass transfer coefficient of 2CO in potassium
threonate solutions, computed based on equation (20) -
( )6 -110 m sLk × ⋅ ............................................................................ 81
Table 3.6 Experimental overall kinetic constants using the PFO and the
DeCoursey (DC) approaches - ( )1sovk − ....................................... 83
Table 3.A1 Flux of 2CO in 3 M potassium threonate solutions as a function
of the 2CO partial pressure, at 298 K........................................... 94
Table 3.A2 Flux of 2CO in 0.1 M potassium threonate solutions as a
function of the 2CO partial pressure, at 293, 298 and 303 K…... 95
Table 3.A3 Flux of 2CO in 0.3 M potassium threonate solutions as a
function of the 2CO partial pressure, at 293, 298 and 303 K…... 95
Table 3.A4 Flux of 2CO in 0.6 M potassium threonate solutions as a
function of the 2CO partial pressure, at 293, 298 and 303 K…... 96
Table 3.A5 Flux of 2CO in 2 M potassium threonate solutions as a function
of the 2CO partial pressure, at 293, 298 and 303 K……………. 96
Table 3.A6 Flux of 2CO in 1 M potassium threonate solutions as a function
of the 2CO partial pressure, at 293, 298, 303 and 313 K............. 97

XIV
Table 4.1 Solubility of 2CO in aqueous solutions of MEA 2.5 M............... 111
Table 4.2 Experimental solubility of 2CO in aqueous solutions of
potassium glycinate 0.1 M........................................................... 112
Table 4.3 Experimental solubility of 2CO in aqueous solutions of
potassium glycinate 1.0 M........................................................... 113
Table 4.4 Experimental solubility of 2CO in aqueous solutions of
potassium glycinate 3.0 M........................................................... 114
Table 4.5 Experimental solubility of 2CO in aqueous solutions of
potassium threonate 1.0 M and 313 K.......................................... 117
Table 4.6 Equilibrium constants of reactions (1) to (5) and Henry
coefficient of 2CO in potassium glycinate solutions................... 120
Table 4.7 Effective size of the hydrated ions, based on the work by
Kielland (1937). .......................................................................... 121
Table 4.8 Model parameters fitted for the system potassium glycinate-
water- 2CO .................................................................................... 123
Table 5.1 Physical and chemical parameters used to model the absorption
of 2CO in potassium glycinate aqueous solutions in a hollow
fiber membrane contactor - liquid phase concentrations are
expressed in molarity................................................................... 158
Table 5.2 Simulation conditions................................................................... 159

XV
Abstract
The present dissertation concerns the study of hollow fiber absorbent membrane
contactors and their application for carbon dioxide removal from anaesthetic closed
breathing circuits.
Carbon dioxide removal from closed anaesthetic circuits is currently achieved using
canisters containing mixtures of alkali hydroxides. However, the volatile anaesthetics
react exothermally with these absorbents, generating potentially harmful products such
as carbon monoxide and compound A; besides, the exhausted canisters are
contaminated hospital waste, dangerous and expensive to treat. This work proposes to
contribute for the development of a safer and more environmentally friendly technology
for carbon dioxide removal, based on membrane contactors using regenerable absorbent
solutions. These solutions should be able to absorb carbon dioxide fast and reversibly
when it is present in low concentrations (carbon dioxide concentration must be reduced
from 5 to 0.5 % in an anaesthesia loop).
Although hollow fiber absorbent membrane contactors have been widely used and
studied for carbon dioxide absorption purposes, there are two main difficulties that must
be overcome to make them suitable for the suggested application. Firstly, dense
membranes are necessary (instead of the porous membranes generally used in these
devices) to avoid the transmission of pathogenic microorganisms from the breathing
circuit to the absorbent solution. Additionally, new absorbent solutions need to be
developed, since the ones commonly used (aqueous solutions of alkanolamines)
undergo oxidative degradation in highly oxygenated environments, originating toxic
compounds. The present dissertation is predominantly focussed on the latter problem.
Aqueous solutions of amino acid salts overcome some of the drawbacks associated to
the use of alkanolamines. Among the available alkali salts of amino acids, potassium
glycinate was chosen as a model for the subsequent studies, since glycine is the simplest
amino acid and it has a relatively low cost. Additionally, the molecular structure of
potassium glycinate indicates that high absorption kinetics towards carbon dioxide
might be expected. Potassium salt of threonine was also studied for comparison and
because its molecular structure envisioned better regeneration properties.

XVI
In order to estimate the diffusion coefficients of both carbon dioxide and amino acid
salt, densities and viscosities of potassium glycinate and potassium threonate aqueous
solutions were experimentally measured. The physical solubility of carbon dioxide in
aqueous solution was determined based on the nitrous oxide analogy. Therefore, the
solubility of this gas in aqueous solutions was experimentally obtained.
The kinetics of the reactions of carbon dioxide with potassium glycinate and potassium
threonate were determined using a stirred reactor with a flat gas-liquid interface. The
results were interpreted using the DeCoursey approach and an expression for the rate of
absorption as a function of temperature and solution concentration was derived for each
amino acid salt, based on the zwitterion reaction mechanism. It was observed that
potassium glycinate absorbs carbon dioxide faster than potassium threonate and, for
both amino acid salts, the absorption rate is strongly dependent on the solution ionic
strength.
Solubility of carbon dioxide in potassium glycinate aqueous solutions was determined
in a stirred reactor at different temperatures, amino acid salt concentrations and carbon
dioxide partial pressures. Absorption equilibrium data was further interpreted using the
Deshmukh-Mather and the Kent-Eisenberg models. For potassium threonate, the carbon
dioxide solubility was also measured, but for a limited set of conditions. This amino
acid salt showed lower absorption capacity than potassium glycinate.
A bi-dimensional model was developed to evaluate the carbon dioxide removal
performance of a hollow fiber membrane contactor. The model considered potassium
glycinate solutions as absorbents and a composite membrane, made of a porous support
layer and a dense thin layer. Both co- and counter-current operations were analysed.
The influence of some system parameters on the separation achieved was studied.
The use of hollow fiber absorbent membrane contactors with amino acid salt solutions
was found to be suitable for carbon dioxide removal from closed anaesthetic breathing
circuits.

XVII
Sumário
A presente dissertação versa sobre o estudo de contactores absorvedores de membranas
de fibras ocas e sua aplicação na remoção de dióxido de carbono de circuitos
anestésicos fechados.
A remoção de dióxido de carbono de circuitos anestésicos fechados é correntemente
levada a cabo usando recipientes contendo misturas de hidróxidos alcalinos. No entanto,
os compostos voláteis anestésicos reagem exotermicamente com estes absorventes
formando produtos potencialmente perigosos como o monóxido de carbono e o
composto A. Adicionalmente, depois de saturados, os recipientes são lixo sólido
hospitalar contaminado que requer tratamentos caros e perigosos. Pretende-se que este
trabalho contribua para o desenvolvimento de uma tecnologia mais segura e amiga do
ambiente para a remoção de dióxido de carbono, baseada no uso de contactores de
membrana com soluções absorventes recicláveis. Estas soluções devem conseguir
remover o dióxido de carbono rápida e reversivelmente, quando este se encontra pouco
concentrado na corrente gasosa (a concentração de dióxido de carbono deve ser
reduzida de 5 para 0.5 % em cada ciclo anestésico).
Apesar dos contactores de membranas de fibras ocas terem sido vastamente estudados e
utilizados com o propósito de absorver dióxido de carbono, duas limitações essenciais
têm que ser ultrapassadas para que estes se tornem adequados para a aplicação sugerida.
Em primeiro lugar, são necessárias membranas densas (em vez das membranas porosas
habitualmente utilizadas nestas unidades) de modo a evitar a transmissão de micro
organismos patogénicos do circuito respiratório para a solução absorvente.
Adicionalmente, é necessário que novas soluções absorventes sejam desenvolvidas, uma
vez que, as geralmente usadas (soluções aquosas de alcanolaminas) oxidam em
ambientes muito oxigenados, originando compostos tóxicos. A presente dissertação
foca-se predominantemente neste último problema.
As soluções aquosas de sais de aminoácidos superam algumas das limitações associadas
ao uso de alcanolaminas. De entre os sais alcalinos de aminoácidos, o glicinato de
potássio foi escolhido como modelo para um estudo mais aprofundado porque a glicina
é o aminoácido mais simples e tem um custo relativamente baixo. Adicionalmente, a

XVIII
estrutura molecular do glicinato de potássio indica que elevadas cinéticas de absorção
do dióxido de carbono são espectáveis. O treonato de potássio foi também estudado
para comparação e porque a sua estrutura molecular fazia prever maior
regenerabilidade.
Com o propósito de estimar os coeficientes de difusão do dióxido de carbono e do sal de
aminoácido, foram medidas experimentalmente a densidade e viscosidade de soluções
aquosas de glicinato de potássio e treonato de potássio. A solubilidade física do dióxido
de carbono nas soluções aquosas foi determinada através da analogia com o protóxido
de azoto. Para tal, a solubilidade deste gás nas soluções aquosas foi obtida
experimentalmente.
As cinéticas da reacção do dióxido de carbono com o glicinato de potássio e o treonato
de potássio foram determinadas num reactor agitado com uma interface gás-líquido
plana. Interpretaram-se os resultados através da aproximação de DeCoursey e, para cada
sal de aminoácido, foi derivada uma expressão relacionando a velocidade de absorção
com a temperatura e a concentração da solução, baseada no mecanismo de zwitterion.
Observou-se que o glicinato de potássio absorve dióxido de carbono mais depressa do
que o treonato de potássio e que, para ambos os sais, a velocidade de absorção é
fortemente dependente da força iónica da solução.
A solubilidade do dióxido de carbono em soluções aquosas de glicinato de potássio foi
medida num reactor agitado para diferentes temperaturas, concentrações de sal de
aminoácido e pressões parciais de dióxido de carbono. Os resultados do equilíbrio de
absorção foram seguidamente interpretados usando os modelos de Deshmukh-Mather e
de Kent-Eisenberg. A solubilidade do dióxido de carbono em treonato de potássio foi
também medida, mas para um conjunto de condições limitado. Este sal de aminoácido
apresentou menor capacidade de absorção do dióxido de carbono que o glicinato de
potássio.
Foi desenvolvido um modelo bidimensional para avaliar o desempenho na remoção de
dióxido de carbono de um contactor de membranas de fibras ocas. No modelo,
consideraram-se soluções de glicinato de potássio como absorventes e uma membrana
compósita, constituída por uma camada de suporte poroso e uma fina camada densa.

XIX
Operações em co- e contra corrente foram analisadas. Estudou-se a influência de alguns
parâmetros do sistema na separação conseguida.
Concluiu-se que os contactores absorvedores de membranas de fibras ocas são uma
tecnologia viável para remover dióxido de carbono de circuitos anestésicos fechados.

XX
Résumé
Ce travail se penche sur l’étude des contacteurs absorbeurs de membranes de fibres
creuses et son application dans l’extraction du dioxyde de carbone dans les circuits
fermés d’anesthésie.
L’extraction du dioxyde de carbone dans les circuits anesthésiques fermés est mise en
œuvre à l’aide de récipients contenant des mélanges d’hydroxydes alcalins. Cependant,
les composés volatiles anesthésiques ont une réaction exothermique avec ces absorbants
provocant la formation des produits dangereux comme le monoxyde de carbone et le
composant A. De plus, après saturation, les récipients utilisés se transforment en déchet
toxique, qui demande un traitement cher et dangereux. L’objectif de cette étude est de
contribuer au développent d’une technologie plus sécurisée et respectueuse de
l’environnement pour l’extraction du dioxyde de carbone, basé sur l’utilisation des
contacteurs de membrane avec des préparations d’absorbants recyclables. Ces
préparations devront permettre d’extraire le dioxyde de carbone d’une façon rapide et
réversible, lorsque le dioxyde de carbone est présent dans le gaz à faible concentrations
(la concentration de dioxyde de carbone doit être réduite de 5 à 0.5% par cycle
anesthésique).
Bien que les contacteurs de membranes de fibres vides aient déjà largement été étudiés
et utilisés pour l’extraction du dioxyde de carbone, il reste deux principales contraintes à
résoudre pour cette application. Premièrement, il est nécessaire d’utiliser des
membranes denses (au lieu des membranes poreuses généralement utilisées dans ces
outils) afin d’éviter la transmission de micro-organismes pathogènes du circuit de
respiration aux préparations absorbantes. Deuxièmement, il reste à développer de
nouvelles préparations absorbantes, vu que celles actuellement utilisées (solutions
aqueuses d’alkanolamines) subissent une dégradation oxydative en milieu
particulièrement oxygénés, provoquant l’apparition de composés toxiques. Cette étude
se concentre principalement sur cette deuxième contrainte.
Des solutions de sels d’acides aminés permettent de dépasser les limites associées à
l’utilisation des alkanolamines. Parmi les sels alcalins d’acides aminés disponibles, le

XXI
glycinate de potassium a été choisie comme modèle pour cette étude, car la glycine est
l’acide aminé le plus simple et a un prix raisonnable. De plus, la structure du glycinate
de potassium montre que l’on peut s’attendre à des cinétiques d’absorption du dioxyde
de carbone élevées. Nous avons étudié également le sel de potassium de thréonine, pour
comparaison d’une part, et du fait que sa structure moléculaire présentait de meilleurs
propriétés de régénération.
Afin d’estimer les coefficients de diffusion aussi bien du dioxyde de carbone que des
sels d’acides aminés, nous avons mesuré expérimentalement les densités et les
viscosités du glycinate de potassium et du thréonate de potassium. Nous avons
déterminé la solubilité physique du dioxyde de carbone en solution aqueuse par
analogie avec le protoxyde d’azote. Ce faisant, la solubilité de ce gaz en solution
aqueuse a été obtenu expérimentalement.
Nous avons déterminé les cinétiques de réaction du dioxyde de carbone avec le
glycinate de potassium et le thréonate de potassium grâce à un réacteur à agitation avec
une interface gaz-liquide. Les résultats ont été interprétés par une approche DeCoursey
et, pour chacun des acides aminés, nous avons dérivé une équation mettant en relation la
vitesse d’absorption en fonction de la température et de la concentration de la solution,
en nous basant sur un mécanisme de réaction zwiterrienne. Nous avons observé que le
glycinate de potassium absorbe le dioxyde de carbone plus rapidement que le thréonate
de potassium, et que, pour les deux sels d’acides aminés, le taux d’absorption est
particulièrement dépendant de la force ionique de la solution.
La solubilité du dioxyde de carbone dans une solution aqueuse de glycinate de
potassium a été déterminée dan un réacteur à agitation à températures, concentrations
d’acides aminés et pressions partielles de dioxyde de carbone différentes. Les données
d’équilibre d’absorption ont été interprétées par les modèles de Deshmukh-Mather et de
Kent-Eisenberg. Pour le thréonate de potassium, la solubilité du dioxyde de carbone a
également été mesurée, mais avec des combinaisons de conditions limitées. Cet acide
aminé a montré des capacités d’absorption plus faibles que le glycinate de potassium.
Un modèle bidimensionnel a été développé afin d’évaluer les performances d’extraction
du dioxyde de carbone par un contacteur de membrane à fibres creuses. Ce modèle

XXII
prend en compte le glycinate de potassium en tant qu’absorbant et une membrane
composite, obtenue par superposition de couches support poreuses et une fine couche
dense. Nous avons analysé aussi bien les co- et contre-courants, ainsi que l’influence de
certains systèmes de paramètres sur la séparation obtenue.
En conclusion, l’utilisation de contacteurs de membrane à fibres creuses avec des
solutions de sels d’acides aminés s’est révélé être adaptée à l’extraction du dioxyde de
carbone dans les circuits fermés de respiration d’anesthésie.

Part I


3
1. Introduction
The present dissertation aims to study a novel technology for carbon dioxide ( 2CO )
removal from anaesthetic closed breathing circuits. The viability of using hollow fiber
absorbent membrane contactors for this application is analysed and new absorbent
liquids are studied.
1.1. Anaesthesia
General anaesthesia is a technique to bring and keep the patient unconscious by the
administrations of drugs which can be provided intravenously or by inhalation (Brandi,
2008; Pontes, 2006). General anaesthesia provides analgesia (absence of pain), amnesia
(no memory), and muscle relaxation (Brandi, 2008). Apart from the heart, all the patient
body muscles become relaxed and therefore breathing must be externally induced.
During general anaesthesia, the patient is continuously ventilated with a gaseous
mixture typically composed of, approximately, 70 % carrier gas - usually nitrous oxide
( 2N O ) or air, 30 % oxygen (2O ) and 1 to 8 % volatile anaesthetic (Mendes, 2000;
Pontes, 2006). The volatile anaesthetics currently used are halogenated compounds such
as halothane, enflurane, isoflurane, desfluorane and sevofluorane being the latter two
the most widely used nowadays (Pontes, 2006; Whalen et al., 2005).
The anaesthetic gas mixture can be delivered to the patient in open or closed breathing
circuits and most of the anaesthetic machines can work using both circuits and switch
between them. In the open breathing circuit, fresh gas is transferred to the patient and
there is no recycling of the expired gases. This system results in high fresh gas flows -
minimum of 5 -1L min⋅ (Dosch, 2004) – and it is commonly used for initializing the
anaesthesia. Closed breathing circuit (also called low flow anaesthesia) consists in
leading the expired air, containing the unused anaesthetic gases, back to the patient in
the subsequent inhalation (Baum and Woehlck, 2003). Since the halogenated volatile
anaesthetics are expensive substances, their waste must be kept as low as possible. In
addition, 2N O and the halogenated compounds are potentially green house gases and
their release into the atmosphere should be minimized (Dingley et al., 1999; Pontes,

4
2006). These reasons make the closed breathing circuit the desirable anaesthetic
arrangement. However, the gaseous current coming out from the patient contains an
excess of 2CO (around 5 %) resulting from the patient breathing and an excess of 2N
(around 3 %) that was dissolved in the body tissues and is released during anaesthesia
due to the lower 2N concentration in the inhaled gas, that need to be removed and
replaced by fresh anaesthetic gas before carry the mixture back again to the patient
(Mendes, 2000). In routine clinical practice, the excess of 2N is eliminated by
periodically venting the system (Pontes, 2006; Reinelt et al., 2001) and the 2CO
removal is currently achieved using soda lime (a mixture of calcium, potassium and
sodium hydroxides and water) or baralymeTM (a mixture of calcium, potassium and
octahydrated barium hydroxides) (Baum and Woehlck, 2003).
When Franz Kuhn first described a closed breathing circuit, in 1906, he raised concerns
about the potential harmful products resulting from the reaction of the volatile
anaesthetics with the 2CO absorbent (Baum and Woehlck, 2003). Compounds used for
anaesthesia substantially changed since then, however these concerns are still a reality
nowadays (Baum and Woehlck, 2003; Fan et al., 2008; Knolle and Gilly, 2000; Whalen
et al., 2005). Actually, all volatile anaesthetics react with conventional 2CO absorbents
when these become accidentally desiccated (Baum and Woehlck, 2003; Fan et al., 2008;
Knolle and Gilly, 2000; Whalen et al., 2005). Even when 2CO absorbents are properly
hydrated undesirable products are eventually formed during long time surgeries (longer
than four hours), although much less severe consequences are expected under this
conditions (Baum and Woehlck, 2003; Fan et al., 2008).
The volatile anaesthetic sevofluorane reacts with soda lime, especially during low flow
anaesthesia, generating, among others, the so called compound A - fluoromethyl-2,2-
difluoro-1-(trifluoromethyl)vinyl ether) - a potentially nephrotoxic compound (Baum
and Woehlck, 2003; Whalen et al., 2005). Carbon monoxide (CO) can be also
generated, especially when desfluorane is used (Baum and Woehlck, 2003; Fan et al.,
2008; Whalen et al., 2005). Besides the highly toxics compound A and CO, a number
of other degradation products can be formed upon the contact of the volatile anaesthetic
agents and the desiccated 2CO absorbents. These include methanol and formaldehyde

5
and other flammable gases not yet identified (Baum and Woehlck, 2003; Marini et al.,
2007). Considering the extreme heat produced in these reactions, there is a possibility of
ignition of these gases during the anaesthesia (Baum and Woehlck, 2003). To overcome
these drawbacks, a number of less reactive absorbents have been developed and some –
including DragerSorb FreeTM, AmsorbTM, LoFloSorbTM and SuperiaTM - present good
results concerning the generation of harmful reaction products even under desiccation
conditions (Baum and Woehlck, 2003; Marini et al., 2007; Murray et al., 1999; Struys et
al., 2004). However, these less reactive absorbents enable lower utilization times than
common soda lime, under comparable clinical conditions (Baum and Woehlck, 2003).
Besides the potentially harmful health effects, the environmental impact and the costs of
using the present technology for 2CO removal from anaesthetic gas circuits must be
taken into account. The exhausted 2CO absorbents are hospital solid waste, dangerous
and expensive to treat (Mendes, 2000). Usually, one canister of 1.5 L of absorbent is
enough to absorb 2CO over one week. However, the exhaustion of the absorbent may
occur before this period (Baum and Woehlck, 2003). For this reason, it would be
desirable to replace common 2CO absorbents by a safer but also cleaner technology.
Chemical absorption in liquid solutions is a proven and established technology to
perform 2CO separation from a variety of gas mixtures present in chemical process
industry (Idem and Tontiwachwuthikul, 2006; Ma'mun et al., 2007). A wide number of
studies related to the use of hollow fiber membrane contactors for 2CO separation have
been performed in the past few years (Al-Marzouqi et al., 2008; Kumar et al., 2002a; Li
and Chen, 2005; Rangwala, 1996; Yan et al., 2007). The process showed promising
results and is being implemented by several companies (Kumar, 2002).
In the present work the use of a hollow fiber absorbent membrane contactor for
continuous 2CO removal from anaesthetic gas circuits is proposed and its feasibility
studied. The membrane material used is considered dense (non-porous) and highly
permeable to 2CO , isolating the absorbent solution from the anaesthetic closed circuit.
After going through the 2CO absorption contactor, the absorbent solution is regenerated
in another contactor and sent back to the absorption contactor.

6
1.2. Hollow Fiber Absorbent Membrane Contactors
A membrane contactor is a device to bring in contact two different phases, for mass
transfer purposes, without dispersion of one phase into the other (Gabelman and
Hwang, 1999).
Porous membrane modules for gas absorption have been explored and successfully used
since 1975, when the technology was first proposed for blood oxygenators (Kumar,
2002) - nowadays, 99 % of the blood oxygenators sold in U. S. contain porous
membranes (Wickramasinghe et al., 2005). Many other application can be find such as
aeration of water in river and wastewater treatment plants, biological waste gas
treatment, removal of volatile organic compounds from water, aeration of shear-
sensitive cell cultures, aeration of reactors at high oxygen demand, removal of dissolved
oxygen in ultrapure water production, gas exchange in artificial gills, 2CO removal
from industrial gaseous streams, etc. (Vladisavljevic, 1999).
Usually, in a gas-liquid hollow fiber membrane contactor, the liquid flows inside the
fibers lumen and the gas flows in the shell (Li and Chen, 2005). The driving force for
the mass transfer is the concentration gradient between gas and liquid phases (Kumar,
2002; Li and Chen, 2005) and the process of mass transfer includes the following steps:
diffusion from the bulk of the gas to the outer membrane surface, diffusion trough the
membrane, dissolution in the liquid and diffusion accompanied (or not) by chemical
reaction in the liquid (Li and Chen, 2005).The selectivity is commonly provided by the
liquid and the membrane works as an interface between two media, although is possible
to use selective membranes (Li and Chen, 2005). A schematic representation of a
hollow fiber in a gas liquid membrane contactor for 2CO removal is shown in Figure
1.1.

7
Figure 1.1 – Schematic representation of the 2CO mass transfer in a hollow fiber.
Membrane contactors, and particularly hollow fiber membrane contactors, offer a
number of advantages when compared to traditional gas/liquid contactor devices such as
packed tower, spray tower, bubble column or venturi scrubber (among others)
(Gabelman and Hwang, 1999; Kumar, 2002; Li and Chen, 2005; Rangwala, 1996):
- Much larger contact area per unit volume - hollow fiber membrane contactors can
provide interfacial areas per unit volume around thirty times higher than other types of
contactors. Besides, since the two fluids flow independently, this surface area does not
depend on operational conditions such as the fluids flow rates.
- Because of the absence of interpenetration of the gaseous and liquid phases, these
apparatus do not present operational limitations like flooding, channeling, entrainment,
loading, weeping and foaming.
- Membrane modules can be linearly scaled up and, due to its modularity, different
separation capacities can be achieved by simply changing the number of modules used
and the contactor orientation is also not a matter of concern.
- Since membrane modules are compact, they are less energy consuming, and need
lower volumes to achieve identical separations being very interesting in an economical
point of view. They are also light on weight which makes them easy to be transported
and used for offshore applications.
- Aseptic operation is much easier to achieve than with other types of contactors, which
enables the process to be suitable for medical applications.
Hollow fiber membrane contactors have also some disadvantages (Gabelman and
Hwang, 1999; Kumar, 2002; Li and Chen, 2005; Rangwala, 1996):

8
- Due to the small diameter of fibers, the liquid flow inside the fibers is usually laminar.
As a consequence, the mass transfer coefficient is lower than in other types of
contactors. The membrane itself also provides an additional resistance to the mass
transfer.
- If the membranes to be used are porous, it must be assured that the pores are gas filled
during the mass transfer process. If the membrane is wetted, the mass transfer is greatly
penalized due to the presence of a stagnant liquid film in the membrane pores.
- Membranes are subject to fouling and they have a finite life time, which makes
necessary to change the modules from time to time.
- There is pressure drop along the module.
The use of hollow fiber membrane contactors for 2CO removal was first proposed by
Zhang and Cussler (1985a, 1985b) (Li and Chen, 2005) and since then a lot of research
on this particular application have been performed. This tremendous investment is due
to the role of separating the 2CO from flue gas for further sequestration (Idem and
Tontiwachwuthikul, 2006; Metz et al., 2005). The climate change due to the greenhouse
gases concentrations in the atmosphere is probably the most concerning environmental
problem at the present. 2CO is the greenhouse gas released in larger extend by
anthropogenic action (Idem and Tontiwachwuthikul, 2006; UNFCCC, 2008) and its
concentration in the atmosphere has risen by more than 30 % in the last 250 years
(Hampe and Rudkevich, 2003). Most of the 2CO emissions result from burning fossil
fuels (mainly coal and natural gas) to produce energy (Hampe and Rudkevich, 2003;
Metz et al., 2005) and the demand for energy is kept increasing in such a rate that
replacing the use of fossil fuels by renewable and clean energy sources would take more
time than we probably have to face this problem (CAETS, 1995). For this reason, there
is a huge interest on the development of technologies to capture and storage 2CO and
absorption on reactive solutions is pointed out as one of the most promising ones
(Favre, 2007). Relating to 2CO and oxygen, the composition of the exhausted flue gas
is very similar to that of the anaesthetic gas mixtures exhausted by the patient - namely,
the molar fraction of 2CO in the flue gas varies from 3 to 15 % and, in the exhausted
anaesthetic mixture, it is around 5 %. For this reason, it should be kept in mind most of
the research and analysis on the 2CO removal from flue gas using absorbent hollow

9
fiber membrane contactors can be applied to the 2CO removal from anaesthetic gas
circuits. The opposite is also true: the progresses achieved on the 2CO removal from
anaesthetic gas circuits using hollow fiber membrane contactors will eventually find
application on the flue gas treatment.
Generally, to model and to analyse the performance of the mass transfer between a gas
and an absorbent liquid in a hollow fiber membrane contactor, the following
information is required:
- The mass transfer coefficients of each component in the gas phase, which depend on
the flow hydrodynamics - unlike the fiber lumen, the hydrodynamics in the shell side is
usually difficult to describe. Several models have been proposed to describe gas flow in
the shell side (Keshavarz et al., 2008), but usually gas phase mass transfer coefficients
are experimentally obtained for the specific membrane module.
- The mass transfer coefficients trough the membrane, which depends on the membrane
characteristics (material, porosity, etc) and is membrane specific - usually, the
membranes used have high permeabilities and the resistance to mass transfer introduced
by the membrane is negligible.
- The physical solubility of the components in the liquid.
- The diffusion coefficients of the gas components and the reactive species in the
absorbent liquid – as mentioned before, the liquid flow inside the fiber lumen is usually
laminar and bi-dimensional models for diffusion or diffusion/reaction are necessary to
describe the mass transfer inside the liquid. Nevertheless, in some cases, especially for
physical absorption, it is possible to estimate a mass transfer coefficient in the liquid;
however the correlations used in these situations also require the previous knowledge of
the diffusion coefficients and liquid physical properties such as density and viscosity.
- Information about the reaction kinetics and equilibrium between the absorbent reactive
species and the reactive gases.

10
1.3. Selection of Liquid Absorbents for CO 2 Removal from
Anaesthetic Gas Circuits
An absorbent solution to be used in a membrane contactor for 2CO removal from
anaesthetic circuits must verify the following requirements: biocompatibility, low
vapour pressure (in order not to enter into the anaesthetic circuit), chemical and thermal
stability and compatibility with the membrane contactor, i.e. do not originate the
membrane swelling and, for porous membranes, do not wet the membrane pores.
Besides, it should present fast absorption and desorption kinetics and high absorption
capacity and it should be easily regenerable.
The absorbent solutions most widely used nowadays to separate 2CO from gaseous
mixtures in chemical industry are aqueous solutions of akanolamines and blends of
alkanolamines (Idem and Tontiwachwuthikul, 2006). Alkanolamines have been
extensively studied for 2CO absorption purposes and their aqueous solutions
characterized in detail concerning physical properties and reaction equilibrium and
kinetics towards 2CO (Austgen et al., 1989; Blauwhoff et al., 1984; Rochelle et al.,
2001; Versteeg et al., 1996; Versteeg and Van Swaaij, 1988; Weiland et al., 1993).
However, alkanolamines easily undergo oxidative degradation resulting in highly toxic
degradation products and this degradation is far more extensive in oxygen rich
environments (Goff and Rochelle, 2006; Holst et al., 2006; Kumar, 2002; Supap et al.,
2006). Besides, alkanolamines are organic substances with surface tensions
considerably lower than water and therefore they wet some commercially available
membranes (Kumar, 2002). For these reasons, alkanolamines might not be suitable for
2CO removal from anesthetic gas circuits and new absorbents, able to overcome these
drawbacks need to be developed.
Amino acids (or, more precisely, alkali salts of amino acids1) are being studied as a
possible alternative for alkanolamines (Feron and Jansen, 2002; Kumar et al., 2002b).
Amino acids have the same reactive group towards 2CO as alkanolamines and therefore
1 Amino acids exist in solution as a zwitterion (with the amine group protonated) -
1 2 3 1 2 3HOOC R R R N OOC R R R NH− +− − ↔ − − . It is necessary to make it react with an alkali hydroxide
(potassium hydroxide, for example) to enable it to react with 2CO .

11
they present equivalent equilibrium capacities and reaction kinetics (Holst et al., 2006;
Kumar et al., 2003a; Kumar et al., 2003b). However, due to their ionic nature, amino
acids present a number of advantages when compared to alkanolamines: they are much
more resistant to oxidative degradation and more thermally stable, present lower
volatilities (amino acids can be considered non volatile, so there is no loss of the active
specie during the process and no transfer to the anaesthetic circuit) and their solutions
have higher surface tensions (not wetting common and non expensive membranes) and
have densities and viscosities similar to water (which means that no extra hydrodynamic
concerns are introduced) (Feron and Jansen, 2002; Kumar et al., 2001; Kumar et al.,
2002b). Nevertheless, amino acids present a couple of drawbacks: they are more
expensive than alkanolamines and precipitation of the reaction products was observed
during the absorption of 2CO in their solutions (Hook, 1997; Kumar et al., 2003c;
Majchrowicz et al., 2006). Precipitation is a severe limitation if porous membrane
contactors are to be used because of possible blockage of membrane pores; even when
non porous membranes are used, hydrodynamic problems can arise because of
precipitation.
The general ability of an amino acid (or other amine based compound) to absorb 2CO is
determined by the molecular structure of the compound. There is a considerable amount
of information in literature relating the molecular structure of 2CO absorbents and
reaction characteristics such as absorption kinetics, equilibrium capacity and
regeneration extent (Caplow, 1968; Hook, 1997; Penny and Ritter, 1983; Sartori and
Savage, 1983; Singh et al., 2007).
2CO reacts with aqueous solutions of primary or secondary amines forming carbamates,
bicarbonates and carbonates (Caplow, 1968; Hook, 1997; Jensen et al., 1952).
Generically, the stability of the carbamates formed influence the absorption as follows:
amines which form stable carbamates react faster but present lower equilibrium
capacities at loadings higher than 0.5 2
-1CO AmAmol mol⋅ (i.e. for the same loading, the
2CO equilibrium pressure above the liquid is higher in solutions of this amines) and
they are more difficult to regenerate than amines which form unstable carbamates
(Hook, 1997; Park et al., 2003; Sartori and Savage, 1983). An amine is sterically

12
hindered when the amine group is connected to a secondary or terciary carbon, i.e. when
the carbon adjacent to the amine group is substituted. Sterical hindrance is known to
considerably reduce the carbamate stability (Sartori and Savage, 1983). Therefore,
sterically hindered amines present generally higher absorption capacities at high
loadings and show deeper desorption ability, but they exhibit lower absorption kinetics
when compared to their non-sterically hindered equivalents. In the same way, secondary
amines form less stable carbamates than primary amines. Singh et al. (2007) studied the
influence of the chain length on the amines’ absorption ability and concluded that
increasing the chain length does not bring any advantage to the absorption equilibrium
or to the absorption kinetics. Hook (1997) compared the regeneration achieved with
amines containing a potassium carboxilate group ( )2CO K− + (potassium amino acid
salts) and a hydroxymethylen group ( )2HOCH (amino alcohols) and concluded that the
amino alcohols enable higher desorption levels and at higher rates than the
corresponding amino acid salts.
Tertiary amines do not react directly with 2CO to form carbamates. Instead, they act as
a catalyst for the hydration of 2CO to form bicarbonate (Bonenfant et al., 2003; Sartori
and Savage, 1983). They are essentially slower absorbents than primary and secondary
amines but enable high absorption capacities (Bonenfant et al., 2003). Tertiary
alkanolamines are also easier to regenerate (Bonenfant et al., 2003; Derks et al., 2006).
They are often used blended with other amines which act as rate promoters (Bishnoi and
Rochelle, 2000; Derks et al., 2006).
1.4. Motivation and Outline of the Thesis
The doctoral work presented here arose in the context of the European Project entitled
“Development of New Materials and Processes to Enhance Specialty Gas Separations” -
SpecSep. The project concerned gas separations for medical applications and four
partners were involved on the subject of 2CO removal from anaesthetic gas streams and
from life support applications using hollow fiber absorbent membrane contactors:
LEPAE (Porto, Portugal), GKSS (Geesthacht, Germany), CSIC (Madrid, Spain) and
Drager AG (Luebeck, Germany).

13
In the framework of the SpecSep European Project, LEPAE was in charge of
characterizing different absorbents, focusing on the reaction kinetics and equilibrium
towards 2CO . Both commercially available amino acids and amino acids synthesized by
CSIC - Consejo Superior de Investigaciones Cientificas, Institute of Science and
Technology of Polymers - were considered. Since laboratory synthesis of absorbents is
an expensive and time consuming process and generally only a few grams can be
produced in each batch, a lot of effort was put on the development of a fast and
inexpensive methodology to analyze the performance of the absorbents using the lowest
amount of substance possible. For the pre-screening of the absorbents, a setup similar to
the ones used for the volumetric measurement of adsorption isotherms was used – this
setup and methodology are described in detail by Santos et al. (2008). In addition, the
solution was continuously stirred using a magnetic stirrer and the pressure decrease
inside the absorbent tank was recorded during the entire absorption process. Uptake
curves were drawn with the pressure decrease versus time. Using this method, only 10
mL of solution is spent for each experiment. Experiments were performed at 293 K.
During the SpecSep Project, the following commercially available amino acid salts
were pre-screened: glycine, DL-alanine, beta-alanine, serine, threonine, isoleucine, DL-
valine, piperazine-2-carboxilic acid, proline, arginine, gamma-aminobutyric acid,
ornithine, taurine, creatine and histidine. The biocompatibility of the absorbents was
checked based on values of oral LD50 reported in the safety data sheets of the
compounds. LD50 (lethal dose 50 %) is a measure of the toxicity of a compound which
is an important indicator of its biocompatibility. Glycine, isoleucine, proline, arginine,
ornithine, taurine and histidine present values of oral LD50 in rats between 5000 and
15 000, which means that they are practically non toxic (CCOHS, 2008). No
information about LD50 is available for the other compounds. Concerning hazardous
information, only arginine is irritant. Nine new and non-commercially available
absorbents synthesised by CSIC were also pre-screened using the described
methodology.
All the absorbents studied proved to be able to absorb 2CO at significant rates and
absorption capacities. Nevertheless, the method used was not able to accurately
differentiate them. A more precise and quantitative analysis require time consuming

14
experiments and larger amounts of these substances. Since, unlike alkanolamines, there
is little information in literature about the 2CO absorption in amino acid salt solutions,
the potassium salt of the simplest amino acid (glycine) was selected for this more
extensive characterization. However, the molecular structure of potassium glycinate, a
primary and non-sterically hindered amino acid, makes it expectable to be difficult to
regenerate. Given the considerations made in section 1.3, potassium threonate is likely
to overcome this problem and at the same time to have acceptable reaction kinetics (this
is clarified in Chapter 3). For this reason, this compound was also selected for further
characterization.
The structural formulas of the amino acids glycine and trheonine are presented in Table
1.1.
Table 1.1 - Structural formulas of the amino acids characterized in the present
dissertation.
Glycine Threonine
The present dissertation is organized as follows.
In Part II, the selected amino acids salts are characterized for 2CO absorption purposes:
potassium glycinate (Chapter 2) and potassium threonate (Chapter 3). Physical
properties of their aqueous solutions, including density, viscosity and 2CO physical
solubility are determined at different temperatures and amino acid salt concentrations.
Reaction kinetics towards 2CO is also measured at different temperature and
concentration conditions.
Part III (Chapter 4) reports the study of the 2CO absorption equilibrium in amino acid
salt solutions. Absorption equilibrium in potassium glycinate is measured at different

15
temperatures and amino acid salt concentrations. The equilibrium absorption capacity of
potassium threonate is also determined for one condition of concentration and
temperature and compared to the results for potassium glycinate.
In Part IV (Chapter 5), a bi-dimensional model to describe the membrane contactor
process under study is proposed. The performance of the hollow fiber membrane
contactor using potassium glycinate solutions is analysed (based on the physical,
kinetics and equilibrium data determined in the previous chapters). The influence of the
system parameters on the separation achieved is discussed and a contactor design and a
set of operating conditions are suggested.
Finally, in Part V (Chapter 6), the main conclusions are summarised and suggestions for
future work are presented.
Further details on the experimental setups used along this work are presented in
Appendix A.
1.5. References
Al-Marzouqi, M. H., El-Naas, M. H., Marzouk, S. A. M., Al-Zarooni, M. A., Abdullatif,
N. and Faiz, R. (2008). "Modeling of CO2 absorption in membrane contactors."
Separation and Purification Technology, 59(3), 286-293.
Austgen, D. M., Rochelle, G. T., Peng, X. and Chen, C. C. (1989). "Model of Vapor
Liquid Equilibria for Aqueous Acid Gas Alkanolamine Systems Using the Electrolyte
Nrtl Equation." Industrial & Engineering Chemistry Research, 28(7), 1060-1073.
Baum, J. A. and Woehlck, H. J. (2003). "Interaction of inhalational anaesthetics with
CO2 absorbents " Best Practice and Research Clinical Anaesthesiology, 17(1), 63-76.
Bishnoi, S. and Rochelle, G. T. (2000). "Absorption of carbon dioxide into aqueous
piperazine: reaction kinetics, mass transfer and solubility." Chemical Engineering
Science, 55(22), 5531-5543.

16
Blauwhoff, P. M. M., Versteeg, G. F. and Vanswaaij, W. P. M. (1984). "A Study on the
Reaction between CO2 and Alkanolamines in Aqueous-Solutions." Chemical
Engineering Science, 39(2), 207-225.
Bonenfant, D., Mimeault, M. and Hausler, R. (2003). "Determination of the structural
features of distinct amines important for the absorption of CO2 and regeneration in
aqueous solution." Industrial & Engineering Chemistry Research, 42(14), 3179-3184.
Brandi, L. S. (2008). "Anesthesia - Information for patients -
http://www.brandianestesia.it/." Retrieved October, 2008, 2008.
CAETS (1995). The Role of Technology in Environmentally Sustainable Development.
Kiruna, Sweden, Council of Academies of Engineering and Technological Sciences.
Caplow, M. (1968). "Kinetics of carbamate formation and breakdown." Journal of the
American Chemical Society, 90(24), 6795-6803.
CCOHS. (2008). "What is an LD50 and LC50? - http://www.ccohs.ca." Retrieved
October, 2008, 2008.
Derks, P. W. J., Kleingeld, T., van Aken, C., Hogendoom, J. A. and Versteeg, G. F.
(2006). "Kinetics of absorption of carbon dioxide in aqueous piperazine solutions."
Chemical Engineering Science, 61(20), 6837-6854.
Dingley, J., Ivanova-Stoilova, T. M., Grundler, S. and Wall, T. (1999). "Xenon: recent
developments." Anaesthesia, 54(4), 335-346.
Dosch, M. P. (2004). "The Anesthesia Gas Machine - http://www.udmercy.edu."
Retrieved October, 2008, 2008.
Fan, S. Z., Lin, Y. W., Chang, W. S. and Tang, C. S. (2008). "An evaluation of the
contributions by fresh gas flow rate, carbon dioxide concentration and desflurane partial
pressure to carbon monoxide concentration during low fresh gas flows to a circle
anaesthetic breathing system." European Journal of Anaesthesiology, 25(8), 620-626.
Favre, E. (2007). "Carbon dioxide recovery from post-combustion processes: Can gas
permeation membranes compete with absorption?" Journal of Membrane Science,
294(1-2), 50-59.
17
Feron, P. and Jansen, A. (2002). "CO2 separation with polyolefin membrane contactors
and dedicated absorption liquids: performances and prospects." Separation and
Purification Technology, 27(3), 231-242.
Gabelman, A. and Hwang, S. (1999). "Hollow fiber membrane contactors." Journal of
Membrane Science, 159(1-2), 61-106.
Goff, G. S. and Rochelle, G. T. (2006). "Oxidation inhibitors for copper and iron
catalyzed degradation of monoethanolamine in CO2 capture processes." Industrial &
Engineering Chemistry Research, 45(8), 2513-2521.
Hampe, E. M. and Rudkevich, D. M. (2003). "Exploring reversible reactions between
CO2 and amines." Tetrahedron, 59(48), 9619-9625.
Holst, J., Politiek, P. P., Niederer, J. P. M. and Versteeg, G. F. (2006). "CO2 capture
from flue gas using amino acid salt solutions". GHGT-8, NTNU VIDERE, Pav. A,
Dragvoll, NO-7491 Trondheim, Norway.
Hook, R. J. (1997). "An investigation of some sterically hindered amines as potential
carbon dioxide scrubbing compounds." Industrial & Engineering Chemistry Research,
36(5), 1779-1790.
Idem, R. and Tontiwachwuthikul, P. (2006). "Preface for the special issue on the
capture of carbon dioxide from industrial sources: Technological developments and
future opportunities." Industrial & Engineering Chemistry Research, 45(8), 2413-2413.
Jensen, A., Jensen, J. B. and Faurholt, C. (1952). "Studies on Carbamates .6. The
Carbamate of Glycine." Acta Chemica Scandinavica, 6(3), 395-397.
Keshavarz, P., Ayatollahi, S. and Fathikalajahi, J. (2008). "Mathematical modeling of
gas–liquid membrane contactors using random distribution of fibers." Journal of
Membrane Science, 325, 98–108.
Knolle, E. and Gilly, H. (2000). "Absorption of carbon dioxide by dry soda lime
decreases carbon monoxide formation from isoflurane degradation." Anesthesia and
Analgesia, 91(2), 446-451.

18
Kumar, P., Hogendoorn, J., Feron, P. and Versteeg, G. (2001). "Density, viscosity,
solubility, and diffusivity of N2O in aqueous amino acid salt solutions." Journal of
Chemical and Engineering Data, 46(6), 1357-1361.
Kumar, P., Hogendoorn, J., Feron, P. and Versteeg, G. (2002a). "New absorption liquids
for the removal of CO2 from dilute gas streams using membrane contactors." Chemical
Engineering Science, 57(9), 1639-1651.
Kumar, P., Hogendoorn, J., Timmer, S., Feron, P. and Versteeg, G. (2003a).
"Equilibrium solubility of CO2 in aqueous potassium taurate solutions: Part 2.
Experimental VLE data and model." Industrial & Engineering Chemistry Research,
42(12), 2841-2852.
Kumar, P., Hogendoorn, J., Versteeg, G. and Feron, P. (2003b). "Kinetics of the
reaction of CO2 with aqueous potassium salt of taurine and glycine." American Institute
of Chemical Engineers Journal, 49(1), 203-213.
Kumar, P. S. (2002). "Development and design of membrane gas absorption processes".
Enschede, University of Twente.
Kumar, P. S., Hogendoorn, J. A., Feron, P. H. M. and Versteeg, G. F. (2002b). "New
absorption liquids for the removal of CO2 from dilute gas streams using membrane
contactors." Chemical Engineering Science, 57(9), 1639-1651.
Kumar, P. S., Hogendoorn, J. A., Feron, P. H. M. and Versteeg, G. F. (2003c).
"Equilibrium solubility of CO2 in aqueous potassium taurate solutions: Part 1.
Crystallization in carbon dioxide loaded aqueous salt solutions of amino acids."
Industrial & Engineering Chemistry Research, 42(12), 2832-2840.
Li, J. L. and Chen, B. H. (2005). "Review Of CO2 absorption using chemical solvents in
hollow fiber membrane contactors." Separation and Purification Technology, 41(2),
109-122.
Ma'mun, S., Svendsen, H. F., Hoff, K. A. and Juliussen, O. (2007). "Selection of new
absorbents for carbon dioxide capture." Energy Conversion and Management, 48(1),
251-258.

19
Majchrowicz, M., Niederer, J. P. M., Velders, A. H. and Versteeg, G. F. (2006).
"Precipitation in amino acid salt CO2 absorption systems". GHGT-8 NTNU VIDERE,
Pav. A, Dragvoll, NO-7491 Trondheim, Norway.
Marini, F., Bellugi, I., Gambi, D., Pacenti, M., Dugheri, S., Focardi, L. and Tulli, G.
(2007). "Compound A, formaldehyde and methanol concentrations during low-flow
sevoflurane anaesthesia: comparison of three carbon dioxide absorbers." Acta
Anaesthesiologica Scandinavica, 51(5), 625-632.
Mendes, A. M. M. (2000). "Development of an adsorption/membrane based system for
carbon dioxide, nitrogen and spur gases removal from a nitrous oxide and xenon
anaesthetic closed loop." Acp-Applied Cardiopulmonary Pathophysiology, 9(2), 156-
163.
Metz, B., Davidson, O., Coninck, H. d., Loos, M. and Meyer, L. (2005). IPCC Special
Report on Carbon Dioxide Capture and Storage. C. U. Press. Cambridge, New York,
Melbourne, Madrid, Cape Town, Singapore, São Paulo, Intergovernmental Panel on
Climate Change.
Murray, J. M., Renfrew, C. W., Bedi, A., McCrystal, C. B., Jones, D. S. and Fee, J. P.
H. (1999). "Amsorb - A new carbon dioxide absorbent for use in anesthetic breathing
systems." Anesthesiology, 91(5), 1342-1348.
Park, J. Y., Yoon, S. J. and Lee, H. (2003). "Effect of steric hindrance on carbon
dioxide absorption into new amine solutions: Thermodynamic and spectroscopic
verification through solubility and NMR analysis." Environmental Science &
Technology, 37(8), 1670-1675.
Penny, D. E. and Ritter, T. J. (1983). "Kinetic-Study of the Reaction between Carbon-
Dioxide and Primary Amines." Journal of the Chemical Society-Faraday Transactions I,
79, 2103-2109.
Pontes, S. L. d. R. (2006). "Removal of carbon dioxide and nitrogen from a xenon based
closed-circuit anaesthetic system". Porto, Porto.
Rangwala, H. A. (1996). "Absorption of carbon dioxide into aqueous solutions using
hollow fiber membrane contactors." Journal of Membrane Science, 112(2), 229-240.

20
Reinelt, H., Marx, T., Schirmer, U. and Schmidt, M. (2001). "Xenon expenditure and
nitrogen accumulation in closed-circuit anaesthesia." Anaesthesia, 56(4), 309-311.
Rochelle, G. T., Bishnoi, S., Chi, S., Dang, H. and Santos, J. (2001). Research needs for
CO2 capture from flue gas by aqueous absorption/stripping. U. S. D. o. E.-F. E. T.
Center. Pittsburg, U. S. Department of Energy - Federal Energy Technology Center: 60.
Santos, J. C., Magalhaes, F. D. and Mendes, A. (2008). "Contamination of zeolites used
in oxygen production by PSA: Effects of water and carbon dioxide." Industrial &
Engineering Chemistry Research, 47(16), 6197-6203.
Sartori, G. and Savage, D. W. (1983). "Sterically Hindered Amines for CO2 Removal
from Gases." Industrial & Engineering Chemistry Fundamentals, 22(2), 239-249.
Singh, P., Nierderer, J. P. M. and Versteeg, G. F. (2007). "Structure and activity
relationships for amine based CO2 absorbents - I." International Journal of Greenhouse
Gas Control, 1(1), 5-10.
Struys, M. M. R. F., Bouche, M. P. L. A., Rolly, G., Vandevivere, Y. D. I., Dyzers, D.,
Goeteyn, W., Versichelen, L. F. M., Van Bocxlaer, J. F. P. and Mortier, E. P. (2004).
"Production of compound A and carbon monoxide in circle systems: an in vitro
comparison of two carbon dioxide absorbents." Anaesthesia, 59(6), 584-589.
Supap, T., Idem, R., Tontiwachwuthikul, P. and Saiwan, C. (2006). "Analysis of
monoethanolamine and its oxidative degradation products during CO2 absorption from
flue gases: A comparative study of GC-MS, HPLC-RID, and CE-DAD analytical
techniques and possible optimum combinations." Industrial & Engineering Chemistry
Research, 45(8), 2437-2451.
UNFCCC (2008). United Nations Framework Convention on Climate change,
http://unfccc.int.
Versteeg, G. F., Van Dijck, L. A. J. and Van Swaaij, W. P. M. (1996). "On the kinetics
between CO2 and alkanolamines both in aqueous and non-aqueous solutions. An
overview." Chemical Engineering Communications, 144, 113-158.

21
Versteeg, G. F. and Van Swaaij, W. P. M. (1988). "Solubility and Diffusivity of Acid
Gases (CO2, N2O) in Aqueous Alkanolamine Solutions." Journal of Chemical and
Engineering Data, 33(1), 29-34.
Vladisavljevic, G. T. (1999). "Use of polysulfone hollow fibers for bubbleless
membrane oxygenation/deoxygenation of water." Separation and Purification
Technology, 17(1), 1-10.
Weiland, R. H., Chakravarty, T. and Mather, A. E. (1993). "Solubility of Carbon-
Dioxide and Hydrogen-Sulfide in Aqueous Alkanolamines." Industrial & Engineering
Chemistry Research, 32(7), 1419-1430.
Whalen, F. X., Bacon, D. R. and Smith, H. M. (2005). "Inhaled anesthetics: an historical
overview." Best Practice Research Clinical Anaesthesiology, 19(3), 323-330.
Wickramasinghe, S. R., Han, B., Garcia, J. D. and Specht, R. (2005). "Microporous
membrane blood oxygenators." American Institute of Chemical Engineers Journal,
51(2), 656-670.
Yan, S. P., Fang, M. X., Zhang, W. F., Wang, S. Y., Xu, Z. K., Luo, Z. Y. and Cen, K.
F. (2007). "Experimental study on the separation of CO2 from flue gas using hollow
fiber membrane contactors without wetting." Fuel Processing Technology, 88(5), 501-
511.
Zhang, Q. and Cussler, E. L. (1985a). "Microporous Hollow Fibers for Gas-Absorption
.1. Mass-Transfer in the Liquid." Journal of Membrane Science, 23(3), 321-332.
Zhang, Q. and Cussler, E. L. (1985b). "Microporous Hollow Fibers for Gas-Absorption
.2. Mass-Transfer across the Membrane." Journal of Membrane Science, 23(3), 333-
345.


Part II


25
2. Characterization of potassium glycinate
for carbon dioxide absorption purposes 1
Abstract
Aqueous solutions of potassium glycinate were characterized for carbon dioxide
absorption purposes. Density and viscosity of these solutions, with concentrations
ranging from 0.1 to 3 M, were determined at temperatures from 293 to 313 K.
Diffusivity of 2CO in solution was estimated applying the modified Stokes-Einstein
relation. Solubilities of 2N O at the same temperatures and concentrations were
measured and the ion specific parameter based on the Schumpe’s model was determined
for the glycinate anion; the solubilities of 2CO in these solutions were then computed.
The reaction kinetics of 2CO in the aqueous solution of potassium glycinate was
determined at 293, 298 and 303 K using a stirred cell reactor. The results were
interpreted using the DeCoursey equation for the calculation of the enhancement factor.
The rate of absorption as a function of the temperature and solution concentration for
the conditions studied was found to be given by the following expression:
( )2 2
16 85442.42 10 exp exp 0.44CO S S COr C C C
T
− − = ×
.
1 Portugal, A. F.; Derks, P. W. J.; Versteeg, G. F.; Magalhães, F. D.; Mendes, A., “Characterization of potassium glycinate for carbon dioxide absorption purposes”, Chem. Eng. Sci., 2007, 62(23), 6534 – 6547

26
2.1. Introduction
The carbon dioxide removal from closed anesthetic loops is currently achieved using
soda lime canisters (a mixture of calcium, potassium and sodium hydroxides) which is
an unsafe technique (Mendes, 2000). The use of dehydrated soda lime is associated to
explosions due to the hydrogen formation and excessive heating during the reaction
with carbon dioxide. Soda lime can also originate toxic compounds resulting from the
reaction with some halogenated anesthetics (Whalen et al., 2005). Because of that and
because exhausted soda lime canisters are a hospital solid waste, this outdated system
needs to be replaced by a safer technology. A possible candidate is the use of absorption
membrane contactors. This strategy presents various advantages. The use of a dense
highly permeable membrane isolates the absorption system from the anesthetic loop and
the absorption solution can be regenerated after contacting with carbon dioxide.
However, the absorbent should have a suitable carbon dioxide absorption kinetics and
capacity, negligible vapor pressure, high chemical and thermal stability and should be
harmless to the patient.
Mostly as a consequence of the Kyoto protocol, the new stringent environmental
regulations towards the emission of acidic gases raised concern about carbon dioxide
capture and storage In the last decades, hollow fiber membrane contactors have been
studied using absorbent aqueous solutions such as alkanolamines or blends of
alkanolamines for the selective removal of acid gases like 2H S and 2CO from a variety
of industrial and natural gas streams (Al-Juaied and Rochelle, 2006; Kumar et al.,
2003c). However, for applications in highly oxygenated environments, such as flue gas
treatment, life support systems or anesthetic gas circuits, alkanolamines might not be of
interest since they undergo oxidative degradation (Goff and Rochelle, 2006; Kumar et
al., 2003c; Supap et al., 2006). Amino acids are now being studied as a possible
alternative for alkanolamines (Feron and Jansen, 2002). Although being more
expensive, a few advantages make amino acids attractive like being generally more
stable to oxidative degradation and presenting lower volatilities while showing similar
absorption kinetics and capacities in comparison to alkanolamine solutions (Kumar et
al., 2003b). Moreover, amino acids aqueous solutions have higher surface tensions and
the viscosities are very similar to water’s. If membrane contactors are to be used, it is

27
important to consider that the membrane materials should be compatible with the
absorption liquid. A liquid with higher surface tension and lower corrosiveness will
make possible the efficient use of cheaper and commercially available membranes,
economically improving the process (Kumar et al., 2003a).
Despite of rising interest, few studies have been performed so far on amino acids as
carbon dioxide absorbents. TNO Environment Energy and Process Innovation has been
developing a process for carbon dioxide removal from flue gas process based on the use
of amino acids and salts (Feron and Jansen, 2002). Kumar and co-workers studied in
detail the absorption of carbon dioxide in potassium salts of taurine and briefly analyzed
glycine (Kumar et al., 2001, 2002, 2003a, 2003b, 2003c). Holst et al. (2006) compared
the apparent absorption rate constants of 2CO with different amino acid salt solutions
and concluded that they were comparable with alkanolamines. Recently Lee et al.
studied the physical properties and the absorption kinetics of sodium glycinate as an
absorbent of carbon dioxide (Lee et al., 2005, 2006, 2007; Song et al., 2006). However,
the data available in literature is still too limited to permit a suitable design and
optimization of processes using amino acid absorbents.
After a pre-screening of a set of different amino acid salts, potassium glycinate
presented several interesting properties, such as very good thermal stability and fast
apparent reaction rate towards carbon dioxide. Besides, it is commercially available and
relatively cheap. For these reasons, it was selected for characterization as a carbon
dioxide absorbent in the present work. This includes the determination of the densities
and viscosities of aqueous solutions with concentrations between 0.1 to 3 M and
temperatures from 293 to 313 K. The solubility of 2N O in potassium glycinate
solutions was also measured and the absorption kinetics of carbon dioxide in potassium
glycinate solutions obtained.
2.2. Zwitterion Reaction Mechanism
The zwitterion mechanism, originally proposed by Caplow (1968) is generally applied
to model the carbon dioxide absorption in amino acid aqueous solutions. According to
the zwitterion mechanism, 2CO reacts with the amino acid salt (potassium glycinate in
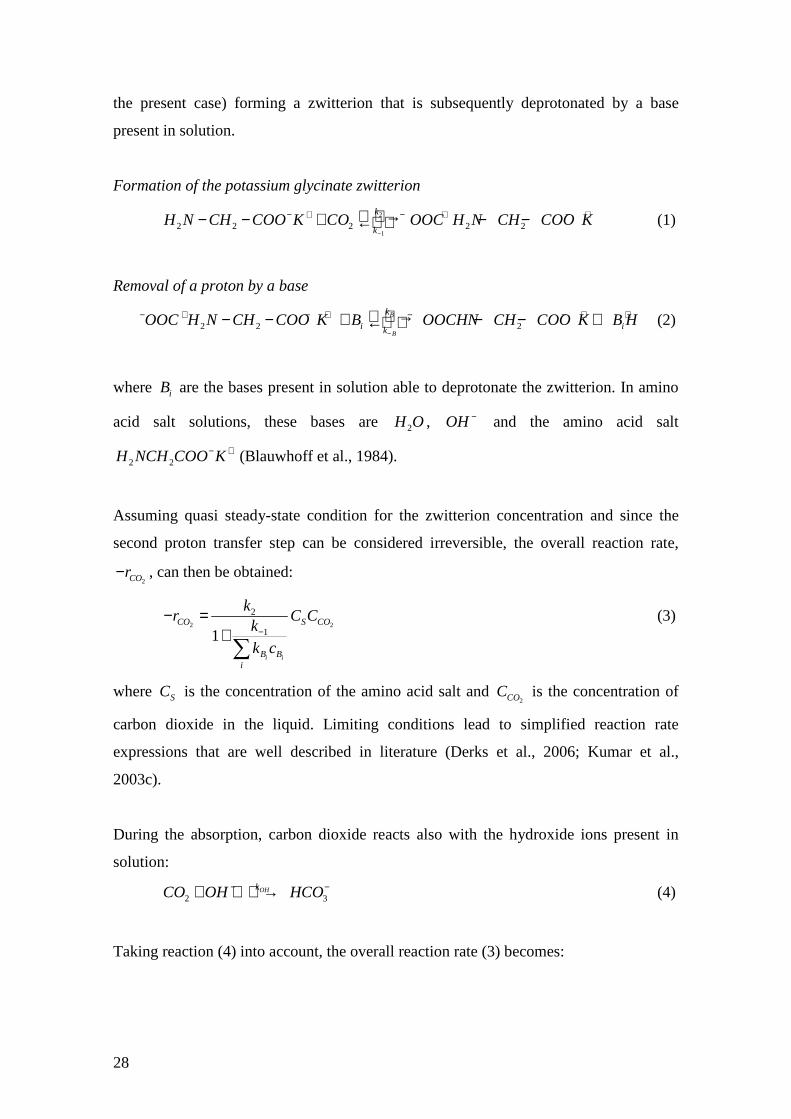
28
the present case) forming a zwitterion that is subsequently deprotonated by a base
present in solution.
Formation of the potassium glycinate zwitterion
2
12 2 2 2 2
k
kH N CH COO K CO OOC H N CH COO K
−
− + − + − +→− − + − −← (1)
Removal of a proton by a base
2 2 2B
B
k
i ikOOC H N CH COO K B OOCHN CH COO K B H
−
− + − + − − + +→− − + − − +← (2)
where iB are the bases present in solution able to deprotonate the zwitterion. In amino
acid salt solutions, these bases are 2H O , OH − and the amino acid salt
2 2H NCH COO K− + (Blauwhoff et al., 1984).
Assuming quasi steady-state condition for the zwitterion concentration and since the
second proton transfer step can be considered irreversible, the overall reaction rate,
2COr− , can then be obtained:
2 2
2
11i i
CO S CO
B Bi
kr C C
k
k c−
− =+∑
(3)
where SC is the concentration of the amino acid salt and 2COC is the concentration of
carbon dioxide in the liquid. Limiting conditions lead to simplified reaction rate
expressions that are well described in literature (Derks et al., 2006; Kumar et al.,
2003c).
During the absorption, carbon dioxide reacts also with the hydroxide ions present in
solution:
2 3OHkCO OH HCO− −+ → (4)
Taking reaction (4) into account, the overall reaction rate (3) becomes:

29
2 2
2
11i i
CO S COOH OH
B Bi
kr C k C C
k
k C
− −
−
− = + +
∑
(5)
However, as potassium glycinate is a weak base, the contribution of reaction (4) to the
overall reaction kinetics can be considered negligible as well as the contribution of
OH − to the deprotonation of the zwitterion (Kumar et al., 2003c). The overall rate of
reaction of 2CO with potassium glycinate therefore becomes:
( ) ( )
2
2
2 2
2
1 1
11
S COCO
H O H O AmA S
k C Cr
k k C k k C− −
− =+
+
(6)
Primary amines such as monoethanolamine (MEA) usually react with 2CO following a
second order reaction kinetics, which means that the deprotonation of the zwiteterion is
relatively fast when compared to the reversion rate of 2CO and the amine
( 1 1i iB B
i
k
k c− <<
∑). Equation (6) is then reduced to:
2 22CO S COr k C C− = (7)
A thermodynamically sound model for the calculation of the kinetic constant should be
expressed in terms of activities rather than concentrations (Haubrock et al., 2005).
However, such a model would require the knowledge of a number of parameters
including equilibrium data that are not available. To account for the solution non-
idealities it is common to use a semi empirical model which relates the kinetic constant
to the solution ionic strength (Cullinane and Rochelle, 2006):
( )expeffk k bI= (8)
where effk is the effective kinetic constant, corrected for the solution ionic strength, b
is a constant and I is the ionic strength given by 21
2 i iI C z= ∑ , where iC and iz are
respectively the molar concentration and the charge of ion i in solution. This model is
not thermodynamically sound and cannot be extrapolated for different ions present in
solution since all the solution non-idealities are lumped in the effective kinetic constant,

30
effk ; however it is generally sufficient to represent the experimental data of a single
absorption system (Haubrock et al., 2005).
2.3. Mass Transfer
The absorption of a pure gas (carbon dioxide in the present work) into a lean reactive
liquid (potassium glycinate solution) is described by the following equation
(Danckwerts, 1970)
2
2
2
COCO L
CO
PN E k A
H= ⋅ (9)
where 2CON is the molar flow of 2CO entering the liquid, Lk is the physical mass
transfer coefficient, 2COP is the 2CO partial pressure in the gas phase,
2COH is the Henry
constant of 2CO in solution, A is the interfacial area between the gas and the liquid
phases and E is the enhancement factor. The enhancement factor represents the ratio
between the rate of absorption in the presence of the chemical reaction and the physical
rate of absorption. When the reaction rate is sufficiently high, the reaction occurs
entirely in the liquid film and not in the liquid bulk and the absorption rate can be
divided into three main regimes depending on the dimensionless Hatta number:
2ov CO
L
k DHa
k= (10)
where ovk is the overall reaction kinetic constant (2 2ov CO COk r C= − ) and
2COD is the
diffusion coefficient of 2CO in solution.
Fast pseudo-first order (PFO) reaction regime can be assumed if the following criterion
is fulfilled (Danckwerts, 1970):
3 Ha E∞< << (11)
In this case, the processes of diffusion and reaction occur in parallel in the liquid film.
The enhancement factor can be considered equal to the Hatta number and the gas
absorption rate becomes, therefore, independent of the physical mass transfer
coefficient. The infinite enhancement factor, E∞ , corresponds to a situation of

31
instantaneous reaction and can be estimated, according to the penetration theory, by the
following equation (Danckwerts, 1970; Higbie, 1935):
2
2 2
2
2
CO S S
COS COCO
CO
D C DE
PD D
Hν
∞ = + (12)
where SD is the amino acid salt diffusion coefficient and 2COν is the stoichiometric
coefficient. The instantaneous reaction regime can be considered when E Ha∞ << .
Between the limiting situations of fast pseudo-first order and instantaneous reaction
regime, there is the intermediate regime. According to DeCoursey, the enhancement
factor in the intermediate regime can be approximated as a function of the Hatta number
and the infinite enhancement factor (DeCoursey, 1974; Van Swaaij and Versteeg,
1992):
( ) ( )22 4
2 12 1 14 1
E HaHa HaE
E EE∞
∞ ∞∞
⋅= − + + +− −−
(13)
Since carbon dioxide reacts with the amino acid salt solution, the physical properties
such as physical solubility and diffusivity cannot be directly measured and need to be
estimated indirectly by analogy with a non-reactive gas with similar properties.
Typically, 2N O is the gas used for this purpose because it has a very similar molecular
configuration, volume and electronic structure and it does not react with the absorbent
solution (Laddha et al., 1981).
Since the amino acid salt solutions are ionic, the so called 2N O analogy cannot be
directly applied to estimate the solubility of 2CO in these solutions. Schumpe proposed
a model to describe the solubility of gases in ionic solutions, which takes into account
the salting out effect observed in electrolyte solutions (Schumpe, 1993; Weisenberger
and Schumpe, 1996). This model enables a reliable estimation of the solubility of 2CO
in electrolyte solutions.
The diffusion coefficient is usually difficult to accurately determine and requires time
consuming experiments. Many authors studied the dependence of the diffusion

32
coefficient on the temperature and on the concentration of the absorbent solution and
concluded that it can be related to the solution viscosity, η , through a modified Stokes-
Einstein equation (Brilman et al., 2001; Joosten and Danckwerts, 1972; Kumar et al.,
2001; Versteeg and Van Swaaij, 1988).
constantD αη = (14)
where α is a constant that depends on the pair gas/solution.
2.4. Experimental
Chemicals
Since the amino acid exists in solution with the amine group protonated, it is necessary
to make it react with a hydroxide salt to deprotonate the amine group enabling it to react
with carbon dioxide. The potassium glycinate aqueous solutions were prepared by
adding to the amino acid an equimolar amount of potassium hydroxide in a volumetric
flask with distilled and deionised water. The concentrations of the solutions were
verified by a standard potentiometric titration with 1N HCl solution.
Density and Viscosity
The density of the solutions was measured using a commercial density meter (DMA 58,
anton Paar GmbH).
Viscosities of potassium glycinate solutions were determined experimentally using a
standard Cannon-Fenske viscosimeter.
N2O solubility
The procedure adopted to measure the solubility of 2N O in the amino acid salt
solutions is described in detail by Derks et al. (2005) and will only be briefly
summarized here. The set-up used is composed of two vessels with calibrated volumes;
one for storing the nitrous oxide and the other for the absorbent solution which is
magnetically stirred. A known volume of solution is transferred to the absorbent vessel

33
and degassed by applying vacuum. The vapour equilibrium is allowed to be reached at a
given temperature; the vapour pressure, vaporP , is then recorded. The gas vessel is filled
with 2N O . A certain amount of 2N O is allowed to enter the absorbent vessel and the
initial pressure, initP , is recorded. The stirrer is then switched on and the solution
equilibrium is allowed to be established. The final pressure, eqP , is recorded as well as
the temperature, initT . The temperature is then set to a different value, T , with the help
of the thermostatic bath and a new equilibrium state is established. The amount of
absorbed gas is calculated applying the ideal gas law. The Henry coefficient for 2N O ,
2N OH , is then computed from the following equation:
( ) ( ) ( )( ) ( ) ( )2
eq vapour LN O
ginit vapour init eq vapour
init
P T P T VH T
RVP P T P T P T
T T
− = − − −
(15)
where gV and LV are respectively the volume of gas and liquid in the absorbent vessel
and R is the universal gas constant.
The solution vapour pressure at each temperature is estimated by the following relation:
( ) ( )2 2
purevapour H O H OP T x P T= (16)
where 2H Ox is the molar fraction of water in solution. The vapour pressure as a function
of the absolute temperature, ( )2
pureH OP T , is obtained from the Antoine equation (Poling et
al., 2001).
The experimental solubility of 2N O as a function of the temperature is hence obtained
using the same sample. The volume of liquid as a function of temperature and the amino
acid molar fraction are obtained using the density and the mass of solution.
Kinetic Measurements
The experiments were performed in a stirred cell reactor with a smooth gas-liquid
interface, with an interfacial area of 3 26.490 10 m−× , operating batchwise with respect to
the liquid phase and semi-continuously with respect to the gas phase. The set-up and

34
procedure are described in detail by Derks et al. (2006) and will be only briefly
summarized here. The stirred cell reactor is connected to a calibrated gas vessel filled
with pure carbon dioxide by means of a pressure controller (Brooks, model 5866, 0-500
mbar, 0.5 FS precision). A fresh potassium glycinate solution, previously degassed by
applying vacuum, is transferred into the stirred reactor. Subsequently, after the vapour-
liquid equilibrium is attained at a given temperature, the gas phase pressure inside the
stirred reactor is recorded, vapourP . One begins the experiment by letting the carbon
dioxide to flow from the gas vessel into the stirred cell reactor. During the experiment
the pressure inside the stirred cell reactor is kept constant, scP , using the pressure
controller, and the flow of absorbed carbon dioxide is computed following the pressure
decrease inside the gas vessel. A sketch of the unit is presented in Figure 2.1.
Figure 2.1 – Simplified scheme of the experimental set-up.
The flow of absorbed carbon dioxide in the stirred reactor, 2 ,CO scN , is given by equation
(9) and 2COP is the carbon dioxide partial pressure in the stirred cell (
2CO sc vapourP P P= − ).
In the gas vessel, by simply applying the ideal gas law, the flow of 2CO is given by:
2 ,
gv gvCO gv
V dPN
RT dt= (17)
where gvdP
dt is the pressure decrease rate in the gas vessel and gvV is the volume of the
gas vessel.
2 2, ,CO gv CO scN N= (18)

35
If fast pseudo-first order regime is fulfilled, it is possible to determine experimentally
the overall reaction kinetic constant, ovk , knowing 2COH and
2COD . When pseudo-first
order is considered, the carbon dioxide flow into the reactor tank is given by:
2
2
2
,CO scgv gvov CO
CO
PV dPk D A
RT dt H= (19)
However, to decide the operating conditions that lead to fast pseudo-first order reaction
regime, it is necessary to calculate Ha , which implies the previous knowledge of ovk .
For experiments performed at a given temperature, absorbent concentration and stirring
speed, the Hatta number is constant. Changing the partial pressure of carbon dioxide
inside the reactor, one changes the infinite enhancement factor and, consequently, the
ratio between Ha and E∞ , which means that the absorption regime changes. By
lowering the carbon dioxide partial pressure at constant Ha , the ratio between the flow
and the partial pressure of carbon dioxide becomes eventually constant, that is the value
of 2 2CO CON P becomes independent of
2COP . Under these conditions it is very probable
that the pseudo-first order reaction regime is attained. Plotting 2CON as a function of
2COP at the fast pseudo-first order regime, the slope of this curve is related with ovk at a
given temperature and amino acid concentration. Figure 2.2 shows experimental values
of 2CON as a function of the partial pressure of carbon dioxide. The slope of the fitted
line is related with ovk through equation (19).

36
Figure 2.2 - 2CON as a function of
2COP at 298 K for a potassium glycinate concentration
of 0.587 M.
For higher carbon dioxide partial pressures, still at constant Ha , the flow of carbon
dioxide into the liquid (absorption) depends not only on the overall kinetic constant but
also on the diffusivity ratio of carbon dioxide and absorbent, 2CO SD D . For sufficiently
high partial pressures, the instantaneous reaction regime is reached when the
enhancement factor becomes independent on the overall kinetic constant.
2.5. Results and discussion
Densities of potassium glycinate aqueous solutions with concentrations from 0.1 to 3 M
and temperatures from 273 to 313 K were determined and are presented in Table 2.1.
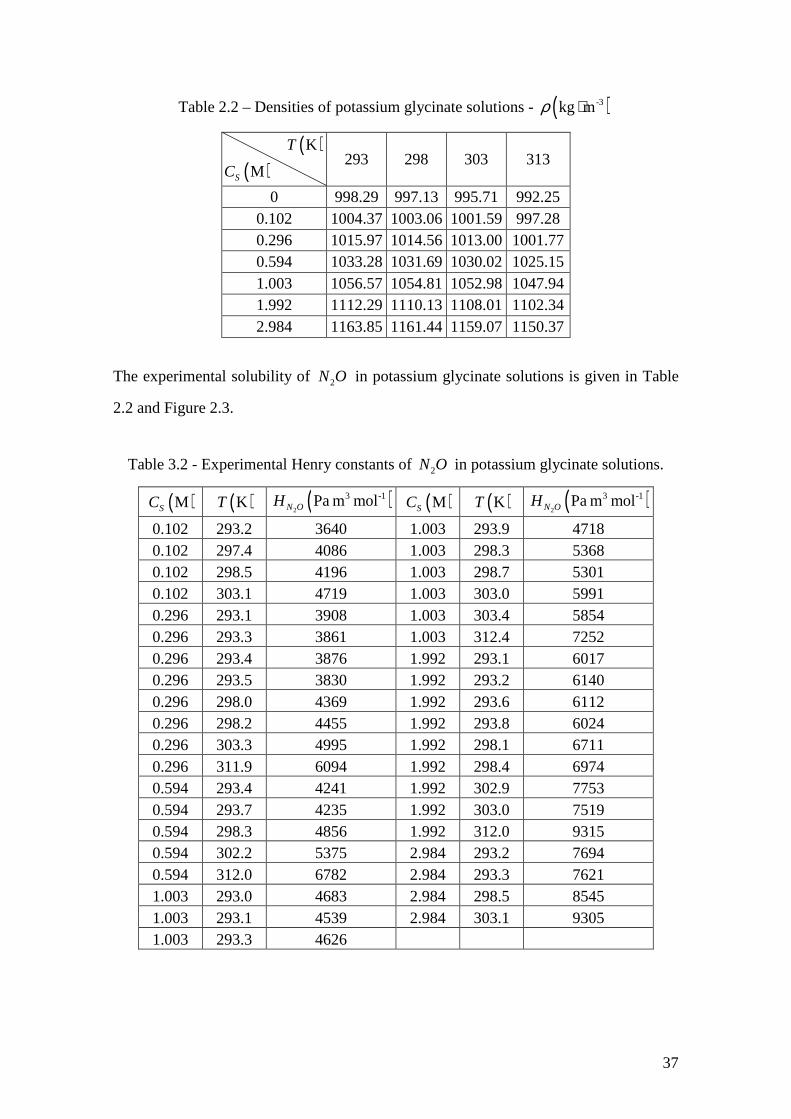
37
Table 2.2 – Densities of potassium glycinate solutions - ( )-3kg mρ ⋅
( )KT
( )MSC 293 298 303 313
0 998.29 997.13 995.71 992.25 0.102 1004.37 1003.06 1001.59 997.28 0.296 1015.97 1014.56 1013.00 1001.77 0.594 1033.28 1031.69 1030.02 1025.15 1.003 1056.57 1054.81 1052.98 1047.94 1.992 1112.29 1110.13 1108.01 1102.34 2.984 1163.85 1161.44 1159.07 1150.37
The experimental solubility of 2N O in potassium glycinate solutions is given in Table
2.2 and Figure 2.3.
Table 3.2 - Experimental Henry constants of 2N O in potassium glycinate solutions.
( )MSC ( )KT ( )2
3 -1Pa m molN OH ( )MSC ( )KT ( )2
3 -1Pa m molN OH
0.102 293.2 3640 1.003 293.9 4718 0.102 297.4 4086 1.003 298.3 5368 0.102 298.5 4196 1.003 298.7 5301 0.102 303.1 4719 1.003 303.0 5991 0.296 293.1 3908 1.003 303.4 5854 0.296 293.3 3861 1.003 312.4 7252 0.296 293.4 3876 1.992 293.1 6017 0.296 293.5 3830 1.992 293.2 6140 0.296 298.0 4369 1.992 293.6 6112 0.296 298.2 4455 1.992 293.8 6024 0.296 303.3 4995 1.992 298.1 6711 0.296 311.9 6094 1.992 298.4 6974 0.594 293.4 4241 1.992 302.9 7753 0.594 293.7 4235 1.992 303.0 7519 0.594 298.3 4856 1.992 312.0 9315 0.594 302.2 5375 2.984 293.2 7694 0.594 312.0 6782 2.984 293.3 7621 1.003 293.0 4683 2.984 298.5 8545 1.003 293.1 4539 2.984 303.1 9305 1.003 293.3 4626

38
Figure 2.3 – Experimental Henry constants of 2N O in water and in potassium glycinate
solutions as a function of temperature. Comparison with the solubility in water
determined by Versteeg and Van Swaaij (1988).
The same experimental method was also used to obtain the solubility of 2N O in water
and results compared with the ones by Versteeg and Van Swaaij (1988). It was verified
that they agree within 2% relative error.
The solubility data of 2N O in potassium glycinate was fitted using the Sechenov
relation:
2
2 ,
log N Os
N O w
HK C
H
= ⋅
(20)
where 2N OH and
2 ,N O wH are respectively the Henry constants of 2N O in the amino acid
salt solution and in water. For each concentration and temperature, averaged values of
2N OH were used. For each temperature, the computed Sechenov constants, K , failing
the t-test were rejected based on a 5% confidence limit.
For a single salt, Weisenberger and Schumpe (1996) proposed the following model to
predict the Sechenov’s constant, K :

39
( )i G iK h h n= +∑ (21)
where ih and Gh are the ion and gas specific parameters and in is the valency number
of the ion. In the present work, 1Gly
n − = and 1K
n + = and the Sechenov constant
becomes:
( ) ( )2 2 2N O N O N OGly K
K h h h h− += + + + (22)
Values of parameters K
h + and 2N Oh for the cation and the gas respectively, are reported
in literature (Weisenberger and Schumpe, 1996). These values, together with the
experimental Sechenov’s constant, 2N OK , were used to calculate the anion specific
parameter, Gly
h − . The values of Sechenov’s constant as well as the specific parameters
of gas and cation and the calculated value of the anion parameter are given in Table 2.4.
Table 2.4 – Sechenov’s constants for solubility of 2N O in aqueous potassium glycinate
solutions.
( )KT ( )2
3 -1dm molN OK ( )2
3 -1dm molN Oh ( )3 -1dm molK
h + ( )3 -1dm molGly
h −
293 0.115 -0.0061 0.0922 0.0352 298 0.116 -0.0085 0.0922 0.0408 303 0.112 -0.0109 0.0922 0.0417 313 0.102 -0.0157 0.0922 0.0409
Parameters K
h + and Gly
h − are expected to be essentially constant with the temperature
(Weisenberger and Schumpe, 1996). The values obtained for Gly
h − show, however,
slight temperature dependence. The average Gly
h − over the temperature range is 0.0397.
Taking the values of solubility in water reported by Versteeg and Van Swaaij (1988),
the anion parameter Gly
h − obtained by Kumar et al. (2001) is 0.0413 at 295 K which is
in agreement with the present work. The value of the anion specific parameter Gly
h −
along with the 2CO specific parameter, 2COh , determined by Weisenberger and
Schumpe (1996) enables to predict the Sechenov’s constant of 2CO in potassium
glycinate solutions, 2COK , and subsequently its physical solubility.
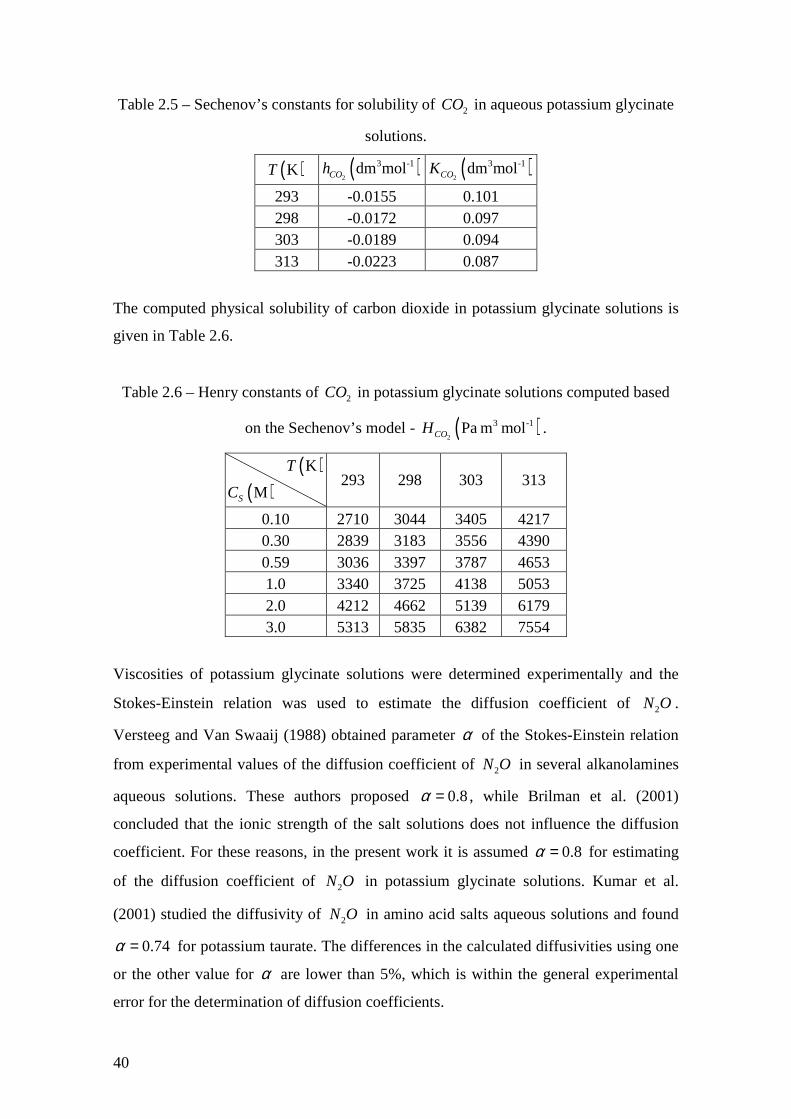
40
Table 2.5 – Sechenov’s constants for solubility of 2CO in aqueous potassium glycinate
solutions.
( )KT ( )2
3 -1dm molCOh ( )2
3 -1dm molCOK
293 -0.0155 0.101 298 -0.0172 0.097 303 -0.0189 0.094 313 -0.0223 0.087
The computed physical solubility of carbon dioxide in potassium glycinate solutions is
given in Table 2.6.
Table 2.6 – Henry constants of 2CO in potassium glycinate solutions computed based
on the Sechenov’s model - ( )2
3 -1Pa m molCOH .
( )KT
( )MSC 293 298 303 313
0.10 2710 3044 3405 4217 0.30 2839 3183 3556 4390 0.59 3036 3397 3787 4653 1.0 3340 3725 4138 5053 2.0 4212 4662 5139 6179 3.0 5313 5835 6382 7554
Viscosities of potassium glycinate solutions were determined experimentally and the
Stokes-Einstein relation was used to estimate the diffusion coefficient of 2N O .
Versteeg and Van Swaaij (1988) obtained parameter α of the Stokes-Einstein relation
from experimental values of the diffusion coefficient of 2N O in several alkanolamines
aqueous solutions. These authors proposed 0.8α = , while Brilman et al. (2001)
concluded that the ionic strength of the salt solutions does not influence the diffusion
coefficient. For these reasons, in the present work it is assumed 0.8α = for estimating
of the diffusion coefficient of 2N O in potassium glycinate solutions. Kumar et al.
(2001) studied the diffusivity of 2N O in amino acid salts aqueous solutions and found
0.74α = for potassium taurate. The differences in the calculated diffusivities using one
or the other value for α are lower than 5%, which is within the general experimental
error for the determination of diffusion coefficients.

41
The diffusion coefficient of 2CO in solution is determined using the so called
2 2:N O CO analogy (Gubbins et al., 1966):
2 2
2 2, ,
N O CO
N O w CO w
D D
D D= (23)
The values of the diffusivity of nitrous oxide and carbon dioxide in water were obtained
from the literature (Versteeg and Van Swaaij, 1988). The results of the experimentally
determined viscosities are given in Table 2.7 along with calculated diffusion
coefficients of 2N O and 2CO .
Table 2.7 – Viscosity and diffusivity of 2N O and 2CO in potassium glycinate solutions.
( )MSC ( )KT ( )3 1 110 kg m sη − −× ⋅ ⋅ ( )2
9 2 -110 m sN OD × ⋅ ( )2
9 2 -110 m sCOD × ⋅
293 1.030 1.52 1.67 298 0.914 1.75 1.89 303 0.819 1.99 2.12
0.102
313 0.666 2.57 2.66
293 1.075 1.47 1.61 298 0.962 1.68 1.81 303 0.851 1.93 2.06
0.296
313 0.693 2.49 2.58
293 1.148 1.40 1.53 298 1.020 1.60 1.73 303 0.909 1.8 1.95
0.594
313 0.746 2.35 2.43
293 1.263 1.30 1.42 298 1.136 1.47 1.58 303 1.008 1.69 1.80
1.003
313 0.826 2.16 2.24
293 1.620 1.06 1.16 298 1.449 1.21 1.30 303 1.287 1.39 1.48
1.992
313 1.070 1.76 1.82
293 2.109 0.86 0.94 298 1.861 0.99 1.07 303 1.677 1.12 1.20
2.984
313 1.363 1.45 1.50

42
Overall Kinetic Constants
The overall kinetic constants of the carbon dioxide absorption in potassium glycinate
aqueous solutions were calculated using the described methodology for a potassium
glycinate concentration from 0.1 to 3 M and at 293, 298 and 303 K.
Table 2.8 shows the overall kinetic constants of carbon dioxide absorption obtained at
the potassium glycinate concentrations and temperatures employed. Only the
experimental values of 2CON as a function of
2COP considered to be in the fast pseudo-
first reaction order regime were used for that calculation. The complete set of kinetic
results is shown in Appendix.
Table 2.8 – Experimental values of the overall kinetic constant assuming pseudo-first
order behaviour.
( )7 -1 -1Slope 10 mol mbar s⋅ ⋅ ⋅ ( )-1sovk
( )KT
( )MSC 293 298 303 293 298 303
0.0994 --- 2.51 --- --- 732 --- 0.299 4.44 4.38 5.19 2340 2540 3930 0.587 4.30 5.94 7.37 2640 5590 9490 0.999 7.09 8.83 9.40 9390 16200 20000 1.984 7.92 9.55 12.7 22800 36100 68000 3.005 --- 10.7 --- --- 86300 ---
One must now verify if inequality (11), corresponding to the pseudo-first order reaction
criterion, is fulfilled. The Hatta numbers and the infinite enhancement factors were then
calculated for each experimental condition. However, to calculate the Hatta number one
needs to determine the physical mass transfer coefficient, Lk - see equation (10), and to
calculate the infinite enhancement factors one needs to determine the diffusion
coefficient of potassium glycinate in solution, SD - see equation (12).
The physical mass transfer coefficient, Lk , was calculated using the empirical
expression referred by Versteeg et al. (1987):
3 42Sh Re Scc cc= (24)

43
where Sh, Re and Sc are respectively the Sherwood, Reynolds and Schmidt
dimensionless numbers defined as:
2
Sh L S
CO
k d
D
⋅= (25)
( )2
Re Sd Nρη
= (26)
2
ScCOD
ηρ
=⋅
(27)
where Sd and N are respectively the characteristic dimension and the speed of the
stirrer which are, in the present case, 29.09 10 mSd −= × and 1108minN −= . The
constants 2c , 3c and 4c were determined experimentally performing absorption
experiments of 2CO in water at different temperatures and they show to be within the
usual values for this kind of systems (Versteeg et al., 1987).
0.7279 0.4076Sh 0.1018 Re Sc= ⋅ (28)
It was verified that all computed Ha were much higher than 3 and therefore the first
part of the inequality (11) is confirmed.
The diffusion coefficient of potassium glycinate in solution, SD , was computed
assuming that it follows the modified Stokes-Einstein relation (14) with 0.6α =
(Versteeg and Van Swaaij, 1988). To estimate the diffusion coefficient of the salt at
infinite dilution, 0SD , the Nernst equation for the diffusion in electrolyte solutions was
applied (Poling et al., 2001):
( ) ( )( ) ( )
0
2 0 0
1 1
1 1S
RT z zD
F λ λ+ −
+ −
+ = +
(29)
where F is the Faraday constant, z+ and z− are the valencies of the cation and anion
respectively and 0λ+ and 0λ− are the ionic conductances of the cation and anion
respectively at infinite dilution. Values of 0λ+ at each temperature was calculated based
on the work of Fell and Hutchiso (1971). 0λ− at 298 K was obtained from Miyamoto and
Schmidt (1933) and it was assumed that it depends on the temperature in the same way

44
as 0λ+ . The computed diffusion coefficient of potassium glycinate in solutions, SD , are
shown in Table 2.9.
Table 2.9 – Computed values of SD used to calculate E∞ - ( )10 2 -110 m sSD × ⋅ .
( )KT
( )MSC 293 298 303
0.0994 --- 11.2 --- 0.299 8.56 10.8 13.3 0.587 8.23 10.5 12.8 0.999 7.77 9.80 12.0 1.984 6.69 8.47 10.4 3.005 --- 7.29 ---
The Hatta number, Ha , along with the minimum value of E∞ (corresponding to the
higher pressure used for computing ovk assuming the pseudo-first order) are given in
Table 2.10 for the absorbent concentrations and temperatures studied.
Table 2.10 - Ha and minimum values of E∞ used for computing ovk assuming PFO.
Ha E∞
( )KT
( )MSC 293 298 303 293 298 303
0.0994 --- 38.5 --- --- 182 --- 0.299 73.1 72.9 86.2 316 477 713 0.587 79.4 110 137 437 500 776 0.999 154 194 205 748 937 1460 1.984 261 314 410 1930 2430 3710 3.005 --- 528 ---- --- 4400 ---
Fast pseudo-first order regime can only be ensured for ratios between E∞ and Ha close
to 10. For this reason, the DeCoursey relation was applied and new values for ovk were
calculated by minimizing the sum of the square residues between the experimental
carbon dioxide absorption flow and the flow calculated by applying the DeCoursey
equation. These values are given in Table 2.11.

45
Table 2.11 - Experimental values of the overall kinetic constants of potassium glycinate
calculated using the DeCoursey equation - ( )-1sovk .
( )KT
( )MSC 293 298 303
0.0994 --- 881 --- 0.299 2860 2710 4360 0.587 3130 6420 11000 0.999 11500 19600 22000 1.984 24200 38600 69800 3.005 --- 93900 ---
The deviation of the enhancement factor determined experimentally and the one
calculated based on the DeCoursey equation is presented in Figure 2.4.
Figure 2.4 – Parity plot of experimental enhancement factor and the DeCoursey
approximation.
Since all the experiments were performed at very low loadings, the only ions
contributing to the ionic strength of the solutions are potassium cation and glycinate
anion, both monovalent species (2 1z = ) and thus SI C= . Combining equation (7) with
(8), the absorption rate of 2CO becomes:
( )2 22 expCO S S COr k C bC C− = (30)
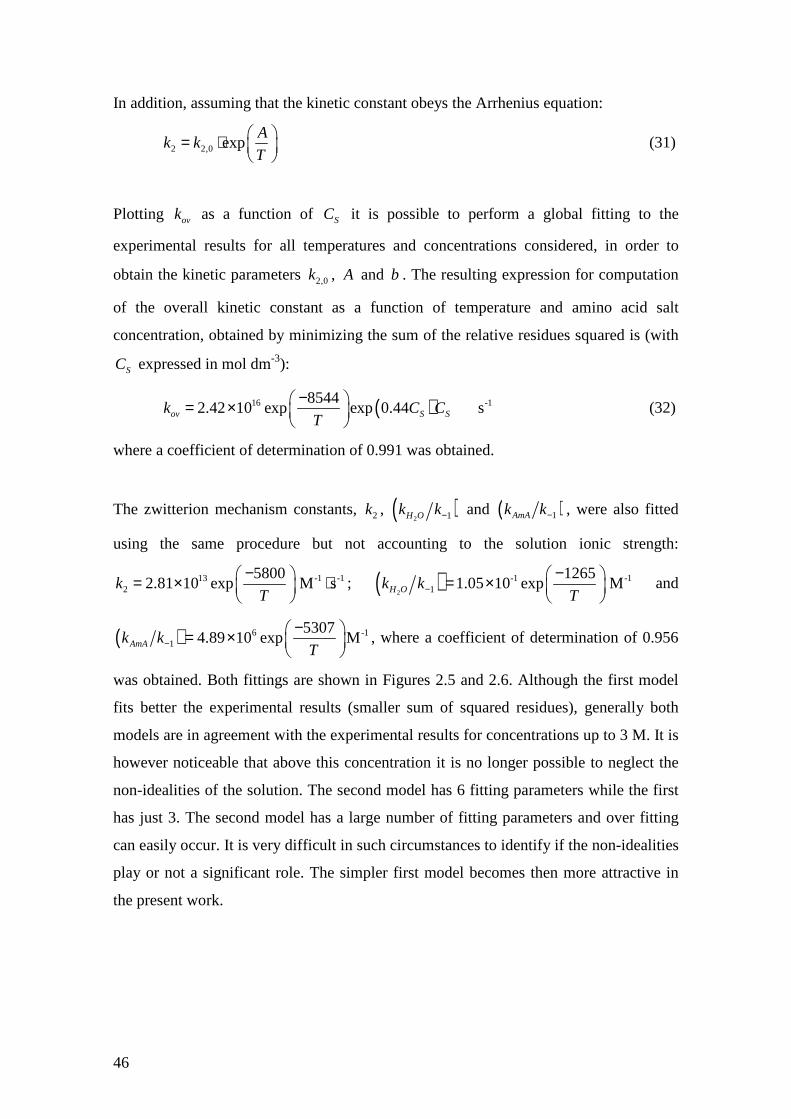
46
In addition, assuming that the kinetic constant obeys the Arrhenius equation:
2 2,0 expA
k kT = ⋅
(31)
Plotting ovk as a function of SC it is possible to perform a global fitting to the
experimental results for all temperatures and concentrations considered, in order to
obtain the kinetic parameters 2,0k , A and b . The resulting expression for computation
of the overall kinetic constant as a function of temperature and amino acid salt
concentration, obtained by minimizing the sum of the relative residues squared is (with
SC expressed in mol dm-3):
( )16 -185442.42 10 exp exp 0.44 sov S Sk C C
T
− = ×
(32)
where a coefficient of determination of 0.991 was obtained.
The zwitterion mechanism constants, 2k , ( )2 1H Ok k− and ( )1AmAk k− , were also fitted
using the same procedure but not accounting to the solution ionic strength:
13 -1 -12
58002.81 10 exp M sk
T
− = × ⋅
; ( )2
-1 -11
12651.05 10 exp MH Ok k
T−− = ×
and
( ) 6 -11
53074.89 10 exp MAmAk k
T−− = ×
, where a coefficient of determination of 0.956
was obtained. Both fittings are shown in Figures 2.5 and 2.6. Although the first model
fits better the experimental results (smaller sum of squared residues), generally both
models are in agreement with the experimental results for concentrations up to 3 M. It is
however noticeable that above this concentration it is no longer possible to neglect the
non-idealities of the solution. The second model has 6 fitting parameters while the first
has just 3. The second model has a large number of fitting parameters and over fitting
can easily occur. It is very difficult in such circumstances to identify if the non-idealities
play or not a significant role. The simpler first model becomes then more attractive in
the present work.

47
Figure 2.5 – Overall absorption kinetic constant as a function of potassium glycinate
concentration and for different temperatures: experimental values and model lines.
Solid lines correspond to the model that takes into account the ionic strength and dashed
lines to the zwitterion model.
Figure 2.6 - Apparent absorption kinetic constants as a function of potassium glycinate
concentration and at different temperatures: experimental values and model lines. Solid
lines correspond to the model that takes into account the ionic strength and dashed lines
to the zwitterion model.

48
The values of ovk obtained are in good agreement with the work of Kumar et al. (2003c)
for low concentrations but deviate for higher concentrations. This is possibly due to the
effect of the ionic strength not being taken into account in Kumar’s work. On the other
hand, the results of the present work are quite different from the ones by Lee et al.
(2007). Those authors mention apparent kinetic constants for carbon dioxide absorption
in aqueous sodium glycinate solutions about two orders of magnitude lower. However,
a careful analysis of that work shows that the kinetic measurements were performed far
from the fast pseudo-first order reaction regime, since in some cases E∞ was even lower
than Ha .
It is common to relate the kinetic constant of reaction, 2k , with the apK of the
aminoacid salt by means of a Brønsted plot. Penny and Ritter (1983) determined the
kinetic constant and the apK of several amino acids (including glycinate anion) and
alkanolamines. The values of 2k determined in the present work deviate less than 30%
(relative error) from the Brønsted plot based on the work from Penny and Ritter (1983)
in the entire temperature range. Figure 2.7 presents the Brønsted plot of Penny and
Ritter (1983) along with the results from this work.
Figure 2.7 - Brønsted plot of Penny and Ritter (1983) at 293, 298 and 303 K –
Comparison with the present work.

49
2.6. Conclusions
Density and viscosity of potassium glycinate aqueous solutions ranging from 0.1 and 3
M and at temperatures between 273 and 313 K were obtained. The diffusion coefficient
of 2N O in solution was estimated using a modified Stokes-Einstein relation and the
2CO diffusion coefficient in solution was estimated using the so called 2 2:N O CO
analogy (Gubbins et al., 1966).
The solubility of 2N O in the potassium glycinate solutions was experimentally
determined. The salting out effect of the salt concentration in the solubility showed to
be well described by the Sechenov equation. The specific parameter of the glycinate
anion, based on the Schumpe model (Schumpe, 1993), was calculated
( -30.0397 mol dmGly
h − = ) and the solubility of 2CO in solution was then estimated.
The rate of reaction of 2CO with potassium glycinate was determined in a stirred cell
reactor operating in semi-continuous mode. Two approaches were used to obtain the
relevant parameters of the model. Since the conditions for fast pseudo-first order
reaction regime were apparently not fulfilled, the DeCoursey equation was employed to
calculate the enhancement factor. The results indicate that the reaction kinetics
significantly depend on the ionic strength of the solution. The apparent rate of reaction
is in line with the Brønsted plot based on the work from Penny and Ritter (1983). The
obtained overall kinetic constants point out that potassium glycinate is a fast absorbent
when compared with other absorbents, namely with MEA, which shows an overall
kinetic constant at 298 K for a 1 M solution of 5920 -1s (Glasscock et al., 1991) against
the value of 13400 -1s obtained in the present work for potassium glycinate at the same
concentration and temperature conditions. In the future, these results will be applied in
the design and optimization of a membrane contactor to be used for carbon dioxide
removal from anesthetic gas streams.
2.7. Nomenclature
A Gas-liquid interfacial area, m2

50
C Concentration, M or -3mol m⋅
D Diffusion coefficient, 2 -1m s⋅
Sd Stirrer diameter, m
E Enhancement factor, dimensionless
E∞ Infinite enhancement factor, dimensionless
F Faraday constant, 96500 -1C mol⋅
Ha Hatta number, dimensionless
h Ion and gas specific constants in the Shumpe equation, 3 -1m mol⋅
H Henry coefficient, -3Pa mol m⋅ ⋅
I Ionic strength of the solution, -3mol dm⋅
2COJ Carbon dioxide absorption flux, -2 -1mol m s⋅ ⋅
K Sechenov constant, 3 -1dm mol⋅
1k− Zwitterion kinetic constant of the reverse reaction, s-1
2k Zwitterion kinetic constant of the reaction, M-1 ⋅s-1
AmAk Zwitterion deprotonation rate constant for amino acid, M-1 ⋅s-1
appk Apparent rate constant defined as: app ov Sk k C= , M-1 ⋅s-1
iBk Zwitterion mechanism deprotonation rate constant by base, M-1 ⋅s-1
2H Ok Zwitterion mechanism deprotonation rate constant for water, M-1 ⋅s-1
Lk Liquid phase physical mass transfer coefficient, -1m s⋅
OHk − Reaction rate constant with hydroxide ion M
-1 ⋅s-1
ovk Overall kinetic constant, s-1
N Stirrer speed, rps
2CON Carbon dioxide absorption flow, -1mol s⋅
in Valency number of the ions
2COP Carbon dioxide partial pressure, Pa
2COr− Rate of reaction, -3 -1mol m s⋅ ⋅
R Universal gas constant, 8.314 -1 -1J mol K⋅ ⋅
Re Reynolds number, dimensionless

51
Sh Sherwood number, dimensionless
Sc Schmidt number, dimensionless
T Temperature, K
V Volume, m3
x Molar fraction, -1mol mol⋅
,z z+ − Valencies of the cation and anion
Greek symbols
α Constant from the modified Stokes-Einstein equation
máxα Maximum loading achieved in one experiment, mol
CO2⋅ mol
S-1
Sν Stoichiometric coefficient
η Solution viscosity, -1 -1kg m s⋅ ⋅
ρ Solution density, -3kg m⋅ 0λ+ ,
0λ− Ionic conductances of the cation and anion at infinite dilution, cm2 ⋅ Ω−1
Subscripts
2CO Carbon dioxide
eff Effective (after correcting for the ionic strength)
eq Equilibrium
final Final
g Gas phase
Gly− Glycinate anion
gv Gas vessel
K + Potassium cation
init Initial
L Liquid phase
MEA Monoethanolamine
2N O Nitrous oxide
S Amino acid salt
sc Stirred cell
w Water

52
2.8. References
Al-Juaied, M. and Rochelle, G. T. (2006). "Absorption of CO2 in aqueous
diglycolamine." Industrial & Engineering Chemistry Research, 45(8), 2473-2482.
Blauwhoff, P. M. M., Versteeg, G. F., et al. (1984). "A Study on the Reaction between
CO2 and Alkanolamines in Aqueous-Solutions." Chemical Engineering Science, 39(2),
207-225.
Brilman, D. W. F., Van Swaaij, W. P. M., et al. (2001). "Diffusion coefficient and
solubility of isobutene and trans-2-butene in aqueous sulfuric acid solutions." Journal of
Chemical and Engineering Data, 46(5), 1130-1135.
Caplow, M. (1968). "Kinetics of carbamate formation and breakdown." Journal of the
American Chemical Society, 90(24), 6795-6803.
Cullinane, J. T. and Rochelle, G. T. (2006). "Kinetics of carbon dioxide absorption into
aqueous potassium carbonate and piperazine." Industrial & Engineering Chemistry
Research, 45(8), 2531-2545.
Danckwerts, P. (1970). "Gas-Liquid Reactions", McGraw-Hill Book Company.
Decoursey W. J. (1974). "Absorption with Chemical-Reaction - Development of a New
Relation for Danckwerts Model." Chemical Engineering Science, 29(9), 1867-1872.
Derks, P., Hogendoorn, K., et al. (2005). "Solubility of N2O in and density, viscosity,
and surface tension of aqueous piperazine solutions." Journal of Chemical and
Engineering Data, 50(6), 1947-1950.
Derks, P. W. J., Kleingeld, T., et al. (2006). "Kinetics of absorption of carbon dioxide in
aqueous piperazine solutions." Chemical Engineering Science, 61(20), 6837-6854.
Fell, C. J. D. and Hutchiso, H. P. (1971). "Diffusion Coefficients for Sodium and
Potassium Chlorides in Water at Elevated Temperatures." Journal of Chemical and
Engineering Data, 16(4), 427-429.

53
Feron, P. and Jansen, A. (2002). "CO2 separation with polyolefin membrane contactors
and dedicated absorption liquids: performances and prospects." Separation and
Purification Technology, 27(3), 231-242.
Glasscock, D. A., Critchfield, J. E., et al. (1991). "CO2 Absorption desorption in
mixtures of methyldiethanolamine with monoethanolamine or diethanolamine."
Chemical Engineering Science, 46(11), 2829-2845.
Goff, G. S. and Rochelle, G. T. (2006). "Oxidation inhibitors for copper and iron
catalyzed degradation of monoethanolamine in CO2 capture processes." Industrial &
Engineering Chemistry Research, 45(8), 2513-2521.
Gubbins, K. E., Bhatia, K. K., et al. (1966). "Diffusion of Gases in Electrolytic
Solutions." American Institute of Chemical Engineers Journal, 12(3), 548-552.
Haubrock, J., Hogendoorn, J. A., et al. (2005). "The applicability of activities in kinetic
expressions: a more fundamental approach to represent the kinetics of the system CO2-
OH- in terms of activities." International Journal of Chemical Reactor Engineering 3.
Higbie, R. (1935). "The rate of absorption of a pure gas into a still liquid during a short
time of exposure." Transactions of the American Institute of Chemical Engineers, 31,
365–389.
Holst, J., Politiek, P., et al. (2006). "CO2 capture from flue gas using amino acid salt
solutions" GHGT-8 Proceedings.
Joosten, G. E. H. and Danckwerts, P. V. (1972). "Solubility and diffusivity of nitrous-
oxide in equimolar potassium carbonate - potassium bicarbonate solutions at 25 ºC and
1 atm." Journal of Chemical and Engineering Data, 17(4), 452-454.
Kumar, P., Hogendoorn, J., et al. (2001). "Density, viscosity, solubility, and diffusivity
of N2O in aqueous amino acid salt solutions." Journal of Chemical and Engineering
Data, 46(6), 1357-1361.
Kumar, P., Hogendoorn, J., et al. (2002). "New absorption liquids for the removal of
CO2 from dilute gas streams using membrane contactors." Chemical Engineering
Science, 57(9), 1639-1651.
54
Kumar, P., Hogendoorn, J., et al. (2003a). "Equilibrium solubility of CO2 in aqueous
potassium taurate solutions: Part 1. Crystallization in carbon dioxide loaded aqueous
salt solutions of amino acids." Industrial & Engineering Chemistry Research, 42(12),
2832-2840.
Kumar, P., Hogendoorn, J., et al. (2003b). "Equilibrium solubility of CO2 in aqueous
potassium taurate solutions: Part 2. Experimental VLE data and model." Industrial &
Engineering Chemistry Research, 42(12), 2841-2852.
Kumar, P., Hogendoorn, J., et al. (2003c). "Kinetics of the reaction of CO2 with aqueous
potassium salt of taurine and glycine." American Institute of Chemical Engineers
Journal, 49(1), 203-213.
Laddha, S. S., Diaz, J. M., et al. (1981). "The N2O Analogy - the Solubilities of CO2 and
N2O in Aqueous-Solutions of Organic-Compounds." Chemical Engineering Science,
36(1), 228-229.
Lee, S., Choi, S., et al. (2005). "Physical properties of aqueous sodium glycinate
solution as an absorbent for carbon dioxide removal." Journal of Chemical and
Engineering Data, 50(5), 1773-1776.
Lee, S., Song, H. J., et al. (2007). "Kinetics of CO2 absorption in aqueous sodium
glycinate solutions." Industrial & Engineering Chemistry Research, 46(5), 1578-1583.
Lee, S., Song, H. J., et al. (2006). "Physical solubility and diffusivity of N2O and CO2 in
aqueous sodium glycinate solutions." Journal of Chemical and Engineering Data, 51(2),
504-509.
Mendes, A. M. M. (2000). "Development of an adsorption/membrane based system for
carbon dioxide, nitrogen and spur gases removal from a nitrous oxide and xenon
anaesthetic closed loop." Acp-Applied Cardiopulmonary Pathophysiology, 9(2), 156-
163.
Miyamoto, S. and Schmidt, C. L. A. (1933). "Transference and conductivity studies on
solutions of certain proteins and amino acids with special reference to the formation of
complex ions between the alkaline earth elements and certain proteins." Journal of
Biological Chemistry, 99(2), 335.

55
Penny, D. E. and Ritter, T. J. (1983). "Kinetic-Study of the Reaction between Carbon-
Dioxide and Primary Amines." Journal of the Chemical Society-Faraday Transactions I,
79, 2103-2109.
Poling, B. E., Prausnitz, J. M., et al. (2001). "The Properties of Gases and Liquids".
McGraw-Hill Book Company
Schumpe, A. (1993). "The Estimation of Gas Solubilities in Salt-Solutions." Chemical
Engineering Science, 48(1), 153-158.
Song, H. J., Lee, S., et al. (2006). "Solubilities of carbon dioxide in aqueous solutions of
sodium glycinate." Fluid Phase Equilibria, 246(1-2), 1-5.
Supap, T., Idem, R., et al. (2006). "Analysis of monoethanolamine and its oxidative
degradation products during CO2 absorption from flue gases: A comparative study of
GC-MS, HPLC-RID, and CE-DAD analytical techniques and possible optimum
combinations." Industrial & Engineering Chemistry Research, 45(8), 2437-2451.
Van Swaaij, W. P. M. and Versteeg, G. F. (1992). "Mass-Transfer Accompanied with
Complex Reversible Chemical-Reactions in Gas-Liquid Systems - an Overview."
Chemical Engineering Science, 47(13-14), 3181-3195.
Versteeg, G. F., Blauwhoff, P. M. M., et al. (1987). "The Effect of Diffusivity on Gas-
Liquid Mass-Transfer in Stirred Vessels - Experiments at Atmospheric and Elevated
Pressures." Chemical Engineering Science, 42(5), 1103-1119.
Versteeg, G. F. and Van Swaaij, W. P. M. (1988). "Solubility and Diffusivity of Acid
Gases (CO2, N2O) in Aqueous Alkanolamine Solutions." Journal of Chemical and
Engineering Data, 33(1), 29-34.
Weisenberger, S. and Schumpe, A. (1996). "Estimation of gas solubilities in salt
solutions at temperatures from 273 K to 363 K." American Institute of Chemical
Engineers Journal, 42(1), 298-300.
Whalen, F. X., Bacon, D. R., et al. (2005). "Inhaled anesthetics: an historical overview."
Best Practice Research Clinical Anaesthesiology, 19(3), 323-330.

56
2.A. Experimental kinetic data
Values of the carbon dioxide flux, 2COJ , as a function of the carbon dioxide partial
pressure for all temperatures and potassium glycinate concentrations studied are
presented in Tables 2.A1-2.A14.
All the experiments began with fresh solution. The maximum loading reached at the end
of each experiment, máxα , is also shown.
The values used to calculate ovk considering pseudo first order reaction regime and
using the DeCoursey approach are marked respectively with PFO and DeCo. Since at high
carbon dioxide partial pressures, the overall kinetic constant plays a minor role on the
enhancement factor and the values of 2COD and SD are estimated, only experiments at
low partial pressures were used to calculate ovk even when the DeCoursey approach
was used.

57
Table 2.A1 – Kinetic data of the reaction of 2CO with potassium glycinate at 0.0994 M and 298 K.
( )2
210
Pa
COP −× ( )
2
4
-1 -2
10
mol s m
COJ ×
⋅ ⋅ ( )
2
-1CO AmAmol mol
máxα
⋅
( )2
210
Pa
COP −× ( )
2
4
-1 -2
10
mol s m
COJ ×
⋅ ⋅ ( )
2
-1CO AmAmol mol
máxα
⋅
3.42 PFO/DeCo 1.34 0.010 16.50 DeCo 4.78 0.037 5.05 PFO/DeCo 2.05 0.015 21.65 DeCo 5.31 0.042 6.43 PFO/DeCo 2.40 0.017 31.54 DeCo 6.52 0.054 11.44 DeCo 3.94 0.029 52.11 DeCo 7.65 0.068
Table 2.A2 - Kinetic data of the reaction of 2CO with potassium glycinate at 0.299 M and 293 K
( )2
210
Pa
COP −×
( )2
4
-1 -2
10
mol s m
COJ ×
⋅ ⋅ ( )
2
-1CO AmAmol mol
máxα
⋅
( )2
210
Pa
COP −×
( )2
4
-1 -2
10
mol s m
COJ ×
⋅ ⋅ ( )
2
-1CO AmAmol mol
máxα
⋅
4.71 PFO/DeCo 3.36 0.008 12.57 DeCo 8.35 0.019 5.66 PFO/DeCo 4.27 0.010 14.60 DeCo 8.49 0.020 6.27 PFO/DeCo 4.57 0.011 19.84 10.0 0.023 6.76 PFO/DeCo 4.92 0.012 24.81 12.4 0.019 7.28 PFO/DeCo 5.58 0.013 34.73 15.2 0.023 8.28 PFO/DeCo 5.34 0.013 40.05 16.2 0.038 8.85 PFO/DeCo 5.48 0.013 44.87 16.1 0.039 9.84 PFO/DeCo 6.38 0.015 54.97 16.8 0.023
57

58
Table 2.A3 - Kinetic data of the reaction of 2CO with potassium glycinate at 0.299 M and 298 K
( )2
210
Pa
COP −× ( )
2
4
-1 -2
10
mol s m
COJ ×
⋅ ⋅ ( )
2
-1CO AmAmol mol
máxα
⋅
( )2
210
Pa
COP −× ( )
2
4
-1 -2
10
mol s m
COJ ×
⋅ ⋅ ( )
2
-1CO AmAmol mol
máxα
⋅
2.71 PFO/DeCo 1.78 0.004 9.76 DeCo 5.80 0.013 3.52 PFO/DeCo 2.50 0.002 9.82 DeCo 6.27 0.015 4.77 PFO/DeCo 3.09 0.007 10.56 DeCo 6.44 0.015 5.89 PFO/DeCo 4.14 0.010 11.66 DeCo 6.79 0.016 6.71 PFO/DeCo 4.33 0.010 16.71 9.02 0.021 7.18 PFO/DeCo 4.99 0.012 26.66 13.3 0.031 7.74 PFO/DeCo 5.16 0.012 41.96 16.3 0.040
8.82 DeCo 5.55 0.013
Table 2.A4 - Kinetic data of the reaction of 2CO with potassium glycinate at 0.299 M and 303 K
( )2
210
Pa
COP −×
( )2
4
-1 -2
10
mol s m
COJ ×
⋅ ⋅ ( )
2
-1CO AmAmol mol
máxα
⋅
( )2
210
Pa
COP −×
( )2
4
-1 -2
10
mol s m
COJ ×
⋅ ⋅ ( )
2
-1CO AmAmol mol
máxα
⋅
2.10 PFO/DeCo 1.64 0.004 11.34 DeCo 8.62 0.021 3.94 PFO/DeCo 3.12 0.007 16.37 11.6 0.027 5.22 PFO/DeCo 4.36 0.010 31.74 17.3 0.040 6.00 PFO/DeCo 4.66 0.010 56.62 21.2 0.051
8.17 DeCo 6.62 0.015
58

59
Table 2.A5 - Kinetic data of the reaction of 2CO with potassium glycinate at 0.587 M and 293 K
( )2
210
Pa
COP −×
( )2
4
-1 -2
10
mol s m
COJ ×
⋅ ⋅ ( )
2
-1CO AmAmol mol
máxα
⋅
( )2
210
Pa
COP −×
( )2
4
-1 -2
10
mol s m
COJ ×
⋅ ⋅ ( )
2
-1CO AmAmol mol
máxα
⋅
2.16 PFO/DeCo 1.54 0.002 12.19 PFO/DeCo 8.11 0.010 2.22 PFO/DeCo 1.50 0.002 15.00 PFO/DeCo 9.67 0.007 4.43 PFO/DeCo 3.43 0.004 15.00 PFO/DeCo 9.73 0.008 4.46 PFO/DeCo 3.29 0.004 23.75 13.5 0.013 7.62 PFO/DeCo 5.28 0.006 24.79 13.5 0.011 9.47 PFO/DeCo 6.26 0.006 24.85 13.5 0.013 9.51 PFO/DeCo 6.38 0.009 35.42 19.4 0.015 10.12 PFO/DeCo 6.62 0.009 45.50 22.7 0.018 12.06 PFO/DeCo 8.10 0.010 62.55 26.7 0.020
Table 2.A6 - Kinetic data of the reaction of 2CO with potassium glycinate at 0.587 M and 298 K
( )2
210
Pa
COP −×
( )2
4
-1 -2
10
mol s m
COJ ×
⋅ ⋅ ( )
2
-1CO AmAmol mol
maxα
⋅
( )2
210
Pa
COP −×
( )2
4
-1 -2
10
mol s m
COJ ×
⋅ ⋅ ( )
2
-1CO AmAmol mol
maxα
⋅
5.08 PFO/DeCo 5.01 0.003 20.57 17.4 0.011 5.22 PFO/DeCo 4.49 0.005 20.75 17.8 0.010 7.91 PFO/DeCo 7.26 0.008 30.88 22.2 0.016 7.94 PFO/DeCo 7.32 0.008 41.00 28.2 0.016 10.48 PFO/DeCo 9.47 0.007 41.11 26.2 0.017 10.51 PFO/DeCo 9.50 0.006 49.65 31.3 0.018 15.54 PFO/DeCo 13.9 0.008 67.11 33.7 0.034 15.55 PFO/DeCo 14.7 0.008 67.20 31.7 0.022
20.41 15.9 0.009 68.41 37.4 0.026 20.53 16.4 0.010 68.44 35.0 0.021
59

60
Table 2.A7 - Kinetic data of the reaction of 2CO with potassium glycinate at 0.587 M and 303 K
( )2
210
Pa
COP −×
( )2
4
-1 -2
10
mol s m
COJ ×
⋅ ⋅ ( )
2
-1CO AmAmol mol
maxα
⋅
( )2
210
Pa
COP −×
( )2
4
-1 -2
10
mol s m
COJ ×
⋅ ⋅ ( )
2
-1CO AmAmol mol
maxα
⋅
2.50 PFO/DeCo 3.06 0.003 11.61 PFO/DeCo 12.8 0.014 4.58 PFO/DeCo 5.35 0.006 16.95 16.5 0.021 6.60 PFO/DeCo 7.52 0.008 31.56 26.0 0.025 8.52 PFO/DeCo 10.0 0.011 56.87 36.7 0.022
Table 2.A8 - Kinetic data of the reaction of 2CO with potassium glycinate at 0.999 M and 293 K
( )2
210
Pa
COP −×
( )2
4
-1 -2
10
mol s m
COJ ×
⋅ ⋅ ( )
2
-1CO AmAmol mol
maxα
⋅
( )2
210
Pa
COP −×
( )2
4
-1 -2
10
mol s m
COJ ×
⋅ ⋅ ( )
2
-1CO AmAmol mol
maxα
⋅
5.42 PFO/DeCo 6.26 0.004 15.46 PFO/DeCo 17.4 0.012 7.06 PFO/DeCo 8.82 0.006 16.54 PFO/DeCo 19.0 0.013 10.37 PFO/DeCo 11.3 0.008 20.42 18.8 0.012 10.43 PFO/DeCo 11.0 0.007 20.48 18.9 0.011 12.27 PFO/DeCo 13.9 0.009 25.59 25.6 0.017 13.61 PFO/DeCo 13.8 0.010 35.30 32.3 0.018 13.86 PFO/DeCo 16.3 0.010 45.53 37.7 0.017 15.23 PFO/DeCo 17.2 0.011 55.70 42.1 0.017 15.42 PFO/DeCo 15.8 0.010
60
60

61
Table 2.A9 - Kinetic data of the reaction of 2CO with potassium glycinate at 0.999 M and 298 K
( )2
210
Pa
COP −×
( )2
4
-1 -2
10
mol s m
COJ ×
⋅ ⋅ ( )
2
-1CO AmAmol mol
maxα
⋅
( )2
210
Pa
COP −×
( )2
4
-1 -2
10
mol s m
COJ ×
⋅ ⋅ ( )
2
-1CO AmAmol mol
maxα
⋅
2.53 PFO/DeCo 3.95 0.002 15.64 PFO/DeCo 20.6 0.013 7.74 PFO/DeCo 10.5 0.006 17.59 22.5 0.015 9.15 PFO/DeCo 12.7 0.009 17.62 23.2 0.010 9.33 PFO/DeCo 12.8 0.008 22.64 25.2 0.013 10.62 PFO/DeCo 15.2 0.010 27.52 28.0 0.017 11.08 PFO/DeCo 15.2 0.010 32.98 32.7 0.017 12.68 PFO/DeCo 17.6 0.011 55.02 43.4 0.016 13.78 PFO/DeCo 18.1 0.011 67.09 48.8 0.015 15.26 PFO/DeCo 20.9 0.014
Table 2.A10 - Kinetic data of the reaction of 2CO with potassium glycinate at 0.999 M and 303 K.
( )2
210
Pa
COP −× ( )
2
4
-1 -2
10
mol s m
COJ ×
⋅ ⋅ ( )
2
-1CO AmAmol mol
maxα
⋅
( )2
210
Pa
COP −× ( )
2
4
-1 -2
10
mol s m
COJ ×
⋅ ⋅ ( )
2
-1CO AmAmol mol
maxα
⋅
3.42 PFO/DeCo 4.99 0.003 10.54 PFO/DeCo 15.5 0.010 5.23 PFO/DeCo 7.68 0.005 11.59 PFO/DeCo 16.9 0.011 6.94 PFO/DeCo 10.0 0.007 17.70 24.7 0.016 8.59 PFO/DeCo 11.9 0.007 27.91 34.7 0.016 9.23 PFO/DeCo 13.4 0.009 57.65 54.7 0.020
61

62
Table 2.A11 - Kinetic data of the reaction of 2CO with potassium glycinate at 1.984 M and 293 K.
( )2
210
Pa
COP −×
( )2
4
-1 -2
10
mol s m
COJ ×
⋅ ⋅ ( )
2
-1CO AmAmol mol
maxα
⋅
( )2
210
Pa
COP −×
( )2
4
-1 -2
10
mol s m
COJ ×
⋅ ⋅ ( )
2
-1CO AmAmol mol
maxα
⋅
2.77 PFO/DeCo 3.35 0.001 15.16 PFO/DeCo 19.6 0.006 4.76 PFO/DeCo 6.11 0.002 15.51 PFO/DeCo 18.6 0.006 6.74 PFO/DeCo 8.33 0.003 16.07 PFO/DeCo 18.4 0.006 7.71 PFO/DeCo 9.33 0.003 16.47 PFO/DeCo 21.2 0.006 8.31 PFO/DeCo 9.23 0.004 21.75 20.4 0.007 8.61 PFO/DeCo 11.6 0.004 21.78 19.8 0.007 8.74 PFO/DeCo 9.67 0.003 24.81 24.2 0.008 10.49 PFO/DeCo 13.9 0.004 25.00 24.1 0.008 10.78 PFO/DeCo 12.4 0.004 26.84 27.4 0.009 10.81 PFO/DeCo 12.1 0.004 36.88 35.0 0.009 12.56 PFO/DeCo 15.7 0.005 47.01 40.2 0.007 13.07 PFO/DeCo 18.2 0.006 57.00 47.9 0.008 13.26 PFO/DeCo 13.9 0.005 77.29 55.9 0.010
62

63
Table 2.A12 - Kinetic data of the reaction of 2CO with potassium glycinate at 1.984 M and 298 K.
( )2
210
Pa
COP −×
( )2
4
-1 -2
10
mol s m
COJ ×
⋅ ⋅ ( )
2
-1CO AmAmol mol
maxα
⋅
( )2
210
Pa
COP −×
( )2
4
-1 -2
10
mol s m
COJ ×
⋅ ⋅ ( )
2
-1CO AmAmol mol
maxα
⋅
3.34 PFO/DeCo 5.12 0.001 13.53 PFO/DeCo 21.9 0.006 5.20 PFO/DeCo 7.51 0.002 14.33 PFO/DeCo 21.5 0.007 5.28 PFO/DeCo 7.01 0.002 15.36 PFO/DeCo 22.9 0.007 8.37 PFO/DeCo 13.3 0.004 17.34 27.3 0.007 9.31 PFO/DeCo 15.5 0.005 17.50 29.4 0.008 10.06 PFO/DeCo 13.8 0.005 19.42 29.4 0.008 10.24 PFO/DeCo 14.4 0.003 19.47 28.0 0.009 11.09 PFO/DeCo 16.6 0.005 21.52 26.8 0.008 11.30 PFO/DeCo 15.8 0.005 24.52 30.3 0.007 11.32 PFO/DeCo 15.3 0.005 29.47 33.9 0.007 12.52 PFO/DeCo 17.1 0.005 49.46 52.5 0.008 12.54 PFO/DeCo 18.5 0.005 69.86 66.3 0.007 13.42 PFO/DeCo 19.6 0.006
Table 2.A13 - Kinetic data of the reaction of 2CO with potassium glycinate at 1.984 M and 303 K.
( )2
210
Pa
COP −×
( )2
4
-1 -2
10
mol s m
COJ ×
⋅ ⋅ ( )
2
-1CO AmAmol mol
maxα
⋅
( )2
210
Pa
COP −×
( )2
4
-1 -2
10
mol s m
COJ ×
⋅ ⋅ ( )
2
-1CO AmAmol mol
maxα
⋅
5.44 PFO/DeCo 10.6 0.003 11.52 PFO/DeCo 21.9 0.007 7.44 PFO/DeCo 14.8 0.005 14.34 DeCo 23.8 0.008 9.51 PFO/DeCo 19.1 0.006
63

64
Table 2.A14 - Kinetic data of the reaction of 2CO with potassium glycinate at 3.005 M and 298 K.
( )2
210
Pa
COP −×
( )2
4
-1 -2
10
mol s m
COJ ×
⋅ ⋅ ( )
2
-1CO AmAmol mol
maxα
⋅
( )2
210
Pa
COP −×
( )2
4
-1 -2
10
mol s m
COJ ×
⋅ ⋅ ( )
2
-1CO AmAmol mol
maxα
⋅
3.43 PFO/DeCo 5.45 0.001 21.61 35.6 0.007 6.37 PFO/DeCo 11.4 0.003 26.49 38.4 0.008 11.44 PFO/DeCo 19.0 0.004 31.32 44.1 0.006 16.46 PFO/DeCo 26.7 0.005 51.45 60.3 0.005
64

65
3. Carbon dioxide absorption kinetics in
potassium threonate 1
Abstract
The absorption of carbon dioxide in potassium threonate aqueous solutions is studied at
concentrations ranging from 0.1 to 3 M and temperatures from 293 to 313 K. This study
includes experimental density, viscosity, solubility of 2N O and absorption kinetics of
2CO (using a stirred cell reactor) data obtained for the various potassium threonate
solutions. The diffusion coefficients of 2CO and potassium threonate in the absorption
solutions are estimated using a modified Stokes-Einstein relation. 2N O solubility is
interpreted using the Schumpe (1993) model and 2CO physical solubility estimated.
Physical absorption experiments were performed in the stirred cell in order to determine
the physical mass transfer coefficients. The kinetics results are interpreted using both
the pseudo-first order and the DeCoursey approaches. It was concluded that 2CO
absorption in the aqueous potassium threonate solutions is well represented by
( )2 2
8 35804.13 10 exp exp 0.90CO S S COr C C C
T
− − = ×
.
1 Portugal, A. F.; Magalhães, F. D.; Mendes, A., “Carbon dioxide absorption kinetics in potassium threonate”, Chem. Eng. Sci, 2008, 63(13), 3493-3503

66
3.1. Introduction
The constant emissions of CO2 (due to the burning of fossil fuels, coal and natural gas)
have originated the rise of atmospheric concentrations to such values that the earth’s
natural absorption processes have become inefficient (Hampe and Rudkevich, 2003).
For this reason, several technologies for the capture of 2CO are being continuously
developed, especially in the last years, as a consequence of the stringent environmental
regulations stated on the Kyoto protocol (Granite and O'Brien, 2005; Idem and
Tontiwachwuthikul, 2006; Yan et al., 2007). Among these, the absorption of 2CO in
alkanolamines is, at present, the most widely used technology in the chemical industry
(Holst et al., 2006; Idem and Tontiwachwuthikul, 2006). However, alkanolamines easily
degrade, especially in oxygenated environments, making necessary the development of
new absorbents for gas mixtures with significant oxygen concentrations, namely for flue
gas, life support systems and anesthetic gas circuits (Goff and Rochelle, 2006; Holst et
al., 2006; Hook, 1997; Mendes, 2000; Portugal et al., 2007; Supap et al., 2006).
Amino acids (or, more precisely, alkali salts of amino acids) have the same functional
group as alkanolamines (presenting therefore similar capacities and reaction rates with
2CO ) and are much more stable in the presence of oxygen (Holst et al., 2006; Kumar et
al., 2003c). Besides, due to the ionic nature of the solutions, they present lower
volatilities and higher surface tensions (Kumar et al., 2002). Nevertheless, precipitation
of the reaction products was observed during the absorption of 2CO in several
absorbent solutions based on amino acids (Hook, 1997; Kumar et al., 2003a).
Commercially, amino acids are being used mainly as promoters of the absorption of
carbon dioxide in carbonate-bicarbonate solutions (Jeffreys and Bull, 1964; Kohl and
Nielsen, 1997). Companies including Giammarco Vetrocoke, BASF, TNO and Exxon
use amino acids in their 2CO removal absorption liquids (Feron and Jansen, 2002;
Kumar et al., 2003c). Although the use of amino acids is becoming an attractive option,
data about the absorption of 2CO in their solutions is still scarce. The present work aims
to contribute for the characterization and understanding of amino acid salt solutions
(namely, aqueous solutions of potassium threonate) as 2CO absorbents.

67
The general ability of an amine based compound to absorb 2CO is related to its
molecular structure (Caplow, 1968; Hook, 1997; Penny and Ritter, 1983; Sartori and
Savage, 1983; Singh et al., 2007). Potassium threonate, shown in Figure 3.1, is a
relatively small amino acid salt, which makes it expectable to present better absorption
equilibrium and kinetics than bigger molecules (Singh et al., 2007); it is a primary
amine containing both potassium carboxylate and alcohol groups in its structure. It is
sterically hindered, but the α carbon (carbon adjacent to the amine group) is only
mono-substituted. It is expected to have the properties of the sterically hindered amines
(high capacity and relatively easy regeneration) (Hook, 1997; Sartori and Savage, 1983)
and simultaneously, since it is a primary amine and the α carbon is only mono-
substituted, it is likely to absorb 2CO at a reasonable rate, without precipitation at low
loadings (Hook, 1997). It is also expected to combine the properties conferred by the
potassium carboxylate group - good oxidation stability, low volatility and high surface
tension – with the good regeneration properties conferred by the alcohol group (Hook,
1997). For these reasons along with the fact of not being harmful for the health, it was
selected for being characterized for carbon dioxide absorption.
Figure 3.1 - Chemical structure of potassium threonate.
3.2. Reaction Mechanism
Generally it is accepted that the absorption of 2CO in amine based compounds with a
primary or secondary amine group occurs according to the so-called zwitterion
mechanism (Caplow, 1968; Derks et al., 2006; Kumar et al., 2003c; Portugal et al.,
2007), being the overall reaction rate, 2COr− , given by:

68
2 2
2
11i i
CO S CO
B Bi
kr C C
k
k C−
− =+∑
(1)
where 2k , 1k− and iBk are the zwitterion mechanism kinetic constants, SC is the
concentration of the amino acid salt, 2COC is the concentration of carbon dioxide in the
liquid and iBC are the concentrations of the bases that can deprotonate the zwitterion -
2H O , OH − and the amine itself ( R1R
2NH ) (Blauwhoff et al., 1984). However, since
potassium threonate is a weak base - p 9.100AK = at 25 ºC (Perrin, 1965) - the
contribution of OH − to the deprotonation of the zwitterion can be neglected (Kumar et
al., 2003c) as well as the parallel reaction of 2CO with OH − to form bicarbonate.
Additionally, in primary amines such as monoethanolamine (MEA) and potassium
glycinate usually the deprotonation of the zwitterion is relatively fast when compared to
the rate of the reverse reaction (Derks et al., 2006; Kumar et al., 2003c; Portugal et al.,
2007) and therefore, equation (1) is simplified to a second order reaction kinetics:
2 22CO S COr k C C− = (2)
To be thermodynamically consistent, the 2CO absorption rate should be expressed in
terms of activities rather than concentrations (Haubrock et al., 2007). However, for the
purposes of the present work – to describe the absorption in a single absorption system
– it is enough to account for the solution non-idealities by means of the semi-empirical
equation (8) (Cullinane and Rochelle, 2006):
( )expeffk k bI= (3)
where effk is the effective kinetic constant, corrected by the ionic strength of the
solution, b is a constant and I is the ionic strength given by 21
2 i iI C z= ∑ , where iC
and iz are respectively the molar concentration and the charge of ion i in solution.

69
3.3. Mass Transfer
The absorption of CO2 into lean potassium threonate solutions can be described by the
following equation (Danckwerts, 1970):
2
2
2
COCO L
CO
PN E k A
H= (4)
where 2CON is the molar flow of CO2 crossing the liquid surface with interfacial area
A , Lk is the physical mass transfer coefficient, 2COP is the CO2 partial pressure and
2COH is the Henry constant of CO2 in solution. The enhancement factor, E , is the ratio
between the amount of gas absorbed in the reactive liquid and the amount that would be
absorbed if no reaction took place. The enhancement factor is a function of the Hatta
number, Ha , and the infinite enhancement factor, E∞ (Danckwerts, 1970; Derks et al.,
2006). The dimensionless Hatta number is defined as:
2ov CO
L
k DHa
k= (5)
where ovk is the overall reaction kinetic constant (2 2ov CO COk r C= − ) and
2COD is the
diffusion coefficient of CO2 in solution. According to the penetration theory (Higbie,
1935), the infinite enhancement factor can be estimated by the following equation:
2
2 2
2
310CO S S
COS COS
CO
D C DE
PD D
Hν
∞×= + (6)
where SD is the amino acid salt diffusion coefficient and Sν is the stoichiometric
coefficient. Factor 103 is there to convert -3mol dm⋅ (M) into -3mol m⋅ .
If Ha is sufficiently lower than E∞ , fast pseudo-first order (PFO) reaction regime can
be assumed (Danckwerts, 1970; Derks et al., 2006; Portugal et al., 2007):
3 0.1Ha E∞< <∼ (7)
In this case, diffusion and reaction occur in parallel in the liquid film. The enhancement
factor can be considered equal to the Hatta number and the gas absorption rate becomes,
therefore, independent of the physical mass transfer coefficient.

70
If E Ha∞ << , instantaneous reaction regime can be considered and E E∞= . In this
situation, the enhancement to the mass transfer is determined by the diffusion of the
reactants and do not depend on the reaction kinetic constant.
Between the limiting situations of fast pseudo-first order and instantaneous reaction
regime, there is the intermediate regime. According to DeCoursey, the enhancement
factor in the intermediate regime can be approximated as a function of the Hatta number
and the infinite enhancement factor (DeCoursey, 1974; Van Swaaij and Versteeg,
1992):
( ) ( )22 4
2 12 1 14 1
E HaHa HaE
E EE∞
∞ ∞∞
= − + + +− −−
(8)
3.4. Physical Properties
Since CO2 reacts with potassium threonate, its physical solubility and diffusivity in
solution need to be measured indirectly using a non-reactive gas with similar properties,
usually 2N O (Joosten and Danckwerts, 1972; Laddha et al., 1981).
Amino acid salt solutions are ionic in nature. For this reason, a “salting out” effect
needs to be taken into account when interpreting the solubility data of gases in these
solutions. At moderately high salt concentrations, this effect can be accounted for using
the Sechenov relation:
log Sw
HK C
H
= ⋅
(9)
where H and wH are respectively the Henry constants of the gas in the amino acid salt
solution and in water and K is the Sechenov constant, which can be calculated by
equation (12) (Schumpe, 1993; Weisenberger and Schumpe, 1996):
( )i G iK h h n= +∑ (10)
where ih and Gh are the ion and gas specific parameters and in is the valency number
of the ion.
It is generally accepted that the diffusion coefficient of a diffusant in solution can be
related to the solution viscosity, η , through modified Stokes-Einstein equation (Brilman

71
et al., 2001; Joosten and Danckwerts, 1972; Kumar et al., 2001; Versteeg and Van
Swaaij, 1988):
constantD αη = (11)
where α is a constant that depends on the pair diffusant/solvent.
It can be considered α = 0.8 to estimate the diffusion coefficient of 2N O in the
aqueous solutions of potassium threonate (Versteeg and Van Swaaij, 1988; Joosten and
Danckwerts, 1972; Brilman et al., 2001) and 0.6α = to estimate the diffusion
coefficient of the amino acid salt in solutions (Versteeg and Van Swaaij, 1988; Snijder
et al., 1993).
Gubbins et al. (1966) found that the ratio of the diffusivity of a gas in an electrolyte
solution to the diffusivity of the same gas in water does not vary significantly with the
nature of the diffusant. Therefore, it is reasonable to use the so-called 2N O analogy to
estimate the diffusion coefficient of 2CO in solutions.
2 2
2 2, ,
N O CO
N O w CO w
D D
D D= (12)
To estimate the diffusion coefficient of the salt at infinite dilution, 0SD , the Nernst
equation for the diffusion in electrolyte solutions can be applied (Poling et al., 2001):
( ) ( )( ) ( )
0
2 0 0
1 1
1 1S
RT z zD
F λ λ+ −
+ −
+ = +
(13)
where F is the Faraday constant, z+ and z− are the valencies of the cation and anion
respectively and 0λ+ and 0λ− are the ionic conductances of the cation and anion
respectively at infinite dilution.
The physical mass transfer coefficient, Lk , is related to the pair gas/solution and to the
apparatus where the mass transfer takes place through the empirical expression referred
by Versteeg et al. (1987):
3 42Sh Re Scc cc= (14)

72
where Sh, Re and Sc are respectively the Sherwood, Reynolds and Schmidt
dimensionless numbers and the constants 2c , 3c and 4c depend on the specific
apparatus. Performing experiments with a known and non-reactive gas/fluid pair (for
example 2 waterCO / or 2 solutionN O/ ) at different temperatures and stirring speeds, it is
possible to determine the constants of equation (14) and consequently, to estimate the
Lk of a given reactive system.
3.5. Experimental
Chemicals
The potassium threonate aqueous solutions were prepared by adding to the amino acid
an equimolar amount of potassium hydroxide ( )KOH in a volumetric flask filled up
with distilled and deionised water. It is important to notice that before the addition of
KOH , the amino acid exists in solution as a zwitterion (with the amine group
protonated). The addition of potassium hydroxide to form the potassium carboxylate
group will deprotonate the amine group enabling it to react with carbon dioxide (Kumar
et al., 2003c).
Density and Viscosity
Densities of potassium threonate solutions at 293, 298, 303 and 313 K were determined
using hydrometers series M100, ranges 1.000 to 1.100 and 1.100 to 1.200 ± 0.002
-1g ml⋅ .
Viscosities of the solutions of potassium threonate were determined using a standard
Cannon-Fenske viscosimeter.

73
N2O solubility
The procedure adopted to measure the solubility of 2N O in the amino acid salt
solutions is described in detail by Derks et al. (2005) and Portugal et al. (2007). The set-
up used is composed of two vessels with calibrated volumes; one for storing the 2N O
and the other for the absorbent solution, which is magnetically stirred. A known volume
of degassed solution is transferred to the absorbent vessel and the solution vapour
pressure, vapourP , recorded (pressure sensor from Druck, PMP4000, 0-350 mbar,
accuracy: 0.08% FS). A certain amount of 2N O is allowed to enter the absorbent tank
from the gas vessel and the initial pressure, 0P , recorded. The stirrer is then switched on
and the solution equilibrium is allowed to be established (the final pressure, eqP , is
recorded as well as the temperature, 0T ). The temperature is then set to a different
value, T , and a new equilibrium state is obtained; this procedure is repeated for the
temperatures at which the solubility is to be determined. The solution is weighed at the
end of the experiment. The amount of absorbed gas is calculated applying the ideal gas
law and the Henry coefficient for 2N O , 2N OH , is computed from the equation:
( ) ( ) ( )( ) ( ) ( )2
0 0
0
eq vapour LN O
Gvapour eq vapour
P T P T RVH T
VP P T P T P T
T T
− = − − −
(15)
where GV and LV are respectively the volume of gas and liquid in the absorbent vessel
and R is the universal gas constant. The solution vapour pressure at each temperature is
estimated by the following relation:
( ) ( )2 2
purevapour H O H OP T x P T= (16)
where 2H Ox is the molar fraction of water in solution. The water vapour pressure as a
function of the absolute temperature, P
H2Opure T( ), is obtained from the Antoine equation
(Poling et al., 2001).
Kinetic measurements
The experiments were performed in a stirred cell reactor with a smooth gas-liquid
interface operating batchwise with respect to the liquid phase and semi-continuously

74
with respect to the gas phase. Although experiments were performed in a different set-
up (much smaller – liquid volume: 50 cm3, reactor diameter: 3.87 cm, stirrer diameter: 2
cm), the followed procedure is the same of the one described by Derks et al. (2006) and
Portugal et al. (2007) and will be only briefly summarized here. Before starting the
experiment, the vapour-liquid equilibrium of the fresh solution of potassium threonate,
previously degassed, is established in the absorbent vessel and the vapour pressure,
vapourP , recorded (pressure sensor from Druck, PMP4000, 0-350 mbar, accuracy: 0.08%
FS). During the experiment, the pressure inside the stirred reactor is kept constant, SCP ,
using a pressure controller (Bronkhorst, P602-C, 0-200 mbar, accuracy: 0.5% FS) while
2CO from the gas vessel (filled with pure 2CO ) is being fed to it. All 2CO that is being
absorbed in the stirred cell comes from the gas vessel and therefore the flow of absorbed
2CO can be computed following the pressure decrease inside the gas vessel, GVdP
dt,
(pressure sensor from Druck, PMP4000, 0-2 bar, accuracy: 0.08% FS). Since the 2CO
absorption inside the stirred cell reactor is described by equation (9), after replacing
NCO2 by the pressure derivative and noticing that
P
CO2= P
SC− P
vapour, one obtains the
following expression:
2
SC vapourGV GVL
CO
P PV dPE k A
RT dt H
−= (17)
where GVV is the volume of the gas vessel. Finally, the experimental kinetic constant
can be extracted from the computed enhancement factor, depending on the absorption
reaction regime.
Figure 3.2 shows a sketch of the experimental setup.

75
Figure 3.2 – Experimental set-up sketch.
Physical mass transfer coefficient
The physical mass transfer coefficient, necessary for equation (17), was obtained from
experimental data of 2CO absorption in water (at different temperatures) and 2N O in
water and in potassium threonate solutions; the experimental set-up shown in Figure 3.2
was used. At a given temperature, a known volume of degassed water or absorbent
solution is placed in the stirred reactor, the vapour-liquid equilibrium allowed to be
established and the vapour pressure, vapourP , recorded. Then, a certain amount of 2CO or
2N O is admitted in the reactor, while the stirrer is switched off, and the initial pressure,
0P , recorded. The stirrer is then switched on, at a given stirring speed, and the pressure
history inside the reactor recorded. The procedure is repeated for different stirring
speeds given that a smooth gas-liquid interface is ensured. Only physical absorption
takes place, since the gas/liquid pairs are non-reactive (pairs 2CO /water and
2N O /absorbent aqueous solutions); for this reason, equation (9) becomes:
2 2
2 2
2
CO COGCO L CO
CO
dP PVN k A C
RT dt H
= = −
(18)
where 2COC is the absorbed gas concentration and VG is the volume of gas above the
liquid in the stirred reactor. Performing a mass balance to the stirred reactor one obtains:
( )2 2
2
0,CO CO GCO
L
P P VC
RT V
−= where
20, 0CO vapourP P P= − . Solving equation (18), it becomes:
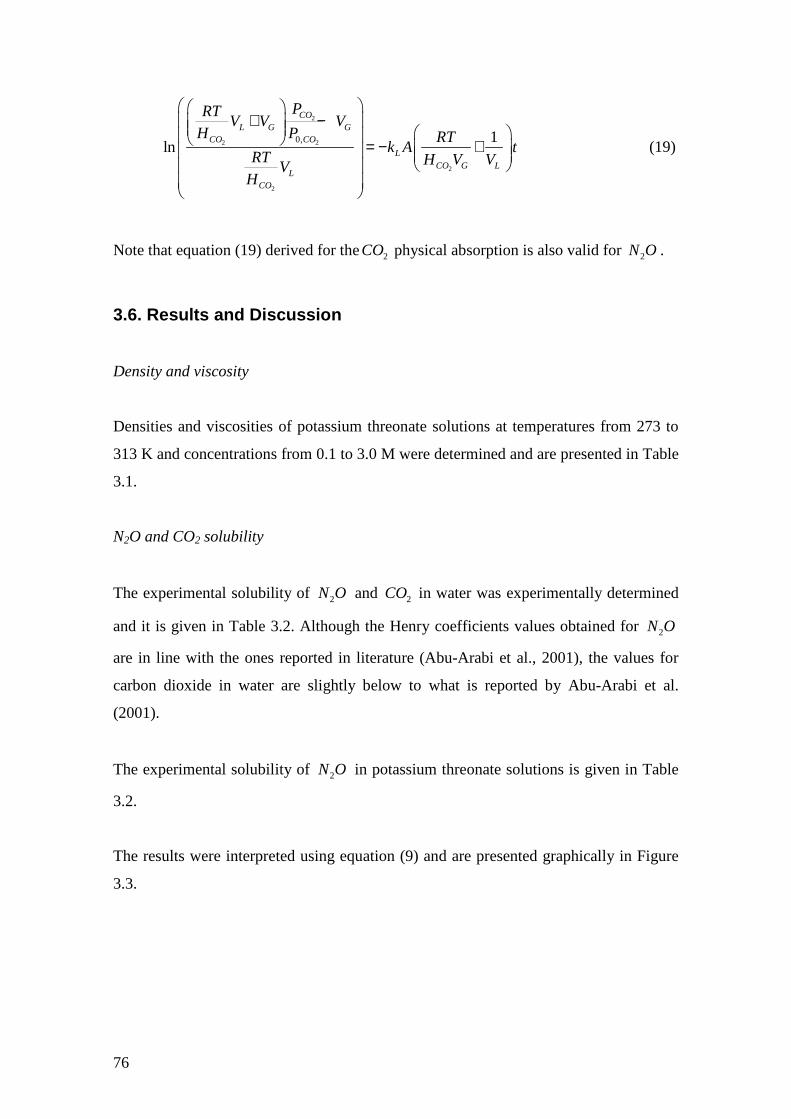
76
2
2 2
2
2
0, 1ln
COL G G
CO CO
LCO G L
LCO
PRTV V V
H P RTk A t
RT H V VVH
+ − = − +
(19)
Note that equation (19) derived for the2CO physical absorption is also valid for 2N O .
3.6. Results and Discussion
Density and viscosity
Densities and viscosities of potassium threonate solutions at temperatures from 273 to
313 K and concentrations from 0.1 to 3.0 M were determined and are presented in Table
3.1.
N2O and CO2 solubility
The experimental solubility of 2N O and 2CO in water was experimentally determined
and it is given in Table 3.2. Although the Henry coefficients values obtained for 2N O
are in line with the ones reported in literature (Abu-Arabi et al., 2001), the values for
carbon dioxide in water are slightly below to what is reported by Abu-Arabi et al.
(2001).
The experimental solubility of 2N O in potassium threonate solutions is given in Table
3.2.
The results were interpreted using equation (9) and are presented graphically in Figure
3.3.

77
Table 3.1 – Densities and viscosities of potassium threonate solutions.
293 298 303 313 ( )KT
( )MSC ( )3kg m
ρ−⋅ ( )
3
1 1
10
kg m s
η− −
×
⋅ ⋅ ( )3kg m
ρ−⋅ ( )
3
1 1
10
kg m s
η− −
×
⋅ ⋅ ( )3kg m
ρ−⋅ ( )
3
1 1
10
kg m s
η− −
×
⋅ ⋅ ( )3kg m
ρ−⋅ ( )
3
1 1
10
kg m s
η− −
×
⋅ ⋅
0.1 1006 1.036 1004 0.929 1003 0.830 1000 0.683 0.3 1020 1.126 1018 1.007 1017 0.899 1014 0.785 0.6 1040 1.254 1038 1.146 1037 1.024 1034 0.888 1.0 1067 1.541 1065 1.355 1064 1.216 1061 1.080 2.0 1132 2.555 1131 2.276 1129 1.991 1125 1.577 3.0 1192 5.116 1190 3.984 1188 3.409 1184 2.827
Table 3.2 - Henry constants of 2N O and 2CO in water and in potassium threonate solutions. All values are experimental except for 2CO in
potassium threonate solutions that were computed based on Sechenov’s model - ( )3 1Pa m molH −⋅ ⋅ .
293 298 303 313 ( )KT
( )MSC 2N O 2CO 2N O 2CO 2N O 2CO 2N O 2CO
Water 3357 2442 3831 2771 4353 3132 5551 3953 0.1 3490 2520 3980 2854 4519 3219 5755 4048 0.3 3735 2683 4235 3026 4781 3400 6025 4244 0.6 4201 2949 4748 3305 5345 3691 6697 4557 1.0 4844 3344 5418 3717 6037 4119 7419 5009 2.0 6842 4578 7499 4987 8194 5418 9700 6349 3.0 9782 6268 10326 6690 10880 7126 12019 8046
77
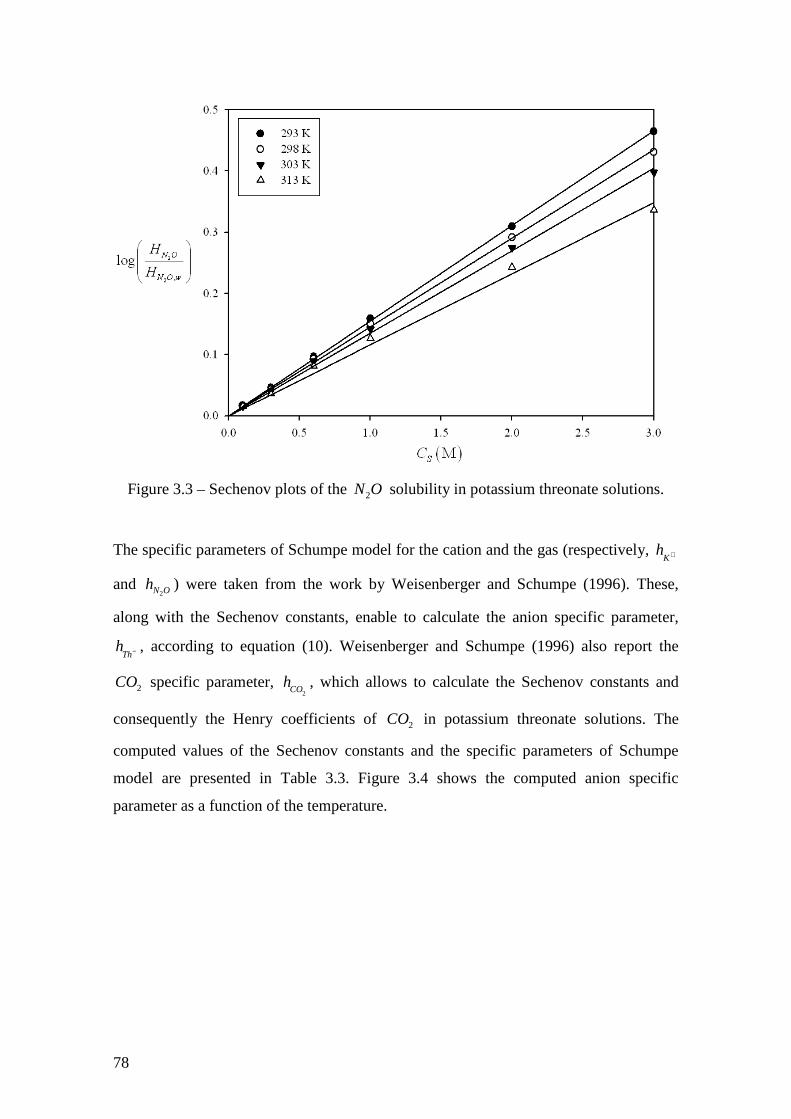
78
Figure 3.3 – Sechenov plots of the 2N O solubility in potassium threonate solutions.
The specific parameters of Schumpe model for the cation and the gas (respectively, K
h +
and 2N Oh ) were taken from the work by Weisenberger and Schumpe (1996). These,
along with the Sechenov constants, enable to calculate the anion specific parameter,
Thh − , according to equation (10). Weisenberger and Schumpe (1996) also report the
2CO specific parameter, h
CO2, which allows to calculate the Sechenov constants and
consequently the Henry coefficients of 2CO in potassium threonate solutions. The
computed values of the Sechenov constants and the specific parameters of Schumpe
model are presented in Table 3.3. Figure 3.4 shows the computed anion specific
parameter as a function of the temperature.

79
Table 3.3 – Sechenov constants and specific parameters of Schumpe model for the
solubility of 2N O and 2CO in potassium threonate solutions.
T (K)
2N OK
( )3 -1dm mol⋅ 2N Oh *
( )3 -1dm mol⋅K
h + *
( )3 -1dm mol⋅ Th
h −
( )3 -1dm mol⋅2COh *
( )3 -1dm mol⋅
2COK
( )3 -1dm mol⋅
293 0.155 -0.0061 0.0753 -0.0155 0.136 298 0.145 -0.0085 0.0698 -0.0172 0.128 303 0.135 -0.0109 0.0646 -0.0189 0.119 313 0.116 -0.0157
0.0922
0.0552 -0.0223 0.103 * - Values taken from Weisenberger and Schumpe (1996)
Figure 3.4 – Threonate anion specific parameter as a function of temperature.
It was expected the ion specific parameters to be constant with temperature
(Weisenberger and Schumpe, 1996), however Th
h − clearly decreases with temperature
( )40.368 9.98 10Th
h T−−= − × , as it is shown in Table 3.3 and Figure 3.4. For this reason,
instead of taking the mean value of Th
h − (0.0662 3 -1dm mol⋅ ) to calculate the 2CO
solubility, 2COK was computed for each temperature by the following expression:
2 2 2 22 2CO N O N O COK K h h= − + ; results are presented in Table 3.3. The computed Henry
coefficients of 2CO in potassium threonate solutions are shown in Table 3.2.

80
Gas and ion diffusion coefficients
To estimate the diffusion coefficient of 2N O and 2CO in potassium threonate solutions,
equations (14) (with α = 0.8 ) and (12) were applied. Results are presented in Table 3.4.
The diffusion coefficients of potassium threonate in potassium threonate solutions were
estimated using the Stokes-Einstein relation – equation (14) – with 0.6α = and the
Nernst equation – equation (13). The ionic conductance at infinite dilution of the cation
K + , 0λ+ , as a function of temperature was computed based on the work by Fell and
Hutchiso (1971). The ionic conductance of the threonate anion at 298 K was linearly
interpolated using values of 0λ− available in literature for similar anions with molar
masses respectively lower and higher than the threonate anion: glycinate and aspartate
(Miyamoto and Schmidt, 1933). The temperature dependence was assumed to be linear
and equal to the one of aspartate, being 0λ− at 273 K of aspartate obtained from the work
by Hoskins et al. (1930). Table 3.4 presents the computed diffusion coefficients of
potassium threonate in the potassium threonate solutions.
Table 3.4 - Diffusion coefficient of 2N O , 2CO and potassium threonate in potassium
threonate solutions computed based on the Stokes-Einstein relation - ( )10 2 110 m sD −× ⋅
( )MSC 2N O 2CO Potassium
threonate 2N O 2CO Potassium threonate
293 K 298 K 0.1 15.2 16.6 9.47 17.3 18.6 10.6 0.3 14.2 15.6 9.01 16.2 17.5 10.1 0.6 13.0 14.3 8.44 14.6 15.7 9.35 1.0 11.0 12.1 7.46 12.8 13.8 8.45 2.0 7.37 8.07 5.51 8.42 9.09 6.19 3.0 4.23 4.63 3.63 5.38 5.81 4.43
303 K 313 K 0.1 19.7 21.0 11.8 25.2 26.1 14.4 0.3 18.5 19.7 11.3 22.5 23.4 13.2 0.6 16.7 17.7 10.4 20.4 21.2 12.3 1.0 14.5 15.4 9.42 17.4 18.1 10.9 2.0 9.79 10.4 7.01 12.9 13.4 8.72 3.0 6.36 6.77 5.08 8.08 8.38 6.14

81
Physical mass transfer coefficient
The physical mass transfer coefficient of 2CO in water was determined for the studied
temperatures and for stirring speeds ranging from 75 to 200 rpm. Physical mass transfer
coefficients of 2N O in water and in solutions of 1 M and 3 M were measured at
N = 200 rpm and 298 K. Equation (14) was fitted to the experimental data and it was
verified that the constants are within the usual values for stirred cell reactors (Versteeg
et al., 1987):
2 0.778 0.390Sh 6.33 10 Re Sc−= × (20)
The experimental and predicted Lk values differ less than 7 %. Since the physical
properties of the solutions are known, it is possible to extrapolate the value of Lk for the
potassium threonate solutions using equation (20). These values are presented in Table
3.5.
Table 3.5 - Physical mass transfer coefficient of 2CO in potassium threonate solutions,
computed based on equation (20) - ( )6 -110 m sLk × ⋅
( )KT
( )MSC 293 298 303 313
0.1 17.1 19.1 21.4 26.4 0.3 16.0 17.9 20.1 23.5 0.6 14.6 16.1 18.0 21.2 1.0 12.3 14.0 15.7 18.0 2.0 8.09 9.10 10.4 13.2 3.0 4.49 5.68 6.62 8.10
Kinetic Measurements
The experimental carbon dioxide flux data, 2COJ , as a function of the carbon dioxide
partial pressure, 2COP , for all temperatures and potassium threonate concentrations
studied are presented in appendix.

82
The carbon dioxide absorption performance of potassium threonate at 1 M and 298 K
was compared to the absorption performance of a primary and a secondary amines –
potassium glycinate and diethanolamine (DEA), respectively – obtained using the same
set-up and method. Results, shown in Figure 3.5, confirm that although potassium
threonate absorbs slower than potassium glycinate, it is faster than DEA. Looking to the
p AK values, this was an expected result since ,p 8.883A DEAK = < ,
p 9.100A Th
K − = <
,p 9.7775
A GlyK − = and since DEA has a secondary amine group while potassium
glycinate has a non-sterically hindered primary amine group. This result also confirms
that potassium threonate is able to absorb 2CO at a considerable rate.
Figure 3.5 – Comparison of 2CO absorption flux in potassium threonate, potassium
glycinate and diethanolamine (DEA) solutions at 1 M and 298 K (all measurements
were performed in the setup presented in Figure 3.2).
The results presented in the appendix were treated using both the pseudo-first order
assumption and equation (8) (DeCoursey, 1974) to obtain the overall kinetic constant.
For the pseudo-first order approach, only experiments that obey condition (11)
( 10E Ha∞ > ) were taken into account, while for the DeCoursey approach only

83
experiments at carbon dioxide partial pressures lower than 20 mbar were used. Such
low partial pressure range was chosen because this is when, within the DeCoursey
model, the overall kinetic constant is obtained with higher precision, mainly due to the
uncertainty of the 2CO and potassium threonate diffusivity coefficients. Results of both
approaches are presented in Table 3.6. The overall kinetic constants computed using
both methods are in agreement within a 20% difference (which corresponds to a
maximum deviation of 10% in the Ha values). This difference is very acceptable taking
into consideration that experiments at low partial pressures can be strongly affected by
experimental errors: 2CO partial pressures vary from values close to the solution vapour
pressure (in the range of tens of mbar) to values in the same order of magnitude as the
pressure equipment accuracy (in the range of tenths of mbar). For this reason, it was
decided to use the results obtained by the DeCoursey approach for further analysis,
since they were obtained using more experimental values, therefore reducing the
associated experimental error.
Table 3.6 – Experimental overall kinetic constants using the PFO and the DeCoursey
(DC) approaches - ( )1sovk − .
( )KT
( )MSC 293 298 303 313
PFO DC PFO DC PFO DC PFO DC 0.1 305 251 238 246 254 306 --- 0.3 773 824 986 1010 1240 1320 --- 0.6 2220 2380 2430 2620 4280 4420 --- 1.0 3920 4560 7610 7090 5790 7090 11 400 11 100 2.0 22 600 23 200 27 300 27 800 39 800 45 500 --- 3.0 --- 139 000 120 000 --- ---
It can be considered that at low loadings, the only ions present in solution are potassium
cation and threonate anion, both monovalent (2 1z = ). Hence, SI C= and combining
equations (7) and (8), it can be written:
( )2 2 2 expov CO CO S Sk r C k C bC= − = (21)
Assuming that the kinetic constant follows the Arrhenius law, it is possible to make an
overall fit for all the temperatures and concentrations:

84
( )2,0 exp expov S S
Ak k C bC
T =
(22)
The resulting fit, Equation (23), was obtained by minimizing the sum of the relative
residues and it is shown in Figures 3.6 and 3.7 along with the experimental results.
( )8 35804.13 10 exp exp 0.90ov Sk C I
T
− = ×
(23)
Penny and Ritter (1983) and Versteeg et al. (1996) suggested that the rate of 2CO
absorption in amines is related to the amine p AK . The kinetic constants, k2, were
compared with the Brønsted plots drew by these authors; p AK values of threonate as a
function of temperature were extracted from Perrin (1965). They were found to be
considerably lower than the expected and the discrepancy increases with temperature.
One possible explanation for this is the molecular configuration. Although the amine
group is not connected to a tertiary carbon, potassium threonate is sterically hindered
due to the hydroxyethylene group connected to the α carbon. This may confer
instability to the carbamate formed, hence decreasing the absorption rate. AMP, which
is a primary sterically hindered amine (with the α carbon dimethylated), diverges even
more from the referred Brønsted plots – ,p 9.72A AMPK = (Perrin, 1965),
k
2,AMP= 555 dm3 ⋅ mol-1 ⋅s-1 (Saha et al., 1995), both at 298 K – supporting this
hypothesis.
Usually, the effect of the ionic strength on the reaction kinetic constant is much lower
than 0.9b = (Cullinane and Rochelle, 2006; Portugal et al., 2007). To confirm the
obtained value for b, it was prepared a 1 M potassium threonate solution with the ionic
strength modified by adding NaCl up to 1 M (I = 2 M) and obtained the corresponding
overall kinetic constant. The obtained overall kinetic constant, at 298 K, was ovk = 14
900 s-1, as shown in Figure 3.7. This value is in agreement with the proposed model
given by equation (23). Nevertheless, it must be taken into account that the overall
kinetic constants were extracted based on computed values of the 2CO diffusion
coefficients - hence any uncertainty on these values affects significantly the final
results.
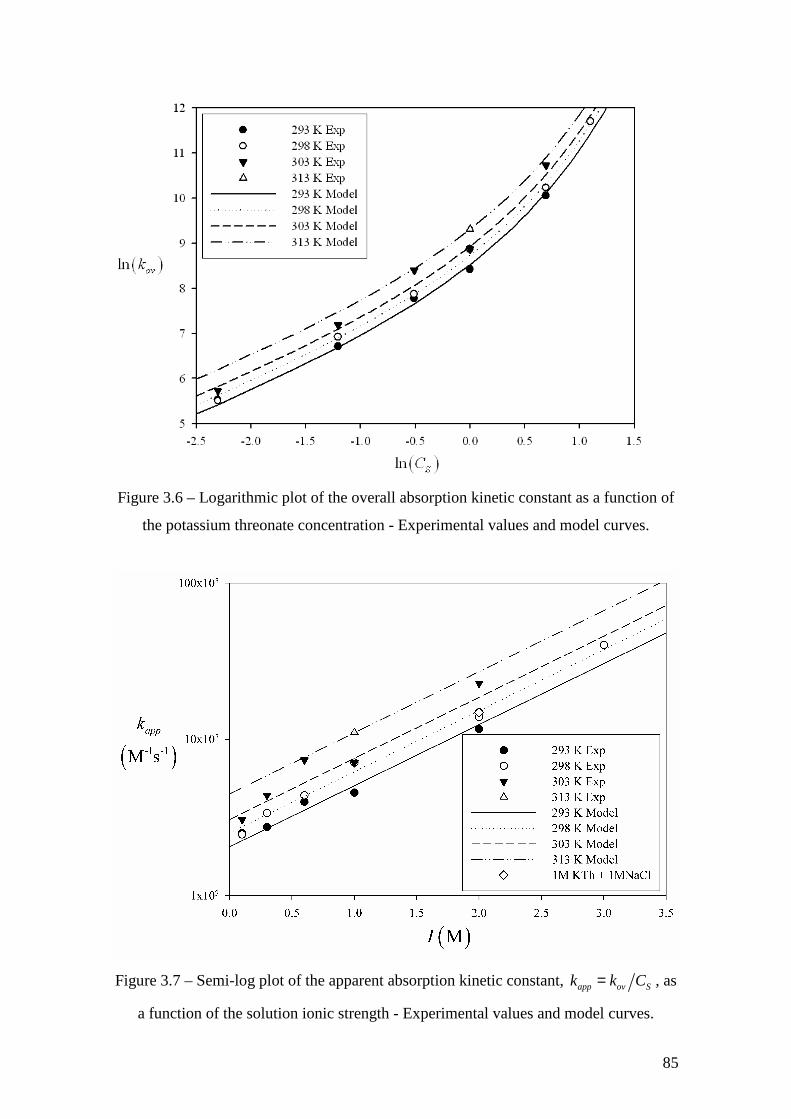
85
Figure 3.6 – Logarithmic plot of the overall absorption kinetic constant as a function of
the potassium threonate concentration - Experimental values and model curves.
Figure 3.7 – Semi-log plot of the apparent absorption kinetic constant, app ov Sk k C= , as
a function of the solution ionic strength - Experimental values and model curves.

86
3.7. Conclusions
Potassium threonate was characterized for carbon dioxide absorption. Densities and
viscosities of aqueous solutions with concentrations from 0.1 to 3 M at 293, 298, 303
and 313 K were determined. The solubility of 2N O in these solutions was measured at
the same temperatures. The results were treated using the Schumpe model (Schumpe,
1993). Threonate specific parameter was found to vary linearly with temperature -
40.368 9.98 10Th
h T−−= − × . Physical solubility of 2CO in solutions was then computed.
Diffusion coefficients of 2N O and 2CO were estimated using a modified Stokes-
Einstein relation and the 2N O analogy. Diffusion coefficient of potassium threonate at
infinite dilution was estimated using the Nernst equation for the diffusion in electrolyte
solutions and the diffusion of the ions in solutions was estimated applying modified
Stokes-Einstein relation.
The physical mass transfer coefficient of 2N O and 2CO in water and of 2N O in
solutions was measured and its dependence on the system physical properties for the
used absorption reactor obtained ( )2 0.778 0.390Sh 6.33 10 Re Sc−= × .
Kinetic measurements were performed in a stirred cell reactor operating semi-
continuously. It was verified experimentally that the 2CO absorption rate in potassium
threonate solutions are within the rates found for other amines. Nevertheless, the
computed kinetic constants do not follow the Brønsted plot proposed by Penny and
Ritter (1983) and by Versteeg et al. (1996). This has to do with the molecular
configuration, which is likely to originate unstable carbamates, thus favoring the
equilibrium and regeneration but penalizing the kinetics.
Since the absorption overall kinetics depends directly on the 2CO diffusivity, a more
accurate determination of this parameter in potassium threonate solutions will improve
the accuracy of the absorption overall kinetics. Further studies of potassium threonate as
a carbon dioxide absorbent should consider the absorption equilibrium and regeneration.
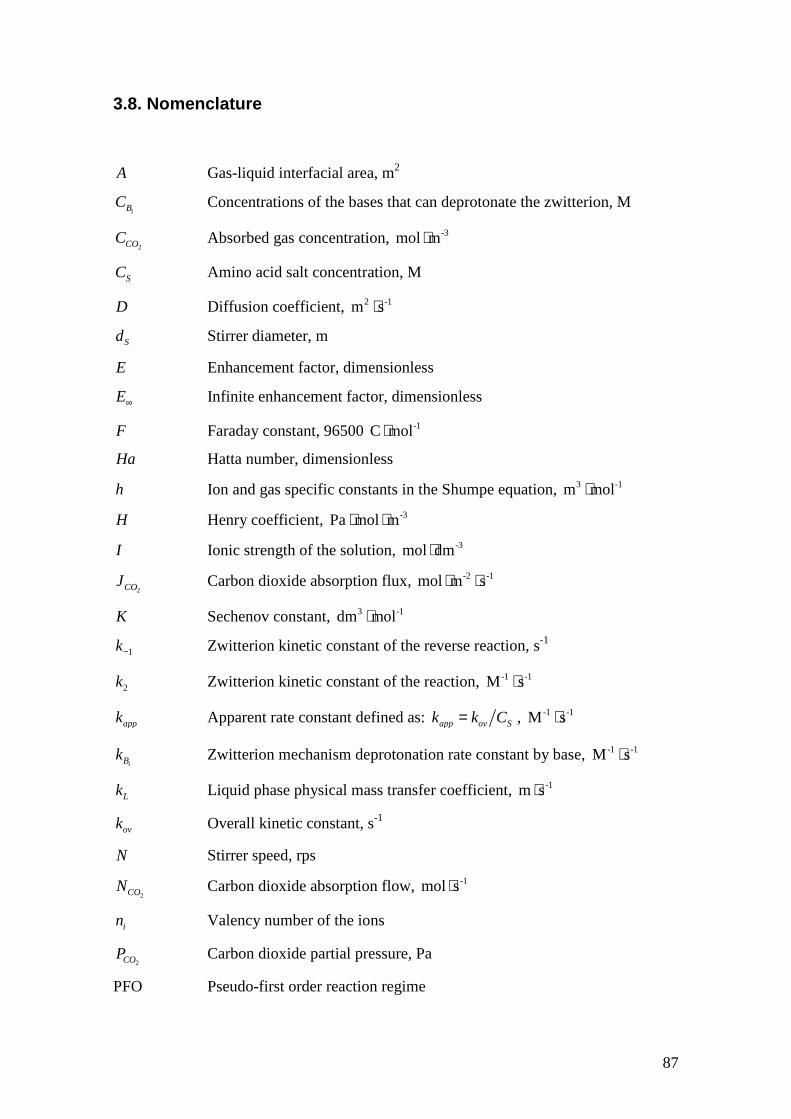
87
3.8. Nomenclature
A Gas-liquid interfacial area, m2
iBC Concentrations of the bases that can deprotonate the zwitterion, M
2COC Absorbed gas concentration, -3mol m⋅
SC Amino acid salt concentration, M
D Diffusion coefficient, 2 -1m s⋅
Sd Stirrer diameter, m
E Enhancement factor, dimensionless
E∞ Infinite enhancement factor, dimensionless
F Faraday constant, 96500 -1C mol⋅
Ha Hatta number, dimensionless
h Ion and gas specific constants in the Shumpe equation, 3 -1m mol⋅
H Henry coefficient, -3Pa mol m⋅ ⋅
I Ionic strength of the solution, -3mol dm⋅
2COJ Carbon dioxide absorption flux, -2 -1mol m s⋅ ⋅
K Sechenov constant, 3 -1dm mol⋅
1k− Zwitterion kinetic constant of the reverse reaction, s-1
2k Zwitterion kinetic constant of the reaction, M-1 ⋅s-1
appk Apparent rate constant defined as: app ov Sk k C= , M-1 ⋅s-1
iBk Zwitterion mechanism deprotonation rate constant by base, M-1 ⋅s-1
Lk Liquid phase physical mass transfer coefficient, -1m s⋅
ovk Overall kinetic constant, s-1
N Stirrer speed, rps
2CON Carbon dioxide absorption flow, -1mol s⋅
in Valency number of the ions
2COP Carbon dioxide partial pressure, Pa
PFO Pseudo-first order reaction regime
88
2COr− Rate of reaction, -3 -1mol m s⋅ ⋅
R Universal gas constant, 8.314 -1 -1J mol K⋅ ⋅
Re Reynolds number, ( )2
Re Sd Nρη
= , dimensionless
Sh Sherwood number, 2
Sh L S
CO
k d
D= , dimensionless
Sc Schmidt number, 2
ScCOD
ηρ
= , dimensionless
T Temperature, K
V Volume, m3
x Molar fraction, -1mol mol⋅
,z z+ − Valencies of the cation and anion
Greek symbols
α Constant from the modified Stokes-Einstein equation
máxα Maximum loading achieved in one experiment, mol
CO2⋅ mol
S-1
Sν Stoichiometric coefficient
η Solution viscosity, -1 -1kg m s⋅ ⋅
ρ Solution density, -3kg m⋅ 0λ+ ,
0λ− Ionic conductances of the cation and anion at infinite dilution, cm2 ⋅ Ω−1
Subscripts
0 Initial
2CO Carbon dioxide
DEA Diethanolamine
eff Effective (after correcting for the ionic strength)
eq Equilibrium
final Final
G Gas phase
GV Gas vessel
K + Potassium cation
89
L Liquid phase
2N O Nitrous oxide
S Amino acid salt
SC Stirred cell
Th− Threonate anion
w Water
3.9. References
Abu-Arabi, M. K., Al-Jarrah, A. M., et al. (2001). "Physical Solubility and Diffusivity
of CO2 in aqueous Diethanolamine Solutions". Journal of Chemical and Engineering
Data, 46(3), 516-521.
Blauwhoff, P. M. M., Versteeg, G. F., et al. (1984). "A Study on the Reaction between
CO2 and Alkanolamines in Aqueous-Solutions". Chemical Engineering Science, 39(2),
207-225.
Brilman, D. W. F., van Swaaij, W. P. M., et al. (2001). "Diffusion coefficient and
solubility of isobutene and trans-2-butene in aqueous sulfuric acid solutions". Journal of
Chemical and Engineering Data, 46(5), 1130-1135.
Caplow, M. (1968). "Kinetics of carbamate formation and breakdown". Journal of the
American Chemical Society, 90(24), 6795-6803.
Cullinane, J. T. and Rochelle, G. T. (2006). "Kinetics of carbon dioxide absorption into
aqueous potassium carbonate and piperazine". Industrial & Engineering Chemistry
Research, 45(8), 2531-2545.
Danckwerts, P. (1970). "Gas-Liquid Reactions". McGraw-Hill Book Company.
Decoursey, W. J. (1974). "Absorption with Chemical-Reaction - Development of a New
Relation for Danckwerts Model". Chemical Engineering Science, 29(9), 1867-1872.
Derks, P. W., Hogendoorn, K. J., et al. (2005). "Solubility of N2O in and density,
viscosity, and surface tension of aqueous piperazine solutions". Journal of Chemical and
Engineering Data, 50(6), 1947-1950.

90
Derks, P. W. J., Kleingeld, T., et al. (2006). "Kinetics of absorption of carbon dioxide in
aqueous piperazine solutions". Chemical Engineering Science, 61(20), 6837-6854.
Fell, C. J. D. and Hutchiso, H. P. (1971). "Diffusion Coefficients for Sodium and
Potassium Chlorides in Water at Elevated Temperatures". Journal of Chemical and
Engineering Data, 16(4): 427-429.
Feron, P. and Jansen, A. (2002). "CO2 separation with polyolefin membrane contactors
and dedicated absorption liquids: performances and prospects". Separation and
Purification Technology, 27(3), 231-242.
Goff, G. S. and Rochelle, G. T. (2006). "Oxidation inhibitors for copper and iron
catalyzed degradation of monoethanolamine in CO2 capture processes". Industrial &
Engineering Chemistry Research, 45(8), 2513-2521.
Granite, E. J. and O'Brien, T. (2005). "Review of novel methods for carbon dioxide
separation from flue and fuel gases". Fuel Processing Technology, 86(14-15), 1423-
1434.
Gubbins, K. E., Bhatia, K. K., et al. (1966). "Diffusion of Gases in Electrolytic
Solutions". American Institute of Chemical Engineers Journal, 12(3), 548.
Hampe, E. M. and Rudkevich, D. M. (2003). "Exploring reversible reactions between
CO2 and amines". Tetrahedron, 59(48), 9619-9625.
Haubrock, J., Hogendoorn, J. A., et al. (2007). "The applicability of activities in kinetic
expressions: a more fundamental approach to represent the kinetics of the system CO2-
OH- in terms of activities". Chemical Engineering Science, 62(21), 5753-5769.
Higbie, R. (1935). "The rate of absorption of a pure gas into a still liquid during a short
time of exposure". Transactions of the American Institute of Chemical Engineers, 31,
365–389.
Holst, J., Politiek, P. P., et al. (2006). "CO2 capture from flue gas using amino acid salt
solutions". GHGT-8 proceedings, Norway.

91
Hook, R. J. (1997). "An investigation of some sterically hindered amines as potential
carbon dioxide scrubbing compounds". Industrial & Engineering Chemistry Research,
36(5), 1779-1790.
Hoskins, W. M., Randall, M., et al. (1930). "The conductance and activity coefficients
of glutamic and aspartic acids and their monosodium salts". Journal of Biological
Chemistry, 88(1), 215-239.
Idem, R. and Tontiwachwuthikul, P. (2006). "Preface for the special issue on the
capture of carbon dioxide from industrial sources: Technological developments and
future opportunities". Industrial & Engineering Chemistry Research, 45(8), 2413-2413.
Jeffreys, G. V. and Bull, A. F. (1964). "The effect of glycine additive on the rate of
absorption of carbon dioxide in sodium glycinate solutions". Transactions of the
Institution of Chemical Engineers and the Chemical Engineer, 42, 118-125.
Jensen, A., Jensen, J. B., et al. (1952). "Studies on Carbamates .6. The Carbamate of
Glycine". Acta Chemica Scandinavica, 6(3), 395-397.
Joosten, G. E. H. and Danckwerts, P. V. (1972). "Solubility and Diffusivity of Nitrous-
Oxide in Equimolar Potassium Carbonate-Potassium Bicarbonate Solutions at 25 ºC and
1 Atm". Journal of Chemical and Engineering Data, 17(4), 452.
Kohl, A. L. and Nielsen, R. B. (1997). "Gas Purification". Houston: Gulf Publishing
Company.
Kumar, P., Hogendoorn, J., et al. (2001). "Density, viscosity, solubility, and diffusivity
of N2O in aqueous amino acid salt solutions". Journal of Chemical and Engineering
Data, 46(6), 1357-1361.
Kumar, P., Hogendoorn, J., et al. (2003a). "Equilibrium solubility of CO2 in aqueous
potassium taurate solutions: Part 1. Crystallization in carbon dioxide loaded aqueous
salt solutions of amino acids". Industrial & Engineering Chemistry Research, 42(12),
2832-2840.

92
Kumar, P., Hogendoorn, J., et al. (2003b). "Equilibrium solubility of CO2 in aqueous
potassium taurate solutions: Part 2. Experimental VLE data and model". Industrial &
Engineering Chemistry Research 42(12), 2841-2852.
Kumar, P., Hogendoorn, J., et al. (2003c). "Kinetics of the reaction of CO2 with aqueous
potassium salt of taurine and glycine". American Institute of Chemical Engineers
Journal, 49(1), 203-213.
Kumar, P. S., Hogendoorn, J. A., et al. (2002). "New absorption liquids for the removal
of CO2 from dilute gas streams using membrane contactors". Chemical Engineering
Science, 57(9), 1639-1651.
Laddha, S. S., Diaz, J. M., et al. (1981). "The N2O Analogy - the Solubilities of CO2 and
N2O in Aqueous-Solutions of Organic-Compounds". Chemical Engineering Science,
36(1), 228-229.
Mendes, A. M. M. (2000). "Development of an adsorption/membrane based system for
carbon dioxide, nitrogen and spur gases removal from a nitrous oxide and xenon
anaesthetic closed loop". Applied Cardiopulmonary Pathophysiology, 9(2), 156-163.
Miyamoto, S. and Schmidt, C. L. A. (1933). "Transference and conductivity studies on
solutions of certain proteins and amino acids with special reference to the formation of
complex ions between the alkaline earth elements and certain proteins". Journal of
Biological Chemistry, 99(2), 335-358.
Penny, D. E. and Ritter, T. J. (1983). "Kinetic-Study of the Reaction between Carbon-
Dioxide and Primary Amines". Journal of the Chemical Society-Faraday Transactions I,
79, 2103-2109.
Perrin, D. (1965). "Dissociation Constants of Organic Bases in Aqueous Solutions".
Butterworth, London.
Poling, B. E., Prausnitz, J. M., et al. (2001). "The Properties of Gases and Liquids".
McGraw-Hill International Editions.

93
Portugal, A. F., Derks, P. W. J., et al. (2007). "Characterization of potassium glycinate
for carbon dioxide absorption purposes". Chemical Engineering Science, 62(23), 6534-
6547.
Saha, A. K., Bandyopadhyay, S. S., et al. (1995). "Kinetics of Absorption of CO2 into
Aqueous-Solutions of 2-Amino-2-Methyl-1-Propanol". Chemical Engineering Science,
50(22), 3587-3598.
Sartori, G. and Savage, D. W. (1983). "Sterically Hindered Amines for CO2 Removal
from Gases". Industrial & Engineering Chemistry Fundamentals, 22(2), 239-249.
Schumpe, A. (1993). "The Estimation of Gas Solubilities in Salt-Solutions". Chemical
Engineering Science, 48(1), 153-158.
Singh, P., Nierderer, J. P. M., et al. (2007). "Structure and activity relationships for
amine based CO2 absorbents". International Journal of Greenhouse Gas Control, 1(1), 5-
10.
Snijder, E. D., Teriele, M. J. M., et al. (1993). "Diffusion-Coefficients of Several
Aqueous Alkanolamine Solutions". Journal of Chemical and Engineering Data, 38(3),
475-480.
Supap, T., Idem, R., et al. (2006). "Analysis of monoethanolamine and its oxidative
degradation products during CO2 absorption from flue gases: A comparative study of
GC-MS, HPLC-RID, and CE-DAD analytical techniques and possible optimum
combinations". Industrial & Engineering Chemistry Research, 45(8), 2437-2451.
Van Swaaij, W. P. M. and Versteeg, G. F. (1992). "Mass-Transfer Accompanied with
Complex Reversible Chemical-Reactions in Gas-Liquid Systems - an Overview".
Chemical Engineering Science, 47(13-14), 3181-3195.
Versteeg, G. F., Blauwhoff, P. M. M., et al. (1987). "The Effect of Diffusivity on Gas-
Liquid Mass-Transfer in Stirred Vessels - Experiments at Atmospheric and Elevated
Pressures". Chemical Engineering Science, 42(5), 1103-1119.

94
Versteeg, G. F., Van Dijck, L. A. J., et al. (1996). "On the kinetics between CO2 and
alkanolamines both in aqueous and non-aqueous solutions. An overview". Chemical
Engineering Communications, 144, 113-158.
Versteeg, G. F. and Van Swaaij, W. P. M. (1988). "Solubility and Diffusivity of Acid
Gases (CO2, N2O) in Aqueous Alkanolamine Solutions". Journal of Chemical and
Engineering Data, 33(1), 29-34.
Weisenberger, S. and Schumpe, A. (1996). "Estimation of gas solubilities in salt
solutions at temperatures from 273 K to 363 K". American Institute of Chemical
Engineers Journal, 42(1), 298-300.
Yan, S. P., Fang, M. X., et al. (2007). "Experimental study on the separation of CO2
from flue gas using hollow fiber membrane contactors without wetting". Fuel
Processing Technology, 88(5), 501-511.
3.A. Experimental kinetic data
The experimental 2CO flux in aqueous potassium threonate solutions, 2COJ , as a
function of the 2CO partial pressure for all the concentrations and temperatures studied
is presented in Tables 3.A1 to 3.A6 along with he maximum loading reached at the end
of each experiment, maxα . All experiments started with fresh solutions.
Table 3.A1 – Flux of 2CO in 3 M potassium threonate solutions as a function of the
2CO partial pressure, at 298 K.
( )2
210 PaCOP −× ( )2
4 -1 -210 mol s mCOJ × ⋅ ⋅ ( )2
-1CO Smol molmáxα ⋅
0.98 1.42 0.00067 2.62 3.41 0.0016 3.37 4.59 0.0021 7.97 8.02 0.0052 9.98 10.1 0.0067 18.8 16.0 0.0074 24.0 17.9 0.0089 48.8 26.3 0.013 73.0 29.1 0.014

95
Table 3.A2 – Flux of 2CO in 0.1 M potassium threonate solutions as a function of the 2CO partial pressure, at 293, 298 and 303 K.
293 K 298 K 303 K
( )2
210
Pa
COP −×
( )2
4
-1 -2
10
mol s m
COJ ×
⋅ ⋅ ( )
2
-1CO Smol mol
maxα
⋅
( )2
210
Pa
COP −×
( )2
4
-1 -2
10
mol s m
COJ ×
⋅ ⋅ ( )
2
-1CO Smol mol
maxα
⋅
( )2
210
Pa
COP −×
( )2
4
-1 -2
10
mol s m
COJ ×
⋅ ⋅ ( )
2
-1CO Smol mol
maxα
⋅
1.70 0.481 0.0059 1.57 0.312 0.0047 1.05 0.260 0.0036 3.52 0.921 0.012 2.06 0.522 0.0073 2.32 0.516 0.0073 6.22 1.62 0.021 4.14 0.973 0.017 3.84 1.03 0.021 10.7 1.76 0.041 6.97 1.52 0.020 7.48 1.64 0.026 12.7 2.02 0.044 12.5 2.29 0.029 20.0 3.26 0.038 15.8 2.31 0.042 17.0 2.79 0.043 32.0 4.20 0.048 26.3 2.95 0.035 42.4 4.17 0.051 57.5 5.06 0.049 51.2 4.15 0.045 68.5 4.86 0.064 106 5.63 0.091 75.8 4.01 0.054
Table 3.A3 – Flux of 2CO in 0.3 M potassium threonate solutions as a function of the 2CO partial pressure, at 293, 298 and 303 K.
293 K 298 K 303 K
( )2
210
Pa
COP −×
( )2
4
-1 -2
10
mol s m
COJ ×
⋅ ⋅ ( )
2
-1CO Smol mol
maxα
⋅
( )2
210
Pa
COP −×
( )2
4
-1 -2
10
mol s m
COJ ×
⋅ ⋅ ( )
2
-1CO Smol mol
maxα
⋅
( )2
210
Pa
COP −×
( )2
4
-1 -2
10
mol s m
COJ ×
⋅ ⋅ ( )
2
-1CO Smol mol
maxα
⋅
2.83 1.14 0.0051 2.43 1.13 0.0073 2.35 1.05 0.0078 3.73 1.54 0.0087 4.07 1.72 0.0094 4.64 2.15 0.015 5.57 2.31 0.011 7.10 2.86 0.018 7.69 3.38 0.017 15.6 5.11 0.025 12.5 4.58 0.023 20.3 6.80 0.046 25.6 6.94 0.031 17.8 6.01 0.032 32.5 9.69 0.048 50.5 9.35 0.043 42.0 9.52 0.044 57.1 12.3 0.060 75.5 10.3 0.048 67.3 11.8 0.064 95

96
Table 3.A4 – Flux of 2CO in 0.6 M potassium threonate solutions as a function of the 2CO partial pressure, at 293, 298 and 303 K.
293 K 298 K 303 K
( )2
210
Pa
COP −×
( )2
4
-1 -2
10
mol s m
COJ ×
⋅ ⋅ ( )
2
-1CO Smol mol
maxα
⋅
( )2
210
Pa
COP −×
( )2
4
-1 -2
10
mol s m
COJ ×
⋅ ⋅ ( )
2
-1CO Smol mol
maxα
⋅
( )2
210
Pa
COP −×
( )2
4
-1 -2
10
mol s m
COJ ×
⋅ ⋅ ( )
2
-1CO Smol mol
maxα
⋅
2.36 1.45 0.0037 3.68 2.09 0.0070 2.26 1.68 0.0075 3.27 2.06 0.0051 4.41 2.68 0.0088 4.33 3.23 0.012 3.91 2.42 0.0060 7.79 4.85 0.016 7.64 5.79 0.015 5.60 3.27 0.0081 12.9 6.95 0.023 19.7 10.8 0.038 15.5 7.70 0.019 17.8 9.03 0.028 32.9 15.7 0.042 25.6 10.9 0.027 43.4 16.4 0.042 57.5 20.3 0.052 75.3 18.1 0.045 68.2 20.3 0.048
Table 3.A5 – Flux of 2CO in 2 M potassium threonate solutions as a function of the 2CO partial pressure, at 293, 298 and 303 K.
293 K 298 K 303 K
( )2
210
Pa
COP −× ( )
2
4
-1 -2
10
mol s m
COJ ×
⋅ ⋅ ( )
2
-1CO Smol mol
maxα
⋅
( )2
210
Pa
COP −× ( )
2
4
-1 -2
10
mol s m
COJ ×
⋅ ⋅ ( )
2
-1CO Smol mol
maxα
⋅
( )2
210
Pa
COP −× ( )
2
4
-1 -2
10
mol s m
COJ ×
⋅ ⋅ ( )
2
-1CO Smol mol
maxα
⋅
3.12 2.82 0.0023 2.39 2.71 0.0030 2.49 3.18 0.0045 5.15 5.08 0.0043 5.21 5.06 0.0052 6.19 7.27 0.0057 7.45 6.81 0.0053 10.1 8.45 0.0087 11.5 13.5 0.0099 17.6 13.3 0.010 16.2 13.7 0.011 24.1 20.4 0.015 27.9 18.4 0.013 20.9 16.8 0.013 36.2 29.5 0.021 52.7 25.9 0.016 45.8 27.8 0.016 60.8 36.1 0.017 77.6 30.9 0.019 70.7 36.5 0.019
96
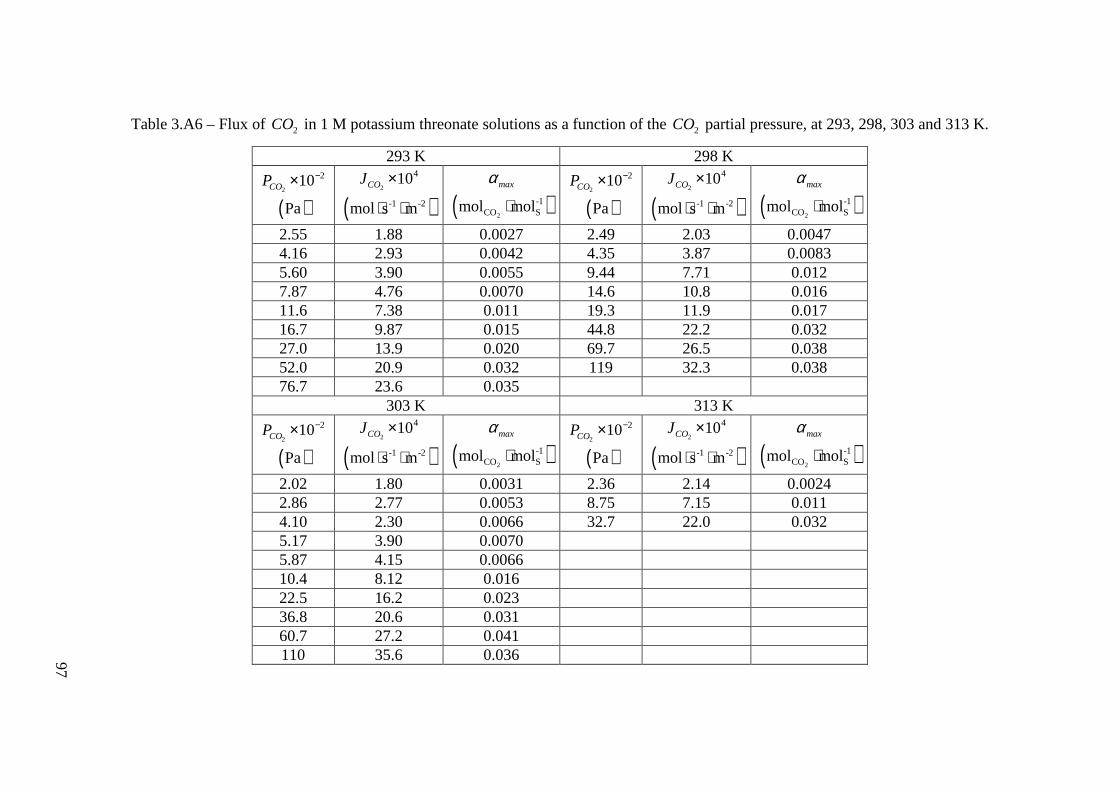
97
Table 3.A6 – Flux of 2CO in 1 M potassium threonate solutions as a function of the 2CO partial pressure, at 293, 298, 303 and 313 K.
293 K 298 K
( )2
210
Pa
COP −×
( )2
4
-1 -2
10
mol s m
COJ ×
⋅ ⋅ ( )
2
-1CO Smol mol
maxα
⋅
( )2
210
Pa
COP −×
( )2
4
-1 -2
10
mol s m
COJ ×
⋅ ⋅ ( )
2
-1CO Smol mol
maxα
⋅
2.55 1.88 0.0027 2.49 2.03 0.0047 4.16 2.93 0.0042 4.35 3.87 0.0083 5.60 3.90 0.0055 9.44 7.71 0.012 7.87 4.76 0.0070 14.6 10.8 0.016 11.6 7.38 0.011 19.3 11.9 0.017 16.7 9.87 0.015 44.8 22.2 0.032 27.0 13.9 0.020 69.7 26.5 0.038 52.0 20.9 0.032 119 32.3 0.038 76.7 23.6 0.035
303 K 313 K
( )2
210
Pa
COP −× ( )
2
4
-1 -2
10
mol s m
COJ ×
⋅ ⋅ ( )
2
-1CO Smol mol
maxα
⋅
( )2
210
Pa
COP −× ( )
2
4
-1 -2
10
mol s m
COJ ×
⋅ ⋅ ( )
2
-1CO Smol mol
maxα
⋅
2.02 1.80 0.0031 2.36 2.14 0.0024 2.86 2.77 0.0053 8.75 7.15 0.011 4.10 2.30 0.0066 32.7 22.0 0.032 5.17 3.90 0.0070 5.87 4.15 0.0066 10.4 8.12 0.016 22.5 16.2 0.023 36.8 20.6 0.031 60.7 27.2 0.041 110 35.6 0.036 97


Part III


101
4. Solubility of carbon dioxide in
aqueous solutions of amino acid salts 1
Abstract
The solubility of 2CO in aqueous solutions of potassium glycinate was measured in a
stirred reactor, at temperatures from 293 to 351 K, for amino acid salt concentrations
ranging between 0.1 and 3.0 M and 2CO partial pressures up to 46 10× Pa. 2CO
solubility in potassium threonate 1.0 M was also measured at 313 K. It was observed that
amino acid salt solutions can be very interesting for 2CO absorption purposes since they
present considerably high absorption capacities. Nevertheless, 2CO solubility in these
solutions does not change significantly for temperatures between 293 and 323 K, which
can be a draw back concerning the absorbent regeneration.
Potassium glycinate solubility data were interpreted using the thermodynamically sound
model proposed by Deshmukh and Mather (1981) and the empirical Kent and Eisenberg
(1976) model.
1 Portugal, A. F.; Sousa, J. L.; Magalhães, F. D.; Mendes, A., “Solubility of carbon dioxide in aqueous solutions of amino acid salts”, Chem. Eng. Sci., DOI: 10.1016/j.ces.2009.01.036

102
4.1. Introduction
The climate change due to the rising greenhouse gases concentrations in the atmosphere
became an unquestionable problem nowadays (Idem and Tontiwachwuthikul, 2006; IEA,
2008; UNFCCC, 2008). Since the Kyoto protocol, in December 1997, several stringent
environmental regulations are being proposed and recently (in January 2008) the
European Council (EC) stated as a key target to reduce 20 % greenhouse gases emissions
by 2020 (EC, 2008; Gibbins and Chalmers, 2008). Among the greenhouse gases, carbon
dioxide ( 2CO ) is the one released in larger extent by human activity (Idem and
Tontiwachwuthikul, 2006; UNFCCC, 2008), hence, much effort is being put on the
development of technologies for 2CO capture and storage. Three basic processes can be
applied for capturing 2CO from flue gases: oxyfuel combustion, pre-combustion, and
post-combustion (Idem and Tontiwachwuthikul, 2006; Metz et al., 2005). Although
apparently less efficient than pre- and oxyfuel combustion, post-combustion seems to be
the best solution to meet the exigent EC emission targets, because it can be easily
retrofitted to already existing equipment and power plants (Favre, 2007; Gibbins and
Chalmers, 2008).
Chemical absorption in liquid solutions is a proven technology for 2CO removal from a
variety of gas streams and it is considered the best available technology for post-
combustion flue gas treatment (Favre, 2007; Gibbins and Chalmers, 2008; Idem and
Tontiwachwuthikul, 2006). Nevertheless, the absorbent solutions commonly used
(alkanolamine solutions) undergo oxidative degradation, so they might not be suitable
for the specified separation due the high oxygen concentrations present in flue gas (Goff
and Rochelle, 2006; Hook, 1997; Supap et al., 2006). Because of their higher stability in
the presence of oxygen, growing interest is being given to amino acid salts solutions.
Amino acid salts are more resistant to oxidative degradation, have negligible volatilities
and their aqueous solution present viscosities and surface tensions similar to water (Holst
et al., 2006; Kumar et al., 2002; Kumar et al., 2003c; Portugal et al., 2007). Additionally,
they react with 2CO in the same way as alkanolamines, presenting therefore comparable
absorption kinetics and equilibrium capacities (Hook, 1997; Kumar et al., 2003b; Kumar
et al., 2003c; Portugal et al., 2007; Portugal et al., 2008; Song et al., 2006). Nevertheless,

103
precipitation of reaction products was observed during the absorption of 2CO in aqueous
solutions of amino acids salts (Hook, 1997; Kumar et al., 2003a).
Although amino acids are used for 2CO absorption in a number of industrial solutions
(Feron and Jansen, 2002; Kumar et al., 2003c), very few data are available in literature
for these systems. In the present work, the absorption capacity of potassium glycinate
towards 2CO is determined at different temperatures, using potassium glycinate aqueous
solutions with initial concentrations ranging from 0.1 to 3.0 -3mol dm⋅ and for 2CO
partial pressures up to 46 10× Pa. The absorption capacity of a solution of potassium
threonate, 1.0 -3mol dm⋅ , at 313 K was also measured for the same pressure range.
Several models are available in literature for representing the vapour – liquid equilibrium
in the 2CO – amines – water systems. They are basically divided into three types:
- Empirical models such as Kent and Eisenberg (1976) model, where the non-
idealities of the system are lumped in the equilibrium constants. Despite its
simplicity, the Kent-Eisenberg model has been successfully applied to a number
of 2CO absorption systems (Aroua and Salleh, 2004; Li and Shen, 1993; Park et
al., 2002; Tontiwachwuthikul et al., 1991) and has demonstrated to predict fairly
well the system behaviour for loadings between 0.2 and 0.7 -1mol mol2CO Amine⋅
(Kumar et al., 2003b; Weiland et al., 1993).
- Models based on the excess Gibbs energy, in which a term to account for the
electrostatic forces due to the presence of ions in solution is added to the
molecular Gibbs energy models. Examples of this approach are the Deshmukh
and Mather (1981) method, the electrolyte-NRTL model of Chen and Evans
(1986) and the models developed by Austgen et al. (1989) and Clegg and Pitzer
(1992).
- Models using an equation of state (EoS) to describe both liquid and vapour
phases. A term to account for the ionic interactions is also added to the molecular
EoS. Applications of the EoS models to 2CO absorption systems are quite recent.

104
Further details and applications can be found in the work of Fürst and Renon
(1993), Vallee et al. (1999), Li and Fürst (2000), Derks et al. (2005) and
Huttenhuis et al. (2008).
In the present work, two models are considered: the empirical Kent and Eisenberg (1976)
and the Deshmukh and Mather (1981). The model developed by Deshmukh and Mather
(1981) is thermodynamically sound and reasonably simple when compared to other
electrolyte-NRTL and EoS models. It considers the long-range electrostatic interactions
and short-range Van der Walls interactions between the chemical species to describe the
system non-idealities and is used with success to represent acid gases – amines – water
systems (Benamor and Aroua, 2005; Kumar et al., 2003b; Weiland et al., 1993;
HajiSulaiman et al., 1996; Liu et al., 1999; Ma'mun et al., 2006; Rascol et al., 1996;
Tobiesen et al., 2008).
4.2. Modelling
Amino acid salts containing a primary amine group (such as potassium glycinate and
potassium threonate) react with 2CO according to the following equilibrium reactions
(where 2R CH COO−≡ , for potassium glycinate):
Carbamate hydrolysis
2 2 3 RNHCOO H O RNH HCO− −+ + (1)
Amine deprotonation
3 2RNH RNH H+ ++ (2)
Bicarbonate formation
2 2 3CO H O HCO H− ++ + (3)
Carbonate formation
23 3HCO CO H− − ++ (4)
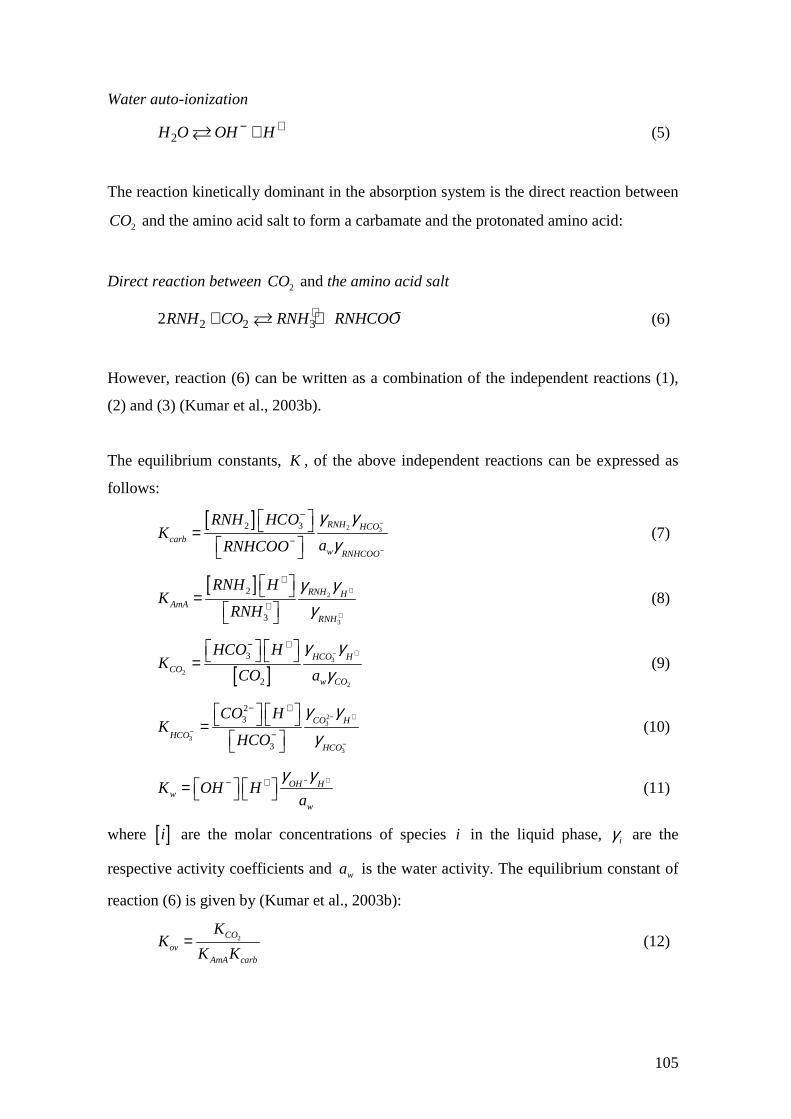
105
Water auto-ionization
2H O OH H− ++ (5)
The reaction kinetically dominant in the absorption system is the direct reaction between
2CO and the amino acid salt to form a carbamate and the protonated amino acid:
Direct reaction between 2CO and the amino acid salt
2 2 32RNH CO RNH RNHCOO+ −+ + (6)
However, reaction (6) can be written as a combination of the independent reactions (1),
(2) and (3) (Kumar et al., 2003b).
The equilibrium constants, K , of the above independent reactions can be expressed as
follows:
[ ]
2 32 3 RNH HCOcarb
w RNHCOO
RNH HCOK
aRNHCOO
γ γγ
−
−
−
−
=
(7)
[ ]
2
3
2
3
RNH HAmA
RNH
RNH HK
RNH
γ γγ
+
+
+
+
=
(8)
[ ]3
2
2
3
2
HCO HCO
w CO
HCO HK
CO a
γ γγ
− +− + = (9)
23
3
3
23
3
CO H
HCOHCO
CO HK
HCO
γ γγ
− +
−
−
− +
−
=
(10)
OH Hw
w
K OH Ha
γ γ− +− + = (11)
where [ ]i are the molar concentrations of species i in the liquid phase, iγ are the
respective activity coefficients and wa is the water activity. The equilibrium constant of
reaction (6) is given by (Kumar et al., 2003b):
2COov
AmA carb
KK
K K= (12)

106
Additionally to the equilibrium constants, the following mass conservation and charge
balance equations must be verified:
Amine mass balance
[ ] [ ]2 2 30RNH RNH RNHCOO RNH− + = + + (13)
CO2 mass balance
[ ] [ ] 22 2 3 30
RNH CO RNHCOO HCO COα − − − = + + + (14)
where α is the loading: moles of 2CO absorbed per mole of amino acid salt initially in
solution.
Charges balance
For amino acid salts, R is charged and, therefore, 2RNH is a mono-valent anion,
RNHCOO− is bivalent and 3RNH+ is neutral. The charge balance becomes then:
[ ] 22 3 32 2K H RNH RNHCOO HCO CO OH+ + − − − − + = + + + + (15)
Since the pressure range considered is always lower than 1× 10⁵ Pa, the vapour phase can
be considered ideal (Smith et al., 1996) and the vapour-liquid equilibrium is described by
the Henry Law:
[ ]2 2 2CO COP H CO= (16)
where 2COP is the 2CO partial pressure and
2COH is the Henry coefficient of 2CO in
potassium glycinate solutions, obtained experimentally in a previous work (Portugal et
al., 2007).
To account for the liquid non-idealities, the Deshmukh-Mather method (Deshmukh and
Mather, 1981) can be applied. The Deshmukh-Mather method uses the following
equation, originally proposed by Guggenheim (1935), to calculate the activity
coefficients:
[ ]2
,
2.303ln 2
1i
i i jj solvent
Az Ij
Ba Iγ β
≠
−= ++ ∑ (17)
107
The first term of equation (17) accounts for the long-range interactions between species
and is based on the Debye-Hückel theory. The solution ionic strength, I , is defined as:
[ ] 21
2 jj
I j z= ∑ (18)
where jz is the ion charge and [ j ] is the molar concentration of species j. The Debye-
Hückel limiting slope, A , and the parameter B depend on the temperature, T , and on
the dielectric constant of the solvent, ε , as follows (Kumar et al., 2003b):
( ) 3 261.825 10A Tε −= × (19)
( ) 1 250.3B Tε −= (20)
The dielectric constant of the solvent (water) is given by ( )80 0.4 293Tε = − −
(Knowlton, 1941). Parameter a roughly corresponds to the effective size of the hydrated
ions (Weiland et al., 1993). The second term of equation (17) accounts for the short-
range interactions between molecular and ionic solutes by means of the adjustable binary
interaction parameters, ,i jβ .
In the present absorption system, the following 10 species are present in solution: 2H O ,
2CO , 3HCO− , 23CO − , 2RNH , K + , 3RNH+ , RNHCOO− , H + and OH − . Excluding the
solvent ( 2H O ), there are still 9 species which short range interactions are to be taken
into account. This leads to 36 binary interaction parameters, ,i jβ , resulting in an
intractable problem. To make it manageable, Weiland et al. (1993) proposed the
following assumptions that reduce the number of binary interaction parameters needed to
be fit:
- All interactions between like charged ions are neglected;
- All self-interactions of molecular species are neglected, except for the molecular amine
(in the present case, the protonated amine: 3RNH+ );
- All interactions with water and its self-ionization products (H + and OH − ) are
neglected;
- All interactions with 2CO and 23CO − are neglected.
The number of interaction parameters is consequently reduced to 8:

108
3 3RNH HCO−− , 3 3RNH RNH+ +− , 3K HCO+ −− , 2K RNH+ − , 3 2RNH RNH+ − ,
3K RNH+ +− , K RNHCOO+ −− and 3RNH RNHCOO+ −− .
Instead, Kent and Eisenberg (1976) considered the liquid phase non-idealities lumped in
the equilibrium constants. In their model, the equilibrium constants are only functions of
the species concentrations (iγ =1) and carbK and AmAK are used as fitting parameters.
Therefore, the equilibrium constants carbK and AmAK obtained by this method are
apparent constants.
4.3. Experimental
The aqueous solutions of the amino acid salts were prepared by adding to the amino acid
an equimolar amount of potassium hydroxide ( )KOH in a volumetric flask filled up
with distilled and deionized water. The concentrations of the solutions were checked by
titration with a standard solution of HCl 1 M.
The set-up used to determine the solubility of 2CO is shown in Figure 4.1. It is
composed of two vessels with calibrated volumes, one for storing the 2CO (237.04 mL)
and the other for the absorbent solution (110.56 mL), which is magnetically stirred. The
temperature, T , is controlled by means of an in-house developed thermostatic closet and
a thermostatic bath that controls the jacket temperature of the absorbent reactor.
Figure 4.1 - Experimental set-up sketch.
109
Using a setup with lower dimensions than usually found in the literature (Derks et al.,
2005) allows for the use of small quantities of the amino acid salt solutions, even though
it implies larger relative errors in the determination of the equilibrium loadings
(estimated to be lower than 10 %).
A known volume (about 50 mL) of fresh solution of amino acid salt, solV , previously
degassed is transferred to the absorbent vessel. The vapour-liquid equilibrium is
established and the vapour pressure, vapourP , recorded (pressure sensor from Druck,
PMP4000; accuracy: ± 0.28 210× Pa). On the meantime, the gas vessel is filled with
2CO and the pressure recorded, 2 , 0
kCOP (pressure sensor from Druck, PMP4000;
accuracy: ± 1.6 210× Pa); pressure inside the gas vessel is always lower than 3 510× Pa.
After that, a certain amount of 2CO is transferred from the gas vessel to the absorbent
vessel and the pressure inside the gas vessel is again recorded, 2 ,
kCO finP . Once the
equilibrium is attained (this happens when the pressure becomes constant inside the
absorbent vessel) the pressure of the absorbent vessel is recorded, keqP . More 2CO is then
admitted from the gas vessel into the absorbent vessel and a new equilibrium value is
achieved. It is assumed that the solution vapor pressure does not change with loading and
the amount of 2CO absorbed is computed from the ideal gas law:
2 2
2, 2,
, 0 ,1k k
CO CO fink kCO add CO add GV
P Pn n V
RT− −
= + (21)
( )2, 2,
keq vapourk k
CO abs CO add AV sol
P Pn n V V
RT
−= − − (22)
where GVV and AVV are respectively the volumes of the gas and absorbent vessels. For
amino acid salt concentrations higher than the ones used in the present work, the
assumption of constant vapor pressure might become unrealistic for loadings higher than
0.5 2
-1CO Smol mol⋅ , because of the change on the liquid composition.
The loading, kα , corresponding to each 2CO partial pressure ( )2 ,
k kCO eq eq vapourP P P= − is
then calculated:
[ ]2,
2 0
kCO abs sol
k
n V
RNHα = (23)

110
Sub and super scripts k denote the experimental stage.
The small size of the setup used (stirred reactor: 110.56 mL, liquid volume 50 mL≈ and
gas vessel: 237.04 mL) enables the characterization of the amino acid salt solutions using
small quantities of reactant within an error that should be smaller than 10 %.
4.4. Results and Discussion
Experimental method validation
Before and after measuring the solubility of 2CO in potassium glycinate, the set up was
tested with 2.5 M aqueous solution of monoethanolamine (MEA) and the results
compared with the ones reported in literature (Jones et al., 1959; Lee et al., 1974; Lee et
al., 1976; Shen and Li, 1992) – please see Figure 4.2. Experimental values of the
solubility of 2CO in MEA solutions are presented in Table 4.1.
Figure 4.2 – Semi-log plot of the solubility of 2CO in aqueous solutions of MEA 2.5 M,
at 313 K - comparison with results from literature.

111
Table 4.1 - Solubility of 2CO in aqueous solutions of MEA 2.5 M.
Run 1 - 2.51 MMEAC = Run 2 - 2.43 MMEAC =
( )2
210
Pa
COP −× ( )
2
-1CO Smol mol
α
⋅ ( )2
210
Pa
COP −× ( )
2
-1CO Smol molα ⋅
2.03 0.173 2.82 0.233 3.95 0.331 10.2 0.471 21.1 0.491 211 0.621 414 0.635 628 0.678
2CO solubility in potassium glycinate
The experimental values of the solubility of 2CO in the potassium glycinate solutions are
shown in Tables 4.2 to 4.4. The results for 2CO solubility in a 1.0 -3mol dm⋅ potassium
glycinate solution are presented in Figure 4.3 and Figure 4.4 shows the results for a 3.0
-3mol dm⋅ solution.
Figure 4.3 – Semi-log plot of the experimental solubility of 2CO in aqueous solutions of
potassium glycinate, 1.0 -3mol dm⋅ - comparison with the results from Song et al. (2006)
for an aqueous solution of sodium glycinate 1.06 -3mol dm⋅ , at 313 and 323 K.

112
Table 4.2 - Experimental solubility of 2CO in aqueous solutions of potassium glycinate 0.1 M.
293 K 303 K 313 K 323 K
( )2
210
Pa
COP −× ( )
2
-1CO Smol mol
α
⋅ ( )2
210
Pa
COP −× ( )
2
-1CO Smol mol
α
⋅ ( )2
210
Pa
COP −× ( )
2
-1CO Smol mol
α
⋅ ( )2
210
Pa
COP −× ( )
2
-1CO Smol mol
α
⋅
0.85 Run 1 0.332 0.89 Run 1 0.318 0.54 Run 1 0.213 6.20 Run 1 0.650 2.55 Run 1 0.607 4.60 Run 1 0.728 1.57 Run 1 0.428 83.2 Run 1 1.096 18.7 Run 1 0.867 90.88 Run 1 1.129 4.09 Run 1 0.620 388 Run 1 1.289 71.4 Run 1 0.958 4.02 Run 2 0.692 16.52 Run 1 0.864 3.10 Run 2 0.471 639 Run 1 1.209 6.93 Run 2 0.778 60.47 Run 1 1.044 32.2 Run 2 0.953 6.88 Run 2 0.740 12.9 Run 2 0.868 208.46 Run 1 1.179 361 Run 2 1.294 396 Run 2 1.071 23.3 Run 2 0.949 624.47 Run 1 1.320 5.30 Run 3 0.462 40.7 Run 3 1.002 572 Run 2 1.357 16.1 Run 3 0.794 448 Run 3 1.205 112 Run 3 1.152
310 Run 3 1.309
112
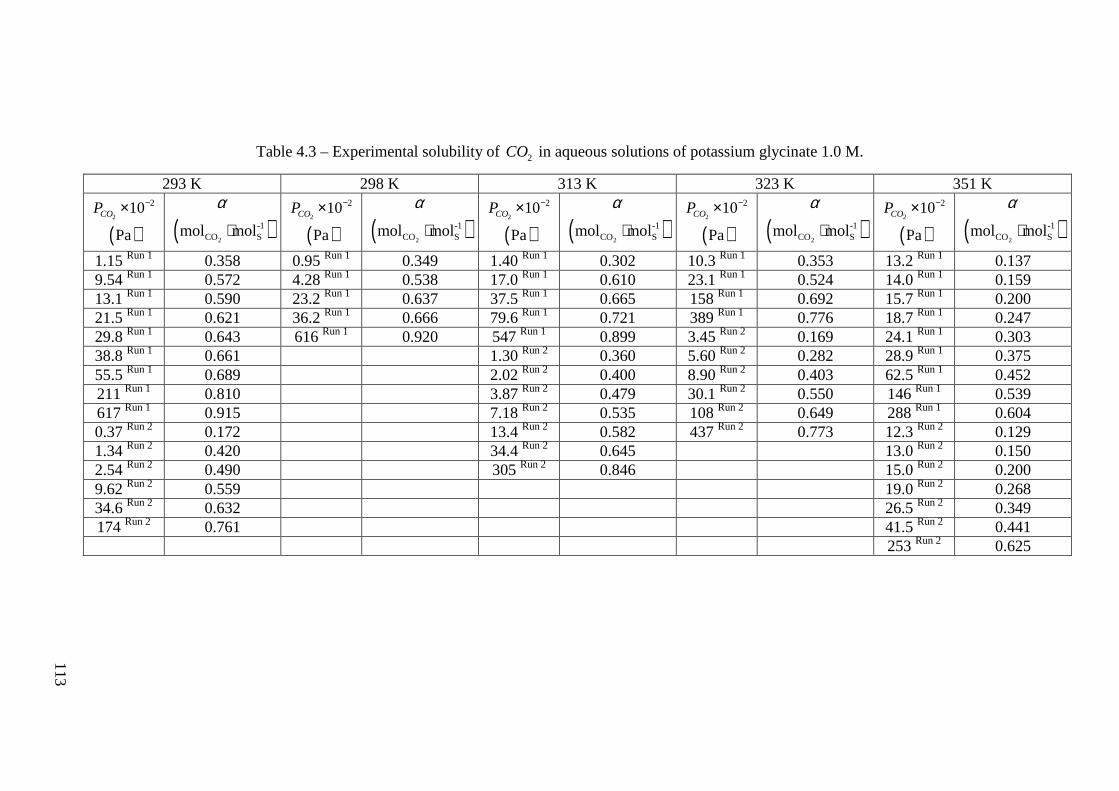
113
Table 4.3 – Experimental solubility of 2CO in aqueous solutions of potassium glycinate 1.0 M.
293 K 298 K 313 K 323 K 351 K
( )2
210
Pa
COP −× ( )
2
-1CO Smol mol
α
⋅ ( )2
210
Pa
COP −× ( )
2
-1CO Smol mol
α
⋅ ( )2
210
Pa
COP −× ( )
2
-1CO Smol mol
α
⋅ ( )2
210
Pa
COP −× ( )
2
-1CO Smol mol
α
⋅ ( )2
210
Pa
COP −× ( )
2
-1CO Smol mol
α
⋅
1.15 Run 1 0.358 0.95 Run 1 0.349 1.40 Run 1 0.302 10.3 Run 1 0.353 13.2 Run 1 0.137 9.54 Run 1 0.572 4.28 Run 1 0.538 17.0 Run 1 0.610 23.1 Run 1 0.524 14.0 Run 1 0.159 13.1 Run 1 0.590 23.2 Run 1 0.637 37.5 Run 1 0.665 158 Run 1 0.692 15.7 Run 1 0.200 21.5 Run 1 0.621 36.2 Run 1 0.666 79.6 Run 1 0.721 389 Run 1 0.776 18.7 Run 1 0.247 29.8 Run 1 0.643 616 Run 1 0.920 547 Run 1 0.899 3.45 Run 2 0.169 24.1 Run 1 0.303 38.8 Run 1 0.661 1.30 Run 2 0.360 5.60 Run 2 0.282 28.9 Run 1 0.375 55.5 Run 1 0.689 2.02 Run 2 0.400 8.90 Run 2 0.403 62.5 Run 1 0.452 211 Run 1 0.810 3.87 Run 2 0.479 30.1 Run 2 0.550 146 Run 1 0.539 617 Run 1 0.915 7.18 Run 2 0.535 108 Run 2 0.649 288 Run 1 0.604 0.37 Run 2 0.172 13.4 Run 2 0.582 437 Run 2 0.773 12.3 Run 2 0.129 1.34 Run 2 0.420 34.4 Run 2 0.645 13.0 Run 2 0.150 2.54 Run 2 0.490 305 Run 2 0.846 15.0 Run 2 0.200 9.62 Run 2 0.559 19.0 Run 2 0.268 34.6 Run 2 0.632 26.5 Run 2 0.349 174 Run 2 0.761 41.5 Run 2 0.441
253 Run 2 0.625
113

114
Table 4.4 – Experimental solubility of 2CO in aqueous solutions of potassium glycinate 3.0 M.
293 K 303 K 313 K 323 K
( )2
210
Pa
COP −× ( )
2
-1CO Smol mol
α
⋅ ( )2
210
Pa
COP −× ( )
2
-1CO Smol mol
α
⋅ ( )2
210
Pa
COP −× ( )
2
-1CO Smol mol
α
⋅ ( )2
210
Pa
COP −× ( )
2
-1CO Smol mol
α
⋅
1.61 Run 1 0.069 1.61 Run 1 0.075 3.73 Run 1 0.185 2.70 Run 1 0.088 1.90 Run 1 0.103 2.29 Run 1 0.131 8.23 Run 1 0.375 5.10 Run 1 0.144 2.59 Run 1 0.164 3.49 Run 1 0.190 10.3 Run 1 0.446 7.70 Run 1 0.213 3.25 Run 1 0.228 4.34 Run 1 0.228 24.9 Run 1 0.559 9.80 Run 1 0.283 4.60 Run 1 0.292 5.74 Run 1 0.255 1.94 Run 2 0.130 17.8 Run 1 0.363 8.27 Run 1 0.358 8.39 Run 1 0.293 5.34 Run 2 0.260 23.7 Run 1 0.438 10.2 Run 1 0.426 9.94 Run 1 0.327 8.09 Run 2 0.386 60.5 Run 1 0.532 14.9 Run 1 0.489 11.1 Run 1 0.361 15.6 Run 2 0.517 135 Run 1 0.572 45.0 Run 1 0.548 12.0 Run 1 0.394 188 Run 2 0.633 350 Run 1 0.620 168 Run 1 0.617 13.6 Run 1 0.437 326 Run 2 0.664 330 Run 1 0.661 19.3 Run 1 0.475
29.4 Run 1 0.505 53.6 Run 1 0.536 152 Run 1 0.588 381 Run 1 0.645
114

115
0.0 0.1 0.2 0.3 0.4 0.5 0.6 0.7
1
10
100
1000
10000
293 K - This work - run 1303 K - This work - run 1313 K - This work - run 1313 K - This work - run 2323 K - This work - run 1303 K - Song et al., 2006 313 K - Song et al., 2006 323 K - Song et al., 2006
( )2
-1CO Smol molα ⋅
( )2
210 PaCOP −×
Figure 4.4 – Semi-log plot of the experimental solubility of 2CO in 3.0 M aqueous
solutions of potassium glycinate - comparison with the results from Song et al. (2006)
for an aqueous solution of sodium glycinate 3.09 M, at 303, 313 and 323 K.
Surprisingly, no noticeable difference in the 2CO solubility was observed for
temperatures between 293 and 313 K. This behaviour is unusual in the absorption of
acid-gases in amine based solutions (Benamor and Aroua, 2005; Derks et al., 2005;
Ma'mun et al., 2006; Shen and Li, 1992). Only above 323 K differences start to be
noticeable and at 351 K there is a clear reduction on the solution absorption capacity.
The same trend was observed for the 3.0 M solutions and, for 0.1 M solutions, there were
no differences on the absorption capacity in the entire temperature range studied.
The measured 2CO solubility in 1.0 M potassium glycinate solutions does not differ
significantly from the data obtained by Song et al. (2006) for sodium glycinate 1.06 M,
at 313 and 323 K. Indeed, it should be expected that the absorption capacity of sodium
glycinate is similar to the potassium glycinate aqueous solution used in this work.
Contrarily to the results at 1.0 M, the absorption capacities determined at 3.0 M are not
in line with the results that Song et al. (2006) obtained for sodium glycinate. This can be
due to the difference in the salt cation. Although it is the glycinate anion that reacts with
2CO , the salt cation may start playing a significant role on the process at solution

116
concentrations as high as 3.0 M by modifying the ionic character of the solution.
According to the Guggenheim Equation (17), differences between the short-range
interactions of K + (from potassium glycinate) and Na+ (from sodium glycinate) with
the other ions present in solution would become more noticeable at higher
concentrations.
At high amino acid salt concentrations and high loadings, precipitation of reaction
products was observed by Hook (1997) and Kumar et al. (2003a). The latter authors
concluded that, most likely, the precipitate corresponds to the zwitterionic form of the
amino acid ( 3RNH+ ). They also found a relationship between the critical loading (the
loading at which reaction products start to precipitate), critα , and the solubility of the
zwitterionic form of the amino acid in solution, S :
[ ]2 0
crit
S
RNHα = (24)
Although precipitation was not visually detected during the absorption experiments in
the present work, the critical loading at 3.0 M concentrations was computed using the
solubility data of glycine in water obtained by Ferreira et al. (2004). The minimum
critical loading computed was 0.868 (corresponding to the temperature of 293 K) which
is above the maximum experimental loading at that temperature (0.661). This result
confirms that precipitation was unlikely to occur. Crystallization of the reaction product
3RNH+ would increase the amount of 2CO absorbed (and therefore the solution capacity)
due to the concentration decrease of this reaction product in the liquid phase (Kumar et
al., 2003a).
The effect of the amino acid salt concentration on the absorbent solution capacity at 313
K is shown in Figure 4.5. The loading is shown as a function of the 2CO equilibrium
partial pressure in linear scale. As expected, the loading for a given 2CO partial pressure
decreases with increasing amino acid salt concentration. The same trend was observed
for the other temperatures studied. The 2CO absorption capacity of potassium glycinate
at 313 K was compared to MEA at the same temperature. It was verified that, at that
temperature, potassium glycinate absorbs more than MEA, which is one of the most
widely used 2CO absorbents nowadays.

117
Figure 4.5 - Solution loading as a function of the 2CO equilibrium partial pressure in
aqueous solutions of potassium glycinate at 313 K - comparison with MEA at 2.5 M.
Solid lines are provided to make the figure clearer and do not correspond to theoretical
model results.
2CO solubility in potassium threonate
The absorption capacity of a 1.0 M potassium threonate solution, at 313 K, was also
measured and it is shown in Table 4.5 and Figure 4.6.
Table 4.5 – Experimental solubility of 2CO in aqueous solutions of potassium threonate
1.0 M and 313 K.
( )2
210
Pa
COP −× ( )
2
-1CO Smol mol
α
⋅
1.03 Run 1 0.092 2.28 Run 1 0.188 4.68 Run 1 0.292 8.78 Run 1 0.384 24.5 Run 1 0.479 62.5 Run 1 0.572 190 Run 1 0.674 420 Run 1 0.753

118
Figure 4.6 - Semi-log plot of the experimental solubility of 2CO in aqueous solutions of
potassium threonate and potassium glycinate with concentrations 1.0 M at 313 K.
Comparing the absorption capacity of both amino acid salts at the same solution
concentration, potassium glycinate presents a higher absorption capacity. Threonate has
a deprotonation equilibrium constant, AmAK , higher than glycinate (Perrin, 1965).
Additionally, the amine group is sterically hindered (Portugal et al., 2008), which makes
the carbamate (RNHCOO− ) formed less stable and consequently, carbK is expected to be
higher (although no values were found in literature for this equilibrium constant).
It is generally accepted that amines that form unstable carbamates (high carbK ) present
higher absorption capacities towards 2CO (Baek et al., 2000; Hook, 1997; Li and Chang,
1994; Seo and Hong, 1996). However, this is only true at high 2CO partial pressures
(Park et al., 2003; Sartori and Savage, 1983; Tontiwachwuthikul et al., 1991). On the
other hand, increasing AmAK causes a decrease in loading for the entire pressure range
(Sartori and Savage, 1983).
To clarify how the solution absorption capacities are influenced by the equilibrium
constants AmAK and carbK , the effect of changing these constants by a factor of 10 was

119
checked by simulation, using the Kent and Eisenberg model. The AmAK and carbK values
reported in literature for glycinate (Jensen et al., 1952; Perrin, 1965) – see Table 4.6 –
were used as reference. Results are shown in Figures 4.7 and 4.8.
Figure 4.7 – Effect of changing the carbamate hydrolysis and amine deprotonation
equilibrium constants independently on the predicted 2COP versus loading curves.
Figure 4.8 – Effect of changing the carbamate hydrolysis and amine deprotonation
equilibrium constants simultaneously on the predicted 2COP versus loading curves.

120
The simulated results confirm that increasing carbK alone leads to a mixed effect,
depending on the pressure range considered, as seen in Figure 4.7. On the other hand, the
simultaneous increase of both equilibrium constants, AmAK and carbK , causes a decrease
in loading for the entire pressure range, which is in agreement with what is
experimentally observed in the present work. A more complete analysis would require
knowledge of the carbamate hydrolysis equilibrium constant for threonate. Additionally,
ionic interactions must be considered in these systems and, since threonate and glycinate
anions are different in size and configuration, it is expectable that these interactions will
be different in each case.
Modelling
To model the 2CO absorption equilibrium in potassium glycinate solution, using the
Deshmukh-Mather method (Deshmukh and Mather, 1981), equilibrium constants of
reactions (1) to (5) and the Henry coefficient of 2CO in solutions need to be defined.
Table 4.6 shows the values of the equilibrium constants and Henry coefficient and
respective literature sources.
Table 4.6 – Equilibrium constants of reactions (1) to (5) and Henry coefficient of 2CO in
potassium glycinate solutions.
[ ]2
2
2 0,
log CO
CO w
HK RNH
H
=
62.1830980.111175K
T= − ( )-1M Portugal et al., 2007
( )2 , 7
exp 2044
3.54 10CO w
TH −
−=
× ( )-1 3Pa mol m Versteeg and Van Swaaij, 1988
2767.18exp 6.10312carbK
T
− = +
( )M Jensen et al., 1952
( )2exp 0.000237956 0.202203 61.6499AmAK T T= − + − ( )M Perrin, 1965
2
12092.1exp 36.7816ln 235.482COK T
T = − − +
( )M Benamor and Aroua, 2005
3
12431.7exp 35.4819ln 220.067
HCOK T
T−
= − − +
( )M Benamor and Aroua, 2005
13445.9exp 2.4773ln 140.932wK T
T = − − +
( )2M Benamor and Aroua, 2005

121
Kielland (1937) summarized the effective size of a set of hydrated ions, including the
ions existent in the studied system, except for the carbamate of glycine. Values of
parameter a , based on Kielland’s work are shown in Table 4.7.
Table 4.7 – Effective size of the hydrated ions, based on the work by Kielland (1937).
Ion H + OH − 3HCO− 23CO − 2RNH K + RNHCOO−
Parameter a 9 3.5 4 4.5 4.5 3
5 (estimated)
Kumar et al. (2003b) noticed that the ionic strength of the amino acid salt solutions do
not change significantly during 2CO absorption. For this reason, the long-range
interactions, KiLR , between ions will depend essentially on the solution initial
concentration - [ ]2 0I RNH≃ - and can be directly computed. Concerning the short-range
binary interactions, in reality, when substituting the activity coefficients on the
calculation of the equilibrium constants, only six independent parameters can be fitted:
[ ] ( )2 3
1 3 2exp 2carb Kcarb
RNH HCOK LR p RNH p K
RNHCOO
−+ +
−
= +
(25)
[ ] [ ]
( )3 3 4 5 22
3 5 1
exp 2AmA KAmA
p RNH p K p RNHRNH HK LR
RNH p p RNHCOO
+ ++
+ −
+ − = − −
(26)
[ ] ( )2
3
2 62
exp 2CO KCO
HCO HK LR p K
CO
− ++
= (27)
( )3
23
3 6
3
exp 2KHCOHCO
CO HK LR p K
HCO−
− ++
−
= − (28)
w KwK OH H LR− + = (29)
where the model parameters 1p to 6p are defined as:

122
( )( )( )( )
3 2 3
2 3
3 2 3 3
2 3
3 2
3
1 , ,
2 , , ,
3 , ,
4 , ,
5 ,
6 ,
RNH RNH RNH RNHCOO
RNH K HCO K RNHCOO K
RNH RNH RNH RNH
RNH K RNH K
RNH RNH
HCO K
p
p
p
p
p
p
β β
β β β
β β
β β
β
β
+ + −
+ − + − +
+ + +
+ + +
+
− +
= −
= + −
= −
= −
=
=
(30)
For each 2COP , the set of eight equations (1 vapour-liquid equilibrium equation, 5
reaction equilibrium constants and 2 mass balances) can be reduced to only 1 equation in
terms of the hydrogen ion concentration, H + :
[ ] [ ]
( )
( ) ( )
[ ] ( )( )
2
2 2
2 2 22 2 2 3
2 2 2
2 2 2
2 02 '0
2
' '
' '''
2
'2 0
'2 ' '
'
1
2
20
COCO CO
AmA carb
CO CO COCO CO CO HCOW
CO CO CO
carbcarb CO CO CO
AmA
RNH HRNH H
KH H P H
K K
K K P HK P HK
H H H
RNH K P H
KH K H K P H
K
−
++
+ +
+ + +
+ +
+ − + +
− − −
− = + +
(31)
where 'iK are the equilibrium constants expressed in terms of molar concentrations -
' ii
Ki Ki
KK
LR SR=
⋅ and KiSR denote the short-range interactions term. The correspondent
loading, modα , is computed using equation (14).
A global fit to all temperatures and concentrations was performed. The objective
function to be minimized was:
exp mod
expobjF
α αα−
=∑ (32)

123
The fitted parameters are presented in Table 4.8.
Table 4.8 – Model parameters fitted for the system potassium glycinate-water- 2CO
1p 2p 3p 4p 5p 6p
0.230 -0.877 0.0115 0.351 0.419 0.125
Unlike other amines or amino acids, the amine deprotonation equilibrium constant of
glycine, AmAK , found in literature seem to be very established and several authors
determined it with agreeing results – results summarized by Perrin (1965). However, the
equilibrium constant for the carbamate hydrolysis, carbK , available in the literature is
rather old (Jensen et al., 1952). The simple approach from Kent and Eisenberg (1976)
was also fit considering that:
0ln carb
AK K
T= + (33)
The same data range and objective function were used. The values of 0K and A
obtained were, respectively, -4.786 and 1792 K-1.
Results obtained with both models for the temperature of 293 K are presented in Figure
4.9 and Figure 4.10 shows the parity plot of the predicted and experimental loadings of
2CO in solution for all analysed data.
Figure 4.11 shows the species concentrations as a function of loading, obtained with the
Deskmukh-Mather model, for a 1.0 M solution at 313 K as a function of the loading.
Similar trends were obtained for all studied temperatures and initial amino acid salt
concentrations.

124
Figure 4.9 – Solubility of 2CO in potassium glycinate solutions at 293 K – experimental
values and model curves.
Figure 4.10 – Parity plot of the predicted and experimental loadings of 2CO in solution
for all data analysed.

125
Figure 4.11 – Species concentrations as a function of loading for a potassium glycinate
solution, 1.0 M, at 313 K obtained using the Deskmukh-Mather model. Note that points
are not experimental data but simulation results.
The average relative deviations presented by the Deskmukh-Mather (D&M) and the
Kent and Eisenberg (K&E) models are respectively 22 and 20 %. The error distribution
is shown in Figure 4.10. Apparently, the D&M is able to describe better the experimental
trends, although the K&E shows a lower average deviation. Globally, both models show
similar accuracies which is surprising since the D&M has 6 fitting parameters against the
2 from the K&E model.
Even though the relative deviations may be considered acceptable, Figure 4.9 clearly
shows that both fits can still be considerably improved. Several authors (Benamor and
Aroua, 2005; Ermatchkov et al., 2006; Ma'mun et al., 2006) considered in their
regressions various interaction parameters that were neglected in the present work
(including interactions with 2CO and 23CO − ). The species concentrations as a function of
loading shown in Figure 4.11 suggests that, in fact, 23CO − can be playing a role in the
absorption process and that 2CO concentration can become significant for very high
loadings. However, their concentrations are relatively low, for the loadings considered,
126
when compared to the other species in solution. Benamor and Aroua (2005) and
Ermatchkov et al. (2006) also suggest that the short-range interactions between ions are
temperature dependent. Nevertheless, regressing more than 6 parameters from the
presented data set would lead to unreliable results. For this reason, obtaining the
carbamate hydrolysis equilibrium constant, carbK , as well as some of the binary
interaction parameters, ,i jβ , independently would be a way to improve the prediction
results. Experiments at higher temperatures are also recommended.
4.5. Conclusions
The solubility of 2CO in potassium glycinate and potassium threonate solutions was
measured. The amino acid salts shown absorption capacities in the same order of
magnitude as MEA.
At moderately low temperatures – between 293 and 323 K – no difference was noticed in
the 2CO solubility at different temperatures. However, increasing temperature to about
351 K, the 2CO solubility decreases considerably. Experimental data at higher
temperatures will be very important to understand the dependence of 2CO solubility on
temperature. The temperature at which the solution needs to be heated to efficiently
desorb 2CO will define the amount of energy required for absorbent regeneration, which
will be determinant for the economical viability of the global process.
As observed for other amine based compounds (Benamor and Aroua, 2005; Kumar et al.,
2003b; Song et al., 2006), 2CO solubility in potassium glycinate solutions (expressed in
terms of loading) decreases with increasing potassium glycinate concentration.
2CO solubility in a 1.0 M potassium threonate solution at 313 K was also measured and
compared to potassium glycinate. The trend observed experimentally was qualitatively
confirmed by simulation. However, for a quantitative analysis, the carbamate hydrolysis
equilibrium constant of threonate needs to be determined and binary interactions
between ions should be considered.

127
2CO solubility in the potassium glycinate solutions was interpreted using the Deshmukh-
Mather thermodynamically sound model and the empirical Kent-Eisenberg model.
Although the average deviations between predicted and experimental loadings are lower
than 22 % for both models, the predictions can still be significantly improved. With this
purpose, it is suggested to determine independently the carbamate hydrolysis equilibrium
constant, carbK , and some of the binary interaction parameters, ,i jβ .
4.6. Nomenclature
[ ] Concentration, M
A Debye-Hückel limiting slope
a Parameter corresponding to the effective size of hydrated ions, Å
wa Water activity
B Parameter of equation (17)
H Henry coefficient, -1 3Pa mol m⋅ ⋅
I Ionic strength of the solution, -3mol dm⋅
k Experimental stage
K Equilibrium constants, expressed in terms of molarity
LR Long-range interactions
n Number of moles, mol
p Model parameters
2COP Carbon dioxide partial pressure, Pa
R Universal gas constant, -1 -1J mol K⋅ ⋅
S Solubility, M
SR Short-range interactions
T Temperature, K
V Volume, m3
z Ion charge
Greek symbols
α Loading, mol
CO2⋅ mol
S-1
,i jβ Short range interaction parameters

128
ε Dielectric constant of water, K-1
γ Activity coefficient
Subscripts
0 Initial
abs Absorbed
add Added
AV Absorbent vessel
eq Equilibrium
Exp Experimental
fin Final
GV Gas vessel
Mod Model
S Amino acid salt
SC Stirred cell
sol Solution
w Water
4.7. References
Aroua, M. K. and Salleh, R. M. (2004). "Solubility of CO2 in aqueous piperazine and its
modeling using the Kent-Eisenberg approach." Chemical Engineering & Technology,
27(1), 65-70.
Austgen, D. M., Rochelle, G. T., Peng, X. and Chen, C. C. (1989). "Model of Vapor
Liquid Equilibria for Aqueous Acid Gas Alkanolamine Systems Using the Electrolyte
NRTL Equation." Industrial & Engineering Chemistry Research, 28(7), 1060-1073.
Baek, J.-I., Yoon, J.-H. and Eum, H.-M. (2000). "Prediction of equilibrium solubility of
carbon dioxide in aqueous 2-amino-2-methyl-1,3-propanediol solutions." Korean Journal
of Chemical Engineering, 17(4), 484-487.
Benamor, A. and Aroua, M. K., (2005). "Modeling of CO2 solubility and carbamate
concentration in DEA, MDEA and their mixtures using the Deshmukh-Mather model."
Fluid Phase Equilibria, 231(2), 150-162.

129
Chen, C. C. and Evans, L. B., (1986). "A Local Composition Model for the Excess Gibbs
Energy of Aqueous-Electrolyte Systems." American Institute of Chemical Engineers
Journal, 32(3), 444-454.
Clegg, S. L. and Pitzer, K. S. (1992). "Thermodynamics of Multicomponent, Miscible,
Ionic-Solutions - Generalized Equations for Symmetrical Electrolytes." Journal of
Physical Chemistry, 96(8), 3513-3520.
Clegg, S. L., Pitzer, K. S. and Brimblecombe, P. (1992). "Thermodynamics of
multicomponent, miscible, ionic-solutions .2. Mixtures including unsymmetrical
electrolytes." Journal of Physical Chemistry, 96(23), 9470-9479.
Derks, P. W. J., Dijkstra, H. B. S., et al., (2005). "Solubility of carbon dioxide in aqueous
piperazine solutions." American Institute of Chemical Engineers Journal, 51(8), 2311-
2327.
Deshmukh, R. D. and Mather, A. E., (1981). "A Mathematical-Model for Equilibrium
Solubility of Hydrogen-Sulfide and Carbon-Dioxide in Aqueous Alkanolamine
Solutions." Chemical Engineering Science, 36(2), 355-362.
EC (2008). "Communication from the Commission to the European Parliament, The
Council, The European Economic and Social Committee and The Committee of the
Regions - 20 20 by 2020 Europe's climate change opportunity." E. Commission,
Commission of the European Communities.
Ermatchkov, V., Kamps, A. P. S., et al., (2006). "Solubility of carbon dioxide in aqueous
solutions of piperazine in the low gas loading region." Journal of Chemical and
Engineering Data, 51(5), 1788-1796.
Favre, E., (2007). "Carbon dioxide recovery from post-combustion processes: Can gas
permeation membranes compete with absorption?" Journal of Membrane Science, 294(1-
2), 50-59.
Feron, P. H. M. and Jansen, A. E. (2002). "CO2 separation with polyolefin membrane
contactors and dedicated absorption liquids: performances and prospects." Separation
and Purification Technology, 27(3), 231-242.

130
Ferreira, L. A., Macedo, E. A., et al., (2004). "Solubility of amino acids and diglycine in
aqueous-alkanol solutions." Chemical Engineering Science, 59(15), 3117-3124.
Furst, W. and Renon, H. (1993). "Representation of Excess Properties of Electrolyte-
Solutions Using a New Equation of State." American Institute of Chemical Engineers
Journal, 39(2), 335-343.
Gibbins, J. and Chalmers, H., (2008). "Preparing for global rollout: A 'developed country
first' demonstration programme for rapid CCS deployment." Energy Policy, 36(2), 501-
507.
Goff, G. S. and Rochelle, G. T., (2006). "Oxidation inhibitors for copper and iron
catalyzed degradation of monoethanolamine in CO2 capture processes." Industrial &
Engineering Chemistry Research, 45(8), 2513-2521.
Guggenheim, E. A., (1935). "The specific thermodynamic properties of aqueous
solutions of strong electrolytes." Philosophical Magazine, 19(127), 588-643.
HajiSulaiman, M. Z., Aroua, M. K. and Pervez, M. I. (1996). "Equilibrium concentration
profiles of species in CO2-alkanolamine-water systems." Gas Separation & Purification,
10(1), 13-18.
Holst, J., Politiek, P. P., et al. (2006). "CO2 capture from flue gas using amino acid salt
solutions." GHGT-8, NTNU VIDERE, Pav. A, Dragvoll, NO-7491 Trondheim, Norway.
Hook, R. J., (1997). "An investigation of some sterically hindered amines as potential
carbon dioxide scrubbing compounds." Industrial & Engineering Chemistry Research,
36(5), 1779-1790.
Huttenhuis, P. J. G., Agrawal, N. J., Solbraa, E. and Versteeg, G. F. (2008). "The
solubility of carbon dioxide in aqueous N-methyldiethanolamine solutions." Fluid Phase
Equilibria, 264(1-2), 99-112.
Idem, R. and Tontiwachwuthikul, P., (2006). "Preface for the special issue on the capture
of carbon dioxide from industrial sources: Technological developments and future
opportunities." Industrial & Engineering Chemistry Research, 45(8), 2413-2413.
IEA (2008). "International Energy Agency - http://www.iea.org/."

131
Jensen, A., Jensen, J. B., et al., (1952). "Studies on Carbamates .6. The Carbamate of
Glycine." Acta Chemica Scandinavica, 6(3), 395-397.
Jones, J. H., Froning, H. R., et al., (1959). "Solubility of Acidic Gases in Aqueous
Monoethanolamine." Journal of Chemical Engineering Data, 4(1), 85.
Kielland, J. (1937). "Individual activity coefficients of ions in aqueous solutions."
Journal of the American Chemical Society, 59, 1675-1678.
Kent, R. L. and Eisenberg, B., (1976). "Better Data for Amine Treating." Hydrocarbon
Processing, 55(2), 87-90.
Knowlton, A. E., (1941). "Standard handbook for electrical engineers" McGraw-Hill,
New York.
Kumar, P., Hogendoorn, J., et al., (2002). "New absorption liquids for the removal of
CO2 from dilute gas streams using membrane contactors." Chemical Engineering
Science, 57(9), 1639-1651.
Kumar, P., Hogendoorn, J., et al., (2003a). "Equilibrium solubility of CO2 in aqueous
potassium taurate solutions: Part 1. Crystallization in carbon dioxide loaded aqueous salt
solutions of amino acids." Industrial & Engineering Chemistry Research, 42(12), 2832-
2840.
Kumar, P., Hogendoorn, J., et al., (2003b). "Equilibrium solubility of CO2 in aqueous
potassium taurate solutions: Part 2. Experimental VLE data and model." Industrial &
Engineering Chemistry Research, 42(12), 2841-2852.
Kumar, P., Hogendoorn, J., et al., (2003c). "Kinetics of the reaction of CO2 with aqueous
potassium salt of taurine and glycine." American Institute of Chemical Engineers
Journal, 49(1), 203-213.
Lee, J. I., Otto, F. D., et al., (1974). "Solubility of Mixtures of Carbon-Dioxide and
Hydrogen-Sulfide in Aqueous Diethanolamine Solutions." Canadian Journal of Chemical
Engineering, 52(1), 125-127.

132
Lee, J. I., Otto, F. D., et al., (1976). "Equilibrium in Hydrogen Sulfide
Monoethanolamine-Water System." Journal of Chemical and Engineering Data, 21(2),
207-208.
Li, C. X. and Furst, W. (2000). "Representation of CO2 and H2S solubility in aqueous
MDEA solutions using an electrolyte equation of state." Chemical Engineering Science,
55(15), 2975-2988.
Li, M. H. and Shen, K. P. (1993). "Calculation of Equilibrium Solubility of Carbon-
Dioxide in Aqueous Mixtures of Monoethanolamine with Methyldiethanolamine." Fluid
Phase Equilibria, 85, 129-140.
Li, M. H. and Chang, B. C. (1994). "Solubilities of Carbon-Dioxide in Water Plus
Monoethanolamine Plus 2-Amino-2-Methyl-1-Propanol." Journal of Chemical and
Engineering Data, 39(3), 448-452.
Liu, H. B., Zhang, C. F. and Xu, G. W. (1999). "A study on equilibrium solubility for
carbon dioxide in methyldiethanolamine-piperazine-water solution." Industrial &
Engineering Chemistry Research, 38(10), 4032-4036.
Ma'mun, S., Jakobsen, J. P., Svendsen, H. F. and Juliussen, O. (2006). "Experimental
and modeling study of the solubility of carbon dioxide in aqueous 30 mass % 2-((2-
aminoethyl)amino)ethanol solution." Industrial & Engineering Chemistry Research,
45(8), 2505-2512.
Metz, B., Davidson, O., et al. (2005). "IPCC Special Report on Carbon Dioxide Capture
and Storage." C. U. Press. Cambridge, New York, Melbourne, Madrid, Cape Town,
Singapore, São Paulo, Intergovernmental Panel on Climate Change.
Park, J. Y., Yoon, S. J. and Lee, H. (2003). "Effect of steric hindrance on carbon dioxide
absorption into new amine solutions: Thermodynamic and spectroscopic verification
through solubility and NMR analysis." Environmental Science & Technology, 37(8),
1670-1675.
Park, S. H., Lee, K. B., Hyun, J. C. and Kim, S. H. (2002). "Correlation and prediction of
the solubility of carbon dioxide in aqueous alkanolamine and mixed alkanolamine
solutions." Industrial & Engineering Chemistry Research, 41(6), 1658-1665.

133
Perrin, D. (1965). "Dissociation Constants of Organic Bases in Aqueous Solutions."
Butterworth, London.
Portugal, A. F., Derks, P. W. J., et al., (2007). "Characterization of potassium glycinate
for carbon dioxide absorption purposes." Chemical Engineering Science, 62(23), 6534-
6547.
Portugal, A. F., Magalhães, F. D., et al., (2008). "Carbon dioxide absorption kinetics in
potassium threonate." Chemical Engineering Science, 63(13), 3493-3503.
Rascol, E., Meyer, M. and Prevost, M. (1996). "Simulation and parameter sensitivity
analysis of acid gas absorption into mixed alkanolamine solutions." Computers &
Chemical Engineering, 20, S1401-S1406.
Sartori, G. and Savage, D. W. (1983). "Sterically Hindered Amines for CO2 Removal
from Gases." Industrial & Engineering Chemistry Fundamentals, 22(2), 239-249.
Seo, D. J. and Hong, W. H. (1996). "Solubilities of carbon dioxide in aqueous mixtures
of diethanolamine and 2-amino-2-methyl-1-propanol." Journal of Chemical and
Engineering Data, 41(2), 258-260.
Shen, K. P. and Li, M. H., (1992). "Solubility of Carbon-Dioxide in Aqueous Mixtures
of Monoethanolamine with Methyldiethanolamine." Journal of Chemical and
Engineering Data, 37(1), 96-100.
Smith, J. M., Ness, H. C. V., et al., (1996). "Introduction to chemical engineering
thermodynamics." McGraw-Hill, Singapore.
Song, H. J., Lee, S., et al., (2006). "Solubilities of carbon dioxide in aqueous solutions of
sodium glycinate." Fluid Phase Equilibria, 246(1-2), 1-5.
Supap, T., Idem, R., et al., (2006). "Analysis of monoethanolamine and its oxidative
degradation products during CO2 absorption from flue gases: A comparative study of
GC-MS, HPLC-RID, and CE-DAD analytical techniques and possible optimum
combinations." Industrial & Engineering Chemistry Research, 45(8), 2437-2451.
134
Tobiesen, F. A., Juliussen, O. and Svendsen, H. F. (2008). "Experimental validation of a
rigorous desorber model for CO2 post-combustion capture." Chemical Engineering
Science, 63(10), 2641-2656.
Tontiwachwuthikul, P., Meisen, A. and Lim, C. J. (1991). "Solubility of CO2 in 2-
Amino-2-Methyl-1-Propanol Solutions." Journal of Chemical and Engineering Data,
36(1), 130-133.
UNFCCC (2008). "United Nations Framework Convention on Climate Change -
http://unfccc.int. "
Vallee, G., Mougin, P., Jullian, S. and Furst, W. (1999). "Representation of CO2 and
H2S absorption by aqueous solutions of diethanolamine using an electrolyte equation of
state." Industrial & Engineering Chemistry Research, 38(9), 3473-3480.
Versteeg, G. F. and Van Swaaij, W. P. M., (1988). "Solubility and Diffusivity of Acid
Gases (CO2, N2O) in Aqueous Alkanolamine Solutions." Journal of Chemical and
Engineering Data, 33(1), 29-34.
Weiland, R. H., Chakravarty, T., et al., (1993). "Solubility of Carbon-Dioxide and
Hydrogen-Sulfide in Aqueous Alkanolamines. " Industrial & Engineering Chemistry
Research, 32(7), 1419-1430.

Part IV


137
5. Carbon dioxide removal from
anaesthetic gas circuits using hollow
fiber membrane contactors with amino
acid salt solutions 1
Abstract
A novel technology, based on the use of hollow fiber membrane contactors with
regenerable liquid absorbents is proposed for the carbon dioxide removal from
anaesthetic closed breathing circuits. To analyse the performance of the contactor for
this specific application and the influence of the system parameters, a 2 D numerical
model was developed for the transport of 2CO through the hollow fibers. The model
considered potassium glycinate solutions as absorbents and a composite membrane,
made of a porous support layer and a dense thin layer. Both co- and counter-current
operations were studied. The model results were compared to results obtained with
conventional mass transfer models, valid for limit conditions, and a good agreement
was found. The analysis performed indicates that the use of hollow fiber membrane
contactors with amino acid salt absorbent solutions is suitable for 2CO removal from
closed anaesthetic circuits. Contactor design and operating conditions are suggested.
1 Portugal, A. F.; Magalhães, F. D.; Mendes, A., “Carbon dioxide removal from anaesthetic gas circuits using hollow fiber membrane contactors with amino acid salt solutions”, submitted to J. Memb. Sci.

138
5.1. Introduction
Low flow or closed loop anaesthesia is a current clinical practice that consists in feeding
back to the patient (in the subsequent inhalation) the unused anaesthetic gas stream
(Baum and Woehlck, 2003). In such systems, 2CO needs to be continuously removed
from the breathing circuit. For this purpose, mixtures of alkali hydroxides are
commonly used as absorbents (Baum and Woehlck, 2003). However, all halogenated
volatile anaesthetics react with conventional 2CO absorbents when these become
accidentally desiccated, resulting in toxic compounds such as carbon monoxide and the
so called compound A (Baum and Woehlck, 2003; Fan et al., 2008; Knolle and Gilly,
2000; Whalen et al., 2005). In addition, the spent absorbents are contaminated hospital
waste, therefore requiring specific and expensive treatments (Mendes, 2000).
Hollow fiber membrane contactors with renewable liquid absorbents can be an
attractive technology to perform the 2CO removal from respiratory circuits in
anaesthesia machines, as sketched in Figure 5.1 (Mendes, 2000; Portugal et al., 2007).
Because of the absence of interpenetration of the gaseous and liquid phases, membrane
contactors overcome a number of operational limitations, common in other sorts of
contactors, and enable aseptic operation, making the process suitable for the required
application (Gabelman and Hwang, 1999; Li and Chen, 2005).
In absorbent membrane contactors, the selectivity is mostly provided by the liquid and
the driving force for the mass transfer is the concentration gradient between gas and
liquid phases (Gabelman and Hwang, 1999; Li and Chen, 2005). Therefore, the
membrane works as a phase separator and should impose the least possible resistance to
mass transfer. Hence, porous membranes with gas filled pores are usually used (Boucif
et al., 2008; Feron and Jansen, 2002; Sea et al., 2002; Zhang and Cussler, 1985).
However, for the proposed application, the membranes must also block the possible
passage of pathogenic microorganisms from the breathing circuit to the absorbent
solution and the subsequent transmission to the next patient under surgery. A possible
strategy to meet this demand is the use of supported dense polymer membranes as
suggested by Kreulen et al. (1993b) for other applications. Although the dense coating

139
imposes an extra resistance to mass transfer, it also prevents the pores from wetting,
independently of the liquid surface tension and contact angle (Kreulen et al., 1993b).
Figure 5.1 – Sketch of a closed anaesthetic breathing circuit using hollow fiber
membrane contactors for 2CO removal.
Chemical absorption in reactive liquids (usually aqueous solutions of alkanolamines) is
an established technology to perform 2CO separation from a variety of gas mixtures
(Idem and Tontiwachwuthikul, 2006; Ma'mun et al., 2007). However, alkanolamines
may undergo oxidation in environments with high oxygen concentrations (Goff and
Rochelle, 2006; Hook, 1997; Supap et al., 2006). Therefore other absorbent systems are
being developed, namely aqueous solutions of amino acid salts (Feron and Jansen,
2002; Hamborg et al., 2007; Kumar et al., 2002; Portugal et al., 2008; Song et al.,
2006). These solutions are much more resistant to oxidative degradation, are more
thermally stable, present lower volatilities and higher surface tensions and have
densities and viscosities similar to water. Besides, when compared to alkanolamines,
they present similar reaction equilibrium and kinetics (Feron and Jansen, 2002;
Hamborg et al., 2007; Kumar et al., 2002; Portugal et al., 2008; Song et al., 2006). An
important drawback may be related to precipitation of the reaction products, which has
been reported for high amino acid salt concentrations and high loadings (Hook, 1997;
Kumar et al., 2003c; Majchrowicz et al., 2006). This can result in the blockage of the

140
membrane pores (if porous membranes are to be used) and originate hydrodynamic
problems when small fiber diameters are used.
In the present work, a 2D numerical model is developed to describe the 2CO absorption
in amino acid salt solutions. A membrane contactor is considered, with the absorbent
flowing in the hollow fibers bore, and with the gas flowing in the shell side. Both co-
and counter-current operations are considered. To validate the model, simulation results
are compared to results obtained by conventional mass transfer models, at limit
conditions where these are applicable.
For the anaesthetic closed loop simulations, the permeability properties of a composite
PDMS (polydimethylsiloxane) membrane and of aqueous absorbent solutions of
potassium glycinate were used. Specific aspects of this system such as the extra
resistance imposed by the membrane coating, the reaction mechanism and the
absorption equilibrium of 2CO in potassium glycinate are taken into account in the
simulations. The performance of the contactor is analysed and the influence of the
packing density, fiber length, liquid flow rate and solution concentration on the
separation achieved is evaluated.
5.2. Mass Transfer with Chemical Reaction
5.2.1. Chemical reaction
Alkali salts of primary amino acids present identical reactions towards 2CO as primary
alkanolamines (Kumar et al., 2003a). 2CO reacts with aqueous solutions of primary
alkanolamines forming carbamates, bicarbonates and carbonates (Caplow, 1968) and
the first reaction taking place is the formation of the carbamate or an intermediate
(Hook, 1997; Sartori and Savage, 1983):
2 2 32RNH CO RNHCOO RNH− ++ + (1)
It is generally accepted that reaction (1) occurs according to the zwitterion mechanism
(Caplow, 1968). Zwitterion mechanism considers the following reaction steps:

141
Formation of the zwitterion
2
12 2 2
k
kRNH CO RNH COO
−
+ −→+ ← (2)
Deprotonation of the zwitterion by a base
2B
B
k
i ikRNH COO B RNHCOO B H
−
+ − − +→+ +← (3)
where iB are the bases present in solution able to deprotonate the zwitterion, which
includes the amine itself (Blauwhoff et al., 1984; Portugal et al., 2007). Based on the
quasi-steady-state condition for the zwitterion concentration, the following expression
for the rate of 2CO absorption can be written:
2 2
2
1
2
1
2 2
1
i i
i i
i i
B B Hi
CO RNH RNHCOOB B
iCO
B Bi
k Ck
C C Ck k C
Sk
k k k C
+
−
−−
−
−
=+
∑
∑
∑
(4)
Considering that the amine is playing the main role on the zwitterion deprotonation, the
kinetic constants of reactions (2) and (3) can be related to the equilibrium constant of
reaction (1), ovK , as follows:
2
1
i
i
Bov
B
kkK
k k− −
= (5)
Substituting equation (5) in (4) and since, for primary amines, the deprotonation of the
zwiteterion is relatively fast when compared to the backward rate of reaction (2)
( 1 1i iB B
i
k
k c− <<
∑), the following expression for the rate of 2CO absorption results:
3
2 2 2
2
22
RNHCOO RNHCO CO RNH
ov RNH
C CkS k C C
K C
− +
= − (6)
And, according to reaction (1), the rate of consumption of the amino acid is given by:
2 2
2RNH COS S= (7)

142
5.2.2. Analogy to conventional mass transfer models
The process of mass transfer of a gaseous solute A in a membrane contactor includes
the following steps: diffusion from the gas bulk to the outer membrane surface,
diffusion trough the membrane pores, diffusion and sorption in the dense layer (if
coated membranes are used) and dissolution and diffusion in the liquid accompanied (or
not) by chemical reaction (Li and Chen, 2005). Then, the local flux of A into the liquid,
AJ , can be expressed by the following equation:
A ov AJ k C= ∆ (8)
where AC∆ is the concentration gradient between gas and liquid phases and ovk is the
overall mass transfer coefficient that, relating to the resistance in series model, is given
as follows:
liquid phase resistencemembrane resistencegas phase resistence
1 1 1 1
ov g m Lk k k mk E= + + (9)
Usually, the gas phase mass transfer resistance needs to be obtained empirically and is
very specific of the type of module used (Gabelman and Hwang, 1999). If porous non-
wetted membranes are used, the mass transfer resistance due to the membrane is usually
negligible. However, when using coated membranes, membrane resistance needs to be
accounted for. Even in these cases, generally, the liquid phase mass transfer resistance
controls the process.
There are a number of mass transfer models to describe the absorption of a gas into a
liquid under well-mixed bulk conditions (Danckwerts, 1970). Since the flow along a
hollow fiber is usually laminar (given its small diameter) there is a velocity profile
across the entire fiber radius. Therefore, a well-mixed bulk cannot be considered
(Dindore et al., 2005a; Kreulen et al., 1993b; Kumar, 2002). However, there are limiting
situations where the analogy to conventional mass transfer models is possible (Elk et al.,
2007; Knaap et al., 2000; Kreulen et al., 1993a; Kreulen et al., 1993b; Kumar et al.,
2003d).

143
Concerning the physical absorption of a gas with constant composition into a liquid, the
following applies (Dindore et al., 2005a):
( ), ,A L A int A bulkJ k C C= − (10)
where ,A intC is the interfacial concentration and, ,A bulkC is the concentration of A in the
liquid bulk.
Making the analogy to heat transfer models, Kreulen et al. (1993a) proposed an
approximate solution to compute the mass transfer coefficient, Lk , when the liquid is
flowing laminarly (with fully developed velocity profile) along the fiber lumen:
3 3 33.67 1.62Sh Gz= + (11)
where Sh and Gz are the dimensionless Sherwood and Graetz numbers.
For the same flow conditions ,A bulkC can be approximated by the average mixing cup
concentration of A over the length of the fiber, ,A LC . Considering a lean liquid entering
a hollow fiber with diameter d , the mixing cup concentration at the axial distance z
from the liquid inlet, ,A zC , is given by (Kreulen et al., 1993a):
, ,
41 exp L
A z A int
k zC C
v d
= − −
(12)
Integrating ,A zC over the fiber length, the average mixing cup concentration of A is
obtained (Dindore et al., 2005a; Kumar, 2002):
, , ,
4exp 1
4L
A L A int A intL
L kv dC C C
L k v d
= + − −
(13)
where L is the fiber length and v is the liquid velocity.
The approximation proposed by Kreulen et al. (1993a) was experimentally validated
and shown to be applicable over the entire range of laminar flow.
In the case of plug flow, according to the penetration theory, the mass transfer
coefficient is given by (Bird et al., 2002):
2 AL
D vk
Lπ= (14)

144
being AD the diffusion coefficient of the absorbing gaseous component A .
When the gas absorption is accompanied by chemical reaction, an enhancement factor,
E , is introduced in the calculation of the absorption flux (Dindore et al., 2005a):
( ), ,A L A int A bulkJ E k C C= − (15)
Generally, the enhancement factor is a function of the dimensionless Hatta number,
Ha , and the infinite enhancement factor, E∞ , which for a general reaction
ProductsA BA Bν ν+ → , with reaction rate expression ,m n
A m n A BS k C C= , are defined as:
1
, , ,n m
m n B bulk A int A
L
k C C DHa
k
−
= (16)
,
,
1q
B bulk B A
B A int A B
C D DE
C D Dν∞
= +
(17)
being ,m nk the reaction kinetic constant, ,B bulkC the reactant concentration in the liquid
bulk and BD the diffusion coefficient of reactant B in the liquid. The value of q
depends on the mass transfer model chosen, being 0 for the film model, 1/2 for the
penetration model and 1/3 for the Leveque model (which accounts for the presence of a
velocity gradient in the mass transfer zone).
Based on the surface renewal theory, DeCoursey (1974) developed an explicit
expression to calculate the enhancement factor of a second order irreversible reaction
( ProductsA BA Bν ν+ → with 2A A BS k C C= ):
( ) ( )22 4
2 12 1 14 1
E HaHa HaE
E EE∞
∞ ∞∞
= − + + +− −−
(18)
The DeCoursey approximation proved to accurately predict the enhancement factors
over a wide range of process conditions (Van Swaaij and Versteeg, 1992).
According to the film theory, Secor and Beutler (1967) derived an equation for the
infinite enhancement factor, including reversibility, of the following general absorption
reaction:

145
A B C DA B C Dν ν ν ν+ + (19)
The expression from Secor and Beutler (1967) was later adapted by Hogendoorn et al.
(1997) to make it more compatible with the penetration and surface renewal theories
(Derks et al., 2006):
( )( )
, ,
, ,
1 A C int C bulk C
AC A int A bulk
C C DE
DC C
νν∞
−= +
− (20)
The concentration of the product C at the interface, ,C intC can be computed using the
following equations (Derks et al., 2006):
( ), , , ,CB
B int B bulk C bulk C intC B
DC C C C
D
νν
= + − (21)
( ), , , ,CD
D int D bulk C bulk C intC D
DC C C C
D
νν
= − − (22)
, ,
, ,
C D
A B
C int D intov
A int B int
C CK
C C
ν ν
ν ν= (23)
Equations (18) and (20) can then be combined to compute the enhancement factor for
reversible reactions (Hogendoorn et al., 1997).
For short gas-liquid contact times, penetration depth of the gas into the liquid is smaller
than the fiber radius and the liquid can be considered of infinite depth (Kumar et al.,
2003b). For this situation, the centreline concentration of the liquid reactant remains
essentially constant and the analogy to the reported models can be made based on the
fiber inlet conditions (Kumar et al., 2003b), that is , ,B bulk B feedC C≈ .
Although the applicability of the analogies to conventional mass transfer models covers
a wide range of asymptotic conditions, for reactive absorption, small fiber diameters and
large contact times, the depletion of the reactant along the fiber axis might become
significant and a model based on first principles is required to accurately predict the
absorption flux (Dindore et al., 2005a; Kreulen et al., 1993b; Kumar et al., 2003b;
Kumar, 2002). Besides, for unequal diffusivities of the species involved in the reaction,
the approximations tend to deviate from the real solution, even when a well-mixed bulk

146
is present (Hogendoorn et al., 1997). Finally, to assess axial gradients in gas phase
velocity and composition, a coupled differential model for both gas and liquid phases
must be solved.
5.2.3. Mathematical model
Numerous models for the mass transfer in hollow fiber absorbent membrane contactors,
with the liquid flowing in the fibers lumen, have been proposed and solved. Among
these, some consider the governing equations for both gas and liquid phases (Al-
Marzouqi et al., 2008; Coker et al., 1998; Dindore et al., 2005b; Hoff et al., 2004;
Keshavarz et al., 2008; Zhang et al., 2006). Other works, on the other hand, are focused
on the liquid phase, assuming uniform gas velocity and concentration along the
contactor’s axial coordinate (Bao and Trachtenberg, 2005; Boucif et al., 2008; Chen et
al., 2007; Kumar et al., 2002; Li and Chen, 2005; Paul et al., 2007; Wang et al., 2004).
Since, in the present work, one is concerned with the 2CO concentration in the outlet
gas stream, and not just with the global amount of 2CO removed, the model considered
integrates both gas and liquid phases, being 1D for the gas and 2D for the liquid. The
unsteady state model was developed with the following main assumptions: negligible
temperature effects (Kumar, 2002), negligible pressure drop in both shell and lumen and
applicability of the Henry law (Zhang et al., 2006).
Assuming plug flow, ideal gas behaviour and constant feed pressure in the gas phase,
the following mass balances can be written:
Partial gas phase mass balance
( )
, , ,21
iig T g T i m
uyyC f C N
t z
εε
∂∂ = −∂ ∂ −
(24)
Total gas phase mass balance
,21 i m
i
uf N
z
εε
∂ =∂ − ∑ (25)
with initial and boundary conditions:

147
Initial condition
0t = , ,0i iy y=
Axial boundary condition
,
,
co-current: 0, and
counter-current: , and i i feed feed
i i feed feed
z y y u u
z L y y u u
= = =
= = =
where iy is the gas molar fraction of component i , ,g TC is the total molar
concentration, which, for ideal gas behaviour is given by ( ),g TC P RT= , where P is
the operation pressure, R is the ideal gas constant and T is the temperature; u is the
gas velocity, ε is the module packing density, defined as 2 2inner shellnR R , being n the
number of fibers, innerR the fibber inner radius and shellR the shell internal radius; f
assumes the value of 1 or -1, respectively, for counter- or co-current operation. The flux
of the gaseous component i across the membrane, ,i mN , is given by:
,,
, ,inner
i L Ri exti m i g T
inner i
CkN y C
R m
= −
(26)
where and ,i extk is the external mass transfer coefficient, which takes into account the
gas and membrane mass transfer resistances: ,, ,
1
1 1i exti g i m
kk k
=+
, ,inner
i L RC is the
concentration of i in the liquid, at the wall and im is the partition coefficient of i ,
which accounts for the physical solubility.
Concerning the liquid phase, axi-symmetry and negligible axial diffusion were assumed
(Dindore et al., 2005a; Kumar, 2002). Both plug and laminar flows were considered in
the axial direction and diffusive flow is assumed in the radial direction. Then, the
differential mass balance of any absorbing species i present in the liquid phase and the
reactant species B are given by:
Liquid phase mass balance to the absorbed component i
, , ,1i L i L i Li i
C C Cv D r S
t z r r r
∂ ∂ ∂ ∂= − + − ∂ ∂ ∂ ∂ (27)

148
Liquid phase mass balance to the reactive component B
1B B B
B B
C C Cv D r S
t z r r r
∂ ∂ ∂ ∂ = − + − ∂ ∂ ∂ ∂ (28)
with the following initial and boundary conditions:
Initial condition
0t = , , , ,0i L i LC C= and ,0B BC C=
Axial boundary condition
0z = , , , ,i L i L feedC C= and ,B B feedC C=
Axi-symmetry condition
0r = , , 0i LC
r
∂=
∂ and 0BC
r
∂ =∂
Mass transfer across the membrane
innerr R= , ,,
, ,i
i L Ri Li i ext i g
i
CCD k C
r m
∂ = − ∂
(Absorbed gases)
0BC
r
∂ =∂
(Non-volatile reactant)
where ,i LC is the concentration of specie i in the liquid, v is the liquid velocity:
2
2 1i
rv v
R
= −
for laminar velocity profile and v v= for plug flow, being v the
average liquid velocity; iD and BD are the diffusion coefficients of absorbed species i
and reactant species B ; iS and BS are the terms accounting for the chemical reaction.
To put in evidence the governing parameters of the process, model equations are also
presented in their dimensionless form.
Partial gas phase mass balance
( )*
*/ / ,2
1ii
L G L M i m
u yyf R R N
xτ τε
θ ε∂∂ = −
∂ ∂ − (29)

149
Total gas phase mass balance
*
*/,
/
21
L Mi m
iL G
Ruf N
x R
τ
τε
ε∂ =∂ − ∑ (30)
with initial and boundary conditions:
Initial condition
0θ = , ,0i iy y=
Axial boundary condition
*,
*,
co-current: 0, and 1
counter-current: 1, and 1
i i feed
i i feed
x y y u
x y y u
= = =
= = =
where θ is the dimensionless time defined as Lt τ and Lτ is the liquid phase residence
time: L L vτ = ; x is the dimensionless axial coordinate, z L ; *u is the gas velocity
normalized by the gas feed velocity: *feedu u u= ; /L GRτ is the ratio between liquid and
gas residence times, L gτ τ , being the gas phase residence time, gτ , defined as feedL u ;
/L MRτ is the ratio between the liquid residence time and a membrane characteristic time,
mτ , defined as ,i A extR k , where ,A extk is the external mass transfer coefficient for the
reference component A . The dimensionless flux of the gaseous component i across the
membrane, *,i mN , is given by:
*,
* *, , *
inneri L R
i m i ext ii
CN k y
m
= −
(31)
where *,i extk and *
im are, respectively, the external mass transfer coefficient and the
partition coefficient of i normalized by the reference component A .
Liquid phase mass balances can be written in the dimensionless form as follows:
Liquid phase mass balance to the absorbed component i
* * **, , ,* *1
4i L i L i Lii
C C CDv Da S
x Gzρ
θ ρ ρ ρ ∂ ∂ ∂∂= − + − ∂ ∂ ∂ ∂
(32)
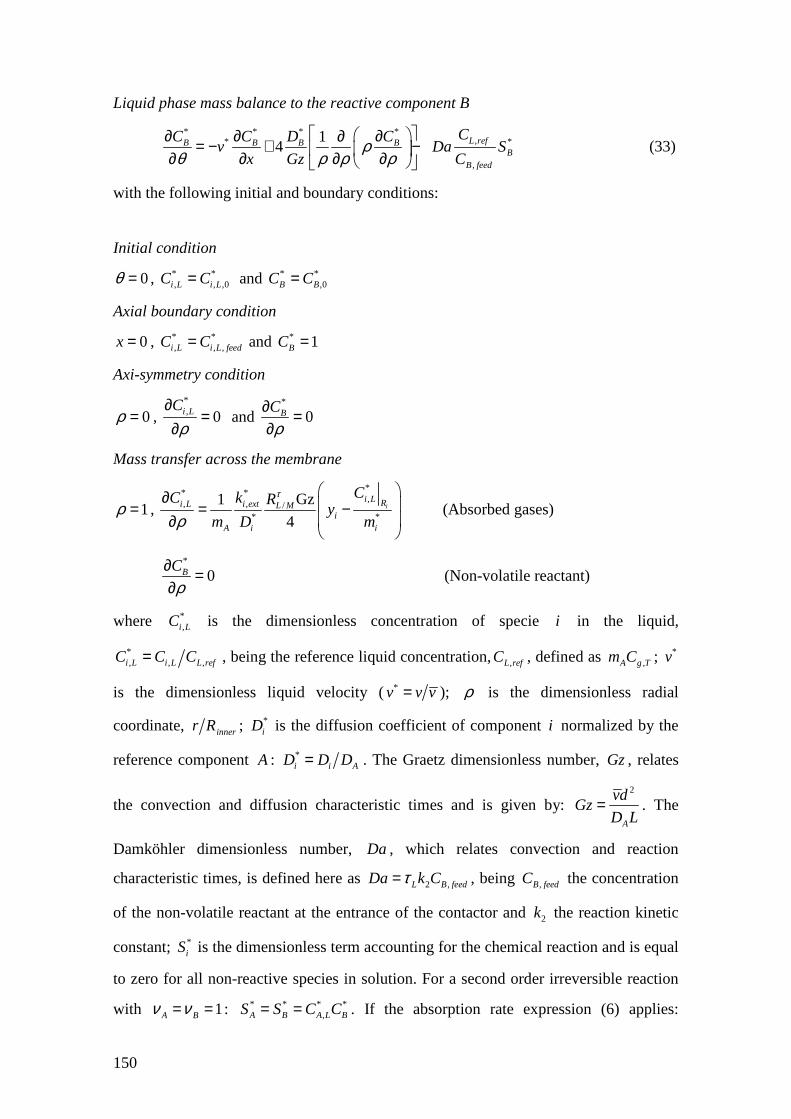
150
Liquid phase mass balance to the reactive component B
* * * *
,* *
,
14 L refB B B B
BB feed
CC C D Cv Da S
x Gz Cρ
θ ρ ρ ρ ∂ ∂ ∂∂= − + − ∂ ∂ ∂ ∂
(33)
with the following initial and boundary conditions:
Initial condition
0θ = , * *, , ,0i L i LC C= and * *
,0B BC C=
Axial boundary condition
0x = , * *, , ,i L i L feedC C= and * 1BC =
Axi-symmetry condition
0ρ = , *, 0i LC
ρ∂
=∂
and *
0BC
ρ∂ =∂
Mass transfer across the membrane
1ρ = ,
** *,, , /
* *
Gz1
4i
i L Ri L i ext L Mi
A i i
CC k Ry
m D m
τ
ρ
∂ = − ∂
(Absorbed gases)
*
0BC
ρ∂ =∂
(Non-volatile reactant)
where *,i LC is the dimensionless concentration of specie i in the liquid,
*, , ,i L i L L refC C C= , being the reference liquid concentration,,L refC , defined as ,A g Tm C ; *v
is the dimensionless liquid velocity (*v v v= ); ρ is the dimensionless radial
coordinate, innerr R ; *iD is the diffusion coefficient of component i normalized by the
reference component A : *i i AD D D= . The Graetz dimensionless number, Gz, relates
the convection and diffusion characteristic times and is given by: 2
A
vdGz
D L= . The
Damköhler dimensionless number, Da , which relates convection and reaction
characteristic times, is defined here as 2 ,L B feedDa k Cτ= , being ,B feedC the concentration
of the non-volatile reactant at the entrance of the contactor and 2k the reaction kinetic
constant; *iS is the dimensionless term accounting for the chemical reaction and is equal
to zero for all non-reactive species in solution. For a second order irreversible reaction
with 1A Bν ν= = : * * * *,A B A L BS S C C= = . If the absorption rate expression (6) applies:

151
( )2*
* * *, *
,
11
4B
A A L Bov L ref B
CS C C
K C C
−= − and * *2B AS S= . *
BC is the dimensionless concentration
of reactant B in the liquid, normalized by the feed concentration: *,B B B feedC C C= .
5.2.4. Numerical resolution strategy
Even though one is interested only on the steady state solution, the unsteady state model
was solved in order to overcome numerical instability problems. These are likely to
occur for conditions that lead to steep concentration profiles (high reactant
concentrations and high liquid velocities) and for counter-current operation (Sousa and
Mendes, 2003). The strategy used to solve the resulting system of partial differential
equations, (29) to (33), consisted on the spatial discretization of each equation, using the
finite volumes method (Cruz et al., 2005; Santos et al., 2007), and the subsequent time
integration (method of lines).
Concerning the spatial discretization, both shell and fiber were divided in equally
spaced intervals along the axial direction. The fiber lumen was also divided in the radial
direction following a geometric progression, therefore providing a higher number of
volumes next to the hollow fiber wall, where the concentration profiles are steepest. The
concentrations in each cell face were calculated using a first-order upwind differencing
scheme (Courant et al., 1952), for both axial and radial faces, and the radial derivatives
were computed using a second order central differencing scheme (Santos et al., 2007).
Details on this spatial discretization are presented in Appendix.
The resulting time dependent ordinary differential equations were then integrated using
the time integration package LSODA (Petzold and Hindmarsh, 1997). This routine
solves initial value problems, consisting on stiff or non-stiff systems of first order
ordinary differential equations, with variable step size and convergence order.
The solution is considered to be in steady state when the time derivative of each
dependent variable, for each spatial coordinate, is smaller than a pre-defined value.
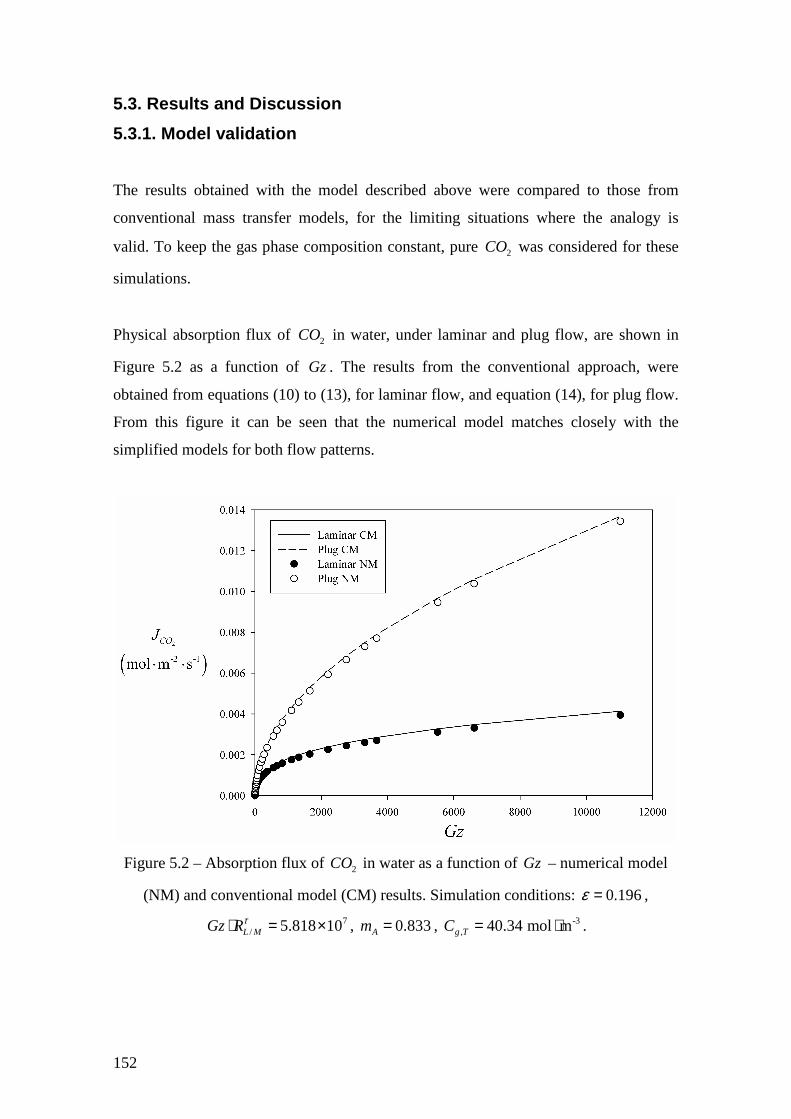
152
5.3. Results and Discussion
5.3.1. Model validation
The results obtained with the model described above were compared to those from
conventional mass transfer models, for the limiting situations where the analogy is
valid. To keep the gas phase composition constant, pure 2CO was considered for these
simulations.
Physical absorption flux of 2CO in water, under laminar and plug flow, are shown in
Figure 5.2 as a function of Gz. The results from the conventional approach, were
obtained from equations (10) to (13), for laminar flow, and equation (14), for plug flow.
From this figure it can be seen that the numerical model matches closely with the
simplified models for both flow patterns.
Figure 5.2 – Absorption flux of 2CO in water as a function of Gz – numerical model
(NM) and conventional model (CM) results. Simulation conditions: 0.196ε = ,
7/ 5.818 10L MGz Rτ⋅ = × , 0.833Am = , -3
, 40.34 mol mg TC = ⋅ .
153
The absorption in the presence of chemical reaction was studied for the limiting
condition where the depletion of the reactant at the fiber axis is negligible. Three typical
reaction types were considered in the simulations:
2kA B C D+ → + with 2A A BS k C C= (34)
2
1
k
kA B C D
−
→+ +← with 2 1A A B C DS k C C k C C−= − , 2
1
C Dov
A B
C CkK
k C C−
= = (35)
2
1
2k
kA B C D
−
→+ +← with 2 1C D
A A BB
C CS k C C k
C−= − , 22
1
C Dov
A B
C CkK
k C C−
= = (36)
In Figure 5.3, the results from the numerical model (NM) and conventional model (CM)
are plotted in terms of E as a function of Ha . Values of Ha were varied by changing
the reaction kinetic constant, 2k . The conventional approach results were obtained using
the DeCoursey equation (18). The physical mass transfer coefficients used to compute
Ha - equation (16) - were obtained from equations (11) and (14), respectively for
laminar and plug flow. The infinite enhancement factors, E∞ , used for reaction (34) was
calculated using equation (17) and the enhanced factors of reactions (35) and (36) were
computed using equations (20) to (23).
Figures 5.2 and 5.3 show that simulations results obtained with the model developed in
this work are in agreement with results from conventional mass transfer models, with
slight differences (especially in the intermediate regime), inherent to the approximations
involved in the conventional models (Kumar et al., 2003b). This validates the developed
model and the numerical strategy adopted.
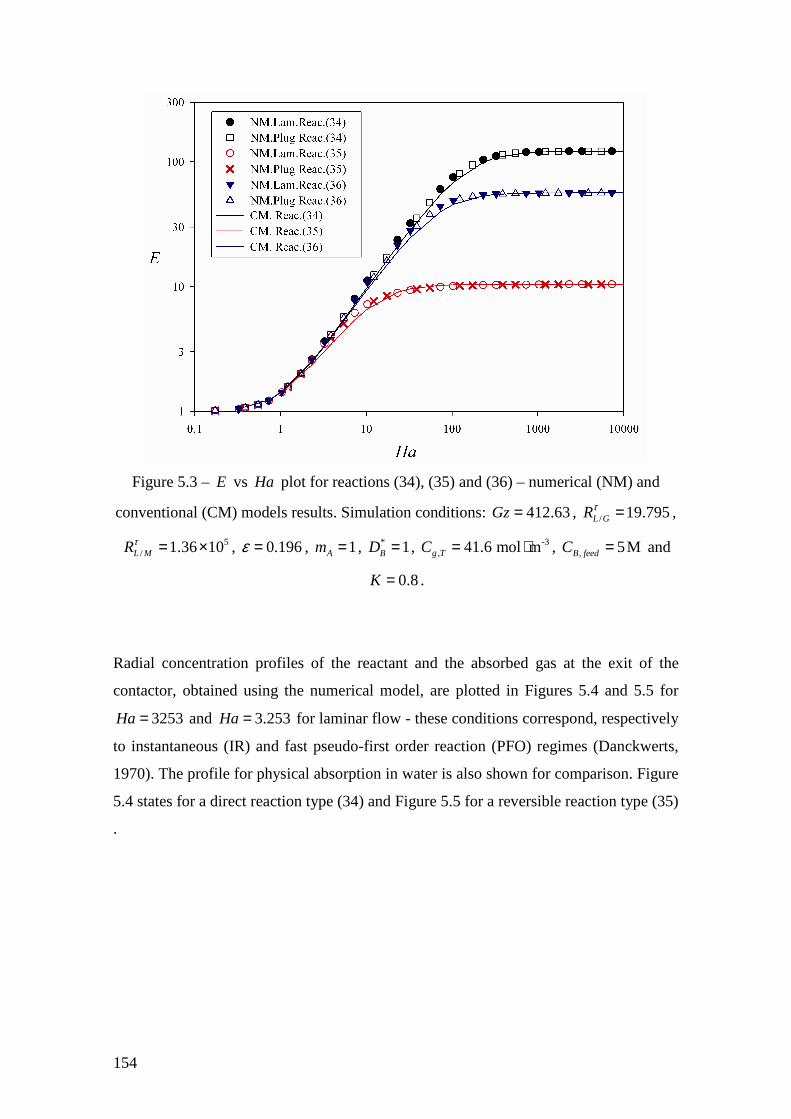
154
Figure 5.3 – E vs Ha plot for reactions (34), (35) and (36) – numerical (NM) and
conventional (CM) models results. Simulation conditions: 412.63Gz= , / 19.795L GRτ = ,
5/ 1.36 10L MRτ = × , 0.196ε = , 1Am = , * 1BD = , -3
, 41.6 mol mg TC = ⋅ , , 5MB feedC = and
0.8K = .
Radial concentration profiles of the reactant and the absorbed gas at the exit of the
contactor, obtained using the numerical model, are plotted in Figures 5.4 and 5.5 for
3253Ha = and 3.253Ha = for laminar flow - these conditions correspond, respectively
to instantaneous (IR) and fast pseudo-first order reaction (PFO) regimes (Danckwerts,
1970). The profile for physical absorption in water is also shown for comparison. Figure
5.4 states for a direct reaction type (34) and Figure 5.5 for a reversible reaction type (35)
.
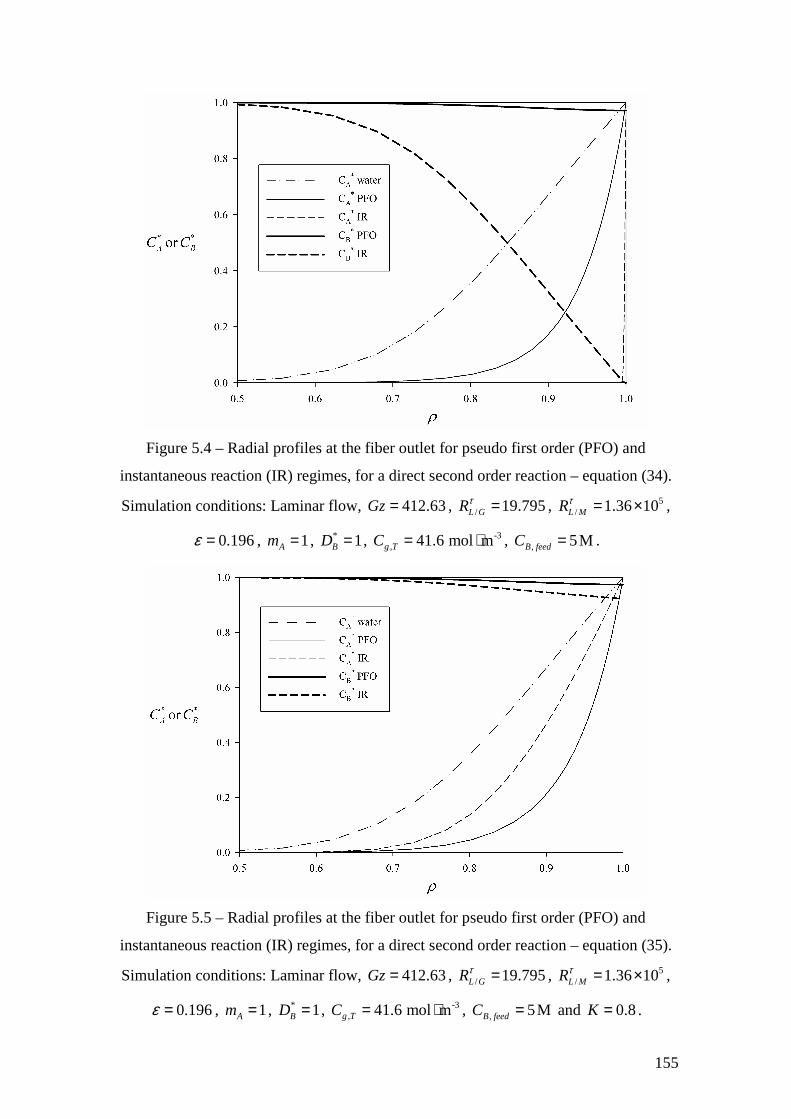
155
Figure 5.4 – Radial profiles at the fiber outlet for pseudo first order (PFO) and
instantaneous reaction (IR) regimes, for a direct second order reaction – equation (34).
Simulation conditions: Laminar flow, 412.63Gz= , / 19.795L GRτ = , 5/ 1.36 10L MRτ = × ,
0.196ε = , 1Am = , * 1BD = , -3, 41.6 mol mg TC = ⋅ , , 5MB feedC = .
Figure 5.5 – Radial profiles at the fiber outlet for pseudo first order (PFO) and
instantaneous reaction (IR) regimes, for a direct second order reaction – equation (35).
Simulation conditions: Laminar flow, 412.63Gz= , / 19.795L GRτ = , 5/ 1.36 10L MRτ = × ,
0.196ε = , 1Am = , * 1BD = , -3, 41.6 mol mg TC = ⋅ , , 5MB feedC = and 0.8K = .

156
Figures 5.4 and 5.5 make clear that, at these conditions, the concentrations of both
reactant and absorbed gas stay practically unchanged along the fiber axis. Figure 5.4
also shows that, as expected, under pseudo first order reaction regime, the depletion of
the reactant at the fiber wall in negligible, while under the instantaneous reaction
regime, the absorption is controlled by the diffusion of the species to a reaction plane
where their concentrations approach zero – the steepest profile of the absorbed gas is
obtained for this regime. However, for reversible reaction (35) – see Figure 5.5, the
concentration profile at the fiber outlet for IR is smoother than for PFO. This happens
because, at high reaction rates, the reactant depletion becomes significant at a certain
fiber length and the reverse reaction starts playing a role on the process. Close to the
fiber inlet, the steepest concentration profile still corresponds to the IR and, therefore,
the average absorption flux is still higher for this case.
5.3.2. Performance of a membrane contactor for CO2 removal from
anaesthesia breathing circuits
During anaesthesia, the gas flows from the patient at a flow rate, gQ , of approximately
5 -1L min⋅ and with a 2CO concentration of about 5 % (Billiet and Burchill, 2008;
Nguyen, 1996). This 2CO composition must be reduced to a maximum value of 0.5 %
before being recycled back to the patient (Lagorsse et al., 2007).
For this specific application, composite membranes made by a porous support (PEI),
coated internally with a PDMS thin layer were considered. In such membranes, the
main resistance to mass transfer is originated by the PDMS coating. The mass transfer
coefficient of 2CO in this layer, 2,m COk , is approximately 3 -11.58 10 m s−× ⋅ (Rego and
Mendes, 2004). The fibers internal and external diameters were assumed to be,
respectively, 45.6 10−× and 48.4 10−× m.
Aqueous solutions of potassium glycinate were considered as absorbent. The physical
and chemical parameters used to model the system 2CO - potassium glycinate – water
are given in Table 5.1, together with the respective literature sources. Portugal et al.
(2007) derived an expression for the rate of absorption of 2CO in solutions using

157
estimated values of the diffusion coefficients of 2CO and potassium glycinate in
solutions, 2 ,CO SolD and
2 ,RNH SolD . Later, Hamborg et al. (2008) determined these
diffusion coefficients experimentally. The work by Portugal et al. (2007) was re-
analysed using these values and a new expression for the reaction rate was obtained –
Table 5.1.
Given the above considerations, to meet the target of reducing the 2CO concentration
from 5 % to a maximum of 0.5 %, the following design and operation variables can still
be adjusted: the contactor length and shell diameter, the packing density, the liquid
flow-rate, LQ , and the inlet amino acid salt concentration. The influence of these
variables on the system behaviour will be further discussed. The gas phase mass transfer
resistance was neglected and all simulations were performed for a temperature of 298 K
and for fully developed laminar flow in the liquid. 2CO was considered the only
absorbing gas. The conditions studied in the simulations are summarized in Table 5.2.
Given the specificities of the problem under study, namely the fact that the known
restrictions are defined in terms of flow rates rather than velocities – notice that
( )2 1g
shell
Qu
Rπ ε=
− and
2L
shell
Qv
Rπ ε= - equations (29) and (32) were re-written, for
stationary state, as follows:
( )* 2
, *,4
i A ext shelli m
g
u y k R Lf N
x d Q
επ∂=
∂ (37)
2
* *2 2, ,* * *
2 ,2
14i L i Lshell shellA
i RNH feed iL L
C CR L R LDv D k C S
x d Q Q
επ επρρ ρ ρ ∂ ∂∂= − ∂ ∂ ∂
(38)
Equations (30) and (33) can be re-written as well.

158
Table 5.1 - Physical and chemical parameters used to model the absorption of 2CO in potassium glycinate aqueous solutions in a hollow fiber
membrane contactor - liquid phase concentrations are expressed in molarity.
2
2
2
,
,
log CO wRNH
CO Sol
mKC
m
=
( )62.1831 0.1112K T= − ( )-1M (Portugal et al., 2007)
( )2
7, 3.54 10 exp 2044CO wm RT T−= × (Versteeg and Van Swaaij, 1988)
2
2
2 2
-3 -5 2
9, -2 2 -3
-2.412 -9.403 10 7.110 10 -0.2177 -10
-5.447 10 1.296 10
RNH
RNH Sol
RNH RNH
T T CD
C TC−
× + × = × × + ×
( )2 -1m s⋅ (Hamborg et al., 2008)
( )2 2
0.48
, ,CO Sol CO w Sol wD D η η −= ( )2 -1m s⋅ (Hamborg et al., 2008)
( )2
6, 2.35 10 exp 2119CO wD T−= × − ( )2 -1m s⋅ (Versteeg and Van Swaaij, 1988)
( )2 2
21 0.2109 0.05124Sol w RNH RNHC Cη η = + + (Portugal et al., 2007)
( )2
162
86363.28 10 exp exp 0.36RNHk C
T
− = ×
( )-1 -1M s⋅ (Portugal et al., 2007)
2COov
AmA carb
KK
K K= ( )-1M
( )2exp 0.000237956 0.202203 61.6499AmAK T T= − + − ( )M (Perrin, 1965)
( )2
exp 12092.1 36.7816ln 235.482COK T T= − − + ( )M (Benamor and Aroua, 2005)
( )exp 1792 4.786carbK T= − ( )M (Portugal et al., 2009)
158

159
Table 5.2 - Simulation conditions.
( )KT 298.15
( )PaP 105
( )-1, L ming feedQ ⋅ 5
2 ,CO feedy 0.05 (5 %)
( )2
3 -1, 10 m sm COk × ⋅ 1.58
( )410 minnerR × 2.8
ε 0.098 – 0.392
( )210 mshellR × 2 – 4
( )210 mL× 5 – 50
( )-1mL minLQ ⋅ 10 – 500
( )2 , MRNH feedC 0.1 – 3
The influence of packing density, ε , contactor length, L , shell radius, shellR , reactant
feeding concentration, 2 ,RNH feedC , and liquid flowrate, LQ , on the 2CO molar fraction
exiting the contactor is discussed next.
Influence of the packing density, contactor length and shell diameter
The packing density and the contactor volume define the contact area - 22shell
inner
A R LR
ε=
- that is the area available for the mass transfer. Therefore, being gQ and innerR fixed, for
a given LQ and 2 ,RNH feedC , the gas concentration exiting the contactor depends on the
product 2shellR Lε , which is clear from equations (37) and (38) and was also verified by
simulation. The contact area, A, is only limiting the separation process if it is smaller
than the “effective area”, commonly expressed in terms of the effective length at which
the solution becomes saturated and no further separation is achieved. This concept is
illustrated in Figure 5.6, where some representative examples of gaseous concentration
profiles along the contactor are plotted for co- and counter-current operation.

160
Figure 5.6 – Axial profiles along the contactor for co- and counter-current operation and
for different LQ and 2 ,RNH feedC . Simulation conditions: 0.196ε = , Rshell
= 2 × 10⁻² m .
It can be seen from this figure that, for the case of a 0.5 M solution flowing at 10
-1mL min⋅ , all the changes in the gas composition occur at a small fraction of the
contactor length (approximately within 12× 10−2 m ) which is the portion effectively
used for the separation. From that point on, increasing the contactor length won’t bring
any advantage for the separation, because the solution is already saturated and unable to
absorb more 2CO . When a 3 M solution is used at the same flow rate, the effective
length increases because this solution has a higher capacity and then saturates later.
Observing this case, one can also notice that the effective length is larger for counter-
current (around 235 10 m−× ) than for co-current operation (around 229 10 m−× ). For both
0.5 and 1 M solutions flowing at 50 -1mL min⋅ , solution capacity is not reached within
the available contact area (this is particularly visible for counter-current operation),
which means that increasing the fiber length would further improve the separation.
Figure 5.6 makes also clear the advantages of operating counter-currently. Counter-
current operation not only enables a more effective use of the contactor area but leads to

161
lower 2CO gas molar fractions exiting the contactor, for the same flow rates and reactant
concentrations.
In Figure 5.7, the gas outlet composition is shown as a function of the contact area for
counter-current operation.
Figure 5.7 - Influence of the contact area on the 2CO molar fraction at the contactor exit
for different 2 ,RNH feedC and LQ and for counter-current operation.
As already observed in Figure 5.6 for the 0.5 M solution, increasing the liquid flow rate
increases the effective area. As a consequence, the separation becomes controlled by the
contact area available – see for example the results for 0.1 M and 500 -1mL min⋅ in
Figure 5.7. Figure 5.7 illustrates more clearly the effect of increasing the amino acid salt
concentration in the contactor effective area.
It can also be observed from Figure 5.7 that, for certain reactant concentrations and
liquid flow rates, it is possible to get outlet 2CO concentrations far below the minimum
required (0.5 %) even when the separation is still limited by the available contact area.
This might be relevant if volume constraints are imposed for the anaesthesia machine.

162
Concerning the contactor design, it must be kept in mind that the value of ε is
constrained by the device geometry. For packing of circles in a plane, the highest
possible packing is 0.907ε = (Weisstein, 2008) which, taking into account the
membrane thickness of 140 µm, corresponds to 0.403ε = , based on the fiber internal
diameter. Due to manufacturing restraints, a reasonable maximum packing density for
the type of contactor used should be about 0.3. Moreover, a final contactor design should
consider an appropriate balance between shell diameter and length. A contactor with a
large diameter and short fibers would lead to the presence of dead volumes or dominant
cross flow operation, while a contactor with very long fibers and short diameter would
imply a high pressure drop and would not fit in a common anaesthetic machine.
Influence of the amino acid salt concentration
As can be seen in Table 5.1, the potassium glycinate concentration influences the 2CO
physical solubility (represented by the partition factor), the 2CO and the reactant
diffusion coefficients and the reaction kinetic constant. The effect of 2 ,RNH feedC on the
2CO molar fraction at the contactor exit is shown in Figure 5.8.
A maximum concentration of 3 M was considered for the simulations. Although in
principle higher concentrations could enhance the separation (as Figure 5.8 indicates),
enabling the use of smaller contactors and lower liquid flow rates, they would also
increase the solution viscosity. Highly viscous solutions would carry hydrodynamic
problems and pumping would become an issue. Precipitation would also become more
likely for concentrated solutions.

163
Figure 5.8 - Influence of the amino acid salt feed concentration liquid flow rate on the
2CO concentration at the contactor exit for different LQ and for co- and counter-current
operations – 20.8796 mA = . Lines are for improving the read.
Influence of the liquid flow rate
The influence of the liquid flow rate on the 2CO molar fraction at the contactor exit is
shown in Figure 5.9.
Increasing the liquid flow rate, LQ , up to a certain value leads to an increase of the 2CO
removal and a consequent decrease on the 2CO gas phase exit molar fraction. However,
for sufficiently high liquid flow rates, other parameters such as the contact area and the
membrane resistance are limiting the 2CO removal. For the asymptotic situation where
there is no depletion of the reactant in the fiber axis along the entire fiber length, the
analogy to conventional mass transfer models is valid. If the conditions for PFO are
fulfilled, the enhancement factor becomes equal to the Hatta number (Danckwerts, 1970)
and therefore the absorption flux is independent of the mass transfer coefficient, Lk - see
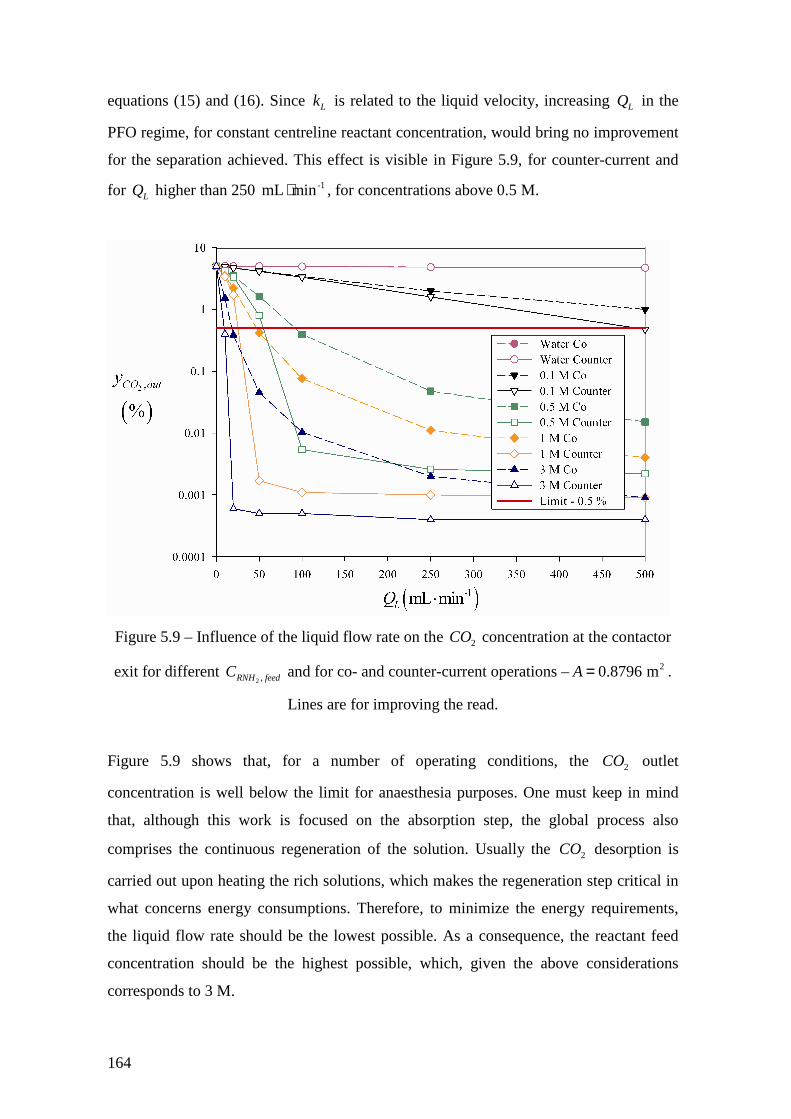
164
equations (15) and (16). Since Lk is related to the liquid velocity, increasing LQ in the
PFO regime, for constant centreline reactant concentration, would bring no improvement
for the separation achieved. This effect is visible in Figure 5.9, for counter-current and
for LQ higher than 250 -1mL min⋅ , for concentrations above 0.5 M.
Figure 5.9 – Influence of the liquid flow rate on the 2CO concentration at the contactor
exit for different 2 ,RNH feedC and for co- and counter-current operations – 20.8796 mA = .
Lines are for improving the read.
Figure 5.9 shows that, for a number of operating conditions, the 2CO outlet
concentration is well below the limit for anaesthesia purposes. One must keep in mind
that, although this work is focused on the absorption step, the global process also
comprises the continuous regeneration of the solution. Usually the 2CO desorption is
carried out upon heating the rich solutions, which makes the regeneration step critical in
what concerns energy consumptions. Therefore, to minimize the energy requirements,
the liquid flow rate should be the lowest possible. As a consequence, the reactant feed
concentration should be the highest possible, which, given the above considerations
corresponds to 3 M.
165
According to Figures 5.7 to 5.9, a contactor having 0.5 m2 of contact area, with a 3 M
aqueous solution of potassium glycinate, flowing at 10 -1mL min⋅ counter-currently with
respect to the gas would be suitable to reduce the 2CO molar fraction in anaesthesia
closed loop from 5 % to less than 0.5 %. Considering a packing density of 0.3, a
contactor for this application should have a volume of approximately 240 mL. Taking
into consideration the dimensions of the usual alkali hydroxides canisters, a contactor
with 5 cm shell diameter and 12.5 cm length would be easily retrofitted into a common
anaesthesia machine.
5.4. Conclusions
A numerical model was developed to simulate the mass transfer accompanied by
chemical reaction, occurring during the absorption of a gas into a liquid flowing through
a hollow fiber membrane contactor. The model considers the liquid flowing in the fiber
lumen and the gas in the shell side. Both co- and counter-current operations were
analysed. Good agreement was found between the proposed numerical model results and
results obtained with conventional mass transfer models, for the limit conditions where
these are valid.
The performance of a hollow fiber membrane contactor with potassium glycinate
absorbent solutions was studied for the purpose of carbon dioxide removal from
anaesthesia closed-loops. The effect of the contact area on the 2CO molar fraction
exiting the contactor was analysed; the contact area is defined by the design parameters
packing density, contactor length and shell diameter. The separation achieved increases
by increasing the contact area until the liquid solution becomes saturated, which happens
at the so-called effective area or effective length. The operation parameters liquid flow
rate and reactant feed concentration determine the area effectively used for the mass
transfer.
The effect of the reactant feed concentration on the separation was examined and, for the
concentration range considered (0 to 3 M), the amount of 2CO absorbed always
increased with increasing concentration.

166
Generally, increasing the liquid flow rate increases the separation. However, when the
contactor is working in the limit situation of PFO and no depletion of the reactant at the
fiber axis, the liquid velocity has no effect on the absorption rate and consequently on the
2CO molar fraction exiting the contactor. Concerning the application under study, to
minimize energy requirements for the thermal desorption, one are interested on keeping
the liquid flow rate the lowest possible.
Finally, based on practical considerations and restrictions, a set of operating conditions
and design parameters were assumed for the contactor and its viability confirmed by
simulation. These are a packing density of 0.3 and a volume of 240 mL (approximately
0.5 m2 of contact area), with a 3 M solution of potassium glycinate flowing counter
currently with respect to the gas, at a flow rate of 10 -1mL min⋅ .
5.5. Nomenclature
A Contact area, 2m
C Concentration, M or -3mol m⋅
d Fiber internal diameter, m
D Diffusion coefficient, 2 -1m s⋅
Da Damköhler number, dimensionless
E Enhancement factor, dimensionless
E∞ Infinite enhancement factor, dimensionless
f Flag standing for co- or counter-current operation
Gz Graetz number, dimensionless
Ha Hatta number, dimensionless
IR Instantaneous reaction regime
J Absorption flux, -2 -1mol m s⋅ ⋅
ovK Overall equilibrium constant
1k− Reverse reaction kinetic constant, s-1
2k Second order reaction kinetic constant, M-1 ⋅s-1
extk External mass transfer coefficient, -1m s⋅

167
gk Gas phase mass transfer coefficient, -1m s⋅
mk Membrane mass transfer coefficient, -1m s⋅
Lk Liquid phase physical mass transfer coefficient, -1m s⋅
ovk Overall mass transfer coefficient, -1m s⋅
L Fiber length, m
m Partition coefficient
n Number of fibers
,i mN Flux across the membrane, -2 -1mol m s⋅ ⋅
nj Number of discretization points in the axial direction
nk Number of discretization points in the radial direction
PFO Pseudo first order reaction regime
Q Flow rate, -1L min⋅ or -1mL min⋅
r Radial coordinate, m
R Universal gas constant, 8.314 -1 -1J mol K⋅ ⋅
innerR Membrane internal radius, m
/L GRτ Ratio between liquid and gas residence times, dimensionless
/L MRτ Ratio liquid residence and membrane characteristic times, dimensionless
shellR Contactor shell inner radius, m
S Rate of reaction, -3 -1mol m s⋅ ⋅
Sh Sherwood number, L
A
k dSh
D= , dimensionless
T Temperature, K
u Gas velocity, -1m s⋅
v Liquid velocity, -1m s⋅
V Volume, m3
x Axial coordinate, dimensionless
z Axial coordinate, m
Greek symbols
ϕ Flux, -2 -1mol m s⋅ ⋅
ε Packing density, dimensionless

168
ν Stoichiometric coefficient
η Solution viscosity, -1 -1kg m s⋅ ⋅
ρ Radial coordinate, dimensionless
θ Time, dimensionless
τ Residence time, s
Subscripts
0 Initial
∞ Infinite (instantaneous reaction regime)
A Absorbed gas
B Non-volatile reactant
,C D Reaction products
F Cell face
g Gas phase
i Gaseous component
int Interface
L Liquid phase
m Membrane
ref Reference
Sol Solution
T Total
w Water
Superscripts
* Dimensionless
z Axial coordinate, m
r Radial coordinate, m
5.6. References
Al-Marzouqi, M., El-Naas, M., Marzouk, S. and Abdullatiff, N. (2008). "Modeling of
chemical absorption of CO2 in membrane contactors." Separation and Purification
Technology, 62(3), 499-506.

169
Bao, L. H. and Trachtenberg, M. C. (2005). "Modeling CO2-facilitated transport across a
diethanolamine liquid membrane." Chemical Engineering Science, 60(24), 6868-6875.
Baum, J. A. and Woehlck, H. J. (2003). "Interaction of inhalational anaesthetics with
CO2 absorbents " Best Practice and Research Clinical Anaesthesiology, 17(1), 63-76.
Benamor, A. and Aroua, M. K. (2005). "Modeling of CO2 solubility and carbamate
concentration in DEA, MDEA and their mixtures using the Deshmukh-Mather model."
Fluid Phase Equilibria, 231(2), 150-162.
Billiet, P. and Burchill, S. (2008). "The Open Door Web Site - Breathing in the Air: The
Lungs - http://www.saburchill.com." 2008.
Bird, R. B., Sewart, W. E. and Lightfoot, E. N. (2002). "Transport phenomena". New
York, John Wiley and Sons, inc.
Blauwhoff, P. M. M., Versteeg, G. F. and Vanswaaij, W. P. M. (1984). "A Study on the
Reaction between Co2 and Alkanolamines in Aqueous-Solutions." Chemical
Engineering Science, 39(2), 207-225.
Boucif, N., Favre, E. and Roizard, D. (2008). "CO2 capture in HFMM contactor with
typical amine solutions: A numerical analysis." Chemical Engineering Science, 63(22),
5375-5385.
Caplow, M. (1968). "Kinetics of carbamate formation and breakdown." Journal of the
American Chemical Society, 90(24), 6795-6803.
Chen, G., Ren, Z. Q., Zhang, W. D. and Gao, J. (2007). "Modeling study of the influence
of porosity on membrane absorption process." Separation Science and Technology,
42(15), 3289-3306.
Coker, D. T., Freeman, B. D. and Fleming, G. K. (1998). "Modeling multicomponent gas
separation using hollow-fiber membrane contactors." American Institute of Chemical
Engineers Journal, 44(6), 1289-1302.
Courant, R., Isaacson, E. and Rees, M. (1952). "On the Solution of Nonlinear Hyperbolic
Differential Equations by Finite Differences." Communications on Pure and Applied
Mathematics, 5(3), 243-255.

170
Cruz, P., Santos, J., Magalhaes, F. and Mendes, A. (2005). "Simulation of separation
processes using finite volume method." Computers & Chemical Engineering, 30(1), 83-
98.
Danckwerts, P. (1970). "Gas-Liquid Reactions", McGraw-Hill Book Company.
DeCoursey, W. J. (1974). "Absorption with Chemical-Reaction - Development of a New
Relation for Danckwerts Model." Chemical Engineering Science, 29(9), 1867-1872.
Derks, P. W. J., Kleingeld, T., van Aken, C., Hogendoom, J. A. and Versteeg, G. F.
(2006). "Kinetics of absorption of carbon dioxide in aqueous piperazine solutions."
Chemical Engineering Science, 61(20), 6837-6854.
Dindore, V., Brilman, D. and Versteeg, G. (2005a). "Hollow fiber membrane contactor
as a gas-liquid model contactor." Chemical Engineering Science, 60(2), 467-479.
Dindore, V., Brilman, D. and Versteeg, G. (2005b). "Modelling of cross-flow membrane
contactors: Mass transfer with chemical reactions." Journal of Membrane Science,
255(1-2), 275-289.
Elk, E. P. V., Knaap, M. C. and Versteeg, G. F. (2007). "Application of the penetration
theory for gas-liquid mass transfer without liquid bulk: Differences with systems with a
bulk." Chemical Engineering Research & Design, 85(4), 516-524
Fan, S. Z., Lin, Y. W., Chang, W. S. and Tang, C. S. (2008). "An evaluation of the
contributions by fresh gas flow rate, carbon dioxide concentration and desflurane partial
pressure to carbon monoxide concentration during low fresh gas flows to a circle
anaesthetic breathing system." European Journal of Anaesthesiology, 25(8), 620-626.
Feron, P. and Jansen, A. (2002). "CO2 separation with polyolefin membrane contactors
and dedicated absorption liquids: performances and prospects." Separation and
Purification Technology, 27(3), 231-242.
Gabelman, A. and Hwang, S. (1999). "Hollow fiber membrane contactors." Journal of
Membrane Science, 159(1-2), 61-106.
171
Goff, G. S. and Rochelle, G. T. (2006). "Oxidation inhibitors for copper and iron
catalyzed degradation of monoethanolamine in CO2 capture processes." Industrial &
Engineering Chemistry Research, 45(8), 2513-2521.
Hamborg, E. S., Niederer, J. P. M. and Versteeg, G. F. (2007). "Dissociation constants
and thermodynamic properties of amino acids used in CO2 absorption from (293 to 353)
K." Journal of Chemical and Engineering Data, 52(6), 2491-2502.
Hamborg, E. S., van Swaaij, W. P. M. and Versteeg, G. F. (2008). "Diffusivities in
aqueous solutions of the potassium salt of amino acids." Journal of Chemical and
Engineering Data, 53(5), 1141-1145.
Hoff, K. A., Juliussen, O., Falk-Pedersen, O. and Svendsen, H. F. (2004). "Modeling and
experimental study of carbon dioxide absorption in aqueous alkanolamine solutions
using a membrane contactor." Industrial & Engineering Chemistry Research, 43(16),
4908-4921.
Hogendoorn, J. A., Vas Bhat, R. D., Kuipers, J. A. M., van Swaaij, W. P. M. and
Versteeg, G. F. (1997). "Approximation for the enhancement factor applicable to
reversible reactions of finite rate in chemically loaded solutions." Chemical Engineering
Science, 52(24), 4547-4559.
Hook, R. J. (1997). "An investigation of some sterically hindered amines as potential
carbon dioxide scrubbing compounds." Industrial & Engineering Chemistry Research,
36(5), 1779-1790.
Idem, R. and Tontiwachwuthikul, P. (2006). "Preface for the special issue on the capture
of carbon dioxide from industrial sources: Technological developments and future
opportunities." Industrial & Engineering Chemistry Research, 45(8), 2413-2413.
Keshavarz, P., Ayatollahi, S. and Fathikalajahi, J. (2008). "Mathematical modeling of
gas–liquid membrane contactors using random distribution of fibers." Journal of
Membrane Science, 325, 98–108.
Knaap, M. C., Lenferink, J. E. O., Versteeg, G. F. and van Elk, E. P. (2000).
"Differences in local absorption rates of CO2 as observed in numerically comparing tray

172
columns and packed columns." 79th Annual Convention of the Gas Processors
Association, Proceedings, 82-94
596.
Knolle, E. and Gilly, H. (2000). "Absorption of carbon dioxide by dry soda lime
decreases carbon monoxide formation from isoflurane degradation." Anesthesia and
Analgesia, 91(2), 446-451.
Kreulen, H., Smolders, C. A., Versteeg, G. F. and Vanswaaij, W. P. M. (1993a).
"Microporous Hollow-Fiber Membrane Modules as Gas-Liquid Contactors .1. Physical
Mass-Transfer Processes - a Specific Application - Mass-Transfer in Highly Viscous-
Liquids." Journal of Membrane Science, 78(3), 197-216.
Kreulen, H., Smolders, C. A., Versteeg, G. F. and Vanswaaij, W. P. M. (1993b).
"Microporous Hollow-Fiber Membrane Modules as Gas-Liquid Contactors .2. Mass-
Transfer with Chemical-Reaction." Journal of Membrane Science, 78(3), 217-238.
Kumar, P., Hogendoorn, J., Versteeg, G. and Feron, P. (2003a). "Kinetics of the reaction
of CO2 with aqueous potassium salt of taurine and glycine." American Institute of
Chemical Engineers Journal, 49(1), 203-213.
Kumar, P., Hogendorn, J., Feron, P. and Versteeg, G. (2003b). "Approximate solution to
predict the enhancement factor for the reactive absorption of a gas in a liquid flowing
through a microporous membrane hollow fiber." Journal of Membrane Science, 213(1-
2), 231-245.
Kumar, P. S. (2002). "Development and design of membrane gas absorption processes".
Enschede, University of Twente.
Kumar, P. S., Hogendoorn, J. A., Feron, P. H. M. and Versteeg, G. F. (2002). "New
absorption liquids for the removal of CO2 from dilute gas streams using membrane
contactors." Chemical Engineering Science, 57(9), 1639-1651.
Kumar, P. S., Hogendoorn, J. A., Feron, P. H. M. and Versteeg, G. F. (2003c).
"Equilibrium solubility of CO2 in aqueous potassium taurate solutions: Part 1.
Crystallization in carbon dioxide loaded aqueous salt solutions of amino acids."
Industrial & Engineering Chemistry Research, 42(12), 2832-2840.

173
Kumar, P. S., Hogendorn, J. A., Feron, P. H. M. and Versteeg, G. F. (2003d).
"Approximate solution to predict the enhancement factor for the reactive absorption of a
gas in a liquid flowing through a microporous membrane hollow fiber." Journal of
Membrane Science, 213(1-2), 231-245.
Lagorsse, S., Magalhaes, F. D. and Mendes, A. (2007). "Xenon recycling in an
anaesthetic closed-system using carbon molecular sieve membranes." Journal of
Membrane Science, 301(1-2), 29-38.
Li, J. L. and Chen, B. H. (2005). "Review Of CO2 absorption using chemical solvents in
hollow fiber membrane contactors." Separation and Purification Technology, 41(2), 109-
122.
Ma'mun, S., Svendsen, H. F., Hoff, K. A. and Juliussen, O. (2007). "Selection of new
absorbents for carbon dioxide capture." Energy Conversion and Management, 48(1),
251-258.
Majchrowicz, M., Niederer, J. P. M., Velders, A. H. and Versteeg, G. F. (2006).
"Precipitation in amino acid salt CO2 absorption systems". GHGT-8 NTNU VIDERE,
Pav. A, Dragvoll, NO-7491 Trondheim, Norway.
Mendes, A. M. M. (2000). "Development of an adsorption/membrane based system for
carbon dioxide, nitrogen and spur gases removal from a nitrous oxide and xenon
anaesthetic closed loop." Acp-Applied Cardiopulmonary Pathophysiology, 9(2), 156-
163.
Nguyen, J. (1996). "End-tidal carbon dioxide monitoring during CPR: A predictor of
outcome - http://enw.org/ETCO2inCPR.htm."
Paul, S., Ghoshal, A. K. and Mandal, B. (2007). "Removal of CO2 by single and blended
aqueous alkanolamine solvents in hollow-fiber membrane contactor: Modeling and
simulation." Industrial & Engineering Chemistry Research, 46(8), 2576-2588.
Perrin, D. (1965). "Dissociation Constants of Organic Bases in Aqueous Solutions".
London, Butterworth.
Petzold, L. R. and Hindmarsh, A. C. (1997). LSODA, Computer and mathematics
research division, Lawrence Livermore National Laboratory.

174
Portugal, A. F., Derks, P. W. J., Versteeg, G. F., Magalhães, F. D. and Mendes, A.
(2007). "Characterization of potassium glycinate for carbon dioxide absorption purposes
" Chemical Engineering Science, 62(23), 6534-6547
Portugal, A. F., Magalhaes, F. D. and Mendes, A. (2008). "Carbon dioxide absorption
kinetics in potassium threonate." Chemical Engineering Science, 63(13), 3493-3503.
Portugal, A.F., Sousa, J.M., Magalhães, F. D. and Mendes A. (2009). "Solubility of
carbon dioxide in aqueous solutions of amino acid salts", Chemical Engineering Science,
10.1016/j.ces.2009.01.036
Rego, R. and Mendes, A. (2004). "Carbon dioxide/methane gas sensor based on the
permselectivity of polymeric membranes for biogas monitoring." Sensors and Actuators
B-Chemical, 103(1-2), 2-6.
Santos, J. C., Cruz, P., Regala, T., Magalhaes, F. D. and Mendes, A. (2007). "High-
purity oxygen production by pressure swing adsorption." Industrial & Engineering
Chemistry Research, 46(2), 591-599.
Sartori, G. and Savage, D. W. (1983). "Sterically Hindered Amines for Co2 Removal
from Gases." Industrial & Engineering Chemistry Fundamentals, 22(2), 239-249.
Sea, B., Park, Y. I. and Lee, K. H. (2002). "Comparison of porous hollow fibers as a
membrane contactor for carbon dioxide absorption." Journal of Industrial and
Engineering Chemistry, 8(3), 290-296.
Secor, R. M. and Beutler, J. A. (1967). "Penetration Theory for Diffusion Accompanied
by a Reversible Chemical Reaction with Generalized Kinetics." American Institute of
Chemical Engineers Journal, 13(2), 365-373.
Song, H. J., Lee, S., Maken, S., Park, J. J. and Park, J. W. (2006). "Solubilities of carbon
dioxide in aqueous solutions of sodium glycinate." Fluid Phase Equilibria, 246(1-2), 1-5.
Sousa, J. M. and Mendes, A. (2003). "Simulation study of a dense polymeric catalytic
membrane reactor with plug-flow pattern." Chemical Engineering Journal, 95(1-3), 67-
81.

175
Supap, T., Idem, R., Tontiwachwuthikul, P. and Saiwan, C. (2006). "Analysis of
monoethanolamine and its oxidative degradation products during CO2 absorption from
flue gases: A comparative study of GC-MS, HPLC-RID, and CE-DAD analytical
techniques and possible optimum combinations." Industrial & Engineering Chemistry
Research, 45(8), 2437-2451.
Van Swaaij, W. P. M. and Versteeg, G. F. (1992). "Mass-Transfer Accompanied with
Complex Reversible Chemical-Reactions in Gas-Liquid Systems - an Overview."
Chemical Engineering Science, 47(13-14), 3181-3195.
Versteeg, G. F. and Van Swaaij, W. P. M. (1988). "Solubility and Diffusivity of Acid
Gases (Co2, N2O) in Aqueous Alkanolamine Solutions." Journal of Chemical and
Engineering Data, 33(1), 29-34.
Wang, R., Li, D. F. and Liang, D. T. (2004). "Modeling of CO2 capture by three typical
amine solutions in hollow fiber membrane contactors." Chemical Engineering and
Processing, 43(7), 849-856.
Weisstein, E. W. (2008). ""Circle Packing." From MathWorld-A Wolfram Web
Resource - http://mathworld.wolfram.com/CirclePacking.htmlWeisstein." 2008.
Whalen, F. X., Bacon, D. R. and Smith, H. M. (2005). "Inhaled anesthetics: an historical
overview." Best Practice Research Clinical Anaesthesiology, 19(3), 323-330.
Zhang, H. Y., Wang, R., Liang, D. T. and Tay, J. H. (2006). "Modeling and experimental
study of CO2 absorption in a hollow fiber membrane contactor." Journal of Membrane
Science, 279(1-2), 301-310.
Zhang, Q. and Cussler, E. L. (1985). "Microporous Hollow Fibers for Gas-Absorption .1.
Mass-Transfer in the Liquid." Journal of Membrane Science, 23(3), 321-332.
5.A. Spatial discretization method
Equations in this appendix are written in their dimensional form to simplify
understanding.

176
The hollow fiber membrane contactor was discretized as shown in Figure 5.A1 - both
shell and fiber are divided in nj equally spaced intervals in the axial direction; the fiber
lumen is also divided in the radial direction following a geometric progression:
1
1
1 0.85
1 0.85
k
k innernkr R
−
−
−=−
(B.1)
where nk is the number of finite volumes in the radial direction. It was found that 16
axial discretization points and 64 radial discretization points were sufficient to describe
the problem.
Figure 5.A1 – Schematic representation of the spatial discretization and cell mass
balance.
For each cell and for each component i present in the system, the following mass
balances can be written:

177
Liquid phase mass balance
( ) ( )
( ) ( )
1 1
2 21 1 1
what enters in radial directionwhat enters in axial direction
2 21 1
what comes what comes out in axial direction
2
2
j k
j k
z rFz k k Fr k j j
z rFz k k Fr k j j
r r r z z
r r r z z
ϕ π ϕ π
ϕ π ϕ π
− ++ + −
+ −
− + − =
= − + −
( )( ) ( )( )out in radial direction
,2 2 2 21 1 1 1
what disapears upon reactionwhat accumulates in the element
i liqk k j j k k j j i
dCr r z z r r z z S
dtπ π+ − + −
+
+ − − + − −
(B.2)
According to the model assumptions, zFϕ and rFϕ , respectively, the axial and radial
fluxes crossing the cell faces, are given by , ,zF F i L Fv Cϕ = and ,i Lr
F i
F
dCD
drϕ = . Then,
substituting in (B.2), the following equation results:
( ) ( )
1 1 1
, ,1
, , , ,,
2 21 1
2j j j j k k
i L i Lk k
Fz i L Fz Fz i L Fz Fr Fri Li i
j j k k
C Cr r
v C v C r rCD S
t z z r r− − +
+
− +
∂ ∂−
− ∂ ∂∂= − + −
∂ − − (B.3)
where ,i LC is the concentration of i in the cell, 1jFzv
− and
jFzv are the liquid velocities
respectively in the upstream and downstream faces of the cell - in case of laminar flow
( ) ( )2 2
12 12j
k kFz
r R r Rv v +
+= −
, 1, , ji L FzC
− and , , ji L FzC are the concentrations of i
respectively in the upstream and downstream faces of the cell and 1
,
k
i L
Fr
C
r+
∂∂
and ,
k
i L
Fr
C
r
∂∂
are the concentration gradients, respectively in the outer and inner faces of the liquid
cylindrical shell. Initial and axial boundary conditions of equation (B.3) are
straightforwardly implemented: , , ,00, i L i Lt C C= = and 1, , , ,0, i L Fz i L feedz C C= = .
Concerning the radial boundary condition for the absorbing compounds, an infinitesimal
volume, infV , with concentration ,i mC , was created in the fiber wall and a mass balance
was performed in this volume:
( )1, ,
2
nk
j ji m i Lim i
inf Fr
R z zC CN D
t V r
π − −∂ ∂ = − ∂ ∂
(B.4)
where the flux through the membrane, ,i mN , is given by: ( ), , , ,i m i ext i g i mN k C C= − . The
radial boundary condition of equation (B.3) then becomes: , , ,,nkinner i L Fr i i mr R C m C= =

178
and the initial condition of equation (B.4) was set as: , , ,00, i m i L it C C m= = . This
strategy considerably attenuates the numerical instability associated to the condition of
fluxes equality in the interface.
Gas phase mass balances were computed equivalently, but only axial flux was
considered ( ), ,zF F i g Fu Cϕ = .

Part V


181
General Conclusions and Future Work
The present work aimed at studying the use of hollow fiber membrane contactors for
2CO removal from anaesthetic gas streams by selective absorption.
The 2CO removal from closed anaesthetic loops is currently achieved using mixtures of
alkali hydroxides which, under desiccated conditions, react with the anaesthetic
volatiles originating highly toxic compounds. In addition, this technique is associated to
explosions due to the hydrogen formation and excessive heating during the reaction of
these absorbents with 2CO . Furthermore, the exhaust containers of the absorbent
mixtures are hospital solid waste. These reasons drive the need for replacing this
absorption system with a safer and more environmentally friendly technology. The use
of hollow fiber membrane contactors with renewable liquid absorbents is a possible
strategy to overcome most of the pointed out drawbacks. Using dense and highly
permeable membranes in such devices, the absorption system can be kept isolated from
the anesthetic loop and aseptic operation is possible. The absorbent solution can be
subsequently regenerated after contacting with 2CO .
Most of the present work was focussed on the study of absorbent solutions suitable for
the intended application. Such solution must be biocompatible, chemically and
thermally stable and have a low vapour pressure. Additionally, it must present high
absorption and desorption kinetics and high absorption capacity and should be easy to
regenerate. Aqueous solutions of alkali salts of amino acid are expected to fulfil these
requirements and, therefore, two amino acid salts were characterized for 2CO
absorption: potassium glycinate (because glycine is the simplest amino acid, it has a
relatively low cost and its molecular structure indicates high absorption kinetics) and
potassium threonate (because its molecular structure envisioned better regeneration
properties).
Following the absorbents characterization, the performance of the contactor for 2CO
removal from closed-loop anaesthesia was analysed by simulation, using the physico-
chemical properties obtained for potassium glycinate. The use of hollow fiber absorbent

182
membrane contactors for the 2CO removal from closed anaesthetic breathing circuits
was proposed for the first time by our research group. The analysis performed in the
present dissertation indicates that this technology is suitable. The absorbent regeneration
process, however, still has to be studied in some detail.
Some relevant results obtained along the different phases of the work are described
below.
Physical Properties Measurements
Densities and viscosities of potassium glycinate and potassium threonate aqueous
solutions were measured for amino acid salt concentrations ranging from 0.1 to 3.0 M
and temperatures from 293 to 313 K. For the concentration range analysed, the increase
of density and viscosity are not likely to bring additional hydrodynamic concerns or
pumping difficulties. However, for potassium threonate concentrations above 3.0 M and
low temperatures, the solution viscosity might become too high for use in hollow fibre
membrane modules.
Diffusion coefficients of 2N O and the amino acids salts in amino acid salts solutions
were estimated using the modified Stokes Einstein relation. 2CO diffusion coefficients
were computed using the 2N O analogy.
To estimate the physical solubility of 2CO in amino acid salts solutions, 2N O solubility
was measured and the results interpreted using the Shumpe model. These measurements
were performed for potassium glycinate and potassium threonate concentrations from
0.1 to 3.0 M and temperatures from 293 to 313 K.
Adsorption Kinetics Studies
The kinetics of the reactions of 2CO with potassium glycinate and potassium threonate
were determined using a stirred cell working semi-continuously with respect to the gas
phase and batchwise with respect to the liquid phase. It was concluded that both amino

183
acid salts presented absorption rates towards 2CO similar to alkanolamines. The results
also indicate that the reaction rate significantly depends on the ionic strength of the
solution. As expected, because of the molecular configuration, it was verified that
potassium glycinate shows a faster absorption of 2CO than potassium threonate.
The enhancement factor, and subsequently the overall kinetic constant, was computed
using the DeCorsey equation. The apparent kinetic constant of potassium glycinate is in
line with the Brønsted plot drawn for other amines, whereas the apparent kinetic
constant for potassium threonate falls below the plot. This is likely to be due to the
sterical hindrance of the amine group from threonate.
For potassium glycinate, the rate of absorption as a function of temperature and amino
acid salt concentration, for the conditions studied, was found to be given by the
following expression: ( )2 2
16 85442.42 10 exp exp 0.44CO S S COr C C C
T
− − = ×
-3 -1mol m s⋅ ⋅ . Based on experimental diffusivity data recently published, this expression
was later updated: ( )2 2
16 86363.28 10 exp exp 0.36CO S S COr C C C
T
− − = ×
-3 -1mol m s⋅ ⋅ .
The absorption rate as a function of the temperature and concentration found for
potassium threonate was: ( )2 2
8 35804.13 10 exp exp 0.90CO S S COr C C C
T
− − = ×
-3 -1mol m s⋅ ⋅ .
Adsorption Equilibrium Studies
2CO solubility in potassium glycinate aqueous solutions with concentrations from 0.1 to
3.0 M and temperatures from 293 to 351 K was determined in a stirred cell. 2CO
solubility in a 1.0 M solution of potassium threonate was also measured at 313 K.
Potassium glycinate showed absorption capacities towards 2CO (expressed in terms of
2
1CO AmAmol mol−⋅ ) similar to monoethanolamine. On the other hand, potassium threonate
showed a considerably lower 2CO absorption capacity. This can be assigned to the

184
sterical hindrance of the threonate amine group (higher carbK ) along with the lower p AK
(then higher AmAK ).
Potassium glycinate did not show significant change on the 2CO solubility for
temperatures between 293 and 323 K. This result is somehow surprising and is a sign of
potential problems in the regeneration of the absorbent solutions.
The Deshmukh-Mather and the Kent-Eisenberg models were used to interpret the
equilibrium results. Although the predictions of both models significantly deviate from
the experimental results, they prove to qualitatively describe the system. These models
are particularly useful to provide the composition of the solutions (speciation) as a
function of loading and temperature. Speciation enables the prediction of 2CO
absorption rates in partially loaded solutions likely to take place in
absorption/desorption cycles.
No precipitation was observed for any of the solutions of potassium glycinate and
potassium threonate studied, which indicates that these are suitable for hollow fiber
membrane contactors, even if porous membranes are to be used.
Hollow Fiber Membrane Contactor Simulation
A coupled differential model for both gas and liquid phases was proposed to simulate
the mass transfer accompanied by chemical reaction, occurring during the absorption of
2CO into amino acid salt solutions flowing through a hollow fiber membrane contactor.
The model considered the liquid flowing in the fiber lumen and the gas in the shell side.
Both co- and counter-current operations were considered.
The developed model enables to assess the radial and axial concentration profiles in the
liquid and the axial velocity and concentration profiles in the gas.
Model results were compared to results obtained with conventional mass transfer
models valid for limit conditions and good agreement was found.

185
The performance of a hollow fiber membrane contactor for 2CO removal from
anaesthesia closed-loops was analysed. For this analysis, composite PDMS membranes
were assumed and aqueous solutions of potassium glycinate were considered as
absorbents. The physical, kinetic and equilibrium data experimentally obtained for
potassium glycinate were used in the simulations.
The influence of the design parameters packing density, contactor length and shell
diameter and of the operation parameters liquid flow rate and reactant feed
concentration, on the 2CO molar fraction exiting the contactor were studied. Based on
this study, a contactor with 5 cm shell diameter and 12.5 cm length, with a 3 M solution
of potassium glycinate flowing at 10 -1mL min⋅ , counter-currently with respect to the
gas was found to be suitable for the 2CO removal from closed anaesthetic breathing
circuits. A contactor with these dimensions would be easily retrofitted into a common
anaesthesia machine (note that common soda lime canisters have 1.5 L).
Suggestions for Future Work
Literature information about amino acid salts as 2CO absorbents is still scarce, although
it keeps increasing due to their potential application to flue gas treatment. A more
comprehensive data set is needed, namely concerning physical properties (such as
diffusion coefficients and physical solubility) and equilibrium and kinetics data. This
will allow for a more consistent implementation of the data analysis proposed in the
present work. Furthermore, it may serve as a basis for more complex and accurate
models.
In particular, there is a lack of information in the open literature concerning the
regeneration of the absorbent solutions. After absorbing 2CO , the solution should be
regenerated (possibly in another device) and used again for absorption. Therefore, it is
the cyclic performance of the solution which will define the viability of the global
process. Additionally, the regeneration is usually performed at high temperatures,

186
making this step critical in what concerns energy consumption. For these reasons,
research on the regeneration subject is suggested for future work.
Pursuing this suggestion, measurements of all properties at higher temperatures are
strongly recommended, since the studies of the 2CO absorption in amino acid salts
performed so far were limited to a relatively narrow temperature interval when
compared to the conditions expected to be found in cyclic absorption/regeneration
processes. Moreover, a method to determine the 2CO desorption kinetics should be
developed.
Concerning the specific application studied in the present work, 2CO removal from
anaesthetic gaseous circuits, it is suggested to perform multi component experiments
with gaseous mixtures similar to the ones present in real anaesthesia. In particular, these
mixtures should include the halogenated anaesthetics, in order to check the effect of
these compounds in the absorbent solutions as well as in the membrane materials.
Finally, the complete cyclic process should be simulated, experimentally validated and
further optimized for the required separations.

Appendix A
Details on the Experimental Setups Used

188
Details on the Experimental Setups Used
Some considerations on the setups used in the experimental work, which are not detailed
in the papers, are presented next.
All the experiments concerning potassium glycinate (apart the viscosity measurements)
were performed in the OOIP Group of the Department of Development and Design of
Industrial Processes in the Twente University, Enschede, The Netherlands. The setup
used for the physical solubility and kinetics measurements is presented in Figures A1
and A2. Descriptions of the experimental procedures are presented in Chapter 2.
Figure A1 – Setup used for the physical absorption and kinetics measurements of 2CO in
potassium glycinate (Chapter 2) - the gas vessel and pressure controller are located
behind the panel.
Gas in
Degassing and physical
solubility tank
Stirred Reactor

189
Figure A2 – Detail of the setup - stirred reactor (liquid volume: 600 cm3, reactor
diameter: 9.09 cm).
For the characterization of potassium threonate (Chapter 3), an apparatus with similar
functioning but with smaller dimensions (about 12 times smaller than the one used for
Chapter 2) was built in LEPAE - Laboratory for Process, Environmental and Energy, in
the Department of Chemical Engineering from the University of Porto. The setup,
designed and assembled by the author of this thesis, is shown in Figure A3.
The main advantage of using a reactor with smaller dimensions is that less reactant is
necessary for the experimental measurements. This makes the characterization more
economic and pursues the objective of characterizing non-commercially available
absorbents (although around 1 kg of absorbent is still needed for a reasonable
characterization). On the other hand, eventual experimental error sources (including
leaking, dead volumes, presence of solution drops in the reactor walls, among others)
have a much more noticeable effect on experimental results. To check the accuracy of
the setup assembled, results obtained for a 1 M solution of potassium glycinate at 298 K
were compared with these obtained with the setup used in Chapter 2. Figure A4 shows
the absorption flux as a function of the 2CO partial pressure obtained using the setups
shown in Figures A1 and A3.
Absorbent solution
Gas
Gas In

190
Figure A3 - Setup used for the determination of the physical absorption and reaction
kinetics of 2CO in potassium threonate (Chapter 3) and for the equilibrium
measurements of 2CO in potassium glycinate (Chapter 4) - liquid volume: 50 cm3,
reactor diameter: 3.87 cm.
Stirred reactor
Degassing tank
Gas vessel
Pressure controller

191
0 10 20 30 40
0.0000
0.0005
0.0010
0.0015
0.0020
0.0025
0.0030
0.0035
LEPAE - Porto UniversityOOIP - Twente University
( )2
210 PaCOP −×
( )-1 -1mol m sJ ⋅ ⋅
Figure A4 – Comparison of the experimental results obtained using the setup at Porto
University and using the setup from Twente University.
The setup shown in Figure A3 was also used to perform the experiments presented in
Part III (Chapter 4).