capricorn sanlam collective investments stable retail...
TRANSCRIPT
April 2017 • Fund Performance
Capricorn Sanlam Collective Investments Stable Retail Hedge Fund
Objective
Summary Statistics
Manager's Comments
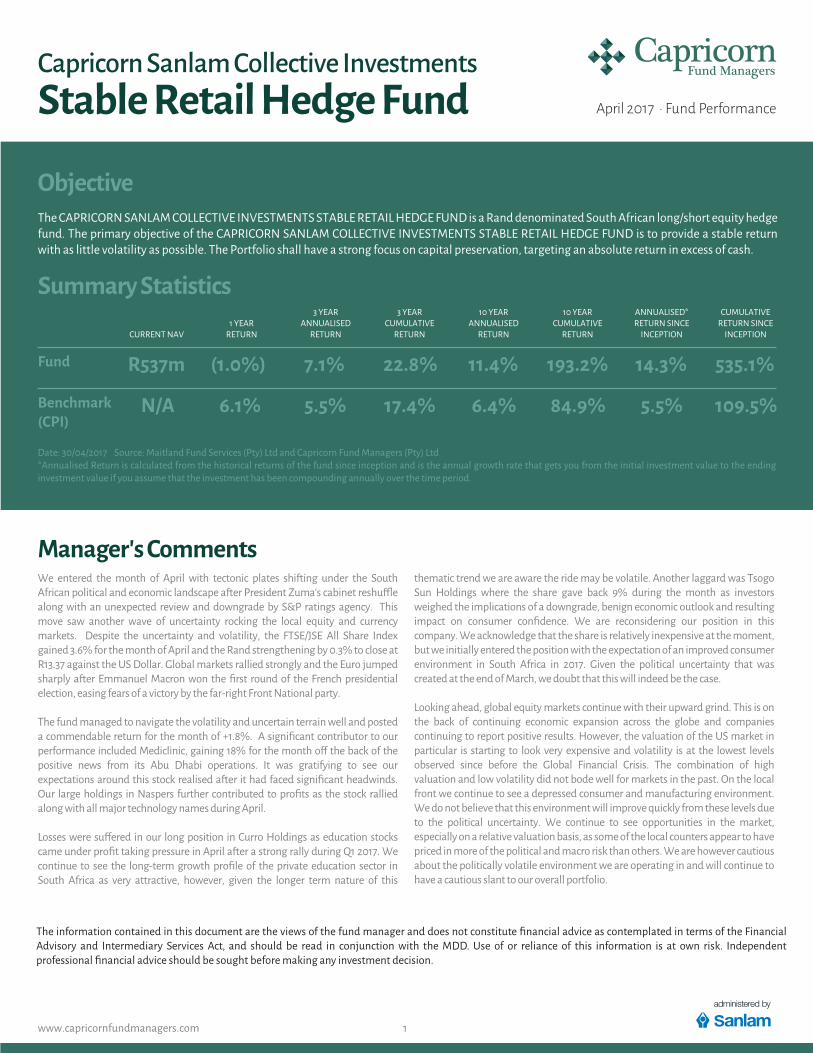
The CAPRICORN SANLAM COLLECTIVE INVESTMENTS STABLE RETAIL HEDGE FUND is a Rand denominated South African long/short equity hedge fund. The primary objective of the CAPRICORN SANLAM COLLECTIVE INVESTMENTS STABLE RETAIL HEDGE FUND is to provide a stable return with as little volatility as possible. The Portfolio shall have a strong focus on capital preservation, targeting an absolute return in excess of cash.
Fund
(1.0%)
1 YEARRETURN
6.1%Benchmark(CPI)
R537mCURRENT NAV
N/A
7.1%
3 YEARANNUALISED
RETURN
5.5%
22.8%
3 YEARCUMULATIVE
RETURN
17.4%
10 YEARANNUALISED
RETURN
11.4%
6.4%
10 YEARCUMULATIVE
RETURN
193.2%
84.9%
ANNUALISED*RETURN SINCE
INCEPTION
14.3%
5.5%
CUMULATIVERETURN SINCE
INCEPTION
535.1%
109.5%
Date: 30/04/2017 Source: Maitland Fund Services (Pty) Ltd and Capricorn Fund Managers (Pty) Ltd*Annualised Return is calculated from the historical returns of the fund since inception and is the annual growth rate that gets you from the initial investment value to the ending investment value if you assume that the investment has been compounding annually over the time period.
We entered the month of April with tectonic plates shifting under the South African political and economic landscape after President Zuma's cabinet reshuffle along with an unexpected review and downgrade by S&P ratings agency. This move saw another wave of uncertainty rocking the local equity and currency markets. Despite the uncertainty and volatility, the FTSE/JSE All Share Index gained 3.6% for the month of April and the Rand strengthening by 0.3% to close at R13.37 against the US Dollar. Global markets rallied strongly and the Euro jumped sharply after Emmanuel Macron won the first round of the French presidential election, easing fears of a victory by the far-right Front National party. The fund managed to navigate the volatility and uncertain terrain well and posted a commendable return for the month of +1.8%. A significant contributor to our performance included Mediclinic, gaining 18% for the month off the back of the positive news from its Abu Dhabi operations. It was gratifying to see our expectations around this stock realised after it had faced significant headwinds. Our large holdings in Naspers further contributed to profits as the stock rallied along with all major technology names during April. Losses were suffered in our long position in Curro Holdings as education stocks came under profit taking pressure in April after a strong rally during Q1 2017. We continue to see the long-term growth profile of the private education sector in South Africa as very attractive, however, given the longer term nature of this
thematic trend we are aware the ride may be volatile. Another laggard was Tsogo Sun Holdings where the share gave back 9% during the month as investors weighed the implications of a downgrade, benign economic outlook and resulting impact on consumer confidence. We are reconsidering our position in this company. We acknowledge that the share is relatively inexpensive at the moment, but we initially entered the position with the expectation of an improved consumer environment in South Africa in 2017. Given the political uncertainty that was created at the end of March, we doubt that this will indeed be the case. Looking ahead, global equity markets continue with their upward grind. This is on the back of continuing economic expansion across the globe and companies continuing to report positive results. However, the valuation of the US market in particular is starting to look very expensive and volatility is at the lowest levels observed since before the Global Financial Crisis. The combination of high valuation and low volatility did not bode well for markets in the past. On the local front we continue to see a depressed consumer and manufacturing environment. We do not believe that this environment will improve quickly from these levels due to the political uncertainty. We continue to see opportunities in the market, especially on a relative valuation basis, as some of the local counters appear to have priced in more of the political and macro risk than others. We are however cautious about the politically volatile environment we are operating in and will continue to have a cautious slant to our overall portfolio.
www.capricornfundmanagers.com 1
The information contained in this document are the views of the fund manager and does not constitute financial advice as contemplated in terms of the Financial Advisory and Intermediary Services Act, and should be read in conjunction with the MDD. Use of or reliance of this information is at own risk. Independent professional financial advice should be sought before making any investment decision.
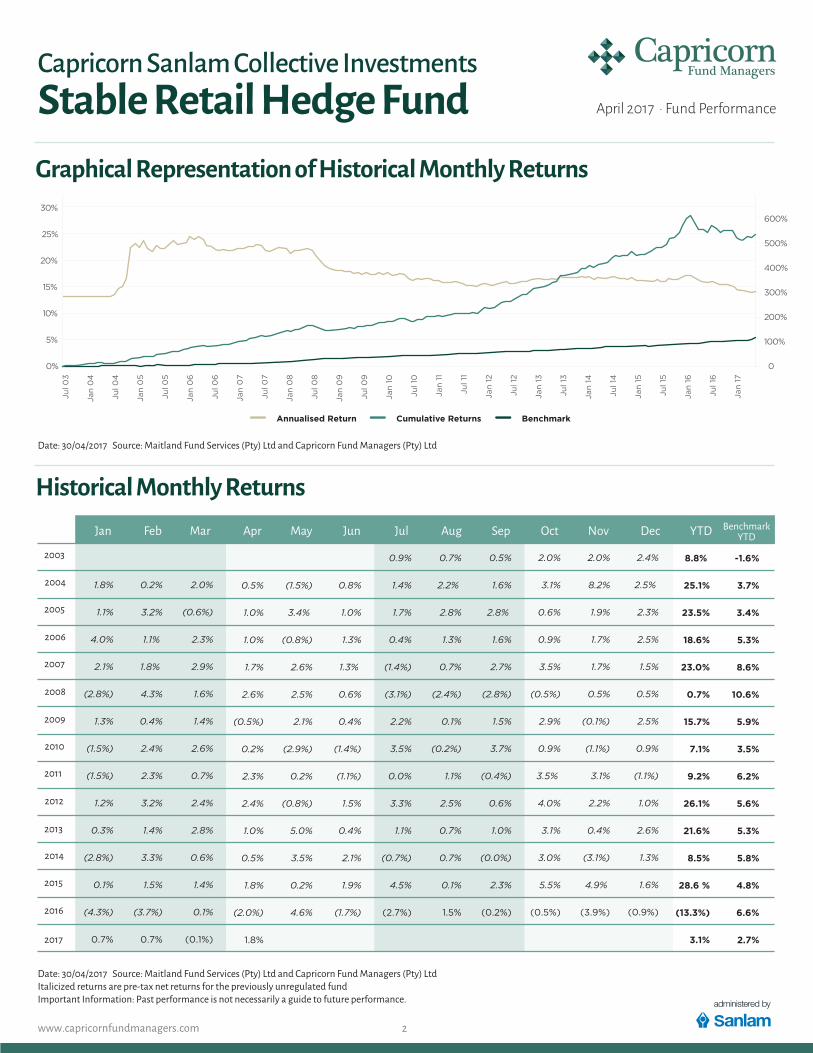
Graphical Representation of Historical Monthly Returns
Historical Monthly ReturnsOct Nov DecJan Feb Mar Apr May Jun Jul Aug Sep Benchmark
YTDYTD
2003
2004 1.8%
1.1%
4.0%
2.1%
(2.8%)
1.3%
(1.5%)
(1.5%)
1.2%
0.3%
(2.8%)
0.1%
(4.3%)
0.7%
0.2%
3.2%
1.1%
1.8%
4.3%
0.4%
2.4%
2.3%
3.2%
1.4%
3.3%
1.5%
(3.7%)
0.7%
2005
2006
2007
2008
2009
2010
2011
2012
2013
2014
2015
2016
2017
Date: 30/04/2017 Source: Maitland Fund Services (Pty) Ltd and Capricorn Fund Managers (Pty) LtdItalicized returns are pre-tax net returns for the previously unregulated fundImportant Information: Past performance is not necessarily a guide to future performance.
2.0%
(0.6%)
2.3%
2.9%
1.6%
1.4%
2.6%
0.7%
2.4%
2.8%
0.6%
1.4%
0.1%
(0.1%)
2.4%
2.5%
2.3%
2.5%
1.5%
0.5%
2.5%
0.9%
(1.1%)
1.0%
2.6%
1.3%
1.6%
(0.9%)
2.0%
8.2%
1.9%
1.7%
1.7%
0.5%
(0.1%)
(1.1%)
3.1%
2.2%
0.4%
(3.1%)
4.9%
(3.9%)
2.0%
3.1%
0.6%
0.9%
3.5%
(0.5%)
2.9%
0.9%
3.5%
4.0%
3.1%
3.0%
5.5%
(0.5%)
0.5%
1.6%
2.8%
1.6%
2.7%
(2.8%)
1.5%
3.7%
(0.4%)
0.6%
1.0%
(0.0%)
2.3%
(0.2%)
0.7%
2.2%
2.8%
1.3%
0.7%
(2.4%)
0.1%
(0.2%)
1.1%
2.5%
0.7%
0.7%
0.1%
1.5%
0.9%
1.4%
1.7%
0.4%
(1.4%)
(3.1%)
2.2%
3.5%
0.0%
3.3%
1.1%
(0.7%)
4.5%
(2.7%)
0.8%
1.0%
1.3%
1.3%
0.6%
0.4%
(1.4%)
(1.1%)
1.5%
0.4%
2.1%
1.9%
(1.7%)
(1.5%)
3.4%
(0.8%)
2.6%
2.5%
2.1%
(2.9%)
0.2%
(0.8%)
5.0%
3.5%
0.2%
4.6%
0.5%
1.0%
1.0%
1.7%
2.6%
(0.5%)
0.2%
2.3%
2.4%
1.0%
0.5%
1.8%
(2.0%)
1.8%
8.8%
25.1%
23.5%
18.6%
23.0%
0.7%
15.7%
7.1%
9.2%
26.1%
21.6%
8.5%
28.6 %
(13.3%)
3.1%
-1.6%
3.7%
3.4%
5.3%
8.6%
10.6%
5.9%
3.5%
6.2%
5.6%
5.3%
5.8%
4.8%
6.6%
2.7%
30%
25%
20%
15%
10%
5%
0%
Jul 0
3
Jan
04
Jul 0
4
Jan
05
Jul 0
5
Jul 0
6
Jan
06
Jul 0
7
Jan
07
Jul 0
8
Jan
08
Jul 0
9
Jan
09
Jul 1
0
Jan
10
Jul 1
1
Jan
11
Jul 1
2
Jan
12
Jul 1
3
Jan
13
Jul 1
4
Jan
14
Jul 1
5
Jan
15
Jul 1
6
Jan
16
Jan
17
600%
500%
400%
300%
200%
100%
0
Annualised Return Cumulative Returns Benchmark
Date: 30/04/2017 Source: Maitland Fund Services (Pty) Ltd and Capricorn Fund Managers (Pty) Ltd
www.capricornfundmanagers.com 2
April 2017 • Fund Performance
Capricorn Sanlam Collective Investments Stable Retail Hedge Fund

Frequency Distribution ofMonthly Returns Since Inception Assets Under Management (R Million)
Gross exposure Net Exposure% of positive months% of negative monthsAverage positive monthly returnAverage negative monthly returnAnnualised monthly volatility (historic)Sharpe RatioMaximum monthly drawdownMaximum cumulative drawdown
537m126%
39%79%21%
1.9%(1.6%)
6.6%1.0
(4.3%)(13.3%)
Statistics
Date: 30/04/2017 Source: Maitland Fund Services (Pty) Ltd and Capricorn FundManagers (Pty) Ltd
Launch Date: (Regulated Fund) 01/07/2016Inception Date 01/07/2003
-6%
0%
5%
10%
20%
15%
25%
-6%
to -5
%
-4%
to -3
%
-5%
to -4
%
-3%
to -2
%
-2%
to -1
%
-1%
to 0
%
0% to
1%
1% to
2%
2% to
3%
3% to
4%
4% to
5%
5% to
6%
6%+
Freq
uenc
y %
Return Bands
www.capricornfundmanagers.com 3
April 2017 • Fund Performance
Capricorn Sanlam Collective Investments Stable Retail Hedge Fund
Contact Information
Investment ManagerCapricorn Fund Managers (Pty) LimitedCapricorn House32 Impala RdChislehurston2196South Africa
For enquiries please contact
Management CompanySanlam Collective Investments(RF) (Pty) LimitedT: +27 21 916 6910E: [email protected]
Stephan EngelbrechtT: +27 11 666 0748E: [email protected]
Licensed by the Financial Services BoardLicense number: 863
www.capricornfundmanagers.com 4
Important InformationSanlam Collective Investments (RF) (Pty) Ltd registered and approved Manager in Collective Investment Schemes in Securities. Collective investment schemes are generally medium- to long-term investments. Past performance is not necessarily a guide to future performance, and that the value of investments / units / unit trusts may go down as well as up. A schedule of fees and charges and maximum commissions is available from the Manager on request. Collective investments are traded at ruling prices and can engage in borrowing and scrip lending. The Manager does not provide any guarantee either with respect to the capital or the return of a portfolio. Performance is based on NAV to NAV calculations with income reinvestments done on the ex-div date. Performance is calculated for the portfolio and the individual investor performance may
differ as a result of initial fees, actual investment date, date of reinvestment and dividend withholding tax. Performance fees are calculated at 20% above the benchmark performance (CPI). Lump sum investment performances are being quoted. Sanlam Collective Investments retains full legal responsibility for this co-named portfolio. The portfolio management of the fund is outsourced to Capricorn Fund Managers, an authorised financial services provider in terms of the FAIS Act. The Manager has a right to close the portfolio to new investors in order to manage it more efficiently in accordance with its mandate. The information contained within this document has been prepared by Capricorn Fund Managers (Pty) Ltd and is unaudited. Returns as shown are the weighted average of all issued series.
April 2017 • Fund Performance
Capricorn Sanlam Collective Investments Stable Retail Hedge Fund