capital area metropolitan planning organization (campo), texas city of austin, office of...
TRANSCRIPT
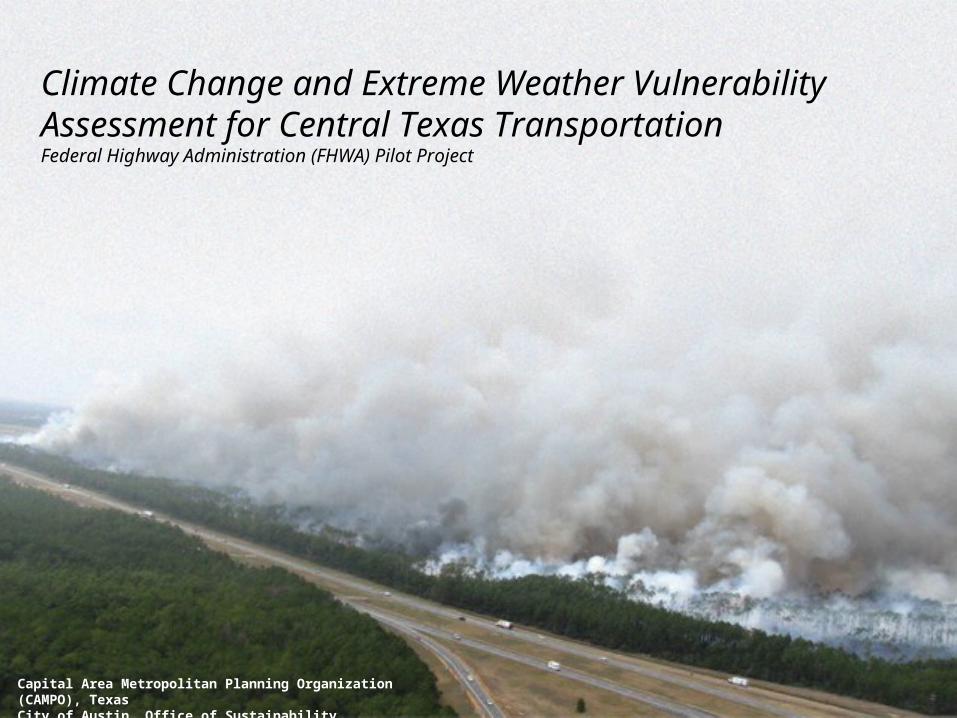
Capital Area Metropolitan Planning Organization (CAMPO), TexasCity of Austin, Office of Sustainability
Climate Change and Extreme Weather Vulnerability Assessment for Central Texas TransportationFederal Highway Administration (FHWA) Pilot Project

Two types:
Vulnerability Assessment Pilot
Adaptation Options and Integration
Completion Date September 2014 Evaluate and rank assets
CRITICALITY TO REGIONAL TRANSPORTATION
VULNERABILITY TO EXTREME WEATHER EVENTS
Use and share results Transferable methodology
FHWA Pilot Project
2013 Vulnerability Assessment
recipients:
Alaska DOT
Arizona DOT
Capital Area MPO (CAMPO)
Connecticut DOT (ConnDOT)
Iowa DOT
Maine DOT
Michigan DOT
Minnesota DOT (MNDOT)
North Central Texas Council of
Governments
Tennessee DOT (TDOT)

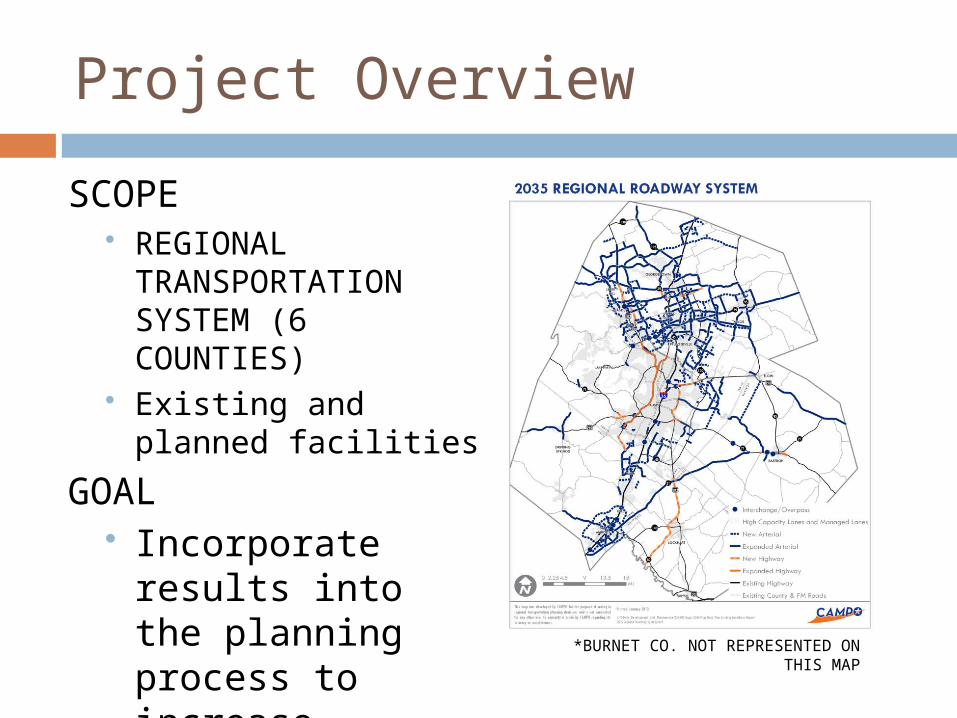
Project Overview
PROJECT AREA
POPULATION (April 1st, 2013)
CITY OF AUSTIN: 842,750 REGIONAL: 1,870,872 REGIONAL 2035: 3,250,000

Project Overview
UNIQUE FEATURES TOPOGRAPHY &
GEOLOGY WEST - ROCKY HILL
COUNTRY EAST – FLAT, SOFTER
SOILS
SOURCE: CAMPO, FEMA
SOURCE: GEOLOGIC ATLAS OF TEXAS, TEXAS WATER DEVELOPMENT BOARD

Project Overview
SOURCE: EPASOURCE: USDA
MAP: ADMINISTRATIVE CLIMATE DIVISIONS OF TEXAS
Project Overview
SCOPE REGIONAL
TRANSPORTATION SYSTEM (6 COUNTIES)
Existing and planned facilities
GOAL Incorporate results
into the planning process to increase climate resiliency
*BURNET CO. NOT REPRESENTED ON THIS MAP

Roads Bridges Passenger rail Freight rail Airport Public Transportation Bicycle and Pedestrian
Asset categories to be considered:

Potential Impacts
Insert picture
CLIMATE CHANGE EFFECT
IMPACTS
Higher high temperatures, more hot days
• Asphalt deterioration, road buckling• Thermal expansion of railroad tracks and paved surfaces • Changes to biodiversity (impacts pest management, wetlands commitments,
endangered and invasive species)• Pavement & structural design changes
Drought /Lack of precipitation
• Shrinking clay soil – road damage & water main breaks• Loss of vegetation and soil stabilization• Changes to biodiversity• Increase in wildfires
More frequent, intense wind speeds
• More frequent sign damage, truck rollovers, debris disruptions • Power outages, disrupted traffic lights and other electronic infrastructure• Disrupted air travel• Increase in wildfires
More frequent, intense precipitation
• Loss of visibility, lane obstruction• Increased flooding of roads- weather-related delays, traffic disruption• influence scour rates - size requirements for culverts• Standing water impact on road base • Erosion of road base resulting in structural failures• Impact on emergency services and evacuation routes

Local Impacts
Buckling roads - 2009
Drought: Disrupted Water - 2011
Flooding: Tropical Storm Hermine - 2010Wildfires - 2011
High winds - 2013
Fallen tree - 2013
Aftermath of wildfire - 2011
Sinkhole - 2009

Asset Categories
Impact
Impact-Asset Relationships
Threshold
Railroads Heat Increases in temperature lead to increased risk of buckling and expansion.
110°F cited as threshold for buckling. At 90°F, rail speed is slowed.
Roads and health
Heat High temperatures can increase health and safety risk as well as engine and equipment heat stress
Health and safety risk as well as possible engine/equipment heat stress begins at around 85°F, but the situation becomes more critical at 105-110°F.
Roads and Highways
Wind High winds cause safety risks and travel delays, a loss of visibility, impaired mobility, loss of communications and power, freight/cargo damage risk, increased risk of collisions/spills of hazardous cargo, and transport schedule delays.
Winds become dangerous to road maintenance, truck operations, and other road users at around 39 mph and are very dangerous at 74
mph.
Airports Rain An increase in precipitation can impede aircraft traffic and flight departure/arrivals.
Heavy rain of 1 to 2 inches per hour. When runway becomes wet from precipitation.
Infrastructure
Drought
A decrease in precipitation coupled with heat can cause clay soils to shrink and disrupt waterlines
40 consecutive days over 100°F without rain may impact water infrastructure
Setting Thresholds (Mobile AL. example)

Adaptation Framework

Risk Assessment Vulnerability = Exposure, Sensitivity, Adaptive Capacity Vulnerability Assessment Matrix
Adaptation Framework

Challenges and Opportunities Combining and understanding multiple
disciplines
Communicating relevance given varied opinions on climate change in the region
Incorporating results into existing processes and avoiding “just another study on the shelf”.

Questions?