vulnerability to weather disasters: the choice of … vulnerability to weather disasters: the choice...
TRANSCRIPT
1
Vulnerability to weather disasters: the choice of coping strategies in rural Uganda
Jennifer Helgeson, Simon Dietz and Stefan
Hochrainer-Stigler
October 2012
Centre for Climate Change Economics and Policy Working Paper No. 107
Grantham Research Institute on Climate Change and the Environment
Working Paper No. 91
2
The Centre for Climate Change Economics and Policy (CCCEP) was established by the University of Leeds and the London School of Economics and Political Science in 2008 to advance public and private action on climate change through innovative, rigorous research. The Centre is funded by the UK Economic and Social Research Council and has five inter-linked research programmes:
1. Developing climate science and economics 2. Climate change governance for a new global deal 3. Adaptation to climate change and human development 4. Governments, markets and climate change mitigation 5. The Munich Re Programme - Evaluating the economics of climate risks and
opportunities in the insurance sector More information about the Centre for Climate Change Economics and Policy can be found at: http://www.cccep.ac.uk. The Grantham Research Institute on Climate Change and the Environment was established by the London School of Economics and Political Science in 2008 to bring together international expertise on economics, finance, geography, the environment, international development and political economy to create a world-leading centre for policy-relevant research and training in climate change and the environment. The Institute is funded by the Grantham Foundation for the Protection of the Environment, and has five research programmes:
1. Global response strategies 2. Green growth 3. Practical aspects of climate policy 4. Adaptation and development 5. Resource security
More information about the Grantham Research Institute on Climate Change and the Environment can be found at: http://www.lse.ac.uk/grantham. This working paper is intended to stimulate discussion within the research community and among users of research, and its content may have been submitted for publication in academic journals. It has been reviewed by at least one internal referee before publication. The views expressed in this paper represent those of the author(s) and do not necessarily represent those of the host institutions or funders.
3
Vulnerability to weather disasters: the choice of coping strategies in rural Uganda Authors: Jennifer Helgeson Grantham Research Institute on Climate Change & the Environment Department of Geography & Environment London School of Economics & Political Science (LSE) Houghton Street London WC2A 2AE, United Kingdom Tel: +44 779 061 9224 Email: [email protected] Simon Dietz Grantham Research Institute on Climate Change & the Environment Department of Geography & Environment London School of Economics & Political Science (LSE) Houghton Street London WC2A 2AE, United Kingdom Tel: +44 207 955 7589 Email: [email protected] Stefan Hochrainer-Stigler IIASA – International Institute for Applied Systems Analysis Schlossplatz 1 A-2361 Laxenburg, Austria Tel.: +43 2236 807-517 Fax: +43 2236 807-466 Email: [email protected] We would like to thank seminar participants at LSE, the editors of the journal and of this special issue, and two anonymous referees for comments on the research. The financial support of the Grantham Foundation for the Protection of the Environment is gratefully acknowledged, as is that of the Centre for Climate Change Economics and Policy, which is funded by the UK Economic and Social Research Council (ESRC) and Munich Re. We would also like to thank the Grameen Foundation for financial and logistical support, especially allowing us to use the Community Knowledge Worker network.
4
Abstract When a natural disaster hits, the affected households try to cope with its impacts. A variety of coping strategies may be employed, from reducing current consumption to disposing of productive assets. The latter strategies are especially worrisome, as they may reduce the capacity of the household to generate income in the future, possibly leading to chronic poverty. In this paper, we use the results of a household survey in rural Uganda to ask, first, what coping strategies would tend to be employed in the event of a weather disaster, second, given that multiple strategies can be chosen, in what combinations would they tend to be employed, and, third, given that asset-liquidation strategies can be particularly harmful for the future income prospects of households, what determines their uptake? Our survey is one of the largest of its kind, containing over 3000 observations garnered by local workers using smart-phone technology. We find that in this rural sample by far the most frequently reported choice would be to sell livestock. This is rather striking, since asset-based theories would predict more reliance on strategies like eating and spending less today, which avoid disposal of productive assets. It may well be that livestock are held as a form of liquid savings to, among other things, help bounce back from a weather disaster. Yet we do find that other strategies, which might undermine future prospects, are avoided, notably selling land or the home, and disrupting the children’s education. Our econometric analysis reveals a fairly rich set of determinants of different subsets of coping strategies. Perhaps most notably, households with a more educated head are much less likely to choose coping strategies involving taking their own children out of education. Keywords Coping strategies, covariate risk, education, extreme weather, poverty trap, small-scale farming, vulnerability, Uganda
5
Vulnerability to weather disasters: the choice of coping strategies in rural Uganda I. Introduction Extreme weather events often have severe impacts on lives and livelihoods in the developing world and climate change is predicted, with varying degrees of confidence, to increase the frequency and intensity of extreme weather in the future (IPCC 2012). It is therefore of great interest to investigate how vulnerability to extreme weather can be reduced. One aspect of vulnerability is the way in which households cope in the aftermath of a weather disaster. A variety of coping strategies may be employed, from reducing current consumption by, for example, reducing expenditure and food intake, to disinvestment by, for example, disposing of assets such as land and livestock, and reducing investment in educating children. Disinvestment strategies are especially worrisome as, by eroding the household's capital stock now and in the future, they may reduce the capacity of the household to generate income, which may eventually lead it into chronic poverty. In this paper, we use the results of a household survey in rural Uganda to inquire into the nature of coping strategies used after an extreme weather event and their drivers. Our survey is of one of the largest of its kind, containing over 3000 observations garnered by local workers using smart-phone technology. As part of a much larger survey, we constructed a hypothetical scenario in which our respondents are exposed to a large drought/flood, which renders them unable to rely on formal support from the market or state, or from local remittances. We asked them to state which coping strategies they would expect to employ in this scenario. This enables us to investigate three things. First, we investigate the nature of the coping strategies most frequently employed: do respondents turn most often to strategies that reduce current consumption but avoid disinvestment? Or are they in fact more likely to disinvest, and in what? Second, given that multiple strategies can be chosen, we investigate what combinations would tend to be employed. This gives us further insight into the propensity of surveyed households to disinvest: are disinvestment strategies chosen alongside consumption-reduction strategies, or in isolation? Finally, using the wealth of socio-economic information that we collected in other parts of the survey, we investigate what determines the uptake of disinvestment strategies that can be particularly harmful for the future income prospects of households. The rest of the paper is set out as follows. Section II sets the scene, including surveying relevant literature. Section III introduces our study area, comprising two regions of rural Uganda, and provides information about how we administered our survey, as well as the characteristics of our sample. Section IV presents data to address our first two questions, namely those on the prevalence of particular coping strategies in isolation and in combination. We use simple reported frequencies as well as Principal Components Analysis. Section V goes on to analyze the determinants of two subsets of coping strategy, using probit regression models. First, given its importance as a strategy to our sample, we analyze what characteristics of households make them more likely to sell livestock as a means to cope with a weather disaster. Second, given the possibly significant long-run effects of doing so, we analyze the characteristics of households more likely to disrupt their children’s education. Section VI completes the paper by providing a discussion.
6
II. Natural disasters, vulnerability and coping strategies The ultimate impact of a natural disaster on a household depends on the household’s vulnerability to its effects. In the literature on vulnerability, it is often conceptualized as a function of three elements: exposure, sensitivity and adaptive capacity (e.g. Adger and Winkels 2007). Depending on the unit of analysis (e.g. the individual, the nation, etc.), these can take somewhat different meanings, although the basic scope of the framework remains the same. For our purposes, exposure depends on the physical characteristics of the natural hazard, including its magnitude and frequency of occurrence. This makes sense when the unit of analysis is a particular household in space and time, as here, but otherwise exposure clearly also depends on who lives where and what is the value of assets and so on. Sensitivity in the household context denotes the extent to which it can absorb the impacts of the disaster without suffering long-term harm. Adaptive capacity represents the ability of the household to evolve in order to cope with a changing exposure to natural disasters. Therefore when one takes a snapshot of household circumstances at a particular point in time, adaptive capacity is reduces sensitivity, and it is convenient to take the two together. In terms of exposure, it is well known that Africa, especially sub-Saharan Africa, experiences a large number of droughts and floods, and, while there is considerable uncertainty, there is some evidence from predictive modeling studies to suggest that extreme weather will become more frequent in the future due to anthropogenic climate change (these issues are authoritatively summarized in Boko et al. 2007 and IPCC 2012). In terms of sensitivity and adaptive capacity, it is also widely understood that the impacts of natural disasters are disproportionately large in the developing world, especially Africa (and most especially rural Africa). Our interest here is, however, more fine-grained and concerns differential vulnerability to extreme weather within the rural developing world, in particular between households living in a broadly similar socio-economic context (i.e. rural Uganda). One of the proximate determinants of vulnerability is the choice of strategies households make to manage natural-disaster risks. Strategies for managing natural-disaster risks are usually divided into ex ante and ex post (e.g. Mechler 2004). Our interest in this paper is in ex post ‘coping’ strategies. Like ex ante strategies, these can be grouped into formal (i.e. market-based or publicly provided) and informal (i.e. self-organized on the individual or household/group levels). When coping with the aftermath of a natural disaster, a household faces a form of portfolio-choice problem. The portfolio could include everything from reducing spending and eating less, through begging and borrowing, migration, selling physical assets, taking children out of school either to work or live elsewhere, to relying on state-based disaster relief, remittances or insurance pay-outs. Rural households in developing countries, however, have in most cases a very limited portfolio, including reducing current spending on food and other items (if possible, given the constraints set by subsistence), and disposing of assets such as livestock and land. One of the reasons for this limited choice set is the unavailability of formal strategies, due to weak public services and a lack of penetration of market-based instruments (due in turn to, for
7
example, a lack of institutions to provide finance or a lack of collateral). Another is the nature of the disaster: in many cases, including the cases of interest in this paper, the disaster affects the majority of individuals simultaneously (a covariate risk), such that informal insurance structures (e.g. family and social networks) do not provide effective relief either. This unfortunate combination of circumstances can mean that, in the event of a covariate natural hazard, the poorest households may resort to coping strategies tipping them towards chronic poverty, sometimes conceptualized as a ‘poverty trap’ (Barrett et al. 2006). A poverty trap exists if a household’s assets fall to a level below which income growth cannot be supported and this approach is used to explain low growth paths after disaster events (Carter and Barrett 2006). That is, a lack of productive assets is seen as the most significant driver of the poor falling into vicious circles of extreme poverty (Carter et al. 2007). Therefore, in the context of coping with natural disasters, the key issue is whether a household will need to liquidate productive assets or equivalently reduce the rate of investment in assets, providing it with a means of survival in the short run, but eroding its capacity to earn income and livelihoods in the longer run. In this paper, we are interested in what coping strategies households would employ in the aftermath of a (covariate) natural disaster, and what determines the choice of coping strategies involving various kinds of disinvestment. Within the subset of coping strategies that are likely to damage long-term prospects by disinvesting, we include a focus on strategies involving the disruption and curtailment of children’s education. Theories of growth recognize the increasing role of human-capital formation in the development process, in particular a shift in the course of development from demand for skills acquired on the job to skills acquired through formal education (e.g. Galor 2011). It may be assumed that the rational approach to coping with a natural disaster is for a household to first choose those coping strategies, which do not erode the household’s productive assets now and their accumulation for the future, resorting to disinvestment only when absolutely necessary. Corbett’s (1988) well-known review of the literature on coping with famine interprets various case studies as saying exactly this (see also Ellis and Mdoe 2003, and Ravallion 1997), and it is consistent with Banerjee’s (2000) explanation of ‘poverty as vulnerability’. However, recent empirical literature yields contrasting and nuanced findings. In terms of coping strategies that reduce human-capital investment by sending children to work rather than to school, there is some specific evidence that they are avoided for as long as possible (Flug et al. 1998), consistent with the idea that they fall low in the priority-ordering of strategies. But other studies find that this does not hold true for the poorest households, for whom the immediacy of coping outweighs future returns to human-capital investment (Jacoby and Skoufias 1997, Duryea 1998, and Skoufias and Parker 2002). The notion clearly emerges that coping-strategy choice depends on household circumstances. Similarly there is mixed evidence on how we should consider the sale of livestock as a coping strategy. Some studies find that selling livestock is one of the first coping strategies households turn to, because livestock are held as a form of liquid savings for, among other things, coping with natural disasters (Dercon 1998, Kinsey et al.1998). Other studies find that the sale of livestock plays a marginal role in coping with extreme weather, however, or is only employed if households do not have access to other methods of risk-sharing such as formal credit (Fafchamps and Gavian 1996, Kazianga and Udry 2006), which is actually
8
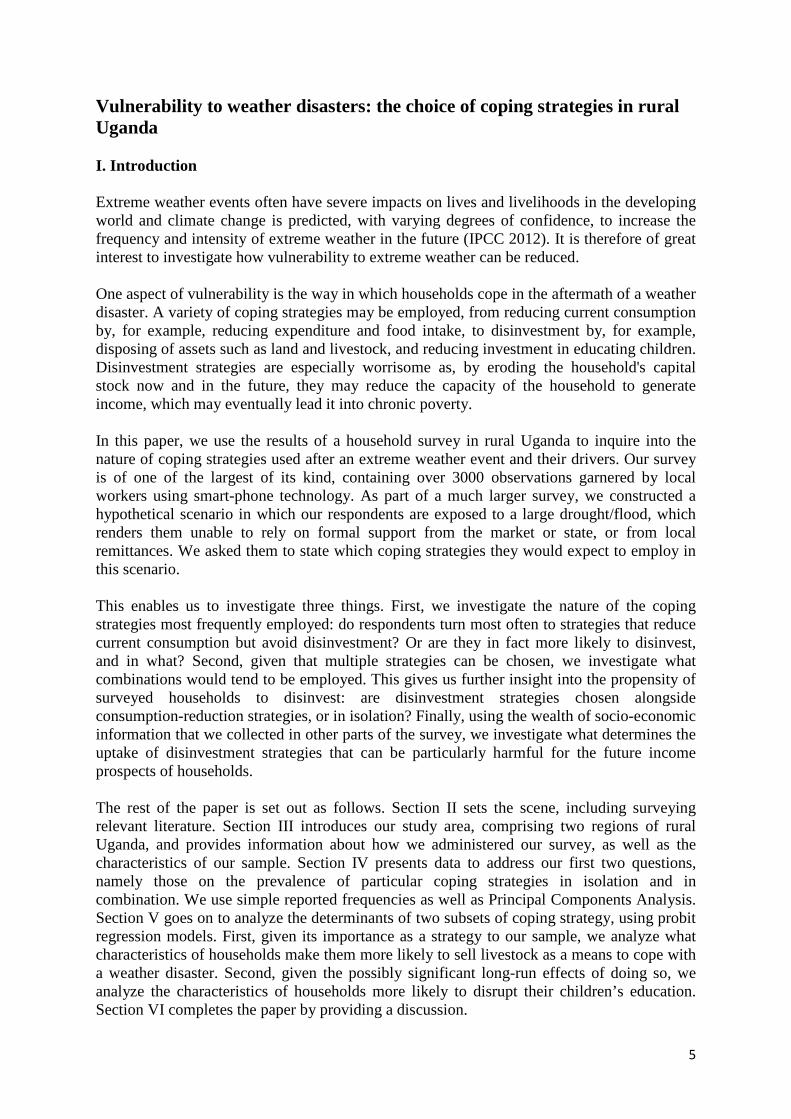
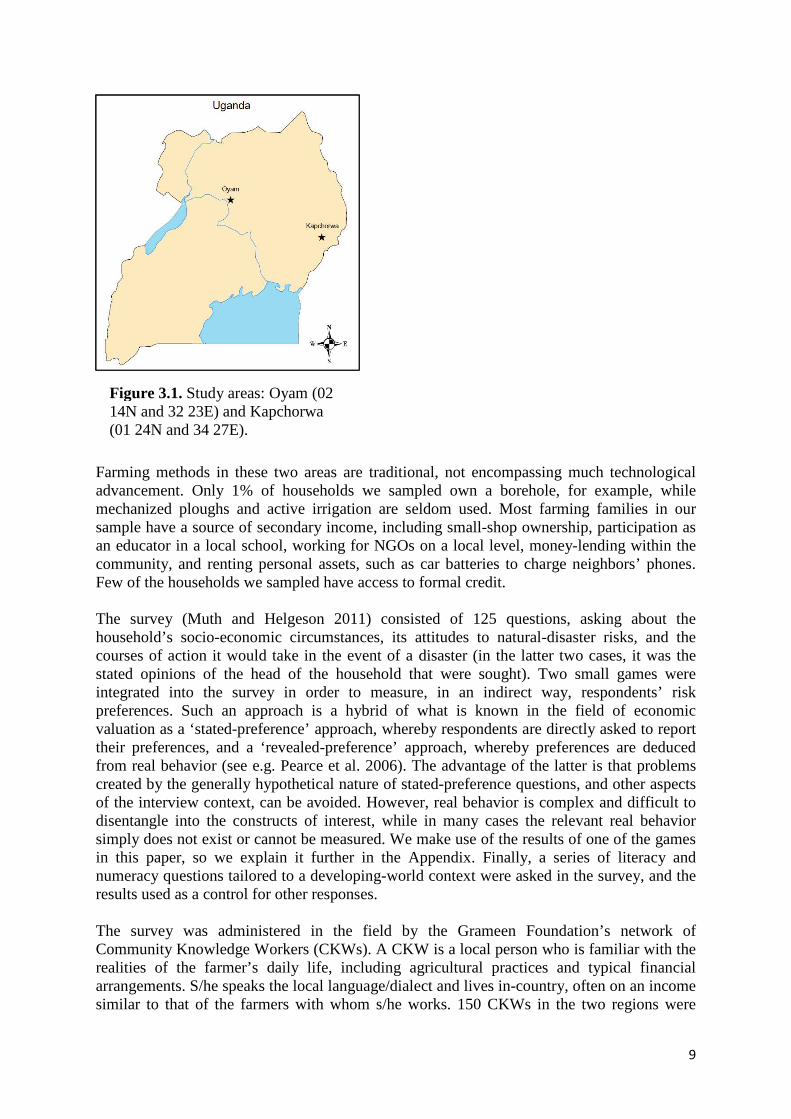
rather uncommon in many rural parts of sub-Saharan Africa. Two factors that may bear upon the reliance on selling livestock are, first, the extent to which households need to augment cash income as opposed to food consumption, and, second, the type of natural disaster: sale of livestock makes more sense when the environmental shock is a drought or flood, because the shock reduces available grazing land and some or all of the livestock could be lost anyway. In the process of looking at what coping strategies are employed, these studies also offer up clues about the determinants of choice. Unsurprisingly household income/wealth is seen to play quite a strong role, and this is corroborated by other literature on differential vulnerability (e.g. Wisner et al. 2004). Other studies, however, stress that social and demographic factors such as ethnicity, gender, age and seniority within the community may also be at play (e.g. Anderson and Woodrow 1998, Eade 1998). Further clues are provided, by analogy, by the literature on climate vulnerability at the global level, which has stressed the contribution to vulnerability from low incomes (as above), a lack of livelihood diversification, a lack of infrastructure (including infrastructure that provides resilience to extreme weather, such as water storage and flood defense), limited access to credit and insurance, and weak social safety nets (e.g. Stern 2007). In the context of credit and social safety nets, one way to cope that may still be operable after a covariate natural disaster is through remittances. As mobile banking has taken hold throughout sub-Saharan Africa, remittances have surged (Blumenstock et al. 2011, Jack and Suri 2001). This paper contributes to the literature on coping strategies by reporting relevant results from one of the largest surveys of household disaster-risk management in the developing world, implemented using novel smart-phone technology with the help of a network of local Community Knowledge Workers. We provide new evidence on which coping strategies are used most frequently. In particular, we add to the literature pointing to the importance of selling livestock as a means of recovering from a disaster, but we also focus on how often households fall back on disinvestment in the education of children, and the associated causes. The effect of natural disasters on household investment in children’s education has not been studied extensively to date. In the next section we explain the survey design and the surveyed area, including descriptive statistics. III. Survey design The survey on which our results are based was conducted in two districts of Uganda. Oyam district is in northern Uganda, bordering the recently war-torn Gulu region. Oyam town lies at 02 14N and 32 23E, at an altitude of 900m. The second district is Kapchorwa, in the east of Uganda bordering Kenya and encompassing Mt. Elgon. Kapchorwa town lies at 01 24N and 34 27E. The two regions were chosen to capture intra-country variation in disposable income, as well, of course, as geographic location. Nevertheless the economies of both regions are based primarily on subsistence agriculture. Figure 3.1 maps the study areas in the context of Uganda.
9
Farming methods in these two areas are traditional, not encompassing much technological advancement. Only 1% of households we sampled own a borehole, for example, while mechanized ploughs and active irrigation are seldom used. Most farming families in our sample have a source of secondary income, including small-shop ownership, participation as an educator in a local school, working for NGOs on a local level, money-lending within the community, and renting personal assets, such as car batteries to charge neighbors’ phones. Few of the households we sampled have access to formal credit. The survey (Muth and Helgeson 2011) consisted of 125 questions, asking about the household’s socio-economic circumstances, its attitudes to natural-disaster risks, and the courses of action it would take in the event of a disaster (in the latter two cases, it was the stated opinions of the head of the household that were sought). Two small games were integrated into the survey in order to measure, in an indirect way, respondents’ risk preferences. Such an approach is a hybrid of what is known in the field of economic valuation as a ‘stated-preference’ approach, whereby respondents are directly asked to report their preferences, and a ‘revealed-preference’ approach, whereby preferences are deduced from real behavior (see e.g. Pearce et al. 2006). The advantage of the latter is that problems created by the generally hypothetical nature of stated-preference questions, and other aspects of the interview context, can be avoided. However, real behavior is complex and difficult to disentangle into the constructs of interest, while in many cases the relevant real behavior simply does not exist or cannot be measured. We make use of the results of one of the games in this paper, so we explain it further in the Appendix. Finally, a series of literacy and numeracy questions tailored to a developing-world context were asked in the survey, and the results used as a control for other responses. The survey was administered in the field by the Grameen Foundation’s network of Community Knowledge Workers (CKWs). A CKW is a local person who is familiar with the realities of the farmer’s daily life, including agricultural practices and typical financial arrangements. S/he speaks the local language/dialect and lives in-country, often on an income similar to that of the farmers with whom s/he works. 150 CKWs in the two regions were
Figure 3.1. Study areas: Oyam (02 14N and 32 23E) and Kapchorwa (01 24N and 34 27E).
10
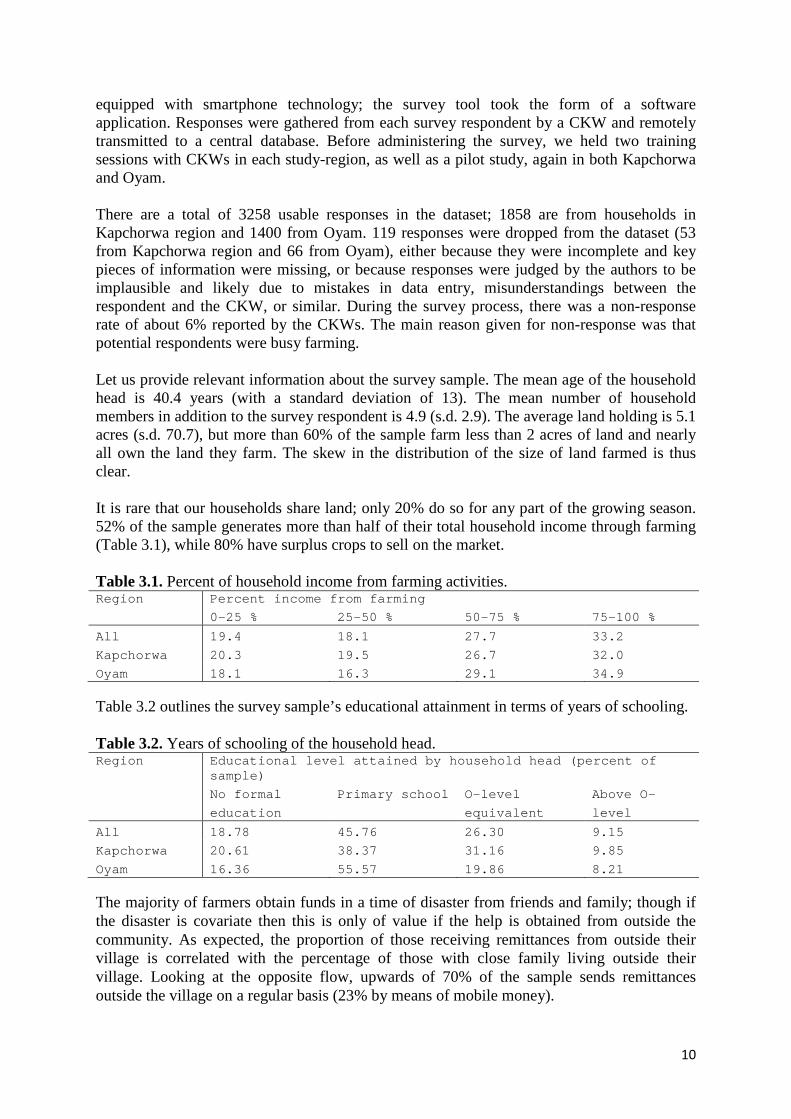
equipped with smartphone technology; the survey tool took the form of a software application. Responses were gathered from each survey respondent by a CKW and remotely transmitted to a central database. Before administering the survey, we held two training sessions with CKWs in each study-region, as well as a pilot study, again in both Kapchorwa and Oyam. There are a total of 3258 usable responses in the dataset; 1858 are from households in Kapchorwa region and 1400 from Oyam. 119 responses were dropped from the dataset (53 from Kapchorwa region and 66 from Oyam), either because they were incomplete and key pieces of information were missing, or because responses were judged by the authors to be implausible and likely due to mistakes in data entry, misunderstandings between the respondent and the CKW, or similar. During the survey process, there was a non-response rate of about 6% reported by the CKWs. The main reason given for non-response was that potential respondents were busy farming. Let us provide relevant information about the survey sample. The mean age of the household head is 40.4 years (with a standard deviation of 13). The mean number of household members in addition to the survey respondent is 4.9 (s.d. 2.9). The average land holding is 5.1 acres (s.d. 70.7), but more than 60% of the sample farm less than 2 acres of land and nearly all own the land they farm. The skew in the distribution of the size of land farmed is thus clear. It is rare that our households share land; only 20% do so for any part of the growing season. 52% of the sample generates more than half of their total household income through farming (Table 3.1), while 80% have surplus crops to sell on the market. Table 3.1. Percent of household income from farming activities. Region Percent income from farming
0-25 % 25–50 % 50-75 % 75-100 %
All 19.4 18.1 27.7 33.2
Kapchorwa 20.3 19.5 26.7 32.0
Oyam 18.1 16.3 29.1 34.9
Table 3.2 outlines the survey sample’s educational attainment in terms of years of schooling. Table 3.2. Years of schooling of the household head. Region Educational level attained by household head (percent of
sample)
No formal
education
Primary school O-level
equivalent
Above O-
level
All 18.78 45.76 26.30 9.15
Kapchorwa 20.61 38.37 31.16 9.85
Oyam 16.36 55.57 19.86 8.21
The majority of farmers obtain funds in a time of disaster from friends and family; though if the disaster is covariate then this is only of value if the help is obtained from outside the community. As expected, the proportion of those receiving remittances from outside their village is correlated with the percentage of those with close family living outside their village. Looking at the opposite flow, upwards of 70% of the sample sends remittances outside the village on a regular basis (23% by means of mobile money).
11
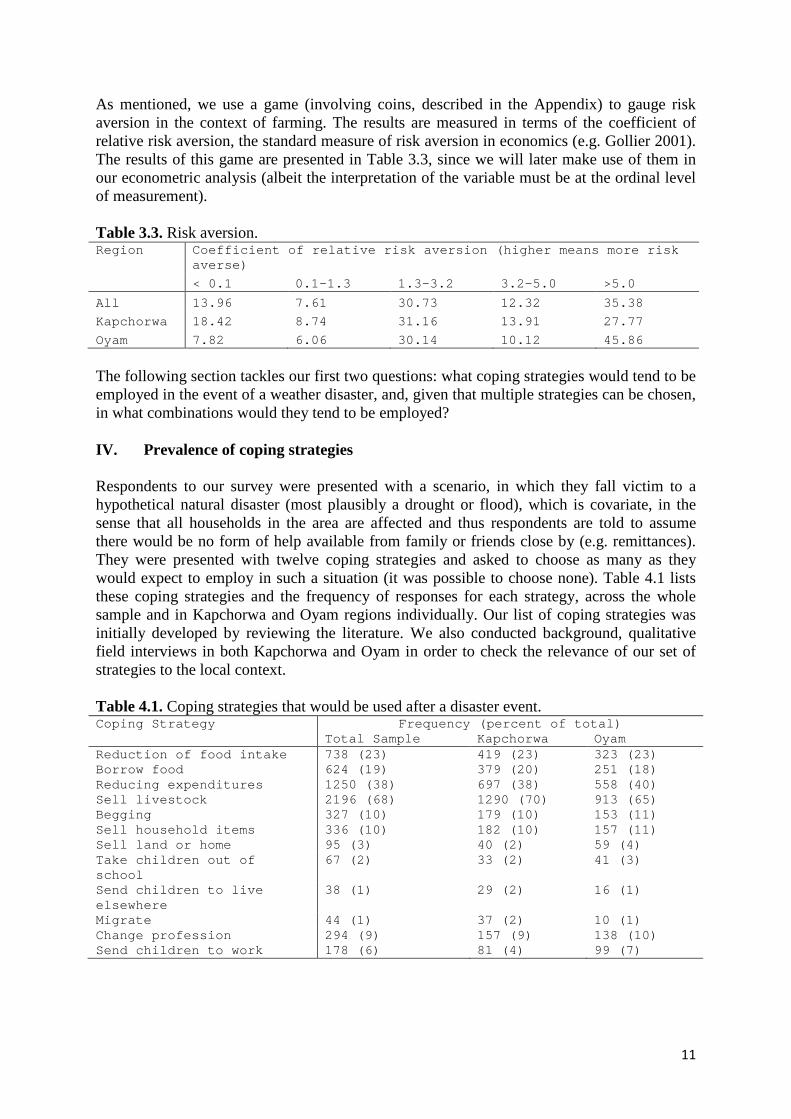
As mentioned, we use a game (involving coins, described in the Appendix) to gauge risk aversion in the context of farming. The results are measured in terms of the coefficient of relative risk aversion, the standard measure of risk aversion in economics (e.g. Gollier 2001). The results of this game are presented in Table 3.3, since we will later make use of them in our econometric analysis (albeit the interpretation of the variable must be at the ordinal level of measurement). Table 3.3. Risk aversion. Region Coefficient of relative risk aversion (highe r means more risk
averse)
< 0.1 0.1–1.3 1.3-3.2 3.2-5.0 >5.0
All 13.96 7.61 30.73 12.32 35.38
Kapchorwa 18.42 8.74 31.16 13.91 27.77
Oyam 7.82 6.06 30.14 10.12 45.86
The following section tackles our first two questions: what coping strategies would tend to be employed in the event of a weather disaster, and, given that multiple strategies can be chosen, in what combinations would they tend to be employed? IV. Prevalence of coping strategies Respondents to our survey were presented with a scenario, in which they fall victim to a hypothetical natural disaster (most plausibly a drought or flood), which is covariate, in the sense that all households in the area are affected and thus respondents are told to assume there would be no form of help available from family or friends close by (e.g. remittances). They were presented with twelve coping strategies and asked to choose as many as they would expect to employ in such a situation (it was possible to choose none). Table 4.1 lists these coping strategies and the frequency of responses for each strategy, across the whole sample and in Kapchorwa and Oyam regions individually. Our list of coping strategies was initially developed by reviewing the literature. We also conducted background, qualitative field interviews in both Kapchorwa and Oyam in order to check the relevance of our set of strategies to the local context. Table 4.1. Coping strategies that would be used after a disaster event. Coping Strategy Frequency (percent of total) Total Sample Kapchorwa Oyam Reduction of food intake 738 (23) 419 (23) 323 (23) Borrow food 624 (19) 379 (20) 251 (18) Reducing expenditures 1250 (38) 697 (38) 558 (40) Sell livestock 2196 (68) 1290 (70) 913 (65) Begging 327 (10) 179 (10) 153 (11) Sell household items 336 (10) 182 (10) 157 (11) Sell land or home 95 (3) 40 (2) 59 (4) Take children out of school
67 (2) 33 (2) 41 (3)
Send children to live elsewhere
38 (1) 29 (2) 16 (1)
Migrate 44 (1) 37 (2) 10 (1) Change profession 294 (9) 157 (9) 138 (10) Send children to work 178 (6) 81 (4) 99 (7)
12
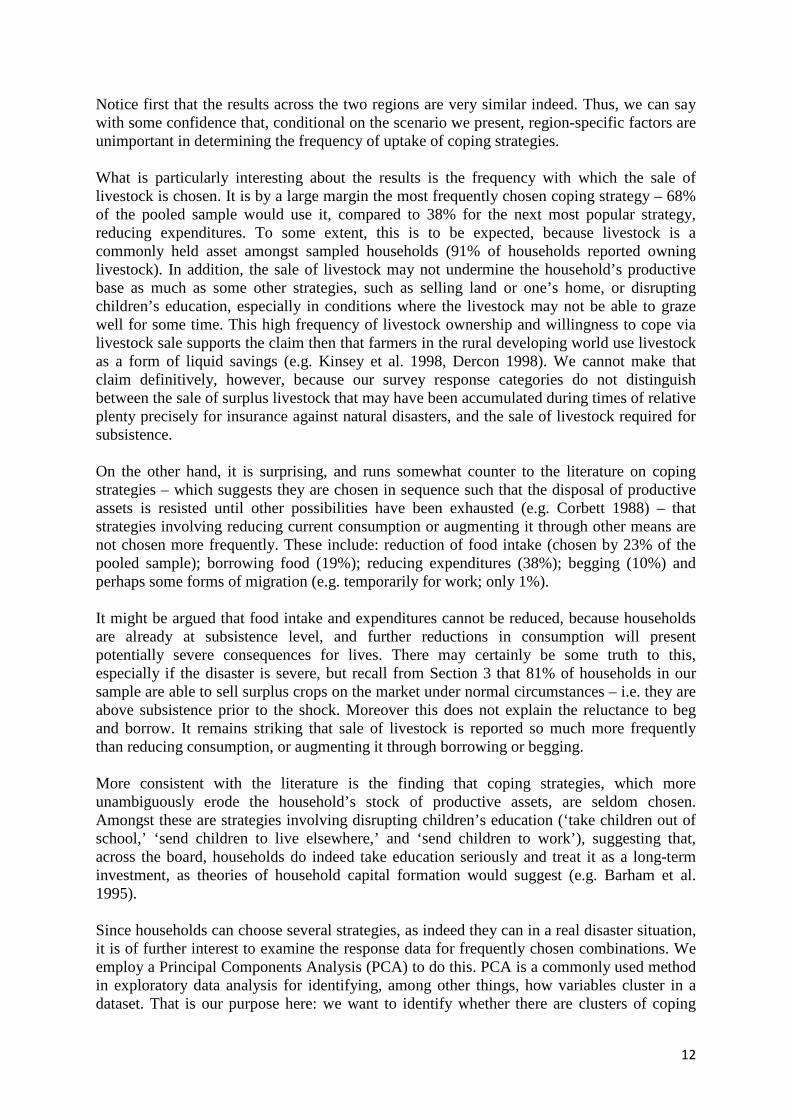
Notice first that the results across the two regions are very similar indeed. Thus, we can say with some confidence that, conditional on the scenario we present, region-specific factors are unimportant in determining the frequency of uptake of coping strategies. What is particularly interesting about the results is the frequency with which the sale of livestock is chosen. It is by a large margin the most frequently chosen coping strategy – 68% of the pooled sample would use it, compared to 38% for the next most popular strategy, reducing expenditures. To some extent, this is to be expected, because livestock is a commonly held asset amongst sampled households (91% of households reported owning livestock). In addition, the sale of livestock may not undermine the household’s productive base as much as some other strategies, such as selling land or one’s home, or disrupting children’s education, especially in conditions where the livestock may not be able to graze well for some time. This high frequency of livestock ownership and willingness to cope via livestock sale supports the claim then that farmers in the rural developing world use livestock as a form of liquid savings (e.g. Kinsey et al. 1998, Dercon 1998). We cannot make that claim definitively, however, because our survey response categories do not distinguish between the sale of surplus livestock that may have been accumulated during times of relative plenty precisely for insurance against natural disasters, and the sale of livestock required for subsistence. On the other hand, it is surprising, and runs somewhat counter to the literature on coping strategies – which suggests they are chosen in sequence such that the disposal of productive assets is resisted until other possibilities have been exhausted (e.g. Corbett 1988) – that strategies involving reducing current consumption or augmenting it through other means are not chosen more frequently. These include: reduction of food intake (chosen by 23% of the pooled sample); borrowing food (19%); reducing expenditures (38%); begging (10%) and perhaps some forms of migration (e.g. temporarily for work; only 1%). It might be argued that food intake and expenditures cannot be reduced, because households are already at subsistence level, and further reductions in consumption will present potentially severe consequences for lives. There may certainly be some truth to this, especially if the disaster is severe, but recall from Section 3 that 81% of households in our sample are able to sell surplus crops on the market under normal circumstances – i.e. they are above subsistence prior to the shock. Moreover this does not explain the reluctance to beg and borrow. It remains striking that sale of livestock is reported so much more frequently than reducing consumption, or augmenting it through borrowing or begging. More consistent with the literature is the finding that coping strategies, which more unambiguously erode the household’s stock of productive assets, are seldom chosen. Amongst these are strategies involving disrupting children’s education (‘take children out of school,’ ‘send children to live elsewhere,’ and ‘send children to work’), suggesting that, across the board, households do indeed take education seriously and treat it as a long-term investment, as theories of household capital formation would suggest (e.g. Barham et al. 1995). Since households can choose several strategies, as indeed they can in a real disaster situation, it is of further interest to examine the response data for frequently chosen combinations. We employ a Principal Components Analysis (PCA) to do this. PCA is a commonly used method in exploratory data analysis for identifying, among other things, how variables cluster in a dataset. That is our purpose here: we want to identify whether there are clusters of coping
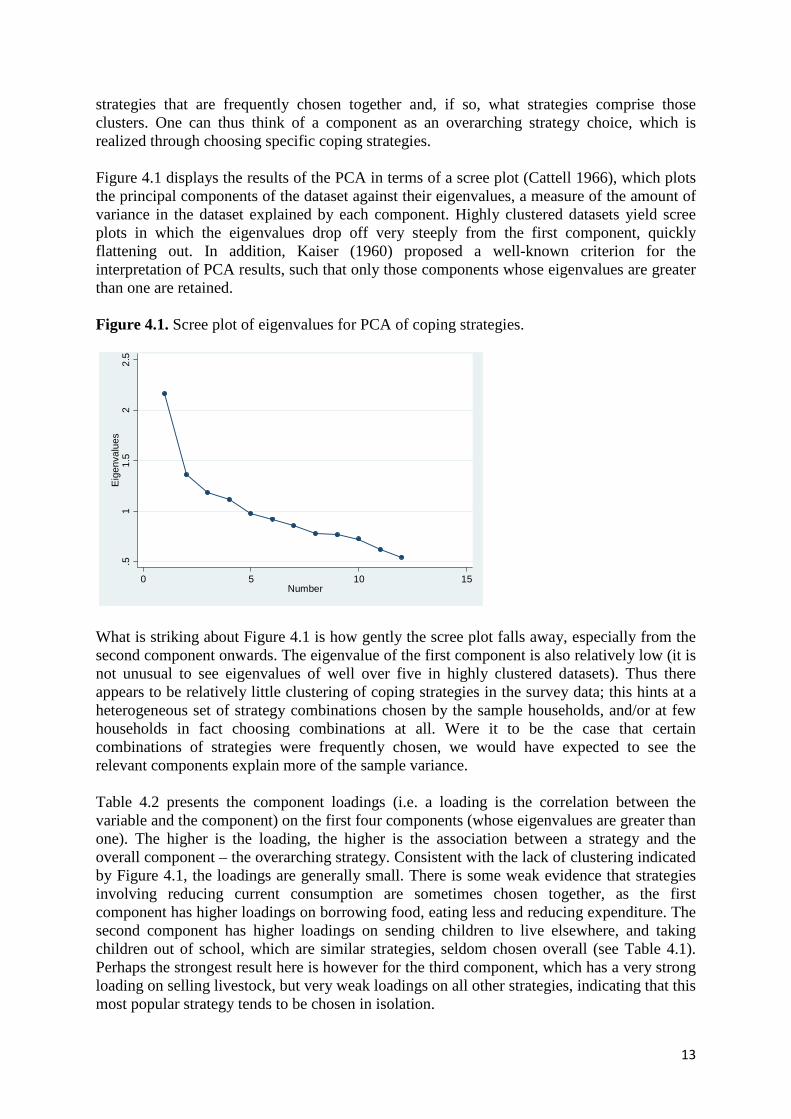
13
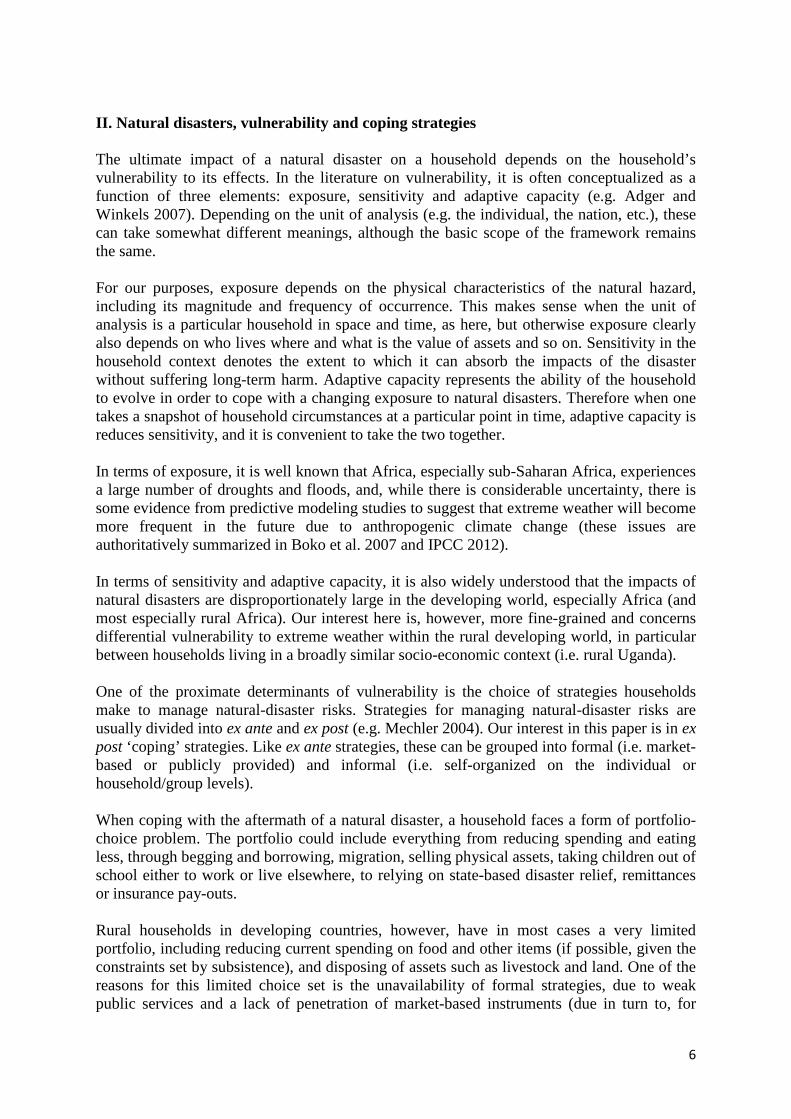
strategies that are frequently chosen together and, if so, what strategies comprise those clusters. One can thus think of a component as an overarching strategy choice, which is realized through choosing specific coping strategies. Figure 4.1 displays the results of the PCA in terms of a scree plot (Cattell 1966), which plots the principal components of the dataset against their eigenvalues, a measure of the amount of variance in the dataset explained by each component. Highly clustered datasets yield scree plots in which the eigenvalues drop off very steeply from the first component, quickly flattening out. In addition, Kaiser (1960) proposed a well-known criterion for the interpretation of PCA results, such that only those components whose eigenvalues are greater than one are retained. Figure 4.1. Scree plot of eigenvalues for PCA of coping strategies.
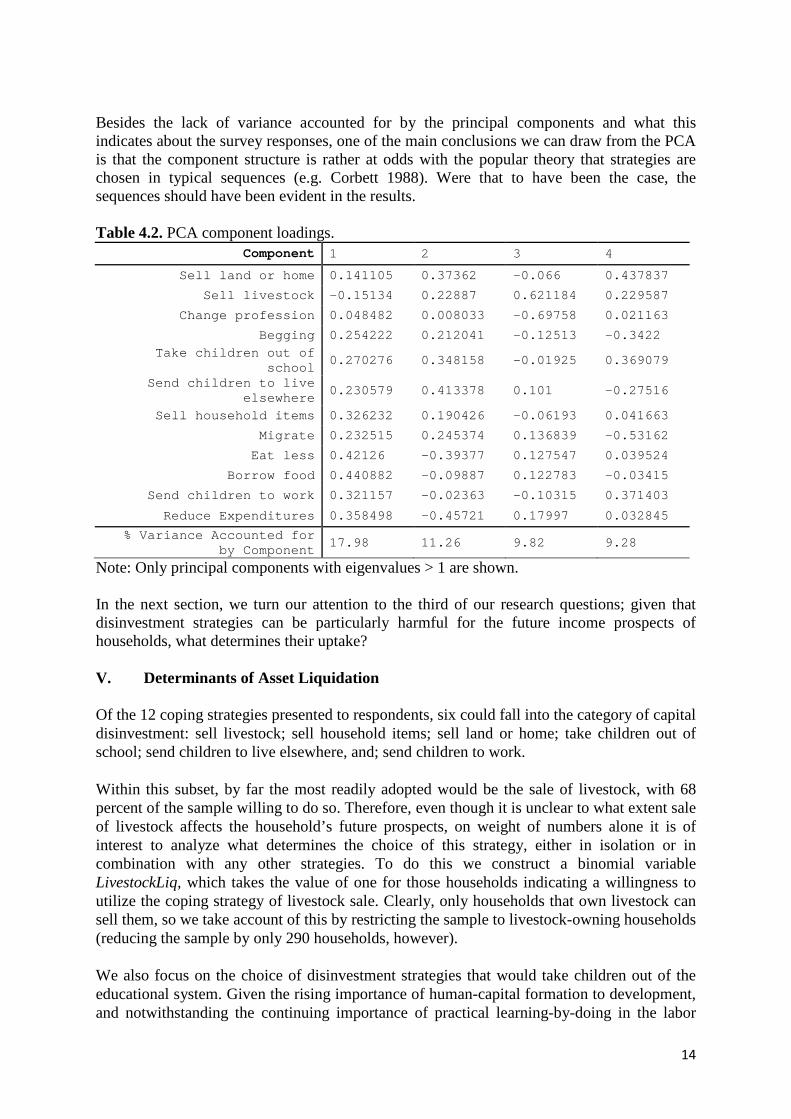
What is striking about Figure 4.1 is how gently the scree plot falls away, especially from the second component onwards. The eigenvalue of the first component is also relatively low (it is not unusual to see eigenvalues of well over five in highly clustered datasets). Thus there appears to be relatively little clustering of coping strategies in the survey data; this hints at a heterogeneous set of strategy combinations chosen by the sample households, and/or at few households in fact choosing combinations at all. Were it to be the case that certain combinations of strategies were frequently chosen, we would have expected to see the relevant components explain more of the sample variance. Table 4.2 presents the component loadings (i.e. a loading is the correlation between the variable and the component) on the first four components (whose eigenvalues are greater than one). The higher is the loading, the higher is the association between a strategy and the overall component – the overarching strategy. Consistent with the lack of clustering indicated by Figure 4.1, the loadings are generally small. There is some weak evidence that strategies involving reducing current consumption are sometimes chosen together, as the first component has higher loadings on borrowing food, eating less and reducing expenditure. The second component has higher loadings on sending children to live elsewhere, and taking children out of school, which are similar strategies, seldom chosen overall (see Table 4.1). Perhaps the strongest result here is however for the third component, which has a very strong loading on selling livestock, but very weak loadings on all other strategies, indicating that this most popular strategy tends to be chosen in isolation.
.51
1.5
22.
5E
igen
valu
es
0 5 10 15Number
Scree plot of eigenvalues after pca
14
Besides the lack of variance accounted for by the principal components and what this indicates about the survey responses, one of the main conclusions we can draw from the PCA is that the component structure is rather at odds with the popular theory that strategies are chosen in typical sequences (e.g. Corbett 1988). Were that to have been the case, the sequences should have been evident in the results. Table 4.2. PCA component loadings.
Component 1 2 3 4
Sell land or home 0.141105 0.37362 -0.066 0.437837
Sell livestock -0.15134 0.22887 0.621184 0.229587
Change profession 0.048482 0.008033 -0.69758 0.021163
Begging 0.254222 0.212041 -0.12513 -0.3422
Take children out of school
0.270276 0.348158 -0.01925 0.369079
Send children to live elsewhere
0.230579 0.413378 0.101 -0.27516
Sell household items 0.326232 0.190426 -0.06193 0.041663
Migrate 0.232515 0.245374 0.136839 -0.53162
Eat less 0.42126 -0.39377 0.127547 0.039524
Borrow food 0.440882 -0.09887 0.122783 -0.03415
Send children to work 0.321157 -0.02363 -0.10315 0.371403
Reduce Expenditures 0.358498 -0.45721 0.17997 0.032845
% Variance Accounted for by Component
17.98 11.26 9.82 9.28
Note: Only principal components with eigenvalues > 1 are shown. In the next section, we turn our attention to the third of our research questions; given that disinvestment strategies can be particularly harmful for the future income prospects of households, what determines their uptake? V. Determinants of Asset Liquidation Of the 12 coping strategies presented to respondents, six could fall into the category of capital disinvestment: sell livestock; sell household items; sell land or home; take children out of school; send children to live elsewhere, and; send children to work. Within this subset, by far the most readily adopted would be the sale of livestock, with 68 percent of the sample willing to do so. Therefore, even though it is unclear to what extent sale of livestock affects the household’s future prospects, on weight of numbers alone it is of interest to analyze what determines the choice of this strategy, either in isolation or in combination with any other strategies. To do this we construct a binomial variable LivestockLiq, which takes the value of one for those households indicating a willingness to utilize the coping strategy of livestock sale. Clearly, only households that own livestock can sell them, so we take account of this by restricting the sample to livestock-owning households (reducing the sample by only 290 households, however). We also focus on the choice of disinvestment strategies that would take children out of the educational system. Given the rising importance of human-capital formation to development, and notwithstanding the continuing importance of practical learning-by-doing in the labor
15
markets of less-developed economies, these strategies can be particularly important in affecting long-run vulnerability. We develop the binomial variable AssetLiqChild, which takes the value of one for those households indicating willingness to take children out of school, send children to live elsewhere, and/or send children to work. These two variables are used as dependent variables in a regression analysis of our survey data, in order to shed light on which socio-economic and attitudinal factors determine their uptake by households. Note that due to the rather weak clustering of strategies, we do not take forward the principal components from Section IV into this analysis. Turning to the explanatory variables we use, research on household vulnerability to natural hazards has previously emphasized the importance of capital assets (e.g. Wisner et al. 2004, Carter and Barrett 2006), so we include measures of (i) the household’s built and financial capital and (ii) its human capital. As neither of these forms of capital is directly observed, we use proxies for them based on relevant literature and what our survey makes available. For built/ financial capital, we use the acreage of land owned by a household as our proxy measure (Acres). Previous literature has suggested that there is a strong relationship between access to land and household income, certainly in Eastern and Southern Africa (Jayne et al. 2003). Human capital is straightforwardly captured via the ordinal-level variable Education, which summarizes the respondent’s years of schooling. The data for this variable are taken from Table 3.2, which shows that the majority of respondents (64%) leave formal education at the end of elementary/primary school, at the latest, while a further 26% of respondents leave school at ‘Ordinary level’ (i.e. O-level), and only 9% of respondents remain in school thereafter to complete Advanced-level secondary education. Natural capital stocks are also stressed in the literature, but we exclude them in this study, as it is assumed that environmental conditions are the same in a given period for all households sampled (we can control for unobserved region- and district-specific natural capital via our dummies; see below). So is social capital, but social capital is notoriously hard to measure, and in our scenario it is social capital that exists beyond the local level that is of interest, since the natural disaster scenario is covariate. We include one explanatory variable that partially captures social capital beyond the local level (explained below). We include several other explanatory variables relating to the household’s wealth and income. None of these is highly correlated with the others, and each promises to control for a rather different effect, so we include them in our models. First, we include the share of household income from farming (called IShare). This is an ordinal-level variable ranging from 0 (0-25 percent) to 3 (75-100 percent), mapping on to intervals that respondents could choose in the survey. Two households with the same income (and perhaps also wealth) but differing degrees of dependence on farming for income might be expected to rely to a different extent on livestock sale in the event of a drought or flood, for example; more diversified households may be less reliant on selling livestock, as they have other coping strategies within their feasible set. Second, we include a dummy variable indicating whether a household is engaged in subsistence farming or whether it is able to sell surplus crops to the market (Surplus). This may for example affect whether a household has a reduction in food intake or expenditure within its feasible set. It may also affect the relative impact on a household of a disaster that
16
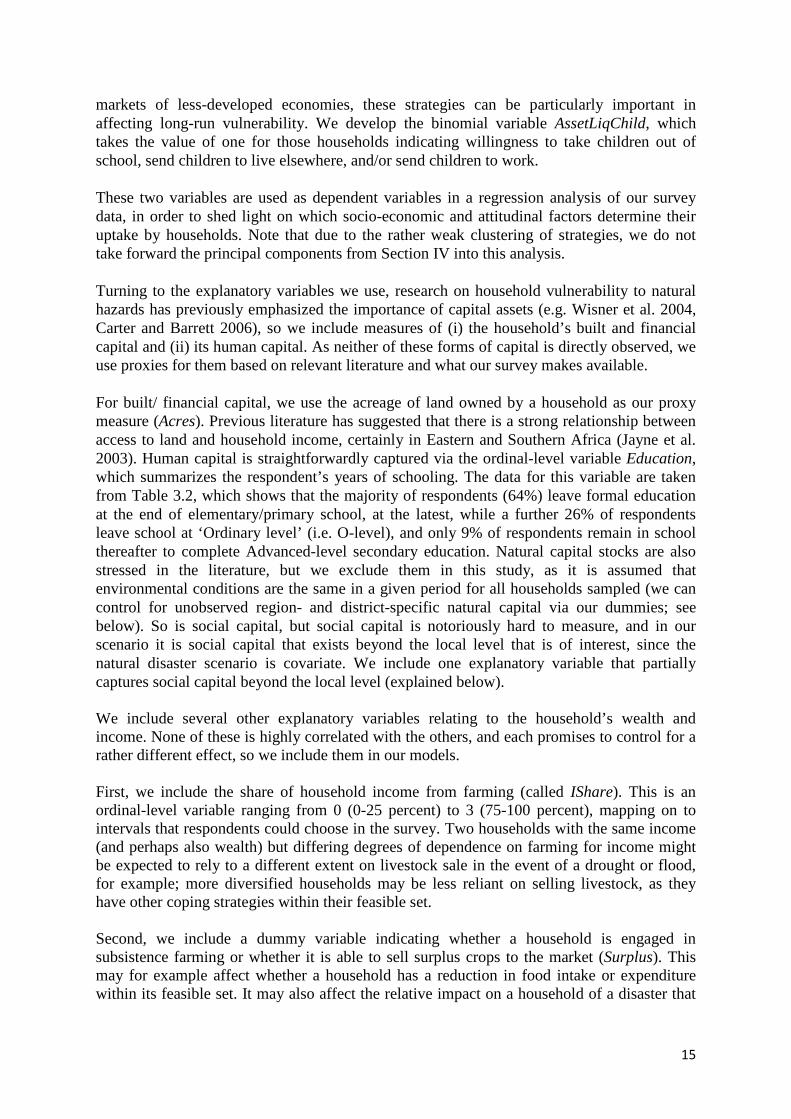
affects crop yields. Note for interpretation of the results below that the coding of this dummy variable is zero for a surplus and one for no surplus. Third, we specify the dummy variable FamRem, which indicates whether the household is a net recipient of remittances from outside of its village, or a net provider beyond the village. This is first and foremost an indicator of the household’s financial position (we assume net providers are in a stronger position, all else being equal), but since remittances also depend on social capital, it can be seen to partially capture super-local social capital stocks as well. About 47 percent of households receive more in remittances from outside the village than they provide, whilst 34 percent are net providers. The remainder neither sends nor receives remittances. That there could be connections between the choice of coping strategy and attitudes to risk, especially those held by the head of the household, is intuitive. In order to gauge the effect of risk perceptions, we include the outcome of our coin game for each respondent (CoinRisk). As discussed in Section 3 of this paper and in the Appendix, the coin game provides us with a measure of household risk aversion, specifically as it applies to agricultural planning. In this model we use an ordinal variable to indicate if a respondent is relatively more risk averse. The higher the variable value for a given household, the more risk averse it is. We also control for the age of the household head via the variable Age, and we control for the size of the household (FamSize). A particular concern in any regression model is bias resulting from unobserved variation. This is more difficult to counter in cross-sections than in panel datasets, but we include two variables to deal with it. Possible regional differences are incorporated in the model by specifying a region-level dummy variable (Region) that takes on different values depending on whether the respondent is located in Oyam or Kapchorwa. More importantly, we exploit detailed local data on where the responses were garnered to specify 34 dummy variables at the sub-county level. The estimation technique is probit. Table 5.1 summarizes the regressors. Table 5.1. Explanatory variables of differential vulnerability. Variable Name Scale of
measurement Region Region Categorical Educational status Education Ordinal Acres owned Acres Ordinal Age Age Continuous Family size FamSize Continuous Income share from activities outside farming
IShare Ordinal
Surplus crop sold on the market Surplus Categorical Risk aversion CoinRisk Ordinal Remittances FamRem Categorical
Table 5.2 (column (i)) presents the estimated probit model for willingness to sell livestock. It shows good explanatory power overall. A number of key explanatory variables are individually significant in the model. Of these, IShare and Surplus are significant at better than the 1% level, the former positive, the latter negative. In particular, households with a higher share of income from farming are more likely to sell livestock after a natural disaster, as do those households that grow surplus crops to sell on the market. In both cases, the most

17
likely explanation is that the variable reflects vulnerability to natural disasters and that greater vulnerability leads to a greater reliance on the sale of livestock to cope. IShare is indicative of the diversification of household employment, which has been shown to be associated with lower levels of vulnerability (Wisner et al. 1994). Furthermore, diversification has been argued to act as a ‘safety valve’ for the rural poor by providing a broader set of feasible coping strategies from which to choose (Ellis 2007). Households that have surplus output to sell on the market (Surplus) lose not only their own source of food when a natural disaster wipes out crops, they also lose potential income from market sales, burdening them with a greater need to cope overall. It might be objected that households selling surplus crops on the market are better off and therefore less vulnerable to natural disasters (because their farms are more productive), but recall that we control in various ways for household income and wealth. FamSize and CoinRisk have significant positive effects on willingness to sell livestock, albeit only at the 5% level. The greater the family size, the more likely it is that the household sells livestock to cope, which could again reflect a positive association between family size and vulnerability; the larger the family the more mouths to feed. Together with the significant coefficients on IShare and Surplus, the picture is thus building that the sale of livestock is a strategy commonly turned to by households more vulnerable overall to natural disasters. This picture is in turn consistent with the notion that livestock are held as a liquid asset to form a first line of defense in coping with such shocks, although it is also consistent with the notion that more vulnerable households cannot cope by reducing consumption alone, or by using other strategies that avoid disinvestment (i.e. livestock are only sold once the returns to other strategies have been exhausted). Yet we know from Section 3 that such strategies are used less frequently, and we did not find evidence that they were employed in combination with selling livestock. The positive coefficient on CoinRisk indicates that, the more risk averse is the head of the household, the less likely it is that livestock are sold as a means to cope. This could reflect a number of considerations, as the dynamic relationship between coping strategies and income risk for particular households is extremely difficult to know. It could also reflect a correlation between CoinRisk and income/vulnerability, as it widely thought that relative risk aversion decreases with household income (see Rosenzweig and Binswanger 1993 for classic evidence on farmers’ risk aversion). Age is significant at the 10% level and positive, indicating that households in which the household head is relatively older are more likely to sell livestock as a means of coping. It is probable that Age encompasses an underlying effect not accounted for directly in our model. By way of one possible explanation, in many rural societies age correlates with changes in the role played within the wider community (Lipton and Maxwell 1992). The older is the household head, the higher the reputational cost to borrowing or begging, for example. With increasing age may also come reduced mobility, ruling out coping strategies involving migration, for instance. Neither our financial-capital nor human-capital proxies are significant in this model. Table 5.2. Probit models of the determinants of strategies to (i) sell livestock and (ii) taking children out of education. Variable (i) LivestockLiq (ii) AssetLiqChild Region -6.52 -3.14 Education 0.03 -0.16 *** Acres -0.001 -0.000

18
Age 0.004 * 0.006 * FamSize 0.025 ** 0.042 *** IShare 0.098 *** -0.009 Surplus -0.314 *** 0.016 CoinRisk -0.161 ** 0.170 FamRem 0.050 -0.005 Number of Ob 2788 2935 Log likelihood -1471.59 -726.440 Pseudo R² 0.134 0.166
We now discuss the probit model with the dependent variable AssetLiqChild (see Table 5.2, column (ii)). As mentioned previously, this type of coping strategy unambiguously reduces the household’s investment in capital (human capital) that would likely reap returns in the future. The estimated model shows good explanatory power overall. Education is significant at the 1% level and negative, indicating that, the higher the educational attainment of the household head, the less likely they are to risk compromising their children’s educational attainment. It may well be that those with higher educational attainment place more value on investment in human capital per se, as within our sample there is no significant correlation between education and built/financial capital wealth. By contrast, FamSize is significant at the 1% level and positive, indicating a higher propensity to disrupt the children’s education after a natural disaster when the family size is greater. This is intuitive, since households that have more people to care for are more likely to take up coping strategies that may endanger future prospects, but stabilize household prospects in the immediate term. With increasing family size – in particular increasing numbers of children – we can also hypothesize an effect at the margin, whereby the cost to future prospects of having one less child in formal education is lower. There is a weak (i.e. significant at the 10% level) positive association between Age and AssetLiqChild, which may again reflect factors linked with age and discussed above. VI. Discussion Our survey results suggest that the sale of livestock is by far the most frequently chosen coping strategy after a weather disaster. This runs counter to some previous studies indicating that the sale of livestock plays a minor role in coping with extreme weather (e.g. Fafchamps and Gavian 1996, Kazianga and Udry 2006), and to the thrust of the literature on choosing coping strategies in sequence (Corbett 1988), such that a reduction in current consumption is always attempted prior to liquidating any assets. After all, we find that strategies involving reducing current consumption or augmenting it by borrowing/begging would be used fairly seldom. Conversely our results support the argument that livestock are held as a form of liquid savings, one possible use of which is to recover from a shock (e.g. Dercon 1998). Our findings reveal a fairly rich set of determinants of different subsets of coping strategies; we chose to focus on drivers of the choice to cope via the sale of livestock (given its prevalence) and the reduction of children’s education (given its potential importance). Our findings point up the impact of initial vulnerability on the propensity to disinvest, where initial vulnerability is represented by a lack of income diversification, a large family size and, in the case of selling livestock, whether surplus crops are sold on the market (and hence how much of a shock the weather event is to household income). But our findings also point up attitudinal and social factors (thus consistent with e.g. Anderson and Woodrow 1998 and
19
Eade 1998), notably the effect of educational attainment on educational aspirations for children, attitude to risk and – albeit weakly – age. There are some limitations to our study, chiefly that our survey question, being hypothetical in nature, could yield answers affected by various forms of bias. Yet the fact that the survey was administered by local CKWs, who have a pre-existing relationship with the respondents built on trust, helps to combat this issue. Also, in the areas researched, large covariate weather shocks (i.e. involving loss of at least half a crop) occur at least once every four years, so respondents are familiar with the issues in question. Furthermore, in neither region is there formalized agricultural insurance, which also serves to make the scenario realistic. Though our regression models have good explanatory power, the issue of endogeneity, principally through omitted variables, is one which we need to be aware of. We account for this as best as we can by (i) specifying a rich set of regressors (none of which is highly correlated with other regressors) and (ii) including dummy variables at the sub-county and regional levels to account for unobserved variation. References Adger, W.N. and A. Winkels. 2007. Vulnerability, poverty and sustainable well-being. In G. Atkinson, S. Dietz and E. Neumayer (eds.), Handbook of Sustainable Development. Gloucester, Edward Elgar. Anderson, M. B. and P.J. Woodrow. 1998. Rising from the Ashes: Development Strategies in Times of Disaster. Boulder, CO: Lynne Rienner Publishers. Banerjee, A.B. 2000. The two poverties. Nordic Journal of Political Economy, 26: 129-141. Banerjee A.B. 2004. Educational policy and economics of the family. Journal of Development Economics, 74: 3-32. Barham, V., R. Boadway, M. Marchand, and P. Pestineau. 1995. Education and the poverty trap. European Economic Review, 39: 1257-1275. Barrett, C.B., M.R. Carter and P.D. Little (eds.). 2006. Understanding and reducing persistent poverty in Africa, special issue of Journal of Development Studies, 42(2). Blumenstock, J., N. Eagle, and M. Fafchamps. 2011. Risk and reciprocity over the mobile phone network: evidence from Rwanda. CSAE Working Paper WPS/2011-19. Boko, M., I. Niang, A. Nyong, C. Vogel, A. Githeko, M. Medany, B. Osman-Elasha, R. Tabo and P. Yanda. 2007. Africa. In M.L. Parry, O.F. Canziani, J.P. Palutikof, P.J. van der Linden and C.E. Hanson (eds.), Climate Change 2007: Impacts, Adaptation and Vulnerability. Contribution of Working Group II to the Fourth Assessment Report of the Intergovernmental Panel on Climate Change. Cambridge, Cambridge University Press, 433-467. Carter, M R. and C. B. Barrett. 2006. The economics of poverty traps and persistent poverty: an asset-based approach. Journal of Development Studies, 42: 178-199.
20
Carter, M. R, P. D. Little, T. Mogues and W. Negatu. 2007. Poverty traps and natural disasters in Ethiopia and Honduras. World Development, 35: 835-856. Cattell, R.B. 1966. The meaning and strategic use of factor analysis. In R.B. Cattell (ed.) Handbook of Multivariate Experimental Psychology. Chicago, Rand McNally, 174-243. Corbett, J.1988. Famine and household coping strategies. World Development. 16(9): 1099-1112. Dercon, S. 1998. Wealth, risk and activity choice: cattle in western Tanzania. Journal of Development Economics, 55(1): 1-42. Dercon, S. 2002. Income risk, coping strategies and safety nets. World Bank Research Observer, 17(2): 141-166.
Duryea, S. 1998. Children’s advancement through school in Brazil: the role of transitory shocks to household income. Working Paper 376. Washington, D.C., Office of the Chief Economist of the Inter-American Development Bank. Eade, D. 1998. Capacity Building: An Approach to People-Centered Development. Oxford, Oxfam. Ellis, F. and N. Mdoe. 2003. Rural livelihoods and poverty reduction in Tanzania. World Development, 31(8): 1367-1384. Fafchamps, M. and S. Gavian. 1996. The spatial integration of livestock markets in Niger Journal of African Economies, 5(3):366-405. Jack, W. and T. Suri. 2011. Mobile money: the economics of m-pesa. NBER Working Paper 16721.Cambridge, Mass, NBER. Flug, K., A. Spilimbergo, and E. Wachtenheim. 1998. Investment in education: do economic volatility and credit constraints matter? Journal of Development Economics, 55: 465–481. Galor, O. 2011. Unified Growth Theory. Cambridge, Mass, MIT Press. Gollier, C. 2001. The Economics of Risk and Time. Cambridge, Mass, MIT Press. IPCC. 2007. Summary for Policymakers. In S. Solomon, D. Qin, M. Manning et al. (eds.), Climate Change 2007: The Physical Science Basis. Contribution of Working Group I to the Fourth Assessment Report of the Intergovernmental Panel on Climate Change. Cambridge, Cambridge University Press. IPCC. 2012. Summary for Policymakers. In C.B. Field, V. Barros, T.F. Stocker, D. Qin, D.J. Dokken, K.L. Ebi, M.D. Mastrandrea, K.J. Mach, G.-K. Plattner, S.K. Allen, M. Tignor and P.M. Midgley (eds.), Managing the Risks of Extreme Events and Disasters to Advance Climate Change Adaptation. A Special Report of Working Groups I and II of the Intergovernmental Panel on Climate Change. Cambridge, Cambridge University Press, pp. 1-19.
21
Jacoby, H. and E. Skoufias. 1997. Risk, financial markets, and human capital in a developing country. Review of Economic Studies, 64(3): 311–335. Jayne T.S., T. Yamano, M. Weber, D. Tschirley, R. Benfica, A. Chapoto, and B. Zulu. 2003. Smallholder income and land distribution in Africa: implications for poverty reduction strategies. Food Policy, 28 (3): 253–275. Kaiser, H.F. 1960. The application of electronic computers to factor analysis. Educational and Psychological Measurement 20: 141-151. Kazianga, H. and C. Udry. 2006. Consumption smoothing? Livestock, insurance and drought in rural Burkina Faso. Journal of Development Economics, 79: 413-446. Kinsey, B., K. Burger, and J. Gunning. 1998. Coping with drought in Zimbabwe: Survey evidence on responses of rural households to risk. World Development 26(1): 89-110. Lipton, M. and S. Maxwell. 1992. The new poverty agenda: an overview. Discussion Paper No. 306. Brighton, Institute of Development Studies, University of Sussex. Lucas, R.E.B. and O. Stark. 1985. Motivations to remit: evidence from Botswana. Journal of Political Economy, 93(5): 901–18. Mechler, R. 2004. Natural Disaster Risk Management and Financing Disaster Losses in Developing Countries. Karlsruhe, Verlag fuer Versicherungswissenschaft,. Muth, K.T., and J.F. Helgeson. 2011. Stochastic environments as measurement tools: a new approach. The Journal of Applied Economy, 5. Pearce, D.W., G. Atkinson, and S. Mourato 2006. Cost-Benefit Analysis and the Environment Paris, France, OECD. Ravallion, M and S. Chen. 1997. What can new survey data tell us about recent changes in distribution and poverty? World Bank Economic Review, 11(2): 357-82. Reardon, T and S.A. Vosti. 1995. Links between rural poverty and the environment in developing countries: asset categories and investment poverty. World Development, 23(9): 1495-1506. Rosenzweig, M. and H. Binswanger. 1993. Weather, risk, and the composition and profitability of agricultural investments. Economic Journal, 103: 56-78. Rosenzweig, M. and O. Stark. 1989. Consumption smoothing, migration, and marriage: rvidence from rural India. Journal of Political Economy, 97(4): 905-926. Skoufias, E. and S.W. Parker. 2002. Labor market shocks and their impacts on work and schooling: evidence from urban Mexico. IFPRI-FCND Discussion Paper 129. Stern, N. 2007. The Economics of Climate Change: the Stern Review. Cambridge, Cambridge University Press.
22
Wisner, B., P. Blaikie, T. Cannon, and I. Davis. 2004. At Risk: Natural Hazards, People's Vulnerability and Disasters, Routledge. Yang, D. and H.J. Choi. 2007. Are remittances insurance? Evidence from rainfall shocks in the Philippines. World Bank Economic Review 21(2): 219-248.
23
Appendix. The coin game
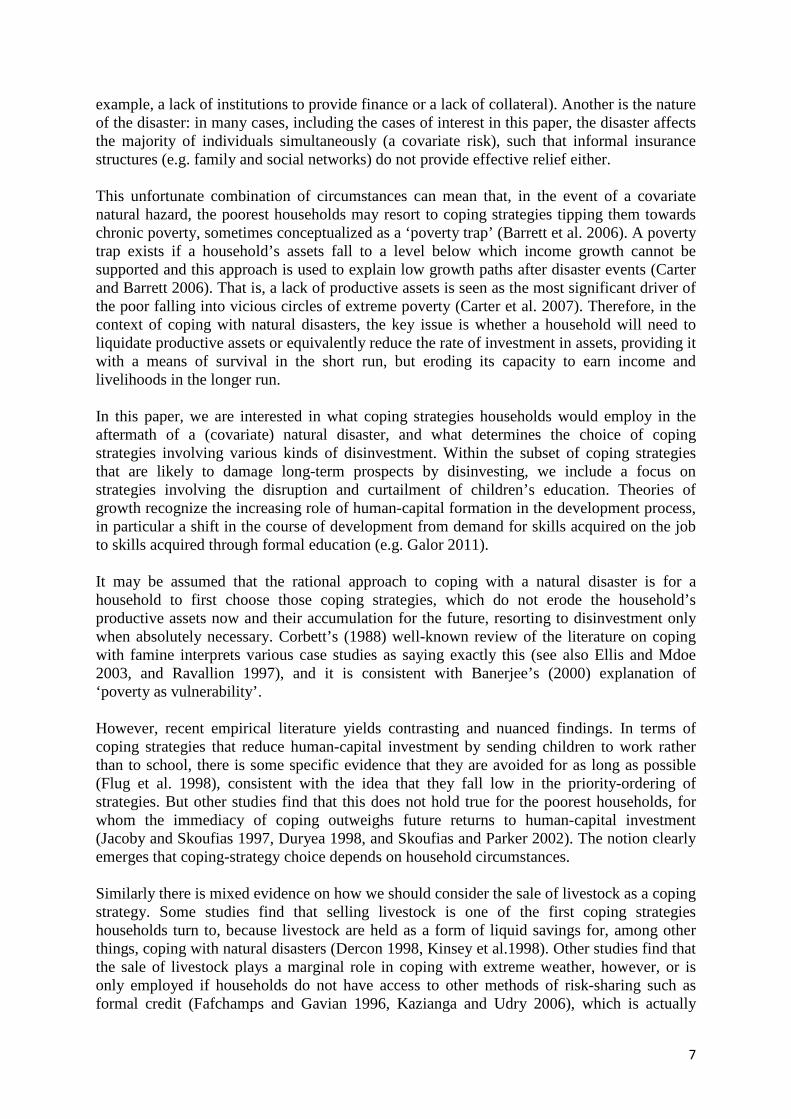
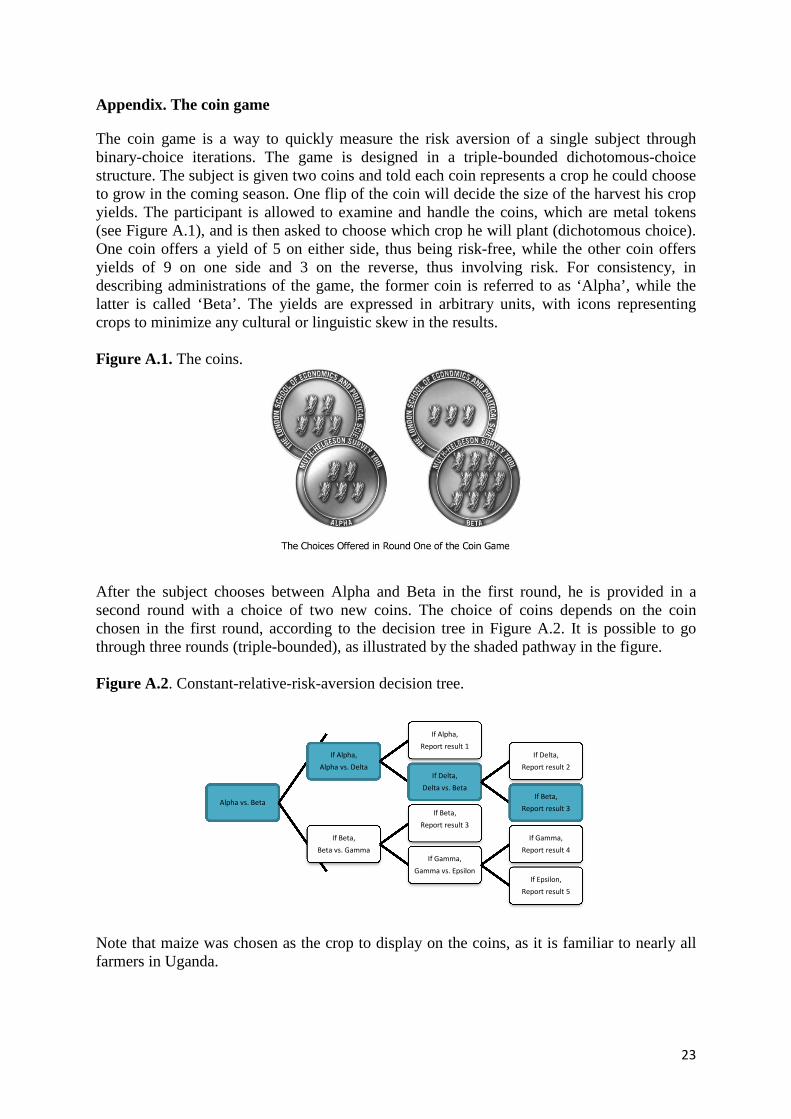
The coin game is a way to quickly measure the risk aversion of a single subject through binary-choice iterations. The game is designed in a triple-bounded dichotomous-choice structure. The subject is given two coins and told each coin represents a crop he could choose to grow in the coming season. One flip of the coin will decide the size of the harvest his crop yields. The participant is allowed to examine and handle the coins, which are metal tokens (see Figure A.1), and is then asked to choose which crop he will plant (dichotomous choice). One coin offers a yield of 5 on either side, thus being risk-free, while the other coin offers yields of 9 on one side and 3 on the reverse, thus involving risk. For consistency, in describing administrations of the game, the former coin is referred to as ‘Alpha’, while the latter is called ‘Beta’. The yields are expressed in arbitrary units, with icons representing crops to minimize any cultural or linguistic skew in the results. Figure A.1. The coins.
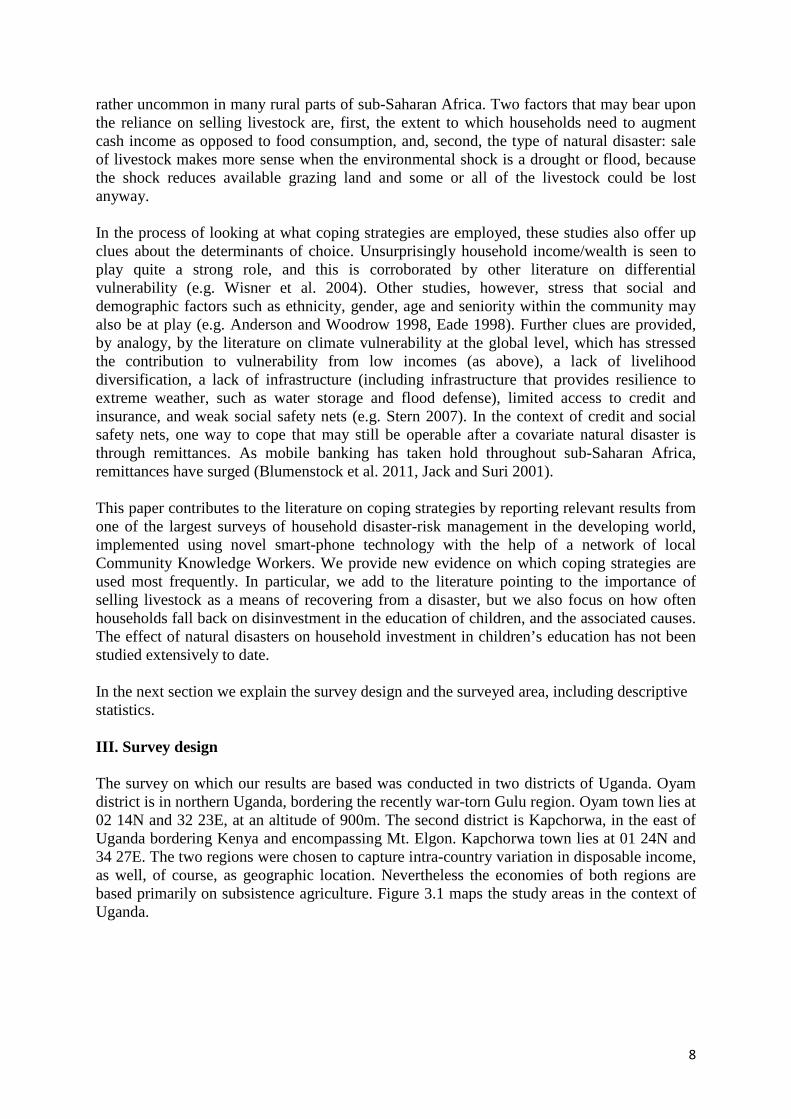
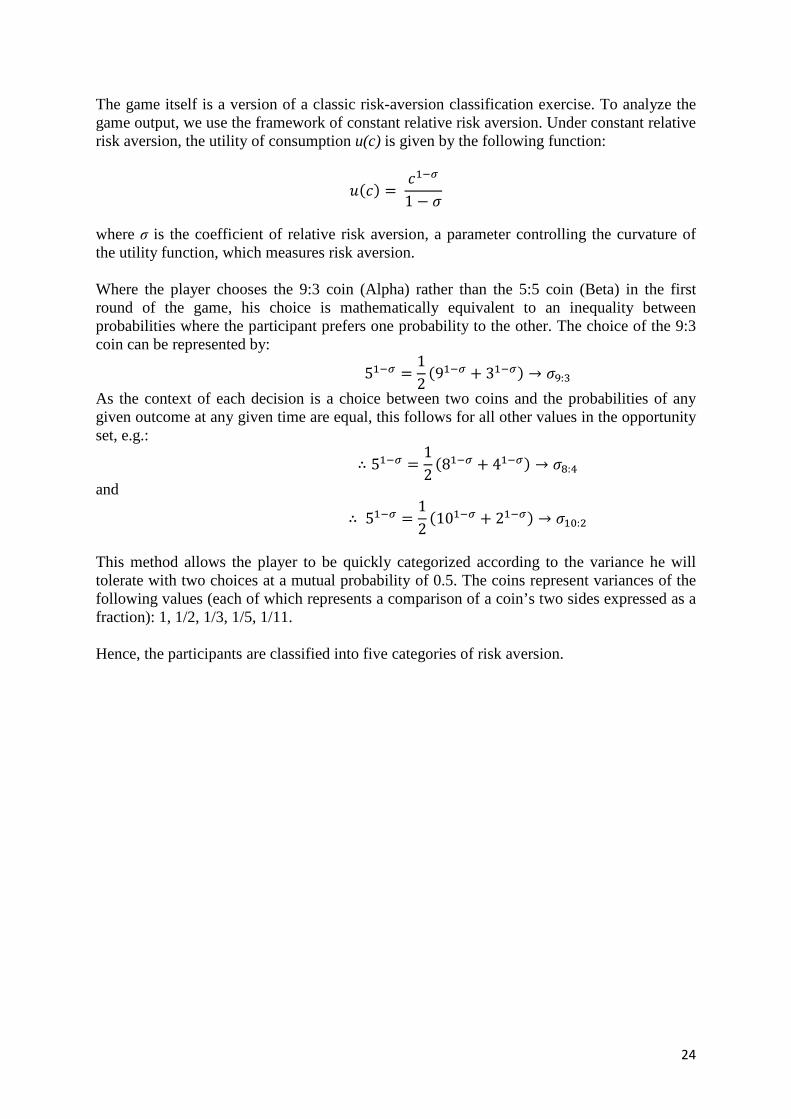
After the subject chooses between Alpha and Beta in the first round, he is provided in a second round with a choice of two new coins. The choice of coins depends on the coin chosen in the first round, according to the decision tree in Figure A.2. It is possible to go through three rounds (triple-bounded), as illustrated by the shaded pathway in the figure. Figure A.2. Constant-relative-risk-aversion decision tree.
Note that maize was chosen as the crop to display on the coins, as it is familiar to nearly all farmers in Uganda.
Alpha vs. Beta
If Alpha,
Alpha vs. Delta
If Alpha,
Report result 1
If Delta,
Delta vs. Beta
If Delta,
Report result 2
If Beta,
Report result 3
If Beta,
Beta vs. Gamma
If Beta,
Report result 3
If Gamma,
Gamma vs. Epsilon
If Gamma,
Report result 4
If Epsilon,
Report result 5
24
The game itself is a version of a classic risk-aversion classification exercise. To analyze the game output, we use the framework of constant relative risk aversion. Under constant relative risk aversion, the utility of consumption u(c) is given by the following function:
���� = ���
1 − �
where σ is the coefficient of relative risk aversion, a parameter controlling the curvature of the utility function, which measures risk aversion. Where the player chooses the 9:3 coin (Alpha) rather than the 5:5 coin (Beta) in the first round of the game, his choice is mathematically equivalent to an inequality between probabilities where the participant prefers one probability to the other. The choice of the 9:3 coin can be represented by:
5�� =1
2�9�� + 3��� → ��:�
As the context of each decision is a choice between two coins and the probabilities of any given outcome at any given time are equal, this follows for all other values in the opportunity set, e.g.:
∴ 5�� =1
2�8�� + 4��� → ��:�
and
∴ 5�� =1
2�10�� + 2��� → ���:�
This method allows the player to be quickly categorized according to the variance he will tolerate with two choices at a mutual probability of 0.5. The coins represent variances of the following values (each of which represents a comparison of a coin’s two sides expressed as a fraction): 1, 1/2, 1/3, 1/5, 1/11. Hence, the participants are classified into five categories of risk aversion.