capacity and the breakdown phenomenon at a freeway merge bottleneck: unlocking the potential of loop...
TRANSCRIPT

Capacity and the Breakdown Phenomenon Capacity and the Breakdown Phenomenon at a Freeway Merge Bottleneck: Unlocking at a Freeway Merge Bottleneck: Unlocking
the Potential of Loop Sensor Datathe Potential of Loop Sensor Data
Capacity and the Breakdown Phenomenon Capacity and the Breakdown Phenomenon at a Freeway Merge Bottleneck: Unlocking at a Freeway Merge Bottleneck: Unlocking
the Potential of Loop Sensor Datathe Potential of Loop Sensor Data
Robert L. BertiniRobert L. Bertini
Department of Civil & Environmental EngineeringDepartment of Civil & Environmental Engineering
Portland State UniversityPortland State University
February 22, 2002February 22, 2002
Robert L. BertiniRobert L. Bertini
Department of Civil & Environmental EngineeringDepartment of Civil & Environmental Engineering
Portland State UniversityPortland State University
February 22, 2002February 22, 2002

2
“Let Knowledge Serve the City”
OutlineOutlineOutlineOutline
• IntroductionIntroduction• Previous StudiesPrevious Studies• MethodMethod• DataData• ResultsResults• SummarySummary• ImplicationsImplications• Ongoing and Future ResearchOngoing and Future Research
• IntroductionIntroduction• Previous StudiesPrevious Studies• MethodMethod• DataData• ResultsResults• SummarySummary• ImplicationsImplications• Ongoing and Future ResearchOngoing and Future Research

3
“Let Knowledge Serve the City”
IntroductionIntroductionIntroductionIntroduction
• Research QuestionResearch Question– Empirically examine evolution of traffic from free flow to queued
conditions at a freeway bottleneck downstream of a merge.
• Exciting OpportunityExciting Opportunity– Bottlenecks are critical nodes in system.Bottlenecks are critical nodes in system.– First sixty years:First sixty years:
» Promising theories (e.g., Lighthill-Whitham-Richards, Edie, Promising theories (e.g., Lighthill-Whitham-Richards, Edie, Newell) needed validation.Newell) needed validation.
» Difficult to collect data.Difficult to collect data.» Fundamental uncertainties.Fundamental uncertainties.
– Today:Today:» Sensor-rich, “too much” dataSensor-rich, “too much” data» Understand traffic behaviorUnderstand traffic behavior» Building blocks for proposing/validating modelsBuilding blocks for proposing/validating models

4
“Let Knowledge Serve the City”
Research ImplicationsResearch ImplicationsResearch ImplicationsResearch Implications
• Understand traffic behavior at a merge.Understand traffic behavior at a merge.• Demonstrate benefits of traffic management sensor investment for Demonstrate benefits of traffic management sensor investment for
research.research.• Reveal benefits of archived raw data.Reveal benefits of archived raw data.• Method for unequivocally pinpointing active bottleneck.Method for unequivocally pinpointing active bottleneck.• Resolve two-capacity issue.Resolve two-capacity issue.• Potential for future research:Potential for future research:
– Improve macroscopic models.Improve macroscopic models.– Assess ramp metering.Assess ramp metering.– Enhance freeway management.Enhance freeway management.– Update design standards.Update design standards.

5
“Let Knowledge Serve the City”
Active BottleneckActive BottleneckActive BottleneckActive Bottleneck
• Discharging from upstream queue (maximum).Discharging from upstream queue (maximum).• Not impeded by downstream effects.Not impeded by downstream effects.
• Discharging from upstream queue (maximum).Discharging from upstream queue (maximum).• Not impeded by downstream effects.Not impeded by downstream effects.

6
“Let Knowledge Serve the City”
Previous StudiesPrevious StudiesPrevious StudiesPrevious Studies
• Data from fixed pointsData from fixed points– Bivariate plotsBivariate plots– Scatter plotsScatter plots
• Time dependencies & statistical Time dependencies & statistical fluctuationsfluctuations
– Short time intervalsShort time intervals– Long time intervalsLong time intervals
• Data from fixed pointsData from fixed points– Bivariate plotsBivariate plots– Scatter plotsScatter plots
• Time dependencies & statistical Time dependencies & statistical fluctuationsfluctuations
– Short time intervalsShort time intervals– Long time intervalsLong time intervals
40 0 0
50 0 0
60 0 0
70 0 0
80 0 0
90 0 0
15 :3 0:03 15 :40 :0 3 15 :5 0:0 3 1 6:00 :0 3T im e
(ve
hic
les
per
hou
r)
F lo w ove r 20 -secon d in te rva l5 -m in ute ave ra ge1 5-m inu te a verag e
Flo
ws
over
spe
cifie
d in
terv
als
Occupancy
Flo
w

7
“Let Knowledge Serve the City”
MethodMethodMethodMethod
Flow
Time, t @ x
N(x,t)
N(x,t)

8
“Let Knowledge Serve the City”
MethodMethodMethodMethod
t 1
j
x 1 x 2
T r a v e l D i r e c t io n

9
“Let Knowledge Serve the City”
MethodMethodMethodMethod
E x c e s s A c c u m u la t io n
D e la y
x 1 x 2
T ra v e l D ire c t io n

10
“Let Knowledge Serve the City”
Cumulative CurvesCumulative CurvesCumulative CurvesCumulative Curves
Tim e, t
N(x
,t)
q 0=6000 vph
N(x,t)
N (x,t) - q t'0

11
“Let Knowledge Serve the City”
Skewed Cumulative CurvesSkewed Cumulative CurvesSkewed Cumulative CurvesSkewed Cumulative Curves
Tim e, t
N(x
,t)
- q
t'0
N (x,t) - q t'0

12
“Let Knowledge Serve the City”
Site – Gardiner ExpresswaySite – Gardiner ExpresswaySite – Gardiner ExpresswaySite – Gardiner Expressway
60
Spadina Ave.
Jameson Off Ramp
780 m
50
280 m570 m
16
490 m
N
70
8080
630 m
20
580 m
16
Detector Station
Video Camera
Travel Direction
Loop Detector
4030
90
60
Spadina Ave.
Jameson Off Ramp
780 m
50
280 m570 m
16
490 m
N
70
8080
630 m
20
580 m
16
Detector Station
Video Camera
Travel Direction
Loop Detector
4030
90

13
“Let Knowledge Serve the City”
Occupancy DataOccupancy DataOccupancy DataOccupancy Data

14
“Let Knowledge Serve the City”
Loop Sensor Data ValidationLoop Sensor Data ValidationLoop Sensor Data ValidationLoop Sensor Data Validation
0
100
200
300
400
500
600
700
800
900
15:
10:1
2
15:
11:1
2
15:
12:1
2
15:
13:1
2
15:
14:1
2
15:
15:1
2
15:
16:1
2
15:
17:1
2
15:
18:1
2
15:
19:1
2
15:
20:1
2
15:
21:1
2
15:
22:1
2
15:
23:1
2
15:
24:1
2
15:
25:1
2
15:
26:1
2
15:
27:1
2
15:
28:1
2
15:
29:1
2
Time
N(x
, t)
LoopDetector
Data
N-curveextractedfrom videojust upstreamof detector 80

15
“Let Knowledge Serve the City”
Loop Sensor Data ValidationLoop Sensor Data ValidationLoop Sensor Data ValidationLoop Sensor Data Validation
15:
10:1
2
15:
11:1
2
15:
12:1
2
15:
13:1
2
15:
14:1
2
15:
15:1
2
15:
16:1
2
15:
17:1
2
15:
18:1
2
15:
19:1
2
15:
20:1
2
15:
21:1
2
15:
22:1
2
15:
23:1
2
15:
24:1
2
15:
25:1
2
15:
26:1
2
15:
27:1
2
15:
28:1
2
15:
29:1
2
Time
N(x
, t)-
qt',
q=
232
5 ve
hicl
es p
er h
our
00
Video
Loop

16
“Let Knowledge Serve the City”
Pinpointing the BottleneckPinpointing the BottleneckPinpointing the BottleneckPinpointing the Bottleneck
Sta. 5015:53:03
Sta. 6015:51:23
Time, @ 40t
Sta. 40
Sta. 70 & 80
Sta. 60
Sta. 50
100
0
Sta. 7015:49:43Sta. 8015:50:03
Sta. 6015:40
8050 60LEG EN D
40

17
“Let Knowledge Serve the City”
Queue PresenceQueue PresenceQueue PresenceQueue Presence
Sta. 60
Sta. 80
Tim e, @ 60t
Tim e, @ 80t
18:0
0 S
TAT
ION
80
100
0
8050 60LEG EN D
40

18
“Let Knowledge Serve the City”
Bottleneck DeactiviationBottleneck DeactiviationBottleneck DeactiviationBottleneck Deactiviation
Tim e, t
0
1
0
1
18
:12
:03
DO
WN
ST
RE
AM
SP
ILL
OV
ER
8060LEG EN D

19
“Let Knowledge Serve the City”
Estimating Bottleneck CapacityEstimating Bottleneck CapacityEstimating Bottleneck CapacityEstimating Bottleneck Capacity
Tim e, t
16:0
9:43
15:5
0:0
3Q
UE
UE
DIS
CH
AR
GE
18:0
4:03
INC
IDE
NT
15:29:031
6:29
:03
16:
27:
43
N(8
0,t)
-qt',
q =
586
0 ve
hicl
es
per
hour
00
18:1
2:0
3S
PIL
LOV
ER
T(8
0,t)
-b(8
0)t',
b(8
0)
= 1
530
sec
ond
s pe
r ho
ur0
0
100
0
0
100N(80,t)-q t'0
T(80,t)-b (80)t'0
14:55:03 15:07:03 15:19:03 15:31:03 15:43:03 15:55:03 16:07:03 16:19:03 16:31:03 16:43:03 16:55:03 17:07:03 17:19:03 17:31:03 17:43:03 17:55:03 18:07:03 18:19:03
6490
5740 6150
792
0
5960
5490
5970
5040
The A ctive Bottleneck
8050 60LEG EN D
40

20
“Let Knowledge Serve the City”
ReproducibilityReproducibilityReproducibilityReproducibility
FlowImmediately
Prior to Queue
Average Discharge Rate PercentDrop
Long Run High
DischargeRate
ImmediatelyFollowing
Queue Lane 1 Lane 2 Lane 3 Total
Day Rate (a)
vph
Rate
vph
Rate
vph
Rate
vph
Rate
vph
Rate
vph
Rate(b)
vph
Duration
hr:min
(a)-(b)%
1 6490 6970 5740 2340 1920 1720 5970 2:22 8%
a 6620 6870 5650 2290 1910 1690 5970 2:08 10%
b 6120 7250 5700 2330 1950 1690 5870 0:59 4%
c 6270 7120 5640 2290 1890 1620 5780 2:42 8%

21
“Let Knowledge Serve the City”
Active Bottleneck Under Different ConditionsActive Bottleneck Under Different ConditionsActive Bottleneck Under Different ConditionsActive Bottleneck Under Different Conditions
Tim e, t
15:1
2:0
3Q
UE
UE
DIS
CH
AR
GE
17:3
5:23
N(8
0,t)
-qt',
q =
545
0 ve
hicl
es
per
hour
00
18:0
4:0
3
T(8
0,t)
-b(8
0)t',
b(8
0)
= 1
494
sec
ond
s pe
r ho
ur0
0
100
0
0
20
N(80,t)-q t'0
T(80,t)-b (80)t'0
5810 SP
ILLO
VE
R
DE
AC
TIV
AT
ION
The A ctive Bottleneck
15:5
7:2
3
16:
31:0
3 16:5
9:43
5910
5830
5750
5710
8050 60LEG EN D
40

22
“Let Knowledge Serve the City”
ReproducibleReproducibleReproducibleReproducible
Average Discharge Rate
Lane 1 Lane 2 Lane 3 Total
Day Rate
vph
Rate
vph
Rate
vph
Rate(b)
vph
Duration
hr:min
1 2340 1920 1720 5970 2:22
a 2290 1910 1690 5970 2:08
b 2330 1950 1690 5870 0:59
c 2290 1890 1620 5780 2:42
2 2310 1890 1620 5810 2:28
d 2390 1910 1560 5800 0:41
e 2350 1990 1730 6070 1:17
f 2290 1920 1730 5950 2:58

23
“Let Knowledge Serve the City”
Precursors to BreakdownPrecursors to BreakdownPrecursors to BreakdownPrecursors to Breakdown
Tim e , t
N(x
,t)
- q
t, q
= 2
050
vehi
cles
per
hou
r0
0
M edian Lane
0
100
Center Lane
Shoulder Lane
2430
2130
2470
20102120
1930
2000
2280
24702000
2270
1820
16802230
17902340
17501920
Tota
l = 6
970
vp
h
2120
8050 60LEG EN D
40

24
“Let Knowledge Serve the City”
SummarySummarySummarySummary
• Benefits from applying method to archived sensor data.Benefits from applying method to archived sensor data.• Bottleneck location fixed: 1 km downstream of ramp.Bottleneck location fixed: 1 km downstream of ramp.• Resolved two-capacity issue: high flow prior to queue formation.Resolved two-capacity issue: high flow prior to queue formation.• Tell-tale breakdown signal.Tell-tale breakdown signal.• Measured capacity: average discharge flow.Measured capacity: average discharge flow.
• Benefits from applying method to archived sensor data.Benefits from applying method to archived sensor data.• Bottleneck location fixed: 1 km downstream of ramp.Bottleneck location fixed: 1 km downstream of ramp.• Resolved two-capacity issue: high flow prior to queue formation.Resolved two-capacity issue: high flow prior to queue formation.• Tell-tale breakdown signal.Tell-tale breakdown signal.• Measured capacity: average discharge flow.Measured capacity: average discharge flow.

25
“Let Knowledge Serve the City”
ConclusionsConclusionsConclusionsConclusions
• Importance of bottlenecks.Importance of bottlenecks.• Robust method.Robust method.• Greater understanding of merge bottlenecks.Greater understanding of merge bottlenecks.• Contributions:Contributions:
– Empirical approach.Empirical approach.– Metering, managing and modeling.Metering, managing and modeling.– ATIS, ATMS, and ADUSATIS, ATMS, and ADUS

26
“Let Knowledge Serve the City”
Ongoing ResearchOngoing ResearchOngoing ResearchOngoing Research
• Toronto merge Toronto merge trajectoriestrajectories
• Lane drop Lane drop bottleneck bottleneck
– LondonLondon– MinneapolisMinneapolis
– Other bottlenecksOther bottlenecks
• Toronto merge Toronto merge trajectoriestrajectories
• Lane drop Lane drop bottleneck bottleneck
– LondonLondon– MinneapolisMinneapolis
– Other bottlenecksOther bottlenecks
27
“Let Knowledge Serve the City”
Ongoing ResearchOngoing ResearchOngoing ResearchOngoing Research

28
“Let Knowledge Serve the City”
Example ProjectsExample ProjectsExample ProjectsExample Projects
• Portland Advanced Traffic Portland Advanced Traffic Management System (TransPort)Management System (TransPort)
– 90 ramp meters90 ramp meters– 400 inductive loop detectors400 inductive loop detectors– 49 CCTV cameras49 CCTV cameras– 13 variable message signs13 variable message signs
• Using archived data to demonstrate Using archived data to demonstrate value of archiving, and expanding value of archiving, and expanding possibilities for generating possibilities for generating information useful for planners, information useful for planners, engineers, policymakers and engineers, policymakers and ultimately the users via ATISultimately the users via ATIS
• Monica Leal, MS StudentMonica Leal, MS Student
US 26 Eastbound - ADT10/30/00 - 11/03/00
0
20000
40000
60000
80000
100000
120000
140000
160000
60 62 64 66 68 70 72 74
MILE POST
AD
T (v
pd)
Data Eastbound
ODOT tw o directions
Range betw een 30 % and 70 %- ADT-1999
Directional Distribution 50/50-ADT 1999
MILEPOST
Station 1 - 61.25 Station 2 - 62.47 Station 3 - 64.50 Station 4 - 64.60 Station 5 - 65.90 Station 6 - 67.40 Station 7 - 68.55 Station 8 - 69.31 Station 9 - 69.31*Station 10 - 70.90 Station 11 - 71.37
Station 10 - Ramp data missing.
*
Using Archived ITS Data for Transportation Performance MeasuresUsing Archived ITS Data for Transportation Performance MeasuresOregon Department of TransportationOregon Department of TransportationUsing Archived ITS Data for Transportation Performance MeasuresUsing Archived ITS Data for Transportation Performance MeasuresOregon Department of TransportationOregon Department of Transportation

29
“Let Knowledge Serve the City”
Example ProjectsExample ProjectsExample ProjectsExample Projects
Using Archived Data to Measure Operational Benefits of Intelligent Using Archived Data to Measure Operational Benefits of Intelligent Transportation System InvestmentsTransportation System Investments
U.S. Department of Transportation (TransNow) and ODOTU.S. Department of Transportation (TransNow) and ODOT• Use existing data, surveillance and communications infrastructureUse existing data, surveillance and communications infrastructure• Two case study evaluations for OregonTwo case study evaluations for Oregon
– COMET incident management programCOMET incident management program– Portland ramp metering system. Portland ramp metering system.
• Set precedent for future evaluations of ITS programs. Set precedent for future evaluations of ITS programs.
30
“Let Knowledge Serve the City”
Example ProjectsExample ProjectsExample ProjectsExample Projects
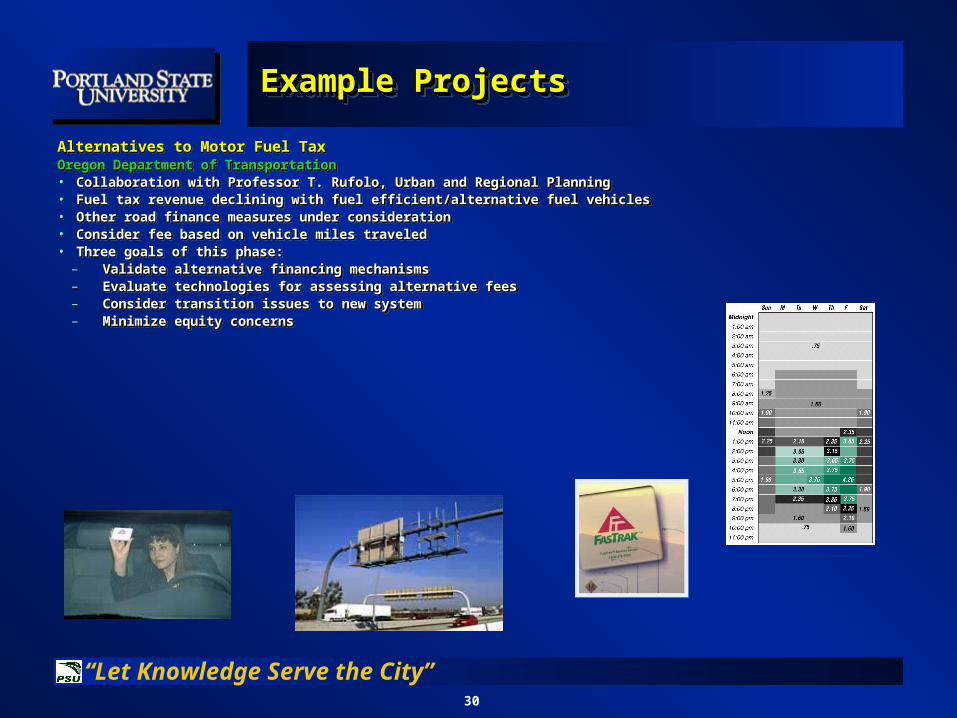
Alternatives to Motor Fuel TaxAlternatives to Motor Fuel TaxOregon Department of TransportationOregon Department of Transportation• Collaboration with Professor T. Rufolo, Urban and Regional PlanningCollaboration with Professor T. Rufolo, Urban and Regional Planning• Fuel tax revenue declining with fuel efficient/alternative fuel vehiclesFuel tax revenue declining with fuel efficient/alternative fuel vehicles• Other road finance measures under considerationOther road finance measures under consideration• Consider fee based on vehicle miles traveledConsider fee based on vehicle miles traveled• Three goals of this phase:Three goals of this phase:
– Validate alternative financing mechanismsValidate alternative financing mechanisms– Evaluate technologies for assessing alternative feesEvaluate technologies for assessing alternative fees– Consider transition issues to new systemConsider transition issues to new system– Minimize equity concernsMinimize equity concerns
31
“Let Knowledge Serve the City”
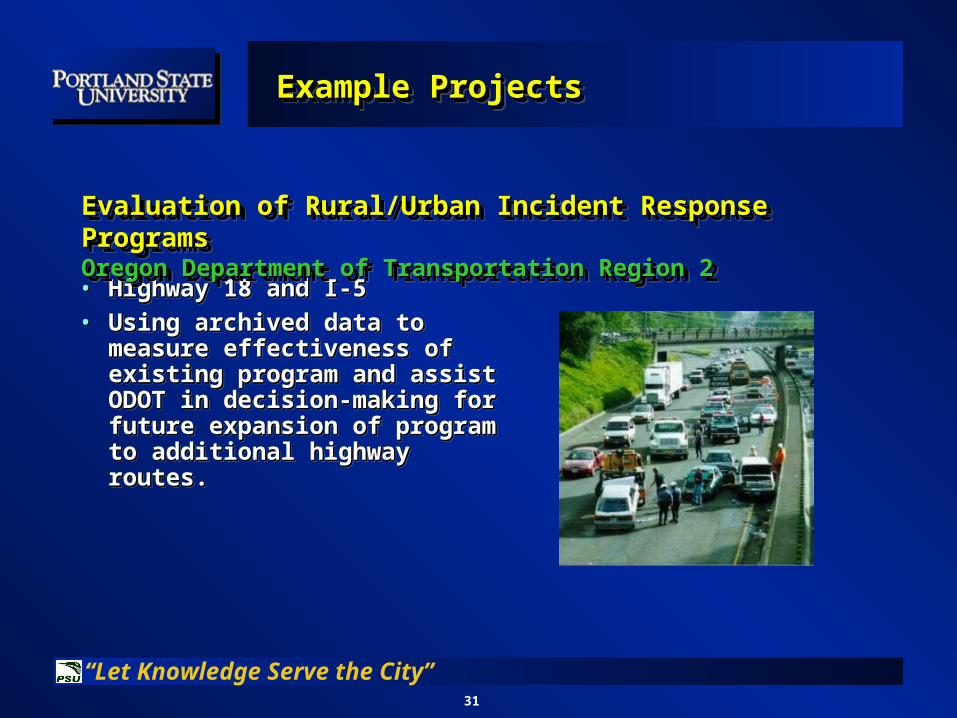
• Highway 18 and I-5Highway 18 and I-5• Using archived data to measure Using archived data to measure
effectiveness of existing program effectiveness of existing program and assist ODOT in decision-and assist ODOT in decision-making for future expansion of making for future expansion of program to additional highway program to additional highway routes.routes.
Example ProjectsExample ProjectsExample ProjectsExample Projects
Evaluation of Rural/Urban Incident Response ProgramsEvaluation of Rural/Urban Incident Response ProgramsOregon Department of Transportation Region 2Oregon Department of Transportation Region 2Evaluation of Rural/Urban Incident Response ProgramsEvaluation of Rural/Urban Incident Response ProgramsOregon Department of Transportation Region 2Oregon Department of Transportation Region 2

32
“Let Knowledge Serve the City”
Prototype for Advanced Public Transit Systems in Multimodal CorridorPrototype for Advanced Public Transit Systems in Multimodal CorridorGreat Cities Universities Coalition: Federal Transit AdministrationGreat Cities Universities Coalition: Federal Transit Administration• Multi-disciplinary/multi-university team:Multi-disciplinary/multi-university team:
• PSU Civil EngineeringPSU Civil Engineering• PSU Urban StudiesPSU Urban Studies• City College of New York/City University of New YorkCity College of New York/City University of New York• Northwestern UniversityNorthwestern University• University of Alabama, BirminghamUniversity of Alabama, Birmingham
• Interstate 5/Barbur Blvd. CorridorInterstate 5/Barbur Blvd. Corridor• Testing strategies for improving transit operationsTesting strategies for improving transit operations and passenger information systemsand passenger information systems
Example ProjectsExample ProjectsExample ProjectsExample Projects

33
“Let Knowledge Serve the City”
Example ProjectsExample ProjectsExample ProjectsExample Projects
Using Transit Vehicles as Traffic ProbesUsing Transit Vehicles as Traffic ProbesTri-MetTri-MetUsing Transit Vehicles as Traffic ProbesUsing Transit Vehicles as Traffic ProbesTri-MetTri-Met

34
“Let Knowledge Serve the City”
• PSU Civil EngineeringPSU Civil Engineering• PSU Urban Studies and PlanningPSU Urban Studies and Planning• OHSU Department of Emergency MedicineOHSU Department of Emergency Medicine• PSU School of Community HealthPSU School of Community Health
• City of PortlandCity of Portland• Multnomah County EMSMultnomah County EMS• Oregon Department of Health ServicesOregon Department of Health Services• Oregon State PoliceOregon State Police• Tri-MetTri-Met• Tualatin Valley Fire and RescueTualatin Valley Fire and Rescue• Willamette Pedestrian Coalition Willamette Pedestrian Coalition
Example ProposalExample ProposalExample ProposalExample Proposal
ù
ù
ù
ù
ù
ù
ù
ù
ù
ù
ù
ù
ù
ù
ù
ù
ùù
ù
ù
ù
ùù
ù
ù
ù
ù
ù
ù
ù
ù
ù
ù
ù
ù
ùù
ù
ù
ù
ù
ù
ù ù
ù
ùù
ù
ù
ù
ù
ù
ù
ù
ù
ù
ù
ù
ù
ù
ù
ùù
ù
ùùùù
ù
ù
ù ù
ù
ù
ù
ùùù
ù
ù
ù
ù
ù
ù
ù
ù
ùù
ù
ù
ù
ù
ù
ù
ù
ù
ù
ù
ù
ù
ù
ù
ù
ù
ù
ù
ù
ù ù
ù
ù
ù
ù
ù
ùù
ù
ù
ù
ù
ùù
ù
ù
ù
ù
ù
ù
ù
ù ùù ùù
ù
ù
ù
ù
ù
ù
ù
ù
ùù
ù
ù
ù
ù
ù
ù
ù
ù
ù
ù
ù
ù
ù
ù
ù
ù
ù
ùù
ùù
ùù
ù
ù ù
ù
ù
ù
ù
ù
ù
ù
ù
ù
ù
ù
ù
ù
ù
ùù
ù
ù
ù
ù
ù
ù
ù
ù
ù
ùù
ù
ù
ù
ù
ù
ù
ùù
ù
ù
ù
ù
ù
ù
ù
ù
ù
ùù
ù
ù
ù
ù
ù
ù
ù
ù
ù
ù
ù
ù
ù
ù
ù
ù
ù
ù
ù
ù
ù
ù
ù
ùù
ù
ù
ù ù
ù
ù
ù
ù
ù
ù
ùù
ùù
ù
ù
ù
ù
ù
ù
ù
ù
ù
ù
ù
ù
ù
ù
ù
ù
ù
ù
ù
ù
ù
ùù
ù
ù
ù
ù
ù
ù
ù
ù
ù
ù
ù
ù
ùù
ù
ù
ù
ù
ùù
ù
ù
ù
ù
ù
ù
ù
ù
ù
ùù
ùù
ù
ù
ù
ù
ù
ù
ùù
ù
ù
ù
ù
ù
ù
ù
ù
ù
ùùù
ù
ù
ù
ù
ù
ù
ù
ù
ùù
ùù
ù
ù
ù
ù
ù
ù
ù
ù
ù
ù
ùù
ù
ù
ù
ù
ù
ù
ù
ù
ù
ù
ù
ùù
ù
ù
ùù
ù
ù
ùùù
ù
ù
ù
ù
ù
ù
ù
ù
ù
ù
ù
ù
ù
ù
ù
ù
ù
ù
ù
ùù
ù
ù
ù
ù
ù
ù
ù
ù
ù ùùù
ù
ù
ù
ù
ù
ù
ù
ù
ù
ù
ùù
ù
ù
ùù
ù
ù
ù
ù
ùùù
ù
ù
ù
ù
ù
ùù
ù
ù
ùù
ù
ù
ù
ù
ù
ù
ù
ù
ù
ù
ù
ù
ù
ù
ù
ù
ù
ù
ù
ù
ù
ù
ù
ù
ù
ù
ù ù
ù
ù
ù
ùù
ù
ù
ùù
ù
ù
ù
ù
ù
ù
ù
ù
ù
ù
ù
ù
ù
ù
ù
ù
ù
ù
ù
ù
ù
ù
ù
ù
ù
ù
ùù
ù
ù
ù
ùù
ù
ù
ù
ù
ù
ù
ù
ù
ù
ù
ùù
ù
ù
ù
ù
ùù
ù
ù
ù
ù
ù
ù
ù
ù
ù
ù
ù
ù
ù
ùù
ù
ù
ù
ù
ùù
ù
ù
ù
ù
ù
ù
ù
ù
ùùù
ù
ù
ù
ù ù
ù
ù
ù
ù
ù
ù
ù
ù
ù
ù
ù
ù
ù
ù
ù
ù
ùù
ù
ù
ù
ù
ù
ù
ù
ù
ù
ù
ù
ù
ù
ù
ù
ù
ù
ù
ù
ù
ù
ù
ù
ù
ù
ù
ù
ù
ù
ù
ù
ù
ù
ù
ù
ù
ùù
ù
ù
ù
ù
ù
ù
ù
ù
ù
ù
ùù
ù ù
ù
ù
ù
ù
ù
ù
ù
ù
ù
ù
ù
ùù ù
ù
ù
ùù
ù
ùù
ù
ù
ù
ù
ù
ùù
ù
ù
ù
ù
ù
ù
ù
ù
ù
ù
ù
ù
ù
ù
ù
ù
ù
ù
ù
ùù
ù
ù
ùù
ùù
ùù
ù
ù
ù
Pedestrian/Bicycle
Traumas
Creating Safe and Sustainable Neighborhoods for Creating Safe and Sustainable Neighborhoods for Pedestrians and BicyclistsPedestrians and BicyclistsA Great City: Great University PartnershipA Great City: Great University Partnership
Creating Safe and Sustainable Neighborhoods for Creating Safe and Sustainable Neighborhoods for Pedestrians and BicyclistsPedestrians and BicyclistsA Great City: Great University PartnershipA Great City: Great University Partnership
35
“Let Knowledge Serve the City”
New Potential ProjectNew Potential ProjectNew Potential ProjectNew Potential Project
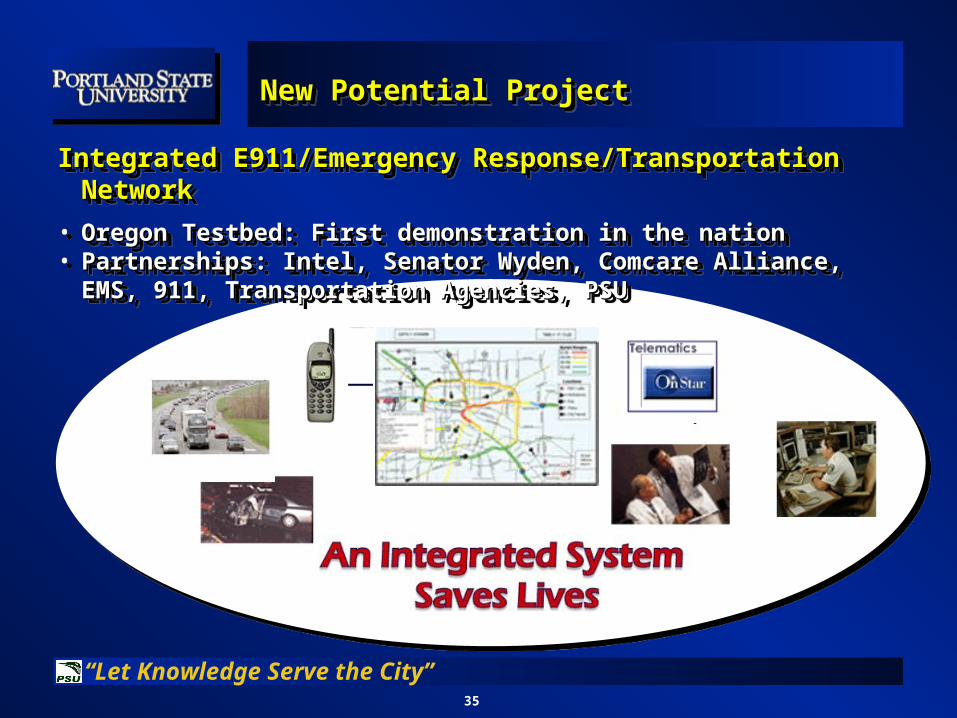
Integrated E911/Emergency Response/Transportation NetworkIntegrated E911/Emergency Response/Transportation Network
• Oregon Testbed: First demonstration in the nationOregon Testbed: First demonstration in the nation• Partnerships: Intel, Senator Wyden, Comcare Alliance, EMS, 911, Partnerships: Intel, Senator Wyden, Comcare Alliance, EMS, 911,
Transportation Agencies, PSUTransportation Agencies, PSU

36
“Let Knowledge Serve the City”
Vision for Real-Time Vision for Real-Time Traffic Management CenterTraffic Management CenterVision for Real-Time Vision for Real-Time Traffic Management CenterTraffic Management Center

37
“Let Knowledge Serve the City”
ConclusionConclusionConclusionConclusion
Thank You!Thank You!Thank You!Thank You!