cancer in ayas - oregon health & science university
TRANSCRIPT

Bleyer
Policy Implications Institute of Medicine
Washington, DC
July 13, 2013
Cancer in AYAs Epidemiology, Mortality, Survival - USA
Archie Bleyer, MD Department of Radiation Medicine
Knight Cancer Institute Oregon Health and Science University

Bleyer
• Incidence Trends
• Cancer Invasive and “Non-Invasive”
• Death Trends
• Survival Trends
• Affordable Care Act Effect
Cancer in AYAs Epidemiology, Mortality, Survival - USA

Bleyer
• Incidence Trends
Cancer in AYAs Epidemiology, Mortality, Survival - USA

4
Nature Reviews Cancer 8(4):288-298, 2008.

Age at Diagnosis (Years)
Age at Diagnosis (Years)
Average Annual % Change (AAPC) in
Incidence of Cancers in AYAs
by Age at Diagnosis 2000-2010 SEER18
(28% of U.S.)
p < .05 Change in Incidence of Common Cancers in AYAs, 1992-2008, SEER131-2% >2%
Increase in Incidence
Decrease in Incidence
Age at Diagnosis (Years)
Cancer <15 15-29 30-44 45-59 60-74 75+
Acute lymphoblastic leukemia
Thyroid carcinoma
Renal carcinoma
Colorectal carcinoma
Carcinoma of lung
* Testicular carcinoma
Melanoma
Hepatic carcinoma
Ependymoma
Tongue & salivary gland carcinoma
Acute myeloid leukemia
Acute monocytic leukemia
Hodgkin lymphoma
Osteosarcoma
Chondrosarcoma
Ewing tumor
Non-RMS-KS^ soft-tissue sarcoma
Nasopharyngeal carcinoma
Adrenocortical carcinoma
** Breast Cancer
Chronic myelogenous leukemia
Medulloblastoma/PNET
Astrocytoma
** Ovarian carcinoma
** Carcinoma of cervix and uterus
Non-Hodgkin lymphoma
<15 15-29 30-44 45-59 60-74 75+
Age at Diagnosis (Years)*In males **In females^Non-rhabdomyosarcoma, non-Kaposi soft-i issue sarcoma
APC: AAPC
Cancer <15 15-29 30-44 45-59 60-74 75+
Thyroid carcinoma 4.2 4.0 6.2 6.7 7.3 6.0
Renal carcinoma 8.2 5.3 2.6 2.6 2.2
Colorectal carcinoma 2.8
Testicular carcinoma 2.0
Acute lymphoblastic leukemia
Breast cancer
Hepatic carcinoma
Medulloblastoma/PNET
Astrocytoma
Ependymoma
Acute myeloid leukemia
Acute monocytic leukemia
Chronic myelogenous leukemia
Hodgkin lymphoma
Non-Hodgkin lymphoma
Osteosarcoma
Chondrosarcoma
Ewing tumor
Non-RMS-KS^ soft-tissue sarcoma
Nasopharyngeal carcinoma
Tongue & salivary carcinoma
Adrenocortical carcinoma
Ovarian carcinoma
Carcinoma of cervix and uterus
Melanoma
Carcinoma of lung
<15 15-29 30-44 45-59 60-74 75+
AYA
* In males ** in females ^Kaposi sarcoma

• Thyroid and kidney carcinoma are dramatically
increasing in AYAs and older adults
• Thyroid cancer is also increasing in children
• Colorectal and testis carcinoma is increasing in young
AYAs but not as rapidly as thyroid and kidney cancer.
• ALL was increasing in and only in AYAs, but the trend
may have reverse after 2008 (data not shown).
• Breast cancer may be increasing in young AYAs
during the past decade.
• Lung cancer declined in older AYAs as did melanoma
and carcinoma of the cervix in young AYAs.
Incidence Trends: Summary

• The good news for melanoma and lung cancer may
have resulted from successful skin cancer
prevention campaigns and the inclusion of the
whole state of California in SEER18 and its
statewide anti-tobacco initiatives.
• The dramatic increase in thyroid and kidney cancer
is likely due increased ease of detection due to
advances in diagnostic imaging (ultrasound, etc.).*
• The increase in colorectal carcinoma incidence
may be due to an increase in HPV-associated rectal
cancer and increased detection (colonoscopy).
*This raises the question of overdiagnosis and unnecessary therapy,
primarily radio-iodine for thyroid cancer and surgery for renal cancer.
Incidence Trends: Explanations?

Cigarette Smoking Trend in U.S. High School Students
and Adults, 1965-2011
Smoking & Tobacco Use. http://www.cdc.gov/tobacco/data_statistics/tables/
trends/cig_smoking/index.htm. Accessed May 25, 2013.

Sunscreen Use Trend in U.S. AYAs
and Older Persons, 2005-2010
Cancer Trends Progress Report - Sun Protection. http://progressreport.cancer.gov/
doc_detail.asp?pid=1&did=2009&chid=91&coid=911. Accessed May 25, 2013
Males
Age 18-24
Females
Age 18-24
Males
Age 25+
Females
Age 25+

Indoor Tanning Device Use Trend in U.S. Teens*
by Race/Ethnicity, 2005-2010
Cancer Trends Progress Report - Sun Protection. http://progressreport.cancer.
gov/doc_detail.asp?pid=1&did=2009&chid=91&coid=911. Accessed May 25, 2013
Non-Hispanic Black
All Races
Hispanic
Non-Hispanic White

HPV Vaccination Trend in U.S. Adolescents, 2006-2011
National and State Vaccination Coverage Among Adolescents Aged 13–17 Years
— United States, 2011. http://www.cdc.gov/mmwr/preview/mmwrhtml/
mm6134a3.htm?s_cid=mm6134a3_e%0d%0a. Accessed May 25, 2013.

Bleyer
• Incidence Trends
• Cancer Invasive and “Non-Invasive”
Cancer in AYAs Epidemiology, Mortality, Survival - USA

0 5 10 15 20 25 30 35 40 45 50 55 60 65 70 75 80 85
Age at Diagnosis (Years)
Proportion of All Cancer that is not Reported as Malignant, by Individual Year at Diagnosis, SEER18, 2000-2009
AYA
0%
2%
4%
6%
8%
10%
12%
14%
16%
18%
AYAs: 12%-16%
“Non-Malignant”
“Non
-Malignan
t”

Females
Males
0 5 10 15 20 25 30 35 40 45 50 55 60 65 70 75 80 85
Age at Diagnosis (Years)
0%
2%
4%
6%
8%
10%
12%
14%
16%
18%
20%
22%
Proportion of All Cancer that is not Reported as Malignant, by Individual Year at Diagnosis and Sex, SEER18, 2000-2009
AYA Females: 14%-22% “Non- Malignant”
AYA Males: 8%-12% “Non- Malignant”
AYA

Cancer Reported as Non-Malignant
• Benign brain tumors
– Gliomas
– Craniopharyngioma
– Meningioma
• In situ cervix and breast cancer
• Lymphohemangiomata
• Hamartomas

Bleyer
• Incidence Trends
• Cancer Invasive and “Non-Invasive”
• Death Trends #2 Disease Killer #1 Natural Disease Killer
Cancer in AYAs Epidemiology, Mortality, Survival - USA

Bleyer
Top 10 Causes of Deaths Age 15-19 years
2008
Male Female
1 Accidents 35.5 Accidents 15.2
2 Homicide 16.5 Suicide 3.0
3 Suicide 11.6 Neoplasms 2.7
4 Neoplasms 4.0 Homicide 2.7
5 Heart Disease 2.2 Heart Disease 1.1
6 Congenital Anomalies 1.3 Congenital Anomalies 0.8
7 Cerebrovasc Disease 0.4 Cerebrovasc Disease 0.3
8 COPD 0.4 Pneumonia, Influenza 0.3
9 Septicemia 0.3 COPD 0.3
10 Other Infections 0.3 Pregnancy, Childbirth 0.3
per 100,000 per 100,000

Bleyer
1 Accidents 60.8 Accidents 18.0
2 Homicide 25.7 Suicide 4.0
3 Suicide 20.7 Homicide 4.0
4 Neoplasms 5.8 Neoplasms 3.8
5 Heart Disease 4.5 Heart Disease 2.0
6 Congenital Anomalies 1.3 Pregnancy, Childbirth 1.0
7 Diabetes 0.9 Congenital Anomalies 0.9
8 Pneumonia, Influenza 0.8 HIV 0.6
9 HIV 0.7 Septicemia 0.5
10 Cerebrovasc Disease 0.6 Diabetes 0.5
Top 10 Causes of Deaths Age 20-24 years
2008
Male Female per 100,000 per 100,000
Add 25-39 y/o

19
Number of
Deaths
0
500
1,000
1,500
2,000
2,500
3,000
1970 1975 1980 1985 1990 1995 2000 2005 2010
Females & Males
Males
Females
Annual Cancer Deaths, Age 15-24, U.S., 1970-2009
Average annual rate since 1994 = 1,681
To be updated to
1990-2010 and
include 25-39 y/o
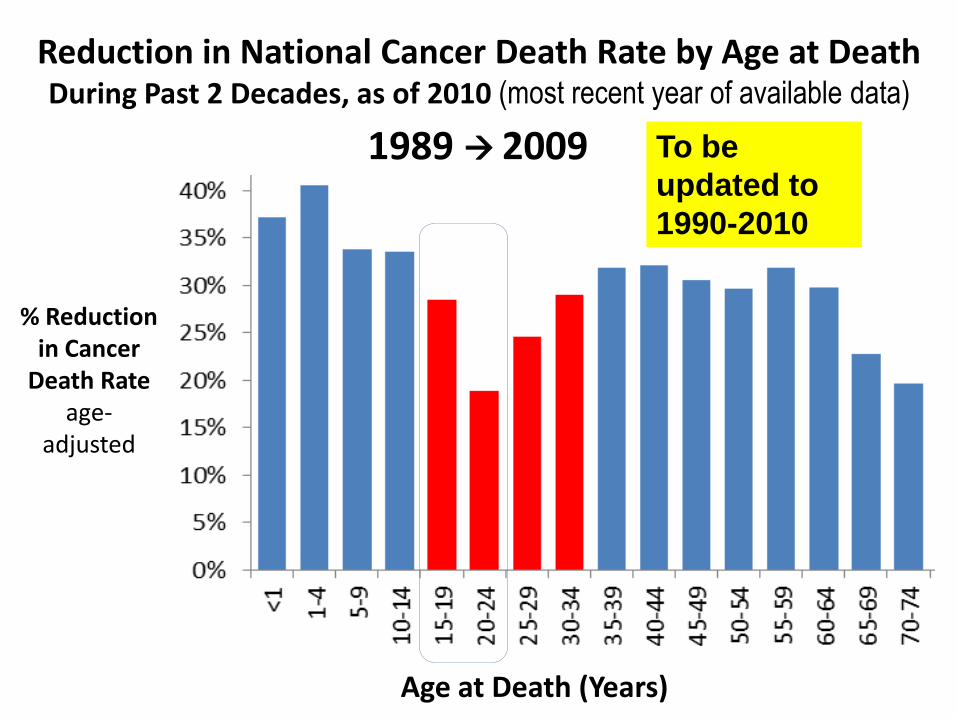
% Reduction in Cancer
Death Rate age-
adjusted
Age at Death (Years)
1989 to 2009 (2 decades)
Reduction in National Cancer Death Rate by Age at Death During Past 2 Decades, as of 2010 (most recent year of available data)
1989 2009 To be
updated to
1990-2010

Bleyer
• Incidence Trends
• Cancer Invasive and “Non-Invasive”
• Death Trends
• Survival Trends
Cancer in AYAs Epidemiology, Mortality, Survival - USA

22

23
Bleyer
Su
rviv
al
(%)
Age at Diagnosis (Years)
Ovary Cancer
Cancers with worse survival in AYAs than in younger persons
0%
20%
40%
60%
80%
100%
ALL
Hodgkin
Lymphoma
Cervix Cancer
0%
20%
40%
60%
80%
100%
0%
20%
40%
60%
80%
100%
Kidney Cancer
:Liver Cancer
0%
20%
40%
60%
80%
100%
Brain Tumors
AYA
5-Year Relative Survival Rate: 2003-2007 (thick) vs. 1993-1997 (thin)
Thick curve = 2003-2007 thin curve = 1993-1997
0 5 10 15 20 25 30 35 40 45 50 55 60 65 70 75 80 85 0 5 10 15 20 25 30 35 40 45 50 55 60 65 70 75 80 85
15 20 25 30 35 40 20 25 30 35 40 15

24
Bleyer
Su
rviv
al
(%)
0%
Age at Diagnosis (Years)
Soft Tissue Sarcoma
0%
20%
40%
60%
80%
100%
NHL
Leukemia
0%
20%
40%
60%
80%
100%
20%
40%
60%
80%
100%
0%
20%
40%
60%
80%
100% Breast Cancer
Colorectal Cancer
0 5 10 15 20 25 30 35 40 45 50 55 60 65 70 75 80 85
Cancers with worse survival in AYAs than in younger or older persons
AYA AYA
5-Year Relative Survival Rate: 2003-2007 (thick) vs. 1993-1997 (thin)
Thick curve = 2003-2007 thin curve = 1993-1997
0 5 10 15 20 25 30 35 40 45 50 55 60 65 70 75 80 85
15 20 25 30 35 40 20 25 30 35 40 15

25
Bleyer
Su
rviv
al
(%)
Age at Diagnosis (Years)
0%
20%
40%
60%
80%
100% Fibromatous
Sarcoma
20%
40%
60%
80%
100%
5-Year Relative Survival Rate: 2003-2007 (thick) vs. 1993-1997 (thin) Cancers with better survival in AYAs than in younger or older persons
20%
40%
60%
80%
100%
85.0
20%
40%
60%
80%
100%
Testicular Carcinoma
Melanoma Thyroid Cancer
CML
AYA AYA
Thick curve = 2003-2007 thin curve = 1993-1997
0 5 10 15 20 25 30 35 40 45 50 55 60 65 70 75 80 85 0 5 10 15 20 25 30 35 40 45 50 55 60 65 70 75 80 85
15 20 25 30 35 40 20 25 30 35 40 15

26
Males
5-Year Survival, Cancer, SEER9|13|18 Age 15-24 at Diagnosis
50%
60%
70%
80%
90%
100%
1975 1980 1985 1990 1995 2000 2005
Females
Survival
To be updated to
include 25-39 y/o

27
50%
60%
70%
80%
90%
100%
1975 1980 1985 1990 1995 2000 2005
Females and Males
Age 15-24
Age <15
1- and 3-yr
survival
document
crossover
during 2005 Survival
5-Year Survival, Cancer, SEER9|13|17
To be updated to 2005
and include 25-39 y/o

Bleyer
• Incidence Trends
• Cancer Invasive and “Non-Invasive”
• Death Trends
• Survival Trends
• Affordable Care Act Effect
Cancer in AYAs Epidemiology, Mortality, Survival - USA

29
Newly
Age Insured Diagnosed with Invasive Cancer
(Years) 15 months
after ACA 2011 2012 2013 2014 2015 2016 2017 Total
19 378,382 95 - - - - - - 95
20 362,494 134 138 - - - - - 273
21 349,084 114 116 118 - - - - 348
22 344,525 133 136 137 137 - - - 543
23 344,525 137 139 141 140 138 - - 695
24 361,158 155 158 159 158 156 152 - 937
25 359,830 175 180 183 184 183 179 181 1,264
Total 2,500,000 942 867 738 620 477 331 181 4,155
New Cases of Invasive Cancer in
Newly Insured 19-25 Year-Olds Within
15 Months of ACA Passage on September 23, 2010
Bleyer A, Ulrich C, Martin S: Cancer online Jun 26, 2012

30
ACA
19-25 Year-Old Americans
with Health Insurance
2009-2012
2.5 Million
6 Million
2011 2011 2012 2012

31 New Cases of Invasive Cancer in
Newly Insured 19-25 Year-Olds Within
15 Months of ACA Passage on September 23, 2010 21
9,972 Bleyer A, Ulrich C, Martin S: Cancer online Jun 26, 2012
6,000,000
A year ago

• Increase awareness of favorable
incidence trends
• Ditto re: unfavorable trends
• Promote clinical trial participation
• Plug favorable impact on AYAs of
Affordable Care Act (ACA)
• Advocate for an ACA amendment
that raises the age of aging out
• Ditto re: fertility preservation
How IOM can Help

Mind the Gap Mend the Gap e
Conclusion
NCI AYAO Sept 2013
AYAs

20 25 30 35 40 45 50 55
Age at Diagnosis (Years)
Proportion of All Invasive Cancer P
rop
ort
ion
0 5 10 15 20
Soft Tissue Sarcoma excl KS
Melanoma
Thyroid Cancer
Hodgkin Lymphoma
Testis Cancer
Non-Hodgkin Lymphoma
Ovary Cancer
Bone Sarcomas

5 10 15 20 20 25 30 35 40 45 50 55
Democrats Republicans