canada’s tariff regime - world...
TRANSCRIPT

THE CANADIAN PREFERENTIAL TARIFF REGIME AND POTENTIAL ECONOMIC IMPACTS OF ITS EROSION
Przemyslaw Kowalski1
July 2008
Introduction
This paper seeks to identify Canada’s trade partners and products that may be potentially vulnerable to the
problems of preference erosion following MFN liberalisation under the Doha Development Agenda. This
is achieved through a two-track approach. First, a detailed statistical analysis of the structure of Canadian
preferences is undertaken using data on actual trade flows under preferential arrangements for Canada in
1998, 2002 and 2003. The statistical analysis includes overviews of: the structure of preferential trade
flows; associated tariff levels and preferential margins; utilisation, utility and coverage rates; the value of
preferences by scheme and beneficiary as well as information on key tariff lines where the value of
preferences is concentrated. The second complementary approach in this paper employs the GTAP model
to examine the trade and welfare impacts of removing Canada’s preferential duties.
An overview of Canadian tariff preferences
The extent and potential economic impacts of Canada’s preferential schemes on beneficiary countries need
to be considered in relation to market access conditions that Canada’s other trading partners face in the
Canadian market. In particular the trade impact of the General Preferential Tariff (GPT) and Least
Developed Country Tariff (LDCT) schemes appear to have been limited by the relatively low protection
levels afforded to other trading partners be it on the MFN basis or through reciprocal trade agreements
(free trade areas).
Indeed, judging by the simple average tariffs, Canada’s tariffs are relatively moderate. The
simple average tariff on MFN tariff lines with imports from developing countries was estimated at around
6.0 percent in 2002 and 5.8 percent in 2003 (see Table 1). However, noticeable differences are reported in
the levels of protection of agricultural and non-agricultural products (WTO, 2003). For example, the
average MFN tariff calculated for Agriculture2 in 2002 was 21.7 percent as compared to an average of 4.2
percent for Non-agricultural products (WTO, 2003). Within agricultural products, the highest tariffs are
1 Przemek Kowalski is an economist at the Trade and Agriculture Directorate of the OECD Secretariat. The views expressed in this paper do not necessarily represent those of the OECD or any of its members. The author would like to thank Raed Safadi and Simon Evenett for their helpful comments, Karinne Logez for her statistical assistance and Caroline Mirkovic for research assistance. The assistance of Diane Kelloway of the Finance Canada in providing the underlying trade data and associated technical explanations was greatly appreciated. All remaining errors are those of the author. 2 According to the WTO definition.
placed against imports of Dairy products (237 percent), Live animals and products thereof (52.7 percent),
Beverages and spirits (8.3 percent) and Fruits and vegetables (4.8 percent). Within non-agricultural
products, the average MFN tariff on Textiles and clothing was 9.9 percent. Tariff escalation continues to
inhibit exports of downstream products to Canada by countries exporting under MFN treatment (WTO,
2003). This is the case particularly for imports of food and beverages, textiles and clothing, wood products,
chemicals and non-metallic mineral products.
Canada had five reciprocal preferential agreements at the time of writing: the Canada-Chile Free
Trade Agreement, the Canada-Costa Rica Free Trade Agreement, the Canada-Israel Free Trade
Agreement, the Canada-United Sates Free Trade Agreement, and the North-American Free Trade
Agreement. These reciprocal agreements offer significant margins of preference over MFN duties and,
albeit to a lesser extent, over GPT and LDCT treatments (see Table III.2 in WTO, 2003). For example,
under NAFTA 98.8 and 93.8 percent of tariff lines of imports originating from the US and Mexico were
duty free in 2002 (WTO, 2003). The average import duties for United States and for Mexico under
NAFTA were 2.6 percent and 2.7 percent while those for the GPT and LDCT were respectively 5.4 percent
and 4.1 percent. The significance of these NAFTA suppliers and their potential impact on the market
access of other trading partners is strengthened by their sheer size—in 2004 imports from the US and
Mexico together accounted together for around 63% of total Canadian imports.
Non-reciprocal preferential schemes
Table 2 presents basic information on Canada’s non-reciprocal preferential tariff schemes for developing
countries. Currently Canada provides non-reciprocal tariff preferences to developing countries under the
Generalized Preferential Tariff (GPT), the Least Developed Country Tariff (LDCT) and under the
CARIBCAN. However, certain Canadian imports from developing countries are classified under other
preferential (reciprocal and non-reciprocal) schemes (see Table 3 for the composition of preferential trade
flows).
The Generalized Preferential Tariff (GPT) scheme took effect in 1974 and was subsequently
renewed and expanded in 1984, 1995 and 2004. The 1995 revision aimed to take into account the effects of
erosion of preferential margins following the Uruguay Round negotiations, mainly through expansion of
product coverage and lower GPT duty rates (UNCTAD, 2001). The evolution of Canada's tariff
preferences in favour of developing countries over the past two decades reflects mainly a number of
special measures introduced for LDCs (see Weston, 2003). In 1983 LDCs were granted a zero rate on
GPT-covered products with some exceptions including clothing and footwear. As of 1999, the GPT (and
LDC) product coverage was extended by some 220 product lines and the GPT tariffs were lowered to two
thirds of the corresponding MFN rates. As pointed out by Weston (2003), in addition to improving market
2

access under GPT, this reduced the margins enjoyed by the LDC countries. In 2000 a further 570 tariff
lines were added to the duty free list for LDCs bringing the share of duty-free lines for LDCs to 90%.
Weston (2003) indicates that at the beginning of 2000s, despite the apparently high tariff line
coverage, the LDC programme of Canada was granting very little real market access: only 15 products
were exported to Canada; only around 30 percent of non-oil, non-arms imports from LDCs were duty-free
in 2000; of the Quad countries, Canada had the highest proportion of imports from LDCs facing tariffs
above 5%. Indeed, the extension of product coverage in 2000 led to very limited changes because of the
exclusion of textiles and clothing. These accounted for 38% of total LDC exports to Canada in 2000
(Kowalski and Lippoldt, 2005). As discussed below, however, an unambiguous increase in the utilization
rates of LDCT scheme by some LDC beneficiaries points to beneficial effects of more flexible rules of
origin (ROO) (see Rules of origin below).
From 1 January 2003 all remaining tariff and quota restrictions on imports from LDCs (except on
supply-managed agricultural products3 and on Myanmar) were removed. The initiative included textiles
and clothing and modification of ROOs. Before the extension to textiles and clothing, excluded products
were 93% of total dutiable LDC imports (Lippoldt and Kowalski, 2005). By 2003, the share of excluded
products had fallen to almost zero. As argued by Weston (2003) the new LDC initiative was controversial
not only because of the potential impact on Canadian producers (mainly in the clothing industry) but also
because of the reduction in this benefit when the MFA quotas disappeared after 2004..
Rules of origin
Rules of origin (ROO) can help to ensure that the products imported under the preferences are not merely
transhipped from non-eligible countries via the eligible suppliers with little or no local value added. While
under certain circumstances ROOs can play a role in ensuring the intended beneficiary countries actually
gain they are also widely seen as the main reason for underutilisation of preferences (e.g. Inama (2003)).
In the 1980s Canada introduced more generous rules of origin for LDCs than for other
developing countries with a minimum requirement of 40% of local value added compared to 60% required
for other GPT countries. The 2000 reform of the system further relaxed ROO allowing up to half of the 40
percent minimum value added requirement to originate from other developing countries (Weston, 2003).
The 2003 LDC initiative included a modification of ROO for textiles and clothing products. To be eligible
under the new ROOs the cloth has to be cut and sewn or fabric woven from yarn produced in the eligible
country. The new system allows cumulation of inputs from all beneficiary countries as long as a minimum
of 25% of value added originates from the exporting LDC country.
3 Supply-side managed products referred to here are dairy, poultry and eggs products the supply of which is regulated
in Canada through a system of quotas.
3

Other forms of compliance verification
To be eligible for LDCT or GPT, in addition to ROO requirements, goods must satisfy certification and
direct shipment requirements. Direct shipment requires that goods are shipped directly from an eligible
country or transhipped through an intermediate country under customs transit control and without
additional processing (CCRA, 2003; UNCTAD, 2001). The required documentation consists of a thorough
bill of landing (TBL) and related shipping documents if the TBL does not specify all points of transhipping
(CCRA, 2003). The system distinguishes between certificates of origin for non-textile and apparel goods
and for textile and apparel goods. The verification procedure involves an origin questionnaire or letter
returned by the exporter to Canada Customs and Revenue Agency (CCRA).
The value of preferences
A number of approaches to measuring the benefits from preferential arrangements, or alternatively the
losses from their erosion, have been employed. Among the most popular are simple calculations of the
value of benefits on fixed trade values; estimations of trade creation/trade diversion impacts; and general
equilibrium evaluations. In the first of these approaches, the benefit to the preference-receiving country is
estimated as the difference between the MFN rate and the preferential rate multiplied by the value of
imports at world prices. The effect of preference erosion is then calculated as the difference between the
value of the preference before and after a multilateral liberalization. An example of this approach is
Yamazaki’s (1996) study of agricultural preferences. A limitation of this methodology is that changes in
MFN tariffs are likely to induce changes in the volumes traded under both preferential and non-preferential
schemes, reducing the benefit to preference-receiving countries after MFN liberalisation.
A number of studies improve upon this approach by modelling the demand and supply schedules in
partial equilibrium models (see e.g. Subramanian, 2003, and Alexandarki and Lankes, 2004). This
methodology differentiates products by country of origin and controls for trade creation/diversion effects
in response to changes in trade protection measures. Under this approach, MFN liberalisation typically
results in an increased demand for products imported under MFN treatment and decreased demand for
imports entering under preferential rates. Advantages of this approach include its relative ease of
interpretation and the ability to apply it at the very detailed level of product classification. Where a far-
reaching reform is under consideration –such as currently is the case in the DDA, this can result in
unrealistic estimates of the economic value of preferential trading arrangements.
Computable general equilibrium evaluations capture the effects of substitution between imports and
domestic production, imports from preferential to non-preferential sources in the preference-giving
country, changes in demand for intermediate inputs, reallocation of productive resources across industrial
sectors, terms of trade and balance of payments effects. They can therefore better capture some of the costs
4

inherent in preferential trading arrangements such as, for example, preference-driven concentration of
resources in relatively uncompetitive activities. With this approach, the economy-wide implications of
reallocation of productive resources towards other activities are evaluated. This enables accounting for the
‘package’ nature of multilateral trade agreements where the potential negative effects associated with a
particular sector or preferential scheme can be analysed in conjunction with other effects. One drawback of
CGE modelling is a need to work at a relatively high-level of aggregation– a feature that may be
problematic because attention frequently needs to focus on particular product and country categories.
Structure and utilization of preferences
The analysis presented below draws on the tariff preference database developed by the OECD Secretariat.
The raw data covering tariff lines for which there were imports from developing countries in 1998, 2002
and 2003 were provided by Finance Canada. In addition to LDCT and GPT treatments, imports from
developing countries have been registered under Commonwealth Caribbean Countries’ Tariff, British
Preferential Tariff, the Chile tariff, the General Tariff, the Mexican Tariff, the Mexican-United States
tariff, the United States Tariff, the Canada-Israel Agreement Tariff and the Costa Rica Tariff. The database
makes a distinction between total and dutiable imports for each specific tariff line and treatment.4
An overview of 2002 and 2003 data underlying calculations in this part of the paper is presented in
Table 1, including an indication of the number of tariff lines on which at least one positive import flow
between Canada and a developing country occurred under the specific tariff treatment. The corresponding
minimum, maximum and simple average tariffs are also provided. For comparison, an average MFN rate
calculated for the corresponding tariff lines is also presented. The last column indicates the number of lines
with only ad valorem duties.
The source data include descriptions of specific duties. Non-ad valorem tariffs on goods imported
from developing countries are mostly mixed rates.5 The share of non ad valorem tariffs on MFN lines with
imports from developing countries in 2003 was 2.6 percent. For GPT, this figure was even lower (1.4
percent corresponding to 0.26 percent of the value of GPT imports) and for LDCT it was nil. Additionally,
for only 0.40 percent of the value of imports entering Canada under the GPT scheme in 2003 was the
4 Dutiable imports refer to the portion of imports that was used for calculating duty paid or payable. The data set
contains some problematic entries where for example positive values of dutiable imports are recorded for duty free records. It is important to note that Canada’s simplified tariff regime that came into effect on January 1, 1998 was reported to have caused misunderstandings with respect to coding of documents, duty rates, classifications etc. This could explain these anomalies for 1998. However, they do also occur in other years.
5 Mixed rates take the form of a conditional expression determining either an ad valorem or a specific tariff (for example X ¢/kg but not less than Y % or X ¢/kg but not to exceed Y %). Other types of specific duties used in the Canadian Customs Tariff schedule include specific, compound (combining both specific and ad valorem components) and technical rates (duty dependent on the input content).
5

corresponding MFN duty rate specified in non-ad valorem terms. For LDCT the corresponding ratio was
0.14 percent. In view of the relatively low incidence of non ad valorem items only, the ad valorem
components of mixed and compound rates are used in calculations referring to these lines.
Composition and significance of trade flows
The 2003 data indicate that around three-quarters of imports from developing countries entered Canada
under MFN treatment, 15 percent via GPT and 0.7 percent via LDCT treatment (Table 3). Corresponding
shares computed on the basis of dutiable imports are respectively 64 percent, 33 percent and 0 percent. In
2003, around 72% of imports from developing countries entering under MFN treatment were duty free
while the corresponding shares for the GPT and LDCT were 41 percent and 100 percent (Table 4).
In order to shed more light on the importance of the Canadian market for developing countries’
exports, Tables 5 and 6 present exports to Canada under all schemes (including MFN) (Table 5) and all
preferential schemes (Table 6) as a share in beneficiaries’ exports to all trading partners.6 Taking 2003 as a
reference year, the shares of total exports were up to 30 percent for some developing countries. By
contrast, exports under preferential schemes typically accounted for less than 1 percent of total beneficiary
exports. In 2003, this ratio was higher than 1 percent for only nine developing countries (Bangladesh,
Mexico, Cambodia, Haiti, People’s Democratic Republic of Laos, Maldives, Barbados, Trinidad and
Tobago, and Lesotho). It is worth noting that for six of these countries significant export increases took
place in 2003, most likely, as a result of the new LDC initiative.
The remarkable reliance of some developing countries on non-preferential access to Canada’s market
suggests their obvious interest in further liberalisation of the MFN regime. However, for a few countries,
mainly LDCs, trade under preferential schemes accounts for the bulk of their exports to Canada. This
suggests that the latter group of countries would have no major interest (apart, of course, from preventing
any negative effects of preference erosion) in lowering MFN tariffs. These contrasting situations point to
potential divisions in developing countries’ positions over the issue of lowering Canadian MFN tariffs.
Imports under the LDCT scheme exhibit a heavy concentration in five HS-2 digit textile and clothing
chapters (61-65).7 These chapters accounted for 98 percent of imports entering under this scheme. Exports
under the GPT scheme were more diversified. Still, the 6 top HS chapters accounted for more than a half
of imports under this treatment. Furniture products (HS2 chapter 94) accounted for 13 percent of imports
under the GPT scheme; Electrical machinery and equipment (HS chapter 85) 11 percent; Toys, games and
sports requisites (HS2 chapter 95) 7.5 percent; Plastics and articles thereof (HS2 chapter 39) 7.4 percent;
Articles of leather (HS chapter 42) 6.2 percent; Nuclear reactors, boilers (HS chapter 84) 5.3 percent). The 6 Data on total exports of a given developing country were collected from the WITS database. 7 See Kowalski (2008) for detailed data for all 2-digit HS chapters.
6

structure of imports from developing countries under MFN tariffs was also relatively concentrated, with
more than 50 percent of imports under MFN treatment were in 4 HS2 chapters: Electrical machinery and
equipment (HS chapter 85) 18.2 percent of imports under MFN treatment; Nuclear reactors, boilers (HS
chapter 84) 16.5%; Mineral fuels, oils and products thereof (HS chapter 27) 14.3 percent and Vehicles
other than railway or tramway rolling stock (HS chapter 87) 5.7 percent.
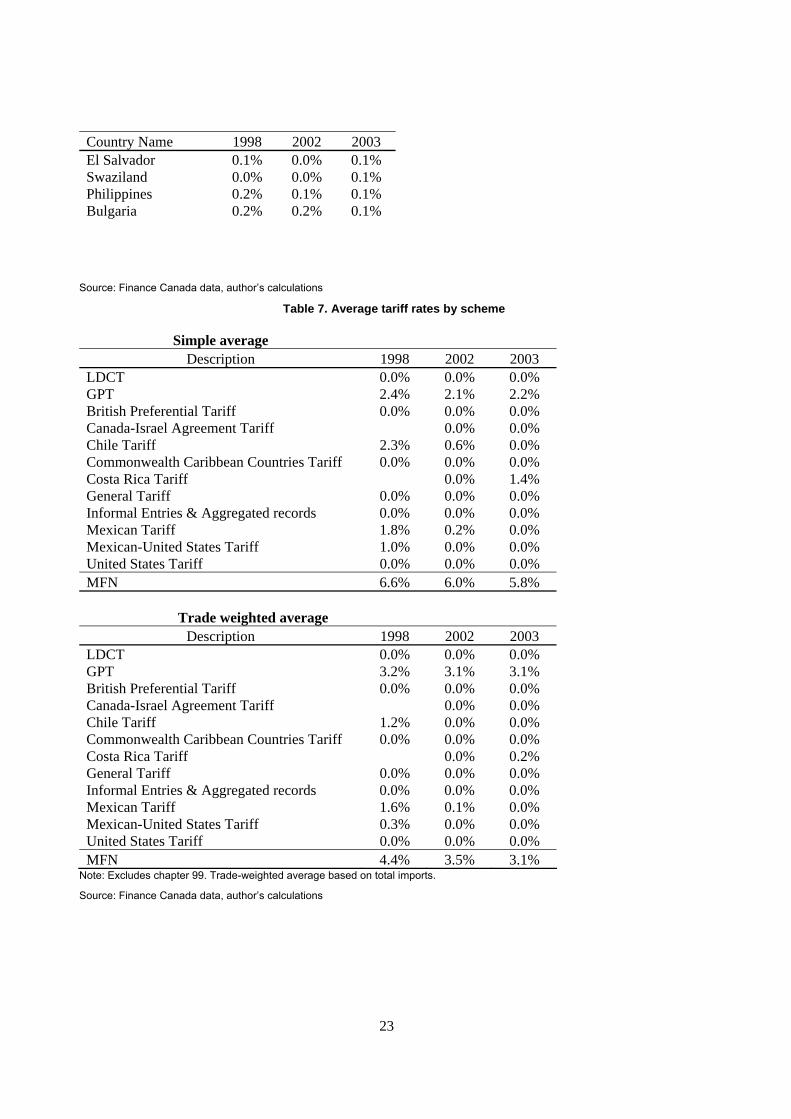
Preferential tariff rates
Substantial shares of imports from developing countries enter Canada via duty-free or low MFN tariff
rates. In 2003, 72 percent of imports from developing countries entering Canada under MFN treatment
were free of duty (Table 4) and the simple average MFN tariff rate on lines with imports from developing
countries was 5.8 percent (down from 6 percent in 2002). On a simple average basis, LDCT offered a 12
percentage point advantage over MFN rates on LDCT eligible-lines. This was significantly higher than
GPT (2 percentage points), CARIBCAN (3.5 percentage points) or various country-specific tariffs (see
columns 5 and 6 of Table 3). Notably, the GPT rates were available on many more lines than the other
Canadian preferential arrangements.
As far as individual tariff lines were concerned, preferential margins were up to 20 percentage points
for LDCT treatment, 18.5 percentage points for GPT and 12.5 for CARIBCAN. Nevertheless, the bulk of
preferential trade associated with these schemes occurred on lines with medium and small preferential
margins (see Figure 1). The simple averages of preferential margins calculated at the HS chapter level for
all and each of the LDCT, GPT and CARIBCAN schemes presented in Table 8 indicate a marked
dispersion across products. For the three schemes assessed together, in 2003 highest average margins (up
to 13 percentage points) were observed in textile & clothing products (HS chapters 61-64) which was
largely an implication of margins enjoyed by LDCT beneficiaries (up to 18 percentage points). GPT
margins in these chapters were also consistently higher than the average. However, these four chapters
accounted for only 6 percent of imports entering under the GPT, LDCT and CARIBCAN schemes.
7

Figure 1. Count of tariff lines with positive trade flows under LDCT, GPT and CARIBCAN treatments and associated preferential margins
0
20,000,000
40,000,000
60,000,000
80,000,000
100,000,000
120,000,000
Spectrum of 19,147 tariff lines with positive trade values
Valu
e of
impo
rts,
US$
0
5
10
15
20
25
asso
ciat
ed p
refe
rntia
l mar
gin
(% p
oint
s)
margin
value of imports
One possible solution to preference erosion is a simultaneous lowering of MFN and preferential rates
that preserves preferential margins. To assess the feasibility of this option, Figure 2 divides presentation
the 19,147 lines with positive trade values into a subset for which this option is feasible and one for which
it is not (rates where preferential rates are already zero). In addition a distinction is made between 7,382
lines where both preferential and MFN rates are zero and 4,138 lines where only preferential rates are zero.
This distinction is important because the latter set of lines would be affected by declining margins under
MFN liberalisation while the former would not. Overall, simultaneous reductions of MFN and preferential
rates would in principle be feasible on up to 7,582 lines8 covering 66 percent of total imports entering
under GPT, LDCT or CARIBCAN schemes. 7,382 lines covering 24 percent of preferential trade would
not be affected by MFN cuts since on these lines both the MFN and preferential rates are already zero.
Declines in preferential margins would be inevitable on 4,183 lines covering 20 percent of preferential
trade, including all preferential trade with LDCs.
8 The exact number of lines for which this is feasible depends on the ambition of the associated cut to MFN rates.
8

Figure 2. Count of tariff lines with positive trade flows under LDCT, GPT and CARIBCAN treatments and associated ratio of preferential to MFN tariff
0
20,000,000
40,000,000
60,000,000
80,000,000
100,000,000
120,000,000
Spectrum of 19,147 tariff lines with positive trade values
Valu
e of
impo
rts,
US$
0
20
40
60
80
100
120
Pref
ernt
ial t
ariff
/ co
rres
pond
ing
MFN
tarif
f * (1
00)
7,382 lines with 0 MFN and 0 preferential rate
ratio of tariffsvalue of imports
4,183 lines with positive MFN and 0 preferential
Coverage, utilisation and utility of preferences
The literature considers three indicators of preferential programmes: coverage, utilisation and utility. 9
In this assessment, Product coverage is calculated as the ratio between imports that are covered by a
preferential trade arrangement and total imports from beneficiary countries. With some exceptions,
coverage ratios tend to be high (often close to 100%) and consistent across time for CARIBCAN
beneficiaries. Across GPT beneficiaries there is no clear tendency across countries or in time. In fact 54%
of GPT beneficiaries recorded a decrease in coverage ratios between 1998 and 2002. This observation is
not easily reconciled with the 1999 extension of the GPT and LDC product coverage by some 220 product
lines and lowering of the GPT tariff to two thirds of the corresponding MFN rates. This contrasts with
LDC coverage ratios where with the exception of Afghanistan all beneficiaries move to 100 percent
coverage ratio in 2003. Undoubtedly, this is a result of the almost complete removal of all remaining tariff
and quota restrictions on imports from LDCs in 2003. The expansion of exports under the LDC scheme,
mostly in textile and clothing products which are not covered by the GPT, has also certainly affected the
coverage ratios calculated for the GPT scheme.
9 Detailed data by country and preference program on these three variables is reported in Kowalski (2008). Inama
(2003) discusses these indicators in greater depth.
9

Utilisation rates computed as ratios between imports actually entering under a preferential scheme
and imports covered by the scheme -- depend crucially on the stringency and complexity of rules of origin
and ancillary requirements (Inama, 2003). Utilization rates for the GPT indicate a very uneven take up. An
increase in utilisation rate from 1998 to 2002 was observed in only 45% of beneficiaries, an increase from
2002 to 2003 in 31 percent of countries and an increase between 1998 and 2003 in 37 percent. The
structure of LDC utilisation rates is very dichotomous. For 35 LDC countries utilisation rates have
remained consistently at zero in the three considered years. In most remaining LDC beneficiaries a positive
tendency of increasing utilisation rates was observed. In particular, the change of regime in 2003 seems to
have had a significant impact on utilisation rates of Bangladesh (89% utilisation rate in 2003), Cambodia
(89%), People’s Democratic Republic of Laos (89%), Madagascar (16%), Malawi (16%), Maldives (47%),
Nepal (51%). As is explained in the next section these substantial increases can be almost entirely
attributed to increased trade flows in textiles and wearing apparel.
A key question is why some LDC beneficiaries continue to use both GPT and LDC schemes although
the LDC scheme seems more generous? This arises often if both the GPT and LDC tariff rates are the
same. Another potential explanation is that access under the GPT scheme may be chosen if the LDC
compliance procedures constitute more of a hurdle than those under the GPT. The 2003 LDC initiative
included a modification of ROO for textiles and clothing products to require that cloth be cut and sewn or
fabric woven from yarn produced in the country. These new ROOs are one potential explanation of
utilisation of both GPT and LDCT for shipments of the same products.
This utility rate is the ratio of imports actually receiving preference to all imports (covered or not). It
gives an indication of the importance of preferences in relation to all trade. Similar to utilisation rates,
utility rates of LDCT exhibit a certain dichotomy with 35 LDCs recording consistent zero utilisation rates
and other LDCs recording marked increases in 2003. The GPT utility rates are also very dispersed with a
significant number of countries displaying marked reliance on preferences in their trade with Canada and
others for which preferences seem unimportant.
Value of preferences
An initial estimate of the value of Canada’s preferences is obtained by calculating the difference between
the MFN rate and the corresponding preferential rate and weighting by the value of imports. Total values
of preferences calculated in this way for all preferential schemes and years are presented in Table 9.
Remarkably, the value of preferences granted to Mexico under Mexican and Mexican-United States tariffs
exceeded the combined value of GPT and LDC preferences in 2003. Up until 2002 the value of GPT
preferences was close to 300 times the value of LDC preferences. In 2003 the value of LDC preferences
increased by a factor of 100 and accounted for one third of the value of the GPT scheme. The value of
10
CARIBCAN preferences was more than double that of LDC preferences in 1998 and 2002 and only one
twentieth of its value in 2003.
As far as the individual beneficiaries are concerned, the largest beneficiaries include several more
advanced countries such as Mexico, South Korea, China, India, Brazil, Israel, Malaysia, Hong Kong-China
as well as some LDCs such as Bangladesh or Cambodia. Expressed as a percentage of the total
beneficiary’s exports the value of preferences rarely exceeded 1%.10 Some of the LDCs with relatively
high ratios of value of preferences to total exports in 2003 included Bangladesh (0.52%); Cambodia
(0.43%) Haiti (0.28%), Lao PDR (0.23%), the Maldives (0.22%) and Lesotho (0.20%).
The striking increase in the value of preferences for many LDC countries in 2003 reflects an increase
in the utilization of preferences by LDCs and preferential margins on textile and clothing products that
were up to this date excluded from the duty-free treatment. The percentage increases in the value of
preferences in 2003 relative to the average for 1998 and 2002 are very substantial: 4000% for Bangladesh,
5500% for Cambodia, 8890% for Laos, 4658% for Maldives, 5061% for Madagascar and 1.5 million % for
Lesotho. In Lesotho’s case, this increase can be entirely attributed to changes on 11 HS 8-digit tariff lines
within textiles and apparel, for which duties fell from 18 or 19 percent to zero.
Value of preferences by product
Which products carry the highest value of preferences under the GPT and LDCT schemes? An answer to
this question may help decide whether exclusion of certain lines from MFN liberalisation could alleviate
the bulk of negative effects of preference erosion. Additionally, and perhaps more importantly,
identification of such lines will be a necessary step in the assessment of costs and benefits of such potential
exclusion or in designing any prospective compensation schemes. Tables 10 and 11 report data on the most
important 8-digit tariff lines for LDC and GPT preferences.
As far as the LDCT scheme is concerned, there were altogether 390 8-digit tariff lines for which
positive trade values were recorded in 2003 and 13 lines—all in Chapters 61 through 63 (Articles of
apparel, clothing accessories and other textiles articles)—on which tariff revenue losses exceeded $1
million (in Table 10). These tariff lines accounted for 64 percent of the total value of LDCT preferences in
2003. At the same time the associated values of preferences for each or these individual lines did not in any
case exceed US$ 8.6 million and accrued consistently to a small group of beneficiaries such as Bangladesh,
Cambodia, Laos, Lesotho, Madagascar, Malawi, Maldives, Nepal, Niger and Haiti.
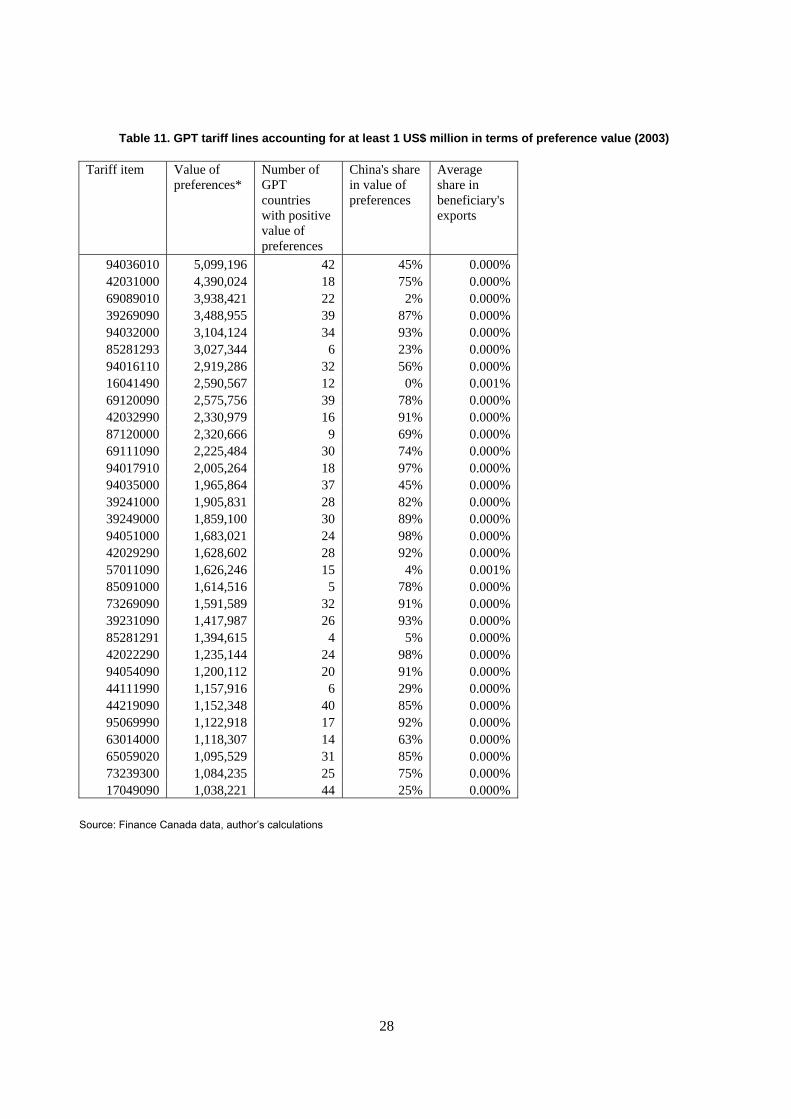
As far as the GPT scheme is concerned, there were 2000 8-digit tariff lines with positive imports in
2003. There were 32 such lines for which preferences involved more than $1 million in foregone tariff
revenue. These tariff lines accounted for 38 percent of the total value of GPT preferences in 2003. The 10 The Turks and Caicos Islands are an exception - an overseas territory of the UK.
11

noticeable difference is that for each of the identified tariff lines the number of beneficiaries was typically
larger than in the LDC case. However, the highest value of preferences calculated at the tariff line level
was lower than in the LDC case (around US$ 5 million) and typically the value of GPT preferences
accounted for smaller shares of beneficiaries’ exports. A striking feature of the value of GPT preferences
that transpires from Table 11 is that for the majority of the identified tariff lines most of the value of
preferences was associated with imports from China (see the shares in the fourth column of Table 11).
Overall, China accounted for 64 percent of the value of Canadian GPT preferences in 2003.
High tariff line concentration in the LDCT and GPT schemes suggests that exclusion of relatively few
lines from MFN liberalisation could alleviate the bulk of negative effects of preference erosion in the
Canadian market. However, the benefits of such an option would have to be weighed against the costs of
unrealized liberalisation. For example, the value of LDCT preferences on HS-8 digit line 62046200 (US$
8.6 million – see Table 10 ) should be compared with benefits (to Canada and its trading partners) that
could be obtained by reducing protection on the US$ 257 million worth of Canadian non-LDC imports on
this line.
Economic value of preferences in 2001 - a general equilibrium assessment
This section reports on the results of a model-based assessment of value of Canadian preferences. The
analysis employs the standard GTAP model11 with the version 6 database. The model-based approach
allows a fuller economic assessment of the value of preferences taking into account the interaction of
impacts across preference receiving and other sectors and impacts across supplying countries. Changes in
market access conditions for one product category are linked to developments in other sectors through
goods and factors markets. Representation of such inter-sectoral linkages permits accounting for the reality
that while some producers in selected preference-receiving sectors may be affected negatively, the
resources that are freed from that sector can be employed in other sectors that may gain better access to
world markets or be simply more productive.
One disadvantage of this approach is a relatively high level of product and country aggregation that
may mask some individual effects. The scenario considered here involves an equalisation of product-level
bilateral ad valorem measures of protection (see next Section for an explanation) with the pre-shock
average calculated across all trading partners (a proxy for the MFN rate). This scenario mimics a situation
in which, starting from the 2001 base with preferences, all preferential access to Canada is removed.
11 The most comprehensive description of the model is in Hertel (1997). Information more recent developments can
be accessed at www.gtap.org
12

Preferential access to Canadian market in the GTAP framework
The basic GTAP dataset used covered 57 broad economic sectors and 87 countries. For our purposes, it
was aggregated to 44 countries/regions and 22 sectors using trade-weighted tariffs. A key advantage this
data set is that it fully integrates the information on bilateral ad valorem tariffs (both MFN and
preferential), ad valorem equivalents of specific tariffs (MFN and preferential), and tariff rate quotas from
CEPII/ITC Market Access Maps (MAcMaps) database.12 The resulting ad-valorem equivalent measures
of applied protection are consistent across all bilateral trade flows.
Simulation results
As indicated above, the shock considered here is an equalisation of product-level bilateral ad valorem
measures of protection with the pre-shock average calculated across all trading partners (a proxy for the
MFN rate). Welfare results associated with the considered scenario (reported in Kowalski 2005) indicate
that the removal of Canadian preferences has a very minor impact on developing country partners’ welfare.
For ten developing country regions (including Thailand, Mexico, Chile, South Africa, Malawi, Tanzania,
Uganda, and three composite developing regions (Rest of North America, Rest of Middle East and North
Africa and Rest of Sub Saharan Africa) the reported welfare changes are negative. However, the
associated proportional welfare changes with respect to base do not exceed one-tenth of a percent in any of
the cases.
At the same time it worth bearing in mind that estimates presented here for 2001 are based on a static
resource allocation exercise taking resources, technology and institutions as given. If the trade reform
encouraged inflows of technology (as it is expected to do)—say, through increased imports or exports,
FDI, licensing etc. - or if it introduced fundamental institutional reform, it could have more pronounced
effects on welfare. The magnitude of obtained welfare change estimates would undoubtedly change if
some these components of reality were incorporated into the model structure. Given the nature of this
exercise, the results can be interpreted with more confidence in relative terms than in absolute terms.
Table 12 includes a comparison of impacts with a scenario involving a 50% lowering of tariff
protection in all regions. Not only does such a scenario provide a benchmark for comparison of magnitudes
with effects of preferences removal, but it may also serve as a comparison with gains that can be obtained
from a worldwide halving of applied tariff rates that would be predicted by this particular CGE model and
data. Of course, such a scenario embodies elements of both preference erosion in other Quad markets and
effects of liberalisation by third countries including own effects of liberalisation by developing countries.
12 The dataset is documented in detail in Bouët, A., Fontagné, L., Mimouni, M., and F. Von Kirchbach
(2002).
13

A more detailed discussion of such a scenario in the context of preference erosion issue is provided in
Lippoldt and Kowalski (2005).
Notwithstanding some sign differences, it is clear that the effects of multilateral liberalisation are up
to two orders of a magnitude higher than those associated with removal of Canadian preferences. Focusing
on countries that are affected negatively by the removal of Canadian preferences, we see that Mexico—
which is estimated to lose 0.01 percent of welfare from the removal of Canadian preferences—is estimated
to gain 0.10 percent from the worldwide lowering of tariffs. Malawi which is likewise estimated to lose
0.01 percent from preference erosion stands to gain 1.42 percent from the worldwide lowering of tariffs.
Thailand which is unaffected by the removal of Canadian preferences experiences a 1 percent welfare gain
from multilateral liberalisation. It is worth noting that a number of developing countries predominantly in
Sub-Saharan Africa which are not affected by the removal of Canadian preferences are affected negatively
with negative impacts of multilateral liberalisation scenario reaching up to 0.30 percent of their base
welfare. As discussed in Lippoldt and Kowalski (2005) these negative effects are explained largely by the
effects of tariff liberalisation in the EU which are in turn determined by a combination of the high EU
shares in the total exports of several beneficiary countries and the substantial size of EU preferential
margins in certain sectors.
As already emphasized, the latter experiment includes tariff cutting by countries other than Canada,
and so the resulting numbers cannot be used directly to ascertain the effects of MFN tariff reductions on
the value of Canadian preferences. They rather give a sense of the magnitude of preference erosion. To
further facilitate the interpretation of results, Table 12 includes welfare estimates of a scenario involving a
50 percent lowering of tariff protection only by Canada. We can conclude that results from this experiment
are very similar to those associated with the removal of Canadian preferences, both qualitatively and
quantitatively.
There is a number of reasons why our results need to be treated with considerable caution. Firstly, the
data constraints imply high levels of country and product aggregation which may mask some impacts on
smaller developing countries and producers of specific products. Secondly, as discussed in the first part of
the paper, the 2003 introduction of the new LDC initiative had significant implications for preferential
trade with Canada of selected textile and clothing-producing LDCs. Nevertheless, even this remarkable
change has not had a major impact on total shares of Canada in these countries’ exports. For this reason,
the small welfare impacts of Canadian schemes estimated with the 2001 data may be not too far from the
results that would obtain with 2003 data.
Bearing in mind all the qualifications associated with the use of the particular model and data, a
conclusion that could be drawn from this simplified model assessment is that the value of Canadian
preferences is very small for most developing countries analysed here. Notwithstanding the significant
14

variation in the utilisation and value of preferences across beneficiaries, this is consistent with the
generally small shares of preferential trade with Canada in these countries’ total trade and already low
level of Canadian tariffs. Therefore, erosion of preferential schemes does not appear as a major hurdle to
further reduction of Canadian MFN rates.
Conclusions
The extent and potential economic impacts of Canada’s preferential schemes on beneficiary countries need
to be considered in relation to market access conditions that Canada’s other trading partners face in the
Canadian market. In particular, the trade impact of GPT and the LDC schemes appear to have been limited
by the relatively low protection levels afforded to other trading partners be it on the MFN basis or through
reciprocal trade agreements. The extensive reliance of several developing countries on non-preferential
access to Canada’s market suggests their strong interest in further liberalisation of the MFN regime. Cases
of over reliance on preferential trade with Canada are limited to a few LDCs where trade under preferential
schemes accounts for the bulk of total exports to Canada and is concentrated in textile and clothing
products. A conclusion that could be drawn from the simplified model assessment implemented in the
paper is that the welfare impact of Canadian preferences is very small for most developing countries
analysed here. Notwithstanding the significant variation in the utilisation and value of preferences across
beneficiaries, this is consistent with the generally small shares of preferential trade with Canada in these
countries’ total trade. Therefore, erosion of preferential schemes does not appear to be a major hurdle to
further reduction of Canadian MFN rates.
15

16
REFERENCES
Alexandraki, K. and Lankes, H.P. (2004), “Estimating the impact of preference erosion on Middle-Income countries”, IMF Working Paper, July.
Bouët, A., Fontagné, L., Mimouni, M., and F. Von Kirchbach (2002), Market Access for GTAP: A Bilateral Measure of Merchandise Trade Protection by GTAP Resource #1045, : http://www.gtap.agecon.purdue.edu/resources/res_display.asp?RecordID=1045
Canada Border Services Agency, (2005), “Customs Tariff. Departmental Consolidation”.
Canada Customs and Revenue Agency, (2003). “An Introductory Guide to the Market Access Initiative for the Least Developed Country and the Least Developed Country Tariff”, January 2003.
Inama, S. (2003), “Trade Preferences and the World Trade Organization Negotiations on Market Access”, Journal of World Trade, 37(5).
Kowalski, P. (2005) ‘The Canadian Preferential Tariff Regime and Potential Economic Impacts of its Erosion’http://siteresources.worldbank.org/INTRANETTRADE/Resources/Kowalski_Canada_preferences.pdf
Lippoldt, D. and Kowalski, P., (2005), “Trade Preference Erosion: Potential Economic Impacts”, OECD Trade Policy Working Paper no. 17, OECD, Paris.
Safadi, R. (2003), “The Economic Impact of the Generalized System of Preferences”, paper presented to the 137th session of the OECD Trade Committee, OECD.
Subramanian, A. (2003), “Financing of Losses from Preference Erosion”, Communication from the International Monetary Fund, World Trade Organisation, WT/TF/COH/14, 14 February.
UNCTAD, (2001), "Generalized System of Preferences: Handbook on the Scheme of Canada", UNCTAD Technical Cooperation Project on Market Access, Trade Laws and Preferences, UNCTAD/ITCS/TSB/Misc.66, December 2001, Geneva.
Weston, A., (2003) “Bangladesh’s Access to the Canadian Market: Implications of the New Canadian LDC Initiative and Prospects for Export Diversification, The North-South Institute, Ottawa, January 2003.
WTO (2003), Trade Policy Review: Canada, Report by the Secretariat, World Trade Organisation, WT/TPR/S/112
Yamazaki, F. (1996), “Potential Erosion of Trade Preferences in Agricultural Products”, Food Policy, 21(4-5), 409-417.

17
Table 1. Overview of preferential tariffs in Canada (2002 and 2003)
Based on HS 8-digit with imports in 2002-2003 (excluding chapter 99)
Number of lines (1) Average Tariff (2)
Corresponding Average MFN
Tariff (3)
Minimum Tariff
Maximum Tariff Count of ad Valorem tariffs
2002 2003 2002 2003 2002 2003 2002 2003 2002 2003 2002 2003
MFN 6,931 7,057 6.0% 5.8% 0% 0% 298.5% 295.5% 6,735 6,875GPT 4,122 4,250 2.1% 2.2% 4.4% 4.3% 0% 0% 16.5% 16.5% 4,040 4,192LDCT 170 489 0.0% 0.0% 6.9% 12.4% 0% 0% 0.0% 0.0% 169 489Canada-Israel Tariff 761 776 0.0% 0.0% 6.7% 6.8% 0% 0% 5.0% 5.0% 757 760Chile Tariff 174 199 0.6% 0.0% 5.7% 7.9% 0% 0% 19.0% 0.0% 170 197Commonwealth-Caribbean 206 182 0.0% 0.0% 3.8% 3.5% 0% 0% 0.0% 0.0% 206 182Costa Rica Tariff 2 51 0.0% 1.4% 6.3% 5.5% 0% 0% 0.0% 15.0% 2 47Mexican Tariff 3,166 3,097 0.2% 0.0% 5.5% 5.5% 0% 0% 3.0% 0.0% 3,149 3,091Mexican--US Tariff 657 650 0.0% 0.0% 4.0% 3.6% 0% 0% 2.5% 0.0% 656 649No tariff data available British Preferential Tariff 133 126 N/A N/A 18.9% 18.4% N/A N/A N/A N/A 0 0General Tariff 30 39 N/A N/A 5.2% 4.1% N/A N/A N/A N/A 0 0Informal & Aggregated 12 8 N/A N/A 6.7% 2.4% N/A N/A N/A N/A 0 0United States Tariff 1,044 1,090 N/A N/A 6.2% 5.5% N/A N/A N/A N/A 0 0
(1) Number of HS 8-digit level different lines that entered Canada under the treatment indicated.
(2) Simple average of lines where there have been imports. Calculations based on ad valorem tariffs and mixed tariffs (Cf below table of mixed tariff conversion into ad valorem)
(3) Simple average of MFN tariffs in these lines. Calculations based on ad valorem tariffs and mixed tariffs.
(4) 2002 and 2003 Imports from respectively 181 and 180 countries (the same minus East Timor) eligible for Canadian GSP preferences.

18
Table 2. Generalized and selected regional preference schemes of Canada
Country / preference
scheme Dates Eligible
economies Scope of tariff and non-tariff preferences Exemptions / Restrictions
GPT (General Preferential Tariff)
Brought into effect 01/07/1974 renewed 2004, effective until 2014
All developing countries +LDCs
Type of preference: Reductions from the MFN rate or duty-free access Coverage: Selected agricultural and industrial products
Excluded items: Some agricultural products, refined sugar, most textiles, apparel and footwear. Rules of origin: • 60% local content • Cumulation from any other GPT beneficiary country or Canada • Direct shipment required Safeguard measures
LDCT (Least Developed Country Tariff) granted by Canada
1998 LDCs Type of preference: Duty free or preferential rates access (variable from product to product) Coverage: 82% of tariff lines in duty-free access for 48 LDCs. Average of non duty-free lines: 29% Average of ad valorem tariff: 5%
Excluded Items: Food products (ISIC 311)c , Animal feeds and other food products (ISIC 312c), textiles and clothing (CITI 322),… Excluded Country: Myanmar Rule of Origin: ● 40% local content (only content from least developed countries or Canada was considered originating for purposes of the 40% rule) ● Cumulation only with other LDCs and Canada (since 2000, cumulation with any other GSP country) ● Specific rules for textiles and clothing ● Direct shipment required
LDCT (Least Developed Country Tariff)
In present form since 01/01/2003
LDCs
Type of preference: Duty- and quota-free access for 48 LDCs Coverage: Almost all products (see excluded items) since extension on 01/01/2003
Excluded items: Supply-managed agricultural products like dairy products, poultry and eggs Excluded country: Myanmar Rules of origin: • 40% local content • Cumulation from any other LDCT or GPT beneficiary country or Canada • Specific rules of origin for textiles and apparel • Direct shipment required Safeguard measures
CARIBCAN Introduced 1986 Renewed in 1996 until 2007
Caribbean countries
Type of preference: Duty-free access for qualifying goods for most Commonwealth Caribbean States Coverage: Similar to GPT; slightly broader for agricultural goods
Excluded items: Some agricultural products, textiles, apparel and footwear Rules of origin: • 60% local content • Cumulation from any other beneficiary country or Canada • Direct shipment required
Commonwealth Developing Countries Remission Order
Effective 01/01/1998
Commonwealth countries
Type of preference: Duty-free access or referential duty rate Coverage: 171 tariff lines, mostly textile products Provides preferences equivalent to the former British Preferential Tariff (BPT), which was revoked on 01/01/1998
Rules of origin: • 50% local content • Cumulation is allowed among Commonwealth countries • Direct shipment required

19
Table 3. Preferential trade flows by scheme
% share 1998 2002 2003 % share 1998 MFN 76.5% 72.8% 74.1% MFN 62.9% GPT 15.0% 15.5% 15.0% GPT 25.2% LDCT 0.0% 0.0% 0.7% LDCT 0.0% British Preferential Tariff 0.2% 0.9% 0.6% British Preferential Tariff 0.7% Chile Tariff 0.2% 0.2% 0.2% Chile Tariff 0.2% Commonwealth Caribbean Tariff 0.1% 0.3% 0.2% Commonwealth Caribbean Tariff 0.0% General Tariff 0.0% 0.0% 0.1% General Tariff 0.0% Informal Entries & Aggregated records 0.0% 0.0% 0.0% Informal Entries & Aggregated records 0.0% Mexican Tariff 7.2% 8.7% 7.5% Mexican Tariff 10.9% Mexican-United States Tariff 0.7% 1.3% 1.3% Mexican-United States Tariff 0.1% United States Tariff 0.1% 0.1% 0.1% United States Tariff 0.0% Canada-Israel Agreement Tariff 0.0% 0.3% 0.3% Canada-Israel Agreement Tariff 0.0% Costa Rica Tariff 0.0% 0.0% 0.0% Costa Rica Tariff 0.0% Grand Total 100.0% 100.0% 100.0% Grand Total 100.0%

20
Table 4. Share of duty-free trade by scheme
Scheme 1998 2002 2003 Total 62% 68% 70%
by scheme: MFN 65% 70% 72% GPT 47% 42% 41%
LDCT 100% 100% 100% Commonwealth Caribbean Tariff 100% 100% 100%
Source: Finance Canada data, author’s calculations

21
Table 5. Total exports to the Canadian market as percentage of beneficiary’s exports
Note: (sorted by 2003 values)
Source: Finance Canada data, author’s calculations

Table 6. Preferential exports to the Canadian market as percentage of beneficiary’s exports (all schemes)
(sorted by 2003 values)
Country Name 1998 2002 2003 Bangladesh 0.3% 1.0% 2.9% Mexico 1.7% 2.3% 2.4% Cambodia 0.0% 0.0% 2.4% Haiti 0.1% 0.6% 1.6% Laos P. Dem. Rep. 0.0% 0.0% 1.3% Maldives 0.1% 0.1% 1.2% Barbados 1.9% 1.3% 1.2% Trinidad and Tobago 0.3% 2.6% 1.1% Lesotho 0.0% 0.0% 1.1% Guyana 0.3% 0.5% 0.9% Cuba 2.3% 1.4% 0.9% Jamaica 0.7% 0.9% 0.8% Nepal 0.2% 1.0% 0.8% China People`s Rep. 0.7% 0.8% 0.8% Pakistan 0.3% 0.9% 0.7% Sri Lanka 0.5% 0.8% 0.7% India 0.4% 0.8% 0.6% Thailand 0.4% 0.5% 0.4% Peru 0.6% 0.9% 0.4% Grenada 0.0% 0.0% 0.4% Brazil 0.3% 0.4% 0.4% Israel 0.0% 0.4% 0.4% Lebanon 0.4% 0.4% 0.4% Chile 0.4% 0.5% 0.4% Guatemala 0.8% 0.5% 0.4% Bahamas 0.8% 0.4% 0.3% Fiji 0.2% 0.5% 0.3% Uruguay 0.2% 0.4% 0.3% Vietnam 0.2% 0.3% 0.3% Botswana 0.0% 0.0% 0.2% Colombia 0.1% 0.1% 0.2% Korea, South 0.3% 0.3% 0.2% Madagascar 0.0% 0.0% 0.2% Costa Rica 0.1% 0.3% 0.2% Indonesia 0.2% 0.2% 0.2% Sierra Leone 0.5% 0.2% 0.2% Turkey 0.2% 0.2% 0.2% Poland 0.1% 0.1% 0.1% Belize 1.5% 0.6% 0.1% Dominica 0.1% 0.1% 0.1% Egypt 0.1% 0.1% 0.1% Macau 0.1% 0.2% 0.1% Hong Kong 0.2% 0.2% 0.1% Malaysia 0.2% 0.2% 0.1% Zimbabwe 0.1% 0.2% 0.1% Algeria 0.0% 0.0% 0.1%
22
23
Country Name 1998 2002 2003 El Salvador 0.1% 0.0% 0.1% Swaziland 0.0% 0.0% 0.1% Philippines 0.2% 0.1% 0.1% Bulgaria 0.2% 0.2% 0.1%
Source: Finance Canada data, author’s calculations
Table 7. Average tariff rates by scheme
Simple average Description 1998 2002 2003
LDCT 0.0% 0.0% 0.0% GPT 2.4% 2.1% 2.2% British Preferential Tariff 0.0% 0.0% 0.0% Canada-Israel Agreement Tariff 0.0% 0.0% Chile Tariff 2.3% 0.6% 0.0% Commonwealth Caribbean Countries Tariff 0.0% 0.0% 0.0% Costa Rica Tariff 0.0% 1.4% General Tariff 0.0% 0.0% 0.0% Informal Entries & Aggregated records 0.0% 0.0% 0.0% Mexican Tariff 1.8% 0.2% 0.0% Mexican-United States Tariff 1.0% 0.0% 0.0% United States Tariff 0.0% 0.0% 0.0% MFN 6.6% 6.0% 5.8%
Trade weighted average Description 1998 2002 2003
LDCT 0.0% 0.0% 0.0% GPT 3.2% 3.1% 3.1% British Preferential Tariff 0.0% 0.0% 0.0% Canada-Israel Agreement Tariff 0.0% 0.0% Chile Tariff 1.2% 0.0% 0.0% Commonwealth Caribbean Countries Tariff 0.0% 0.0% 0.0% Costa Rica Tariff 0.0% 0.2% General Tariff 0.0% 0.0% 0.0% Informal Entries & Aggregated records 0.0% 0.0% 0.0% Mexican Tariff 1.6% 0.1% 0.0% Mexican-United States Tariff 0.3% 0.0% 0.0% United States Tariff 0.0% 0.0% 0.0% MFN 4.4% 3.5% 3.1%
Note: Excludes chapter 99. Trade-weighted average based on total imports.
Source: Finance Canada data, author’s calculations

24
Table 8. Average tariff margins by HS chapter and treatment (2003)*
HS chapter All three CARIBCAN GPT LDCT HS chapter All three CARIBCAN GPT LDCT
01 Live animals 0.0% 0.0% 52 Cotton. 3.2% 1.0% 12.0%
02 Meat and edible meat offal 0.4% 0.4% 53 Other vegetable textile fibres; pap 1.2% 1.2% 1.5%
03 Fish & crustacean, mollusc & other 0.2% 1.7% 0.0% 3.0% 54 Man-made filaments. 1.4% 1.4%
04 Dairy prod; birds' eggs; natural ho 1.8% 0.0% 1.8% 55 Man-made staple fibres. 1.2% 0.6% 15.0%
05 Products of animal origin, nes or 0.0% 0.0% 56 Wadding, felt & nonwoven; yarns; tw 1.3% 1.1% 7.5%
06 Live tree & other plant; bulb, root 2.1% 4.5% 2.0% 0.0% 57 Carpets and other textile floor co 6.1% 5.9% 10.9%
07 Edible vegetables and certain roots 0.7% 0.0% 0.7% 5.2% 58 Special woven fab; tufted tex fab; 3.0% 2.4% 10.4%
08 Edible fruit and nuts; peel of citr 0.1% 0.3% 0.1% 0.0% 59 Impregnated, coated, cover/laminate 3.5% 3.4% 14.5%
09 Coffee, tea, matn and spices. 1.0% 0.8% 1.1% 0.7% 60 Knitted or crocheted fabrics. 4.3% 2.4% 15.0%
10 Cereals 0.0% 0.0% 0.0% 0.0% 61 Art of apparel & clothing access, 12.2% 2.1% 18.4%
11 Prod.mill.indust; malt; starches; 1.6% 1.5% 1.6% 2.0% 62 Art of apparel & clothing access, n 13.0% 3.9% 17.5%
12 Oil seed, oleagi fruits; miscell gr 0.2% 0.0% 0.2% 0.0% 63 Other made up textile articles; set 9.2% 5.8% 16.8%
13 Lac; gums, resins & other vegetable 0.0% 0.0% 0.0% 64 Footwear, gaiters and the like; par 8.4% 6.7% 17.6%
14 Vegetable plaiting materials; veget 0.0% 0.0% 0.0% 65 Headgear and parts thereof. 2.7% 1.8% 8.7%
15 Animal/veg fats & oils & their clea 5.0% 7.1% 4.8% 66 Umbrellas, walking-sticks, seat-sti 1.6% 1.6%
16 Prep of meat, fish or crustaceans, 1.1% 3.7% 1.1% 67 Prepr feathers & down; arti flower; 7.0% 7.0% 5.0%
17 Sugars and sugar confectionery. 3.6% 7.9% 3.4% 68 Art of stone, plaster, cement, asbe 3.5% 3.5% 5.0%
18 Cocoa and cocoa preparations. 2.3% 6.0% 2.3% 69 Ceramic products. 5.0% 4.9% 6.8%
19 Prep.of cereal, flour, starch/milk; 1.4% 3.6% 1.3% 5.0% 70 Glass and glassware. 0.7% 0.6% 3.6%
20 Prep of vegetable, fruit, nuts or o 1.6% 4.8% 1.2% 4.0% 71 Natural/cultured pearls, prec stone 2.6% 2.3% 7.5%
21 Miscellaneous edible preparations. 3.5% 7.2% 3.0% 10.5% 72 Iron and steel. 0.5% 0.0% 0.5% 0.0%
22 Beverages, spirits and vinegar. 4.7% 8.0% 4.4% 73 Articles of iron or steel. 2.0% 6.7% 1.9% 4.8%
23 Residues & waste from the food indu 1.2% 0.0% 1.2% 74 Copper and articles thereof. 2.5% 2.5% 3.0%
24 Tobacco and manufactured tobacco su 6.2% 6.0% 12.5% 75 Nickel and articles thereof. 2.3% 2.3%
25 Salt; sulphur; earth & ston; plaste 0.6% 0.6% 2.5% 76 Aluminium and articles thereof. 2.2% 6.5% 2.1% 6.5%
26 Ores, slag and ash. 0.0% 0.0% 0.0% 78 Lead and articles thereof. 2.8% 2.8%
27 Mineral fuels, oils & product of th 3.8% 3.8% 79 Zinc and articles thereof. 0.6% 0.6%
28 Inorgn chem; compds of prec mtl, r 1.2% 1.2% 3.5% 80 Tin and articles thereof. 2.6% 2.6%
29 Organic chemicals. 2.4% 5.5% 2.4% 81 Other base metals; cermets; article 1.5% 1.5%
30 Pharmaceutical products. 0.2% 0.0% 0.2% 82 Tool, implement, cutlery, spoon & f 2.7% 7.0% 2.6% 8.9%

25
HS chapter All three CARIBCAN GPT LDCT HS chapter All three CARIBCAN GPT LDCT
31 Fertilisers. 0.0% 0.0% 83 Miscellaneous articles of base meta 2.1% 2.1% 6.4%
32 Tanning/dyeing extract; tannins & 3.0% 3.0% 0.0% 84 Nuclear reactors, boilers, mchy & m 1.5% 1.5%
33 Essential oils & resinoids; perf, 3.8% 3.8% 3.8% 6.4% 85 Electrical mchy equip parts thereof 2.0% 4.1% 1.9% 3.8%
34 Soap, organic surface-active agents 3.8% 6.5% 3.7% 6.5% 86 Railw/tramw locom, rolling-stock & 3.2% 3.2%
35 Albuminoidal subs; modified starche 3.2% 3.2% 87 Vehicles o/t railw/tramw roll-stock 0.6% 0.6%
36 Explosives; pyrotechnic prod; match 4.9% 4.8% 6.5% 88 Aircraft, spacecraft, and parts the 0.6% 0.6%
37 Photographic or cinematographic goo 5.2% 5.2% 89 Ships, boats and floating structure 4.0% 4.0%
38 Miscellaneous chemical products. 2.5% 2.5% 90 Optical, photo, cine, meas, checkin 1.6% 1.6% 1.5%
39 Plastics and articles thereof. 3.3% 7.0% 3.2% 7.1% 91 Clocks and watches and parts thereo 2.6% 2.6% 0.0%
40 Rubber and articles thereof. 2.2% 2.2% 92 Musical instruments; parts and acce 2.0% 2.0% 2.0%
41 Raw hides and skins (other than fu 2.4% 2.4% 2.5% 93 Arms and ammunition; parts and acc 4.5% 4.5%
42 Articles of leather; saddlery/harne 3.5% 3.1% 8.0% 94 Furniture; bedding, mattress, matt 2.4% 8.3% 2.2% 8.9%
43 Furskins and artificial fur; manuf 3.0% 3.0% 95 Toys, games & sports requisites; pa 1.2% 1.2% 0.0%
44 Wood and articles of wood; wood ch 3.0% 3.0% 2.9% 6.3% 96 Miscellaneous manufactured articles 2.9% 4.5% 2.8% 7.0%
45 Cork and articles of cork. 0.0% 0.0% 97 Works of art, collectors' pieces an 1.5% 1.5% 0.0%
46 Manufactures of straw, esparto/othe 3.5% 3.2% 6.5%
47 Pulp of wood/of other fibrous cellu 0.0% 0.0%
48 Paper & paperboard; art of paper pu 0.0% 0.0% 0.0%
49 Printed books, newspapers, pictures 0.2% 0.8% 0.2% 0.0%
50 Silk. 0.0% 0.0% 0.0%
51 Wool, fine/coarse animal hair, hors 3.3% 3.3%
Source: Finance Canada data, author’s calculations
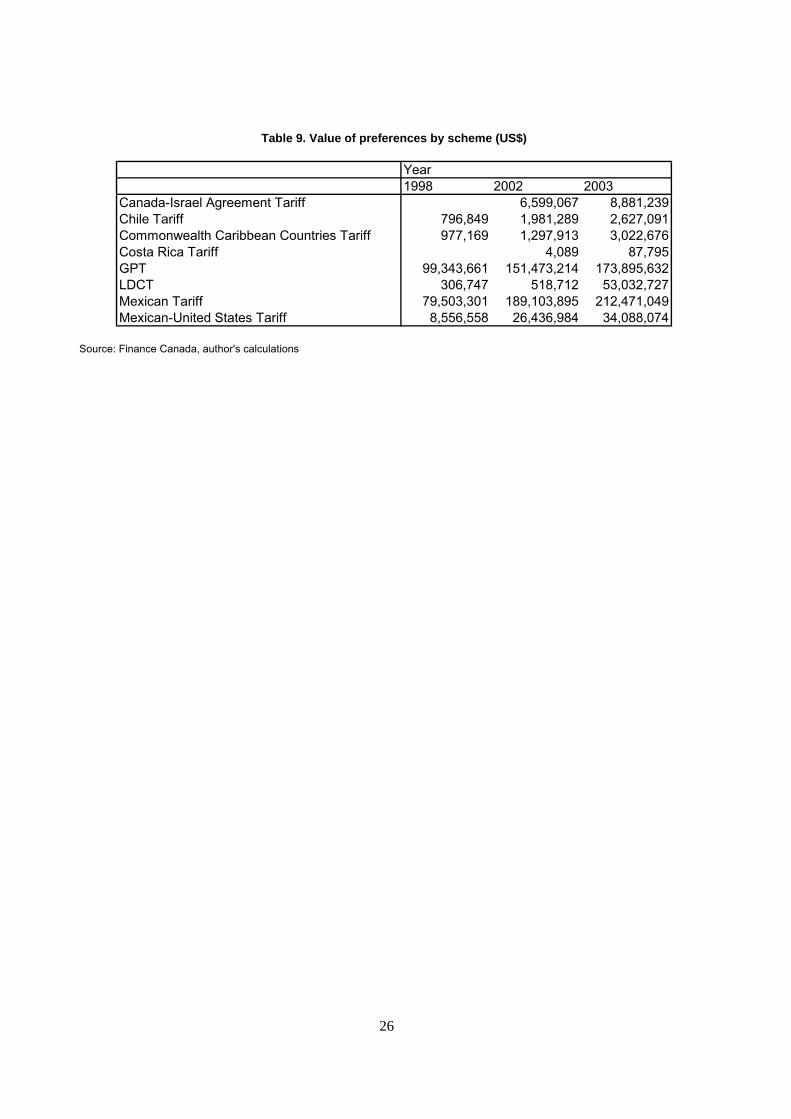
Table 9. Value of preferences by scheme (US$)
Year1998 2002 2003
Canada-Israel Agreement Tariff 6,599,067 8,881,239Chile Tariff 796,849 1,981,289 2,627,091Commonwealth Caribbean Countries Tariff 977,169 1,297,913 3,022,676Costa Rica Tariff 4,089 87,795GPT 99,343,661 151,473,214 173,895,632LDCT 306,747 518,712 53,032,727Mexican Tariff 79,503,301 189,103,895 212,471,049Mexican-United States Tariff 8,556,558 26,436,984 34,088,074
Source: Finance Canada, author's calculations
26

Table 10. LDCT tariff lines accounting for at least 1 US$ million in terms of preference value (2003)
Tariff item Country Name Value of preferences*
As share in beneficiary's exports Tariff item Country Name
Value of preferences*
As share in beneficiary's exports
62046200 Bangladesh 5,915,094 0.08% 61142000 Bangladesh 1,182,601 0.02% Cambodia 2,096,481 0.09% Cambodia 572,457 0.03% Laos P. Dem. Rep. 3,340 0.00% Laos P. Dem. Rep. 23,468 0.01% Lesotho 115,365 0.03% Lesotho 69,416 0.02% Madagascar 114,307 0.01% Madagascar 18,415 0.00% Malawi 54,474 0.01% Nepal 11,769 0.00%
Maldives 302,259 0.15% Total/average 1,878,127 0.01%
Nepal 43,689 0.01% 62034300 Bangladesh 1,215,973 0.02% Niger 29 0.00% Cambodia 48,997 0.00%
Total/average 8,645,037 0.04% Nepal 26,386 0.00%
62034200 Bangladesh 4,503,235 0.06% Total/average 1,291,356 0.01%
Cambodia 992,762 0.04% 63062200 Bangladesh 1,214,958 0.02%
Laos P. Dem. Rep. 366,953 0.12% Total/average 1,214,958 0.02%
Lesotho 179,374 0.04% 61082100 Bangladesh 1,150,011 0.01% Madagascar 28,446 0.00% Cambodia 16,703 0.00% Maldives 46,127 0.02% Madagascar 1,343 0.00%
Nepal 38,815 0.01% Total/average 1,168,057 0.01%
Total/average 6,155,711 0.04% 62019300 Bangladesh 948,762 0.01%
61091000 Bangladesh 3,362,902 0.04% Cambodia 170,286 0.01%
Cambodia 138,571 0.01% Total/average 1,119,048 0.01%
Haiti 552,036 0.15% 61051000 Bangladesh 721,544 0.01% Laos P. Dem. Rep. 61,916 0.02% Cambodia 161,694 0.01% Lesotho 43,314 0.01% Laos P. Dem. Rep. 89,300 0.03% Madagascar 21,308 0.00% Lesotho 22,749 0.01% Maldives 17,362 0.01% Maldives 29,514 0.01% Nepal 33,455 0.01% Nepal 23,834 0.00%
Niger 21 0.00% Total/average 1,048,635 0.01%
Total/average 4,230,885 0.03% 62052000 Bangladesh 891,061 0.01%
61103000 Bangladesh 3,001,476 0.04% Cambodia 147,671 0.01% Cambodia 187,092 0.01% Madagascar 4,378 0.00% Laos P. Dem. Rep. 12,951 0.00% Nepal 3,592 0.00% Lesotho 1,639 0.00% Niger 38 0.00%
Madagascar 7,132 0.00% Total/average 1,046,740 0.00%
Nepal 502 0.00% 62045200 Bangladesh 555,095 0.01%
Total/average 3,210,792 0.01% Cambodia 347,958 0.02%
61102000 Bangladesh 1,903,795 0.02% Laos P. Dem. Rep. 154 0.00% Cambodia 803,314 0.04% Madagascar 2,844 0.00% Haiti 42,083 0.01% Maldives 17,147 0.01% Laos P. Dem. Rep. 29,274 0.01% Nepal 6,452 0.00% Lesotho 228,425 0.05% Niger 42 0.00%
Madagascar 95,390 0.01% Total/average 929,691 0.00%
Nepal 55,629 0.01%
Total/average 3,157,908 0.02%
Source: Finance Canada data, author’s calculations
27
28
Table 11. GPT tariff lines accounting for at least 1 US$ million in terms of preference value (2003)
Tariff item Value of preferences*
Number of GPT countries with positive value of preferences
China's share in value of preferences
Average share in beneficiary's exports
94036010 5,099,196 42 45% 0.000% 42031000 4,390,024 18 75% 0.000% 69089010 3,938,421 22 2% 0.000% 39269090 3,488,955 39 87% 0.000% 94032000 3,104,124 34 93% 0.000% 85281293 3,027,344 6 23% 0.000% 94016110 2,919,286 32 56% 0.000% 16041490 2,590,567 12 0% 0.001% 69120090 2,575,756 39 78% 0.000% 42032990 2,330,979 16 91% 0.000% 87120000 2,320,666 9 69% 0.000% 69111090 2,225,484 30 74% 0.000% 94017910 2,005,264 18 97% 0.000% 94035000 1,965,864 37 45% 0.000% 39241000 1,905,831 28 82% 0.000% 39249000 1,859,100 30 89% 0.000% 94051000 1,683,021 24 98% 0.000% 42029290 1,628,602 28 92% 0.000% 57011090 1,626,246 15 4% 0.001% 85091000 1,614,516 5 78% 0.000% 73269090 1,591,589 32 91% 0.000% 39231090 1,417,987 26 93% 0.000% 85281291 1,394,615 4 5% 0.000% 42022290 1,235,144 24 98% 0.000% 94054090 1,200,112 20 91% 0.000% 44111990 1,157,916 6 29% 0.000% 44219090 1,152,348 40 85% 0.000% 95069990 1,122,918 17 92% 0.000% 63014000 1,118,307 14 63% 0.000% 65059020 1,095,529 31 85% 0.000% 73239300 1,084,235 25 75% 0.000% 17049090 1,038,221 44 25% 0.000%
Source: Finance Canada data, author’s calculations

29
Table 12. Comparison of welfare results of the removal of Canadian preferences and multilateral 50% reduction of tariffs
Per capita utility Equivalent variation US$ million
Removal of Canadian
preferences 50% liberalistion by
all regions 50% liberalisation
by Canada
removal of Canadian
preferences 50% liberalistion by
all regions 50% liberalisation
by Canada
Rest of Oceania 0.02 0.81 0.05 9.76 463.9 28.24 Australia 0.00 0.11 0.00 8.73 336.24 7.62 China 0.01 0.36 0.01 122.47 3729.3 90.51 North/East Asia 0.02 0.92 0.01 150.49 7406.6 80.81 Japan 0.01 0.32 0.00 292.27 11485.46 120.83 Indonesia 0.01 0.31 0.00 6.13 413.19 2.11 Malaysia 0.00 1.64 0.00 1.09 1273.12 -2.88 Philippines 0.00 0.1 0.00 2.61 62.85 1.31 Singapore 0.01 0.68 0.00 7.41 507.53 1.59 Thailand 0.00 1.07 0.00 -2.54 1063.63 -0.54 Vietnam 0.02 2.64 0.02 6.78 770.67 4.92 Rest of the World 0.00 0.14 0.00 26.89 1066.37 13.32 Bangladesh 0.02 0.26 0.01 7.72 110.78 6.28 India 0.01 0.44 0.00 27.28 1915.73 19.45 Sri Lanka 0.02 1.26 0.02 2.44 178.76 2.27 Canada 0.05 0.02 0.08 339.81 133.89 484.31 United States -0.01 -0.01 0.00 -1173.43 -667.55 -158.69 Mexico -0.01 0.1 -0.01 -25.91 551.23 -31.83 Rest of North America -0.06 -6.09 -0.03 -1.7 -165.63 -0.73 Colombia 0.00 -0.2 0.00 0.06 -152.65 -1.26 Peru 0.04 0.06 0.01 18.85 29.62 4.73 Venezuela 0.00 0.1 0.00 1.43 105.57 -1.92 Argentina 0.00 0.13 0.00 7.14 319.59 1.74 Brazil 0.01 0.26 0.00 21.29 1135.55 6.13 Chile 0.00 0.07 0.00 -1.87 41.14 -1.52 Uruguay 0.04 0.26 0.04 6.05 45.8 6.24 EU 0.01 0.12 0.00 477.47 8992.83 171.17 Rest of Europe 0.00 0.16 0.00 0.95 638.82 2.75

30
Per capita utility Equivalent variation US$ million
Removal of Canadian
preferences 50% liberalistion by
all regions 50% liberalisation
by Canada
removal of Canadian
preferences 50% liberalistion by
all regions 50% liberalisation
by Canada
Turkey 0.01 0.46 0.00 6.44 610.12 3.7 Rest of Middle East and North Africa 0.00 0.31 0.00 -7.24 2314.03 -20.95 Morocco 0.00 0.64 0.00 0.69 196.68 0.75 Tunisia 0.00 1.5 0.00 0.6 261.27 0.46 Botswana 0.01 0.58 0.00 0.38 27.11 0.17 South Africa 0.00 0.32 0.00 -0.73 311.25 -1.71 Rest of SACU 0.02 1.8 0.01 0.71 80.44 0.49 Malawi -0.01 1.43 -0.01 -0.08 22.26 -0.08 Mozambique 0.01 -0.22 0.00 0.15 -7.13 0.07 Tanzania 0.00 -0.29 0.00 -0.19 -25.38 -0.13 Zambia 0.01 0.09 0.00 0.17 2.78 0.08 Zimbabwe 0.00 0.65 0.00 0.1 51.67 0.04 Rest of SADC 0.00 1.21 0.00 0.04 204.9 -0.74 Madagascar 0.00 -0.14 0.00 0.01 -5.87 -0.03 Uganda 0.00 -0.29 0.00 -0.11 -15.38 -0.07 Rest of Sub-Saharan -0.01 -0.16 -0.01 -5.72 -199.3 -6.68
Source: GTAP model simulations and GTAP 6 database; author’s calculation