how preferential is the preferential encoding of
TRANSCRIPT
Journal of Anxiety Disorders 22 (2008) 655–670
How preferential is the preferential encoding of
threatening stimuli?
Working memory biases in specific anxiety
and the Attentional Blink
Andrea Reinecke a,*, Mike Rinck b, Eni S. Becker b
a Dresden University of Technology, Germanyb Radboud University Nijmegen, The Netherlands
Received 22 January 2007; received in revised form 11 June 2007; accepted 15 June 2007
Abstract
Temporal visual working memory (VWM) biases in spider anxiety were studied with an Attentional Blink paradigm. In
Experiment 1, participants viewed pictures sequentially presented at rates of 80 ms and were instructed to memorize two target
pictures. We varied time between targets and valence of the second target (neutral: mushroom, positive: blossom, negative: spider).
In Experiment 2, spider fearfuls and non-anxious controls (both without snake anxiety) participated. Here we tested two negative
targets: disorder-related spiders and disorder-irrelevant snakes. Both positive and negative items were memorized more successfully
than neutral targets. Spiders were preferentially recalled by spider fearfuls compared to non-anxious controls, implying temporal
VWM biases in spider anxiety. This advantage for threat was not related to a disruption of the encoding of non-threatening targets
presented before the threat item.
# 2007 Elsevier Ltd. All rights reserved.
Keywords: Attention; Working memory; Fear of spiders; Phobia; RSVP; Attentional blink
Specific phobias belong to the most common mental
disorders (e.g., ESEMed Investigators, 2004) with a
lifetime prevalence of 8–12% (Kessler, Chiu, Demler, &
Walters, 2005; Magee, Eaton, Wittchen, McGonagle, &
Kessler, 1996) to 25.6% (Regier, Rae, Narrow, Kaelber,
& Schatzberg, 1998). Impairments in everyday life
caused by these disorders can be far reaching (Wittchen,
Nelson, & Lachner, 1998). Cognitive models of anxiety
(e.g., Beck, Emery, & Greenberg, 1985; Clark & Wells,
* Corresponding author at: University of Oxford, Department of
Psychiatry, Warneford Hospital, Oxford OX3 7JX, UK.
E-mail address: [email protected] (A. Reinecke).
0887-6185/$ – see front matter # 2007 Elsevier Ltd. All rights reserved.
doi:10.1016/j.janxdis.2007.06.004
1995; Williams, Watts, MacLeod, & Mathews, 1997)
postulate that disorder-specific biases in information
processing are relevant for the etiology and maintenance
of these disorders. Accordingly, a phobic seems to pay
more attention to feared aspects of the environment (e.g.,
to spiders and spider webs). Phobics are more likely to
notice feared stimuli, supporting their impression of a
dangerous world, confirming their dysfunctional beliefs
and resulting in increased checking behavior. In a spider
phobic’s world, it seems as if there are more spiders,
enforcing their avoidance behaviors and thus the anxiety
disorder is maintained.
Ample evidence exists in specific phobia that
affected individuals show attentional biases for feared
A. Reinecke et al. / Journal of Anxiety Disorders 22 (2008) 655–670656
stimuli (for reviews, see Mathews & MacLeod, 2005;
Williams et al., 1997), implying a fast and automatic shift
of attention to threat items and therefore greater
distractibility from other stimuli when threat is present.
Empirical support for memory biases in specific phobia is
less clear; some studies report memory biases, some do
not (for a review, see Williams et al., 1997). One possible
explanation for the strong evidence of attentional biases
and weak evidence of memory biases, is found in the
vigilance-avoidance theory (Williams et al., 1997). It
implies a rapid switch of attention towards threatening
stimuli, but avoidance of deeper elaboration on the feared
materials. But exactly what is ‘‘deeper elaboration’’?
Does it start in visual working memory (VWM)? This
question is difficult to answer, as there seems to be a
missing link in research on cognitive biases in specific
phobia, namely the attentional bottleneck and VWM.
In an earlier study of visual working memory biases
in anxiety disorders, we observed enhanced VWM for
spider images in spider fearfuls compared to non-
anxious controls in a spatial cueing paradigm (Rein-
ecke, Rinck, & Becker, 2006). The results of this study
imply that the avoidance of deeper elaboration on
threatening materials (Williams et al., 1997) does not
start in working memory. Moreover, the results suggest
that the basis for disorder-specific VWM biases must be
a preferential and very quick automatic encoding of
spider items into VWM.
However, this previous study assessed only the spatial
aspects of working memory biases, as the threatening
image was presented among several non-threatening
pictures. Specific details of this fast, automatic encoding
process remain unexplained. Exactly how circumscribed
is the preferential selection of threat items? Does it occur
at the expense of other stimuli undergoing the capacity-
limited encoding process? That is, would the presentation
of a spider item interrupt the ongoing encoding of other
items in the processing channel? Would it cause
premature drop-out, resulting in incomplete processing
of other items? To answer these questions, a paradigm
with a high temporal, rather than spatial resolution was
required. Such a task, addressing the consolidation of
items, would allow for the investigation of temporal
working memory biases in specific anxiety.
Fortunately such a task exists, namely the Attentional
Blink (AB) paradigm. In an AB task, participants are
asked to attend to a series of rapidly presented stimuli (i.e.
letters, words, or pictures) and to focus on two targets (T1
and T2) defined by unique visual features (i.e. color, size,
or category; Broadbent & Broadbent, 1987; Intraub,
1985; Kanwisher, 1987; Weichselgartner & Sperling,
1987), while the time between these two targets is varied.
For instance, Shapiro, Raymond, and Arnell (1994) asked
their participants to attend to a stream of black letters,
identify the first target (indicated by a white color) and
determine whether a second target (a black ‘‘X’’), was
present. For a wide variety of emotionally neutral
materials, observers showed reduced report accuracy for
the second target when it was preceded by another
attended target within a temporal distance of 100–400 ms
(e.g., Broadbent & Broadbent, 1987; Raymond, Shapiro,
& Arnell, 1992; Reeves & Sperling, 1986). This
phenomenon of impaired information processing is
called the Attentional Blink. Most authors investigating
the AB hold post-perceptual processes such as working
memory consolidation responsible for the performance
decrease (e.g., Chun, 1997; Chun & Potter, 1995;
Jolicoeur & Dell’Acqua, 2000; Olson, Chun, &
Anderson, 2001; Vogel, Luck, & Shapiro, 1998). The
two-stage model proposed by Chun and Potter (1995)
assumes that the AB phenomenon traces back to capacity
limitations at the second of two processing stages
required for correct target report, namely, working
memory consolidation. Following this model, a very
broad but rough representation is built at the first stage,
allowing the detection of target-defining features. Only at
the second stage of information processing is a more
durable and valid object representation created, involving
consolidation into working memory allowing full
identification of the object, which is a prerequisite for
correct report. However, this stage operates rather slowly
and serially: only after the first target has completely
passed through this phase can the next target enter. As this
second phase lasts longer than the presentation of items
within the rapid serial string, subsequent items can enter
the first, but not the second stage before processing is
complete. The longer the second item must be preserved
in the first stage, the higher the probability of losing its
representation, causing lower report rates of T2 items if
they appear within the temporal frame of stage two
processing of T1 (see Potter, Staub, & O’Connor, 2002;
Raymond, 2003; Zuvic, Visser, & DiLollo, 2000). This
model is further supported by electrophysiological data
(Luck, Vogel, & Shapiro, 1996; Vogel & Luck, 2002;
Vogel et al., 1998).
The AB paradigm is useful for the study of cognitive
biases in specific phobia because it allows us to answer
the following questions: When we present individually
threatening stimuli – what information is preferentially
selected for processing at a higher level? Does the general
rule ‘‘first in, first out’’ apply – implying that the first T1
item to enter stage 2 is completely processed before a
subsequent T2 item can enter? Or can incoming
threatening stimuli disrupt ongoing processing? Thus
A. Reinecke et al. / Journal of Anxiety Disorders 22 (2008) 655–670 657
far, only a few studies have addressed the characteristics
of the AB phenomenon with emotional materials. Smith,
Most, Newsome, and Zald (2006), for instance, reported
decreased report probability for neutral T2 pictures when
these were preceded by aversively conditioned (but
originally neutral) photographs. Manipulating T1 as
either neutral or emotional, Arend and Botella (2002)
compared the AB magnitude in low versus high-trait
anxious participants. In contrast to Smith et al. (2006),
they observed reductions in AB effect for emotional
words in high-trait anxious only, indicating disorder-
specific influence on the AB effect. However, in both of
these studies, the valence of the first target was varied,
which means that the duration of consolidation for
emotional materials and subsequent encoding of neutral
materials was investigated. Thus, these studies addressed
whether the second stage as described by Chun and Potter
(1995) is faster or slower for emotional materials, but not
whether disorder-specific emotionality can affect general
laws like ‘‘first in, first out’’. Keil and Ihssen (2004)
investigated the AB phenomenon with neutral, pleasant,
and unpleasant T2 verbs in rapid serial visual streams.
Participants were asked to select the two green-colored
target words from a string of otherwise white-printed
distractors. With shorter T1–T2 distance, the accuracy in
reporting T2 was reduced, which is the Attentional Blink
phenomenon. Enhanced report rates for T2 (a reduction
of the AB) were observed for all T2 that were rated as
emotionally salient and highly arousing. The authors
concluded that ‘‘affectively arousing information is
selected preferentially from a temporal stream, facilitat-
ing processes such as working memory consolidation and
action’’. Similar results were reported by Anderson
(2005). While Keil and Ihssen (2004) found no influence
of T2 valence on T1 report accuracy, Anderson (2005)
found some evidence that negative, arousing T2 stimuli
affect T1 performance.
However, neither study investigated whether indivi-
dual differences in T2 salience were related to report
probability of T1. When, for instance, the negative T2
stimulus depicts a spider – is the subsequent AB
reduction related to the participant’s anxiety for spiders?
Or, in other words, when the AB mirrors the loss of
information at a post-perceptual stage – does individual
threat positively influence the preservation of informa-
tion? To the best of our knowledge, only two studies have
investigated the AB magnitude in relation to anxiety for
T2 stimuli (de Jong & Martens, 2007; Fox, Russo, &
Georgiou, 2005). While Fox et al. (2005) found no effects
of facial T2 valence on T1 report accuracy in highly trait
anxious individuals, de Jong and Martens (2007) reported
reduced T1 report accuracy with angry T2 faces in both
high and low socially anxious participants. The
differences in these two studies regarding T1 effects
so far allow no conclusions whether increased response
rates for negative T2 are truly related to prioritized VWM
consolidation at the expense of T1 or not. These
differences might be related to very small sample sizes
in both studies resulting in a general lack of power and,
thus, a lack of group differences in de Jong and Martens’
(2007) study. Moreover, neither study included neutral
targets. Therefore, it is not clear whether an angry T2 is
preferentially encoded at the cost of T1, or whether a
positive T2 is less efficiently encoded in favor of T1.
In the present study, we attempted to overcome these
limitations by testing a larger sample and by including a
neutral T2 category. Only when biases occur exclusively
in the presence of disorder-specific materials should they
be considered relevant in the genesis and maintenance of
the affliction. We investigated an anxiety disorder that
has, thus far, not been investigated with an AB paradigm,
namely, spider phobia. Here, the scope of fear is clearly
limited to spiders. Thus, the selection of anxiety-specific
materials is easy. In two AB experiments, participants
were instructed to attentively follow a string of pictures
and then report the two target items indicated by a brighter
background. In Experiment 1, participants with varying
levels of spider anxiety viewed rapid serial presentations
of 15 mostly neutral images. The valence of the second
target (T2) was varied, depicting either a neutral
(mushroom), positive (blossom), or a negative image
(spider). Additionally, the time between the two targets
(T1 and T2) was varied in order to get information about
the onset and duration of the AB under different valence
conditions. We were interested in whether there was
enhanced report for negative T2 and whether this
advantage was related to the individual’s spider anxiety.
Furthermore, we were interested in T1 report deficiencies
when negative T2 images were presented. In Experiment
2, we repeated the same paradigm, while modifying T2
type and participant characteristics: in addition to the
negative ‘‘spider’’ stimulus, we presented pictures of
snakes. Observers were either spider fearful or non-spider
anxious, both without snake anxiety. This experimental
design allows for conclusions regarding disorder-specific
biases in the temporal processing of spiders and whether
these effects appear only with spiders or also with other
negative materials unrelated to the disorder.
1. Experiment 1: the Attentional Blink foremotional pictures in a random sample
In an AB task, the probability of reporting the second
of two targets is reduced when it appears approximately
A. Reinecke et al. / Journal of Anxiety Disorders 22 (2008) 655–670658
1 Twenty individuals who did not participate in the experiments
reported here rated a sample of 200 pictures. The sample included
several variations of diverse potential T2 images (spiders, snakes,
blossoms, wheels, mushrooms, fruit), several kitchen and non-kitchen
items, and many additional images of varying appearance and
valence. Each item was judged on 9-point scales regarding valence
(from 1 very pleasant to 9 very unpleasant) and recognizability (from
1 very good to 9 very bad). Additionally, each item was classified as
‘‘definitely kitchen item’’ versus ‘‘definitely no kitchen item’’. Only
images with mean recognizability ratings of 3 or less were used.
100–500 ms after the first. This has previously been
explained by capacity limitations at the stage of working
memory consolidation. However, research on attentional
biases in specific phobia suggests that emotionally
relevant stimuli are processed preferentially, presumably
automatically (e.g., Williams, Mathews, & MacLeod,
1996). For evolutionary relevant materials, such as
spiders or snakes, this effect occurs in all people, but is
particularly strong for those who are afraid of the
employed stimulus (e.g., Oehman, Flykt, & Esteves,
2001). The current study was designed to investigate
whether such a bias occurs in an Attentional Blink
paradigm. We sought to answer the following questions:
(A) Is the Attentional Blink reduced in amplitude and
duration when T2 depicts a spider compared to neutral or
positive images? (B) If spider T2 images lead to reduced
AB, is this reduction related to the individual’s spider
anxiety? (C) Does the presentation of spider T2 images
influence the report accuracy for T1 in comparison to
neutral and positive T2? For instance, does a spider image
disrupt the rule ‘‘first in, first out’’such that it is preferably
processed at the expense of T1? (D) Is a lower T1
memorization after presentation of a spider T2 related to
higher spider anxiety?
1.1. Methods
1.1.1. Participants
Prior to the experimental sessions, interested students
from several departments at Dresden University of
Technology were asked to enlist their name and phone
number. From these lists, 60 randomly chosen people
were called and invited for testing. According to Cohen
(1988), this sample size allows for the detection of
medium-sized differences between means with a prob-
ability of 1 � b = .86, and for the detection of medium-
sized correlations with probability of 1 � b = .76 (see
Cohen, 1988, p. 31 and 87, respectively). To ensure that
none of the participants had an aversion for neutral or
positive T2 stimuli, we asked if they had any allergies or
general antipathy for flowers or mushrooms; no
participants were excluded for this reason. All candidates
had high school degrees and were students of Dresden
University of Technology. On average, the 51 women and
9 men were 20.9 years of age (S.D. = 2.3), all were
without history of psychiatric disorder and had normal or
corrected-to-normal vision. All volunteers were
informed of their rights as experimental participants
and gave their consent to participate in the study. In return
for their participation, they received either course credit
or a payment of s5. Participants with pronounced spider
anxiety were told about behavioral therapy as a treatment
option, and were given contact information of the
outpatient university clinic.
1.1.2. Materials and apparatus
The experiment was controlled by MATLAB software
using the Psychophysics Toolbox extensions (Brainard,
1997; Pelli, 1997). Stimuli were presented on a gray
background on 17 in. monitors with a resolution of
1024 � 768 pixels. Responses were recorded via button
press. The displayed elements included 84 square
(115 � 115 pixel) color images, made up of 40 neutral
distractors, 32 neutral T1 (16 kitchen, 16 non-kitchen), 4
neutral T2 (mushrooms), 4 pleasant T2 (blossoms), and 4
unpleasant T2 items (spiders).
Pictures were chosen after extensive pretesting.1 For
the T1 sample, only neutral pictures having valence
ratings not significantly different from the neutral mean
(5.0) on the rating scale were employed. These were
further divided into 16 ‘‘kitchen items’’ and 16 ‘‘non-
kitchen items’’ based on agreement of at least 90% of
the raters (most were classified with agreement of 95–
100%). For the T2 sample, four mushroom images with
neutral valence ratings, four blossom pictures with
positive, and four spider items with negative valence
ratings were selected. As distractors, 40 images with
neutral valence that did not match any of the T2
categories were chosen (for example, see Fig. 1A).
1.1.3. Procedure
Prior to the experimental session, participants were
informed about the general experimental procedure and
filled out the ‘‘Spider Anxiety Screening’’ form (SAS,
Rinck et al., 2002) and the Germanversion of the ‘‘Fear of
Spiders Questionnaire’’ (FSQ; Szymanski & O’Dono-
hue, 1995; see Rinck et al., 2002). They were then given
written instructions on the computer monitor instructing
them to attend to the presented picture string and prepare
for a memory test where they wouldmakedecisions about
the two target items indicated by a bright-gray back-
ground. The importance of accuracy was emphasized.
Additionally, participants viewed a schema of a sample
A. Reinecke et al. / Journal of Anxiety Disorders 22 (2008) 655–670 659
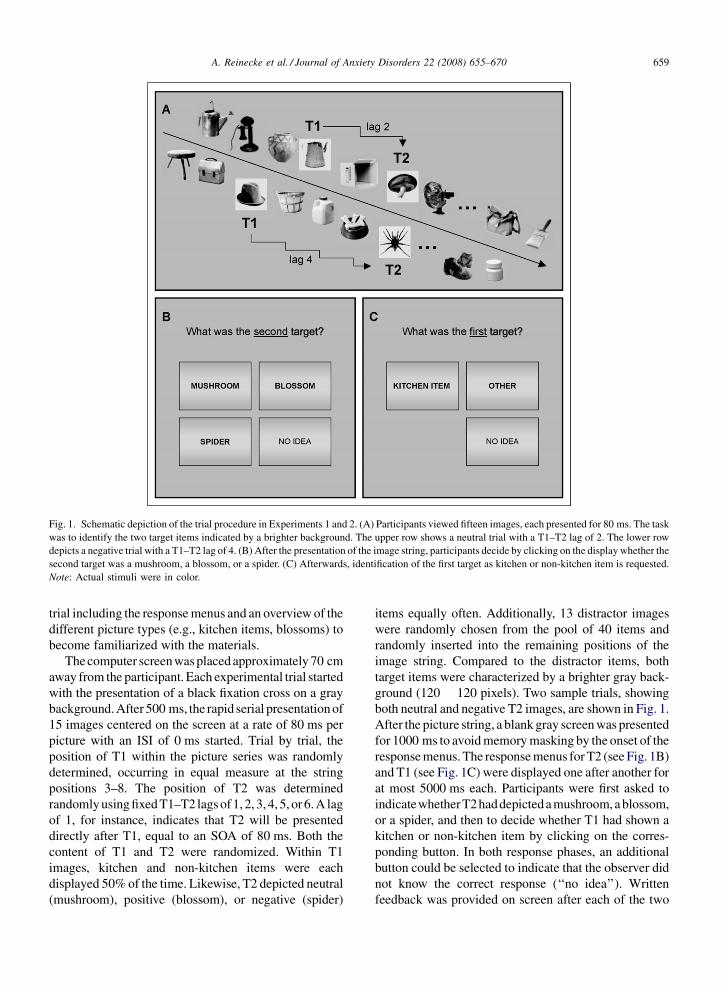
Fig. 1. Schematic depiction of the trial procedure in Experiments 1 and 2. (A) Participants viewed fifteen images, each presented for 80 ms. The task
was to identify the two target items indicated by a brighter background. The upper row shows a neutral trial with a T1–T2 lag of 2. The lower row
depicts a negative trial with a T1–T2 lag of 4. (B) After the presentation of the image string, participants decide by clicking on the display whether the
second target was a mushroom, a blossom, or a spider. (C) Afterwards, identification of the first target as kitchen or non-kitchen item is requested.
Note: Actual stimuli were in color.
trial including the response menus and an overview of the
different picture types (e.g., kitchen items, blossoms) to
become familiarized with the materials.
Thecomputer screen was placed approximately 70 cm
away from the participant. Each experimental trial started
with the presentation of a black fixation cross on a gray
background. After 500 ms, the rapid serial presentation of
15 images centered on the screen at a rate of 80 ms per
picture with an ISI of 0 ms started. Trial by trial, the
position of T1 within the picture series was randomly
determined, occurring in equal measure at the string
positions 3–8. The position of T2 was determined
randomly using fixed T1–T2 lags of 1, 2, 3, 4, 5, or 6. A lag
of 1, for instance, indicates that T2 will be presented
directly after T1, equal to an SOA of 80 ms. Both the
content of T1 and T2 were randomized. Within T1
images, kitchen and non-kitchen items were each
displayed 50% of the time. Likewise, T2 depicted neutral
(mushroom), positive (blossom), or negative (spider)
items equally often. Additionally, 13 distractor images
were randomly chosen from the pool of 40 items and
randomly inserted into the remaining positions of the
image string. Compared to the distractor items, both
target items were characterized by a brighter gray back-
ground (120 � 120 pixels). Two sample trials, showing
both neutral and negative T2 images, are shown in Fig. 1.
After the picture string, a blank gray screen was presented
for 1000 ms to avoid memory masking by the onset of the
response menus. The response menus for T2 (see Fig. 1B)
and T1 (see Fig. 1C) were displayed one after another for
at most 5000 ms each. Participants were first asked to
indicatewhetherT2haddepicteda mushroom, a blossom,
or a spider, and then to decide whether T1 had shown a
kitchen or non-kitchen item by clicking on the corres-
ponding button. In both response phases, an additional
button could be selected to indicate that the observer did
not know the correct response (‘‘no idea’’). Written
feedback was provided on screen after each of the two
A. Reinecke et al. / Journal of Anxiety Disorders 22 (2008) 655–670660
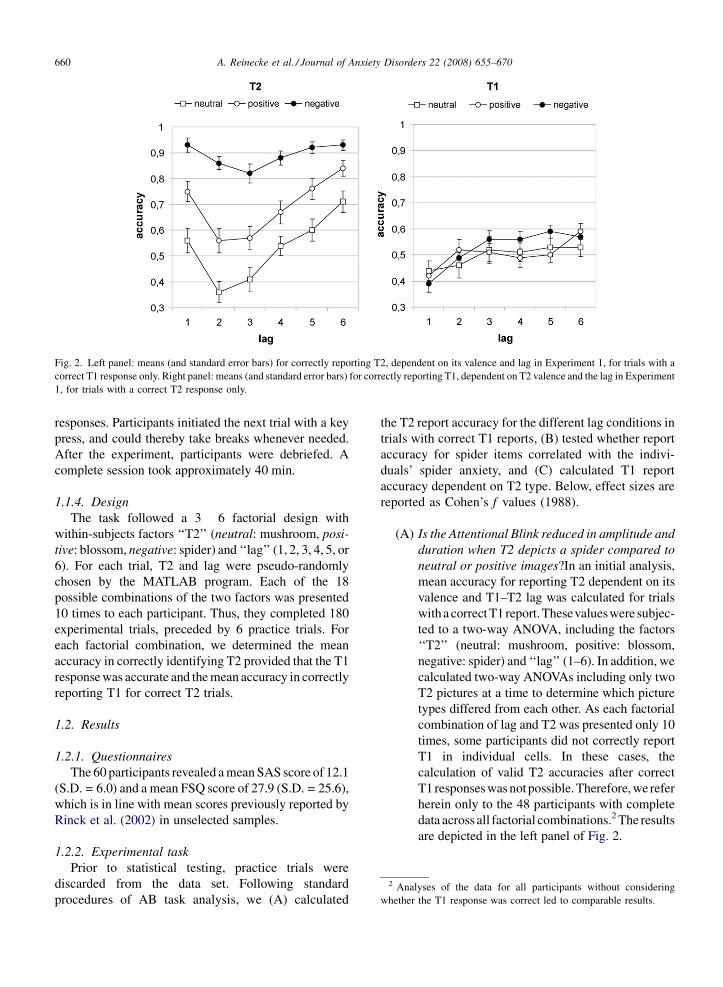
Fig. 2. Left panel: means (and standard error bars) for correctly reporting T2, dependent on its valence and lag in Experiment 1, for trials with a
correct T1 response only. Right panel: means (and standard error bars) for correctly reporting T1, dependent on T2 valence and the lag in Experiment
1, for trials with a correct T2 response only.
2 Analyses of the data for all participants without considering
whether the T1 response was correct led to comparable results.
responses. Participants initiated the next trial with a key
press, and could thereby take breaks whenever needed.
After the experiment, participants were debriefed. A
complete session took approximately 40 min.
1.1.4. Design
The task followed a 3 � 6 factorial design with
within-subjects factors ‘‘T2’’ (neutral: mushroom, posi-
tive: blossom, negative: spider) and ‘‘lag’’ (1, 2, 3, 4, 5, or
6). For each trial, T2 and lag were pseudo-randomly
chosen by the MATLAB program. Each of the 18
possible combinations of the two factors was presented
10 times to each participant. Thus, they completed 180
experimental trials, preceded by 6 practice trials. For
each factorial combination, we determined the mean
accuracy in correctly identifying T2 provided that the T1
response was accurate and the mean accuracy in correctly
reporting T1 for correct T2 trials.
1.2. Results
1.2.1. Questionnaires
The 60 participants revealed a mean SAS score of 12.1
(S.D. = 6.0) and a mean FSQ score of 27.9 (S.D. = 25.6),
which is in line with mean scores previously reported by
Rinck et al. (2002) in unselected samples.
1.2.2. Experimental task
Prior to statistical testing, practice trials were
discarded from the data set. Following standard
procedures of AB task analysis, we (A) calculated
the T2 report accuracy for the different lag conditions in
trials with correct T1 reports, (B) tested whether report
accuracy for spider items correlated with the indivi-
duals’ spider anxiety, and (C) calculated T1 report
accuracy dependent on T2 type. Below, effect sizes are
reported as Cohen’s f values (1988).
(A) I
s the Attentional Blink reduced in amplitude andduration when T2 depicts a spider compared to
neutral or positive images?In an initial analysis,
mean accuracy for reporting T2 dependent on its
valence and T1–T2 lag was calculated for trials
with a correct T1report.Thesevalueswere subjec-
ted to a two-way ANOVA, including the factors
‘‘T2’’ (neutral: mushroom, positive: blossom,
negative: spider) and ‘‘lag’’ (1–6). In addition, we
calculated two-way ANOVAs including only two
T2 pictures at a time to determine which picture
types differed from each other. As each factorial
combination of lag and T2 was presented only 10
times, some participants did not correctly report
T1 in individual cells. In these cases, the
calculation of valid T2 accuracies after correct
T1 responses was notpossible. Therefore, we refer
herein only to the 48 participants with complete
data across all factorial combinations.2 The results
are depicted in the left panel of Fig. 2.
A. Reinecke et al. / Journal of Anxiety Disorders 22 (2008) 655–670 661
Participants performed better in detecting
spider T2 pictures than positive or neutral T2
images, F(2,94) = 90.24, p < .001, f = 1.39,
spider-positive: F(1,47) = 45.68, p < .001, spi-
der-neutral: F(1,47) = 180.99, p < .001, and the
accuracy for detecting positive T2 images was
higher than for neutral T2 items, neutral–
positive: F(1,47) = 44.79, p < .001. Accuracy
was also lower in specific lag conditions,
F(5,235) = 28.21, p < .001, f = .78. This was
true for all T2 types, lag spider: F(5,235) = 3.88,
p < .01, f = .29, lag positive: F(5,235) = 12.82,
p < .001, f = .52, lag neutral: F(5,235) = 15.12,
p < .001, f = .56. The lag effect was similar for
positive and neutral T2, positive–neutral:
F(5,235) = .51, p = .766, f = .10, but different
for spider T2, spider-positive: F(5,235) = 3.53,
p < .01, f = .27, spider-neutral: F(5,235) = 5.16,
p < .001, f = .33.
Moreover, the significant interaction of lag and
T2 type, F(10,470) = 2.96, p = .001, f = .58,
suggests that the three valence conditions differed
regarding onset, duration, and amplitude of the
Attentional Blink. The left panel of Fig. 2
demonstrates that in all T2 conditions, report
accuracy was lowest at lags 2 and 3, producing the
AB characteristic U-shaped curves. However, the
U-shape was less prominent in the spider
condition. To determine whether there were any
valence-related differences regarding the onset
and duration of the Attentional Blink, for each
valence condition paired t-tests were computed
for all possible pairs of the first four lag
conditions. In all valence conditions, accuracy
at lag 1 was significantly higher than at lag 2
[spider: t(47) = 2.08, p < .05, f = .20, positive:
t(47) = 4.42, p < .001, f = .32, neutral: t(47) =
3.83, p < .001, f = .33] and lag 3 [spider: t(47)
= 2.64, p < .05, f = .25, positive: t(47) = 4.34,
p < .001, f = .30, neutral: t(47) = 3.15, p < .01,
f = .24], but did not differ anymore from accuracy
at lag 4 [spider: t(47) = 1.48, p = .146, f = .13,
positive: t(47) = 1.81, p = .077, f = .14, neutral:
t(47) = .29, p = .782, f = .04]. In all valence
conditions, there was no significant difference
between the T2 accuracy at lags 2 and 3 [all
t(47) < 1.19, all p > .201]. This implies that the
encoding of T1 led to lower encoding probability
for T2 when T2 appeared 160–320 ms after the
onset of T1, independent of the valence of T2.
Regarding the onset and duration of the AB, there
seemed to be no differences between the three
picture types. The calculation of the quadratic
contrasts for the first four lag conditions,
separately for each T2 condition confirmed AB
effects for all valence conditions, as there were
strong quadratic contrasts in the neutral curve,
F(1,47) = 28.08, p < .001, f = .77, and in the
positive condition, F(1,47) = 17.67, p < .001,
f = .61, and also – although weaker – in the
spider curve, F(1,47) = 6.32, p < .05, f = .37.
To test whether the three T2 conditions
yielded differences in AB amplitude, we first
calculated the standard deviation of the six mean
accuracies yielded at each lag position, sepa-
rately for each curve and each participant, as a
parameter of the amplitude of AB effects. The
standard deviations (S.D.neutral = .24, S.D.posi-
tive = .22, S.D.spider = .12) were then subjected to
a one-way ‘‘T2’’ ANOVA. The standard devia-
tions of the six lag means differed significantly
between the three picture types, F(2,94) = 21.36,
p = .000, f = .67, implying differences in the
strength of the AB effect between the three
valence conditions. Additional paired t-tests
confirmed a similar AB amplitude in the neutral
and positive condition, t(47) = 1.41, p = .166,
f = .13, but a weaker AB in the spider condition,
neutral-spider: t(47) = �4.61, p = .000, f = .62,
positive-spider: t(47) = �5.88, p = .000, f = .47.
In an additional analysis, it was tested
whether the onset of the Attentional Blink with
spider T2 was related to the individuals’ spider
fear. Therefore, the additional measure ‘‘onset of
the Attentional Blink’’ was defined, indicating
whether the individual’s recall accuracy of
spiders declined at lags 1, 2, 3, 4, 5, 6, or not
at all. Spearman’s correlational analyses yielded
no significant association between this onset of
the Attentional Blink in spider trials and level of
spider anxiety, neither for the SAS (Rho = �.17,
p = .26) nor for the FSQ (Rho = �.01, p = .93).
(B) I
f spider T2 images lead to reduced AB, is thisreduction related to the individual’s spider
anxiety?
To investigate whether there were any
correlations between the participants’ spider
anxiety and their spider T2 performance in the
Attentional Blink paradigm, we correlated the
mean of the six means of the spider curve versus
the mean of the first four means of the spider
curve with the individual’s SAS and FSQ scores
in Pearson’s correlation analyses. These calcula-
tions revealed no significant correlations, with
A. Reinecke et al. / Journal of Anxiety Disorders 22 (2008) 655–670662
all r < .106 and all p > .474. In addition, we
correlated the standard deviation of the six lag
points of the spider curve versus the standard
deviation of the first four means of the spider
curve with the self-reported spider anxiety. The
participants’ AB effect and their self-reported
spider anxiety did not correlate, all r > �.105,
all p > .386.
(C) D
oes the presentation of spider T2 imagesinfluence the report accuracy for T1 in compar-
ison to neutral and positive T2?
To test whether the content of T2 items
influenced the report accuracy of T1, we
conducted a two-way ANOVA with the inde-
pendent measures ‘‘lag’’ and ‘‘T2’’ and the
dependent measure ‘‘T1 accuracy in correct T2
trials’’. Again, data from three participants did
not contain all necessary values. Therefore, the
analysis was based on the 45 participants with
full set of results. Means are depicted in the right
panel of Fig. 2. Calculations revealed that the
content of the T2 image did not affect the report
probability of T1, T2: F(2,88) = 1.33, p = .269,
f = .18, T2 � lag: F(10,440) = 1.11, p = .354,
f = .18, but that independent of T2 type, T1 was
missed more often with short lags, lag:
F(5,220) = 7.65, p < .001, f = .42. This was
confirmed by an additional ANOVA excluding
lag 1 data, which no longer showed significant
lag effects, F(4,176) = 2.24, p = .067, f = .23.
(D) I
s a lower T1 memorization after presentation ofa spider T2 related to higher spider anxiety?
To find out whether memory accuracy for
neutral T1 items before a spider T2 was related to
spider anxiety, we calculated (a) the mean of the
T1 report accuracies at the six lag conditions and
(b) the mean at lag conditions 1 and 2, which
proved to be most prone to T2 onset effects. These
values were, together with individual SAS and
FSQ scores, subjected to Pearson’s correlation
analyses. Calculations revealed no correlations of
spider anxiety with either the T1 mean depending
on all six lag positions, SAS: r = �.080, p = .601,
FSQ: r = .038, p = .803, or with the T1 mean
depending on only the first two lag positions,
SAS: r = .055, p = .718, FSQ: r = .127, p = .406.
1.3. Discussion
In Experiment 1, we investigated whether a spider T2
is associated with a different AB pattern than for a
positive or a neutral T2, whether this difference is
related to the individuals’ spider anxiety, and whether
T1 report accuracy is lower when it is followed by a
spider. We found significant lag effects in all T2
conditions, causing U-shaped courses in each. For all
T2 types, report accuracy was lowest between 160 and
320 ms SOA, which is in line with the literature
investigating AB with simple letters (e.g., Chun &
Potter, 1995) or words (e.g., Anderson, 2005). Thus,
there were no differences in the onset and duration of
the AB in the three picture conditions. However, the
magnitude of the AB was significantly lower in the
spider condition, while the AB amplitudes in the
positive and neutral T2 condition did not differ from
each other. This effect of a reduced AB in spider curves
did not correlate with individual spider anxiety. Spiders
were generally more likely to be successfully reported
than neutral or positive T2 pictures, but accuracy to
spider T2 did not correlate with individual spider
anxiety. Additionally, the valence of T2 did not affect
report accuracy for T1, nor did T1 report accuracy in
spider trials correlate with spider anxiety. T1 report
accuracy was in general reduced with small T1–T2 lags,
which is in line with the results reported by Anderson
(2005). Summarizing, Experiment 1 suggests that the
evolutionary meaning or general negativity of items
affects the AB phenomenon. In contrast, the individual
threat value of a stimulus did not seem to increase its
probability of being promoted to a higher processing
level for consolidation. The data indicate no processing
preference for spiders at the cost of other items
undergoing higher processing. A deeper discussion of
the results follows in Section 3.
2. Experiment 2: the Attentional Blink for
spiders and snakes in spider fearfuls versus non-
anxious controls without snake anxiety
In Experiment 1, despite sufficient statistical power,
we found no correlations between the AB reduction by
spiders and individual spider anxiety, nor did we find
correlations between T1 accuracy in spider trials with
spider fear. However, the SAS and FSQ scores of the
participants of Experiment 1 indicate that the sample
included predominantly individuals with low or
medium levels of spider fear and barely any highly
fearful participants. Thus, the results can hardly be
generalized to spider phobics. Therefore, in Experiment
2, only participants with either very low or very high,
clinically relevant spider anxiety was tested to see if
report accuracy for T2 spiders and T1 items in spider
trials would differ between the two groups. As earlier
studies on spatial VWM biases in spider anxiety
A. Reinecke et al. / Journal of Anxiety Disorders 22 (2008) 655–670 663
suggested disorder-specific enhancement for spider
images, we sought to determine whether this difference
would also occur in a temporal VWM paradigm. We
further tested whether any group differences in
consolidation of T2 spiders would not only be
disorder-specific, but also materials-specific. Therefore,
the negative T2 item in this experiment included both a
disorder-relevant spider, feared by only one of the
groups, and a generally negative snake, feared by none
of the participants. In sum, the following research
questions were addressed: (A) Do spider fearfuls show
higher report accuracy for spider T2 than non-anxious
controls? (B) If so, is this advantage specific to the
feared spiders, that is, are there no group differences in
reporting snake T2? (C) Do spider fearfuls reveal lower
report accuracy for the T1 image in spider T2 trials? (D)
If so, does this group difference occur with spiders, but
not with snakes?
2.1. Methods
2.1.1. Participants
Thirty-one spider fearfuls (SFs) and 36 non-anxious
controls (NACs), both without snake anxiety, partici-
pated in the experiment.3 According to Cohen (1988),
this sample size allows for the detection of medium-
sized effects with power of 1 � b = .62, and large
effects with 1 � b = .93 (see Cohen, 1988, p. 30).
Potential participants were preselected in classes at
several departments at Dresden University of Technol-
ogy with the German ‘‘Spider Anxiety Screening’’
(SAS, Rinck et al., 2002) and the corresponding
German ‘‘Snake Anxiety Screening’’ (SCANS, Rein-
ecke, Becker, & Rinck, submitted for publication). Both
four-item instruments assess the DSM criteria for
specific phobia, namely ‘‘anxiety’’, ‘‘physiological
activation’’, ‘‘avoidance’’, and ‘‘impairment’’. As it is
easy to avoid spiders and snakes in Northern Europe
and, consequently, impairments are rarely reported by
anxious persons, no importance was attached to the
‘‘impairment’’ item in the prescreening analyses.
Students with scores lower than 5 or higher than 14
on the three remaining items of the spider screening
(SAS) and scores lower than 5 on the first three items of
the snake screening (SCANS) were invited for further
interviews and testing.
3 Originally, 34 SF were tested. The data of one of these participants
had to be removed from the data set due to a heightened snake anxiety
score revealed in the SCAF. In two other cases, technical problems led
to incomplete data recording.
Before the experiment, participants were screened for
alcohol or drug abuse, extreme stress, depression and
psychosis. Potential participants were questioned regard-
ing everyday stress, use of pharmaceuticals and drugs and
the extent of their alcohol use. To exclude depressed
students, the German FDD-DSM-IVinventory (Kuehner,
1997), which is a translation of the ‘‘Questionnaire for
Depression Diagnosis’’ (Zimmermann, Coryell, Wilson,
& Corenthal, 1986) was conducted. Moreover, volun-
teers completed the Trait form of the German State-Trait
Anxiety Inventory (STAI; Laux, Glanzmann, Schaffner,
& Spielberger, 1981) as well as the State form (once
before and once after the experiment). Additionally, the
psychosis section of the F-DIPS (Margraf, Schneider,
Soeder, Neumer, & Becker, 1996), the German version of
the ADIS (DiNardo, Brown, & Barlow, 1994), was
applied. None of the volunteers had to be excluded due to
suspicion of drug abuse, depression, or psychotic
tendencies.
Afterwards, spider and snake anxiety were care-
fully measured: participants completed German
versions of the ‘‘Fear of Spiders Questionnaire’’
(Szymanski & O’Donohue, 1995; see Rinck et al.,
2002) and the ‘‘Snake Anxiety Questionnaire (SNAQ;
Klorman, Hastings, Weerts, Melamed, & Lang, 1974;
see Reinecke et al., submitted for publication).
Trained interviewers assessed volunteers on DSM-
IV criteria for specific phobia of spiders and snakes.
For that purpose, the International Diagnosis Check-
list for DSM-IV (ICDL; Hiller, Zaudig, & Mombour,
1997) was used, enlarged by the eight-stage assess-
ment scales of the F-DIPS (Margraf et al., 1996).
Only candidates fulfilling none of the DSM-IV
criteria for snake phobia participated in the experi-
mental task. Additionally, they had to meet criteria
for one of the spider anxiety groups: for the non-
anxious control group (NAC), they were not allowed
to fulfill any of the DSM-IV criteria for specific
spider phobia as assessed by the ICDL, and had to
have an FSQ score below 11. Participants in the
spider fearful group (SF) had to reach an F-DIPS
‘‘fear’’, ‘‘physical activation’’, and ‘‘avoidance’’
score of at least 4 each and a minimum FSQ score
of 30. Eight of the 31 SFs fulfilled all DSM-IV
criteria for a specific phobia of spiders, while the rest
met all criteria except criterion E (significant
impairment in everyday life).
The SF sample and the NAC group were matched
for age, gender, and educational level. All candidates
had high school degrees and were students of Dresden
University of Technology. On average, the 31 female
and 5 male members of the NAC group were 22.5
A. Reinecke et al. / Journal of Anxiety Disorders 22 (2008) 655–670664
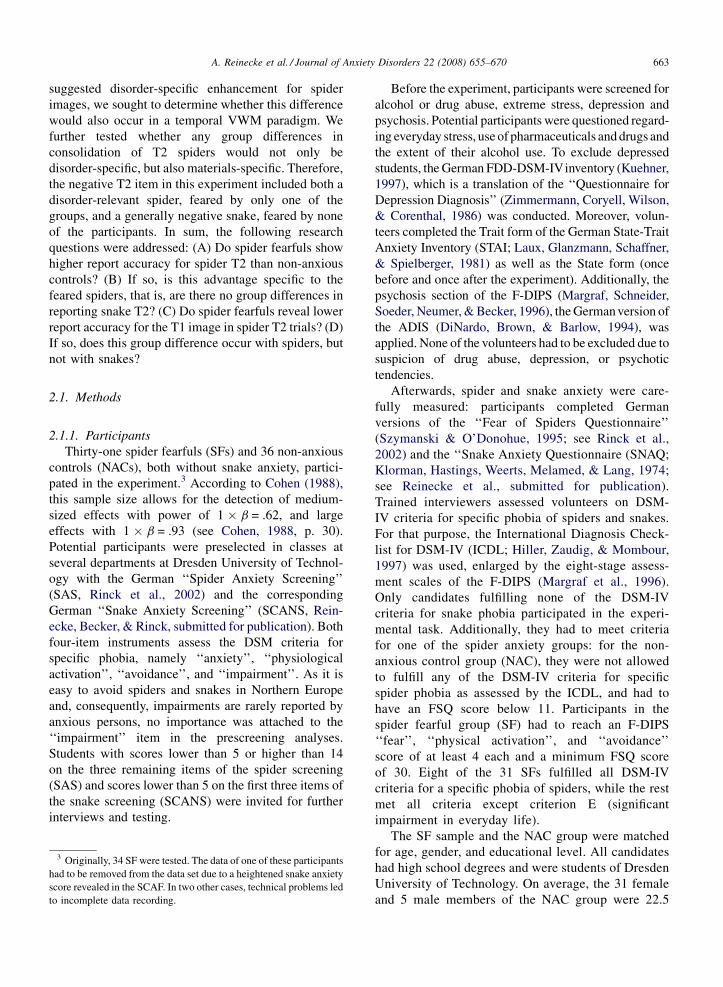
Table 1
Mean questionnaire scores (means, standard deviations, t-tests) in the two experimental groups, calculated for all participants in Experiment 2
Non-anxious controls (N = 36) Spider fearfuls (N = 31) Significance of t-test (d.f. = 67)
Age 22.5 (3.5) 21.4 (2.5) n.s.
SAS 1.6 (1.6) 17.9 (3.2) .001
FSQ 1.8 (2.6) 63.5 (17.3) .001
SCANS 1.8 (1.6) 2.4 (2.0) n.s.
SCAF 3.4 (2.0) 3.9 (2.6) n.s.
FDD 2.9 (2.9) 5.1 (3.9) .05
STAI-T 36.1 (7.0) 38.7 (6.6) n.s.
STAI-S pre-experimental 32.8 (4.9) 38.8 (8.9) .001
STAI-S post-experimental 32.4 (6.5) 37.3 (7.1) .01
years of age (S.D. = 3.5), while the 27 female and 4
male SF participants had a mean age of 21.4 years
(S.D. = 2.5). All volunteers had normal or corrected-
to-normal vision. All were informed of their rights as
experimental participants and gave their consent. The
participation was honored with course credit or
payment of s5.
2.1.2. Materials, apparatus, and procedure
The experiment was nearly identical to Experiment 1.
The only extension was a second negative T2 category,
the snake images. We selected four pictures of dark-
colored snakes from the picture pool rated as described
above. Only images with a recognizability rating of at
most three and a negative valence rating were included.
The response menus were changed slightly with removal
of the ‘‘no idea’’ buttons and addition of a ‘‘snake’’ button
in the T2 response menu. However, participants were
explicitly encouraged to avoid guessing.
2.1.3. Design
Statistical analyzes are based on a 2 � 4 � 6
factorial design with the between subjects factor
‘‘group’’ and the within-subjects factors ‘‘T2’’ (neutral:
mushroom, positive: blossom, negative: snake, dis-
order-specific negative: spider) and ‘‘lag’’ (1, 2, 3, 4, 5,
or 6). For each trial, T2 and lag were pseudo-randomly
chosen by the MATLAB experimental program. Each of
the 24 possible combinations of the two within-subjects
factors was presented 10 times to each participant.
Thus, they completed a total of 240 experimental trials,
preceded by 6 practice trials. For each factorial
combination, we computed two critical values: (1)
the mean accuracy in correctly identifying T2 provided
that the T1 response was accurate in order to determine
whether fearfuls and non-fearfuls would differ in
reporting spider T2, but not snake T2. (2) The mean
accuracy in correctly identifying T1 in dependence of a
correct T2 response to determine whether fearfuls and
non-fearfuls would differ in T1 report on spider trials,
but not on snake trials.
2.2. Results
2.2.1. Questionnaires
The mean scores, standard deviations, and sig-
nificance of t-tests for age and questionnaire scores
are shown in Table 1. Snake anxiety scores on the
SCAF were comparably low in both groups. Trait
anxiety scores on the STAI-T fell within the normal
range and did not differ between the groups. However,
the groups slightly differed regarding depression
scores on the FDD and pre-experimental and post-
experimental state anxiety with higher scores in the
SF group. Mostly, these values fell within normal
range and therefore should not confound interpreta-
tion of the results reported below. We observed
heightened FDD scores in three of the SF participants.
However, a supplementary analysis regarding the
experimental results showed that the FDD scores did
not correlate with the effects reported later, but only
the FSQ score.
2.2.2. Experimental task
(A and B) Do spider fearfuls show higher report
accuracy for spider T2 than non-anxious controls? If
so, is this advantage specific to the feared spiders?
For trials with a correct T1 response, we calculated
mean accuracy in reporting T2 targets dependent on
their valence and the lag condition for each participant.
These values were subjected to a three-way repeated
measures 2 � 4 � 6 ANOVA for the within-subjects
factors ‘‘T2’’ (neutral: mushroom, positive: blossom,
negative: snake, disorder-specific negative: spider) and
‘‘lag’’ (1–6), and the between-subjects factor ‘‘group’’.
The results are depicted in Fig. 3. Again, there were
cases in which a person was completely unable to
reproduce T1 correctly for a specific factorial
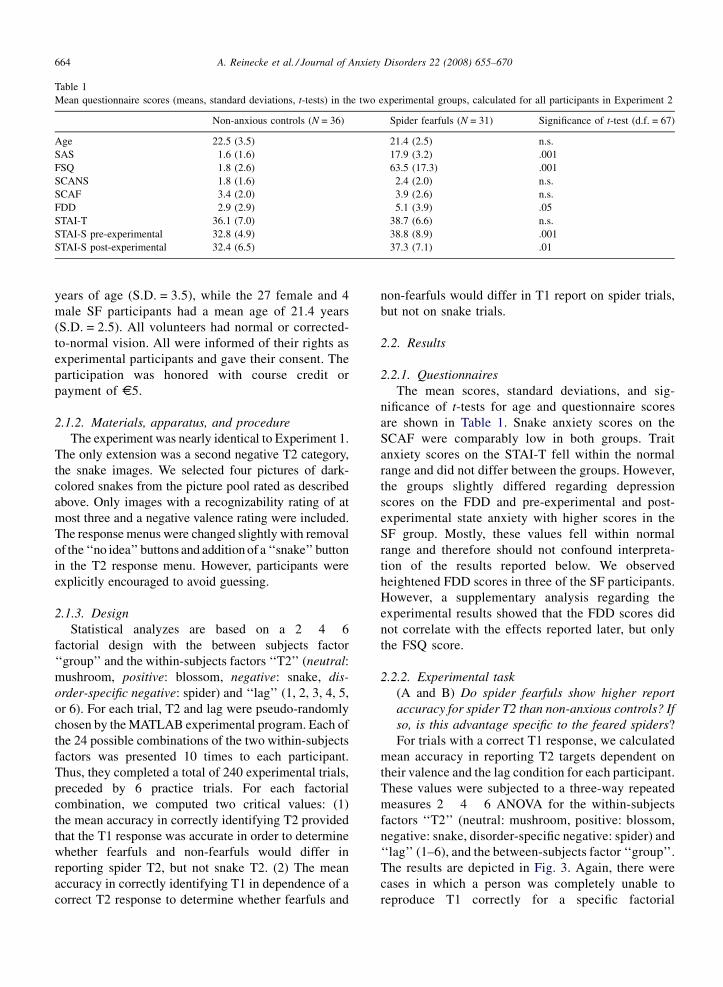
A. Reinecke et al. / Journal of Anxiety Disorders 22 (2008) 655–670 665
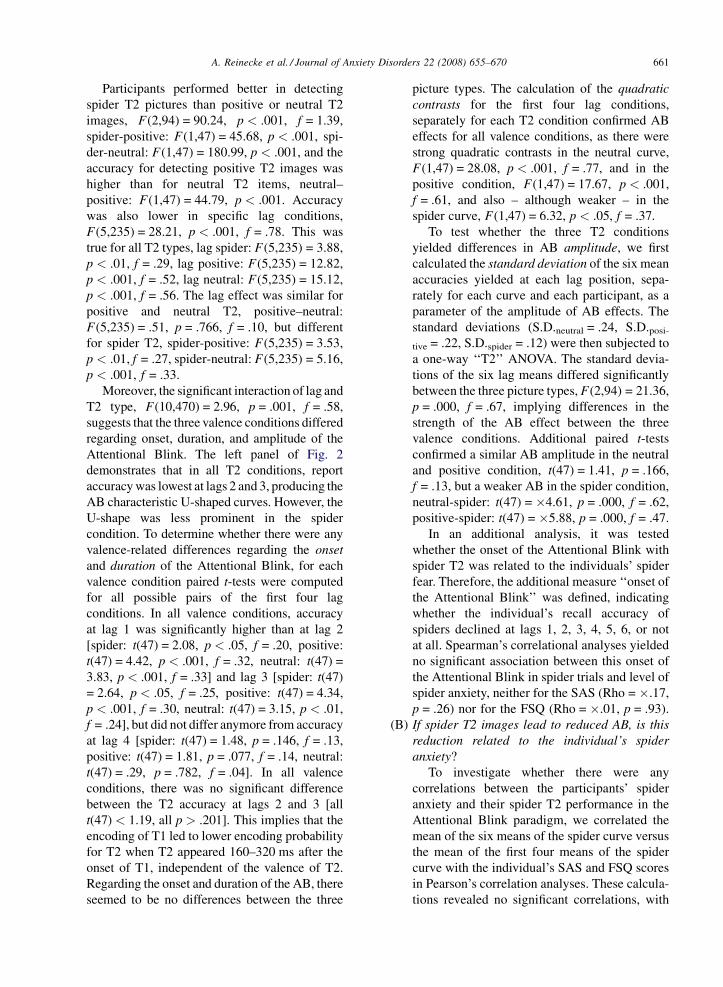
Fig. 3. Means (and standard error bars) for correctly reporting T2 after a correct T1 response in Experiment 2. Accuracy values for T2 are depicted
dependent on its valence and the lag, separately for the two groups.
combination, making it impossible to calculate a valid
accuracy value for T2. Therefore, this analysis is based
only on participants that did not produce any empty
cells.4 The age and questionnaire differences between
the remaining 26 SF and 28 NAC mirror the results
presented in Table 1. As in the previous experiment,
accuracy in reporting T2 depended on its valence,
F(3,156) = 83.45, p < .001, f = 1.28, and on the lag
condition, F(5,260) = 18.74, p < .001, f = .61, and
there were differences between the four T2 picture
types with regard to the AB, F(15,780) = 2.49,
p = .001, f = .23. In contrast, the complete ANOVA
revealed no differences between the groups, group:
F(1,52) = .98, p = .327, f = .14, group � lag: F(5,260)
= .76, p = .583, f = .10, group � T2: F(3,156) = .25,
p = .860, f = .10, group � T2 � lag: F(15,780) = 1.02,
p = .435, f = .14. However, calculating the same
ANOVA including only the T2 conditions neutral,
positive, and snake, suggested similar lag patterns in
these three conditions and a differing lag pattern only
in the spider condition, lag � T2: F(10,520) = 1.15,
p = .835, f = .10, lag: F(5,260) = 18.81, p < .001,
f = .61, T2: F(2,104) = 26.85, p < .001, f = .72.
Additional three-way ANOVAs including only two
T2 types at one time revealed better accuracy for
positive T2 than for snakes, Fpositive-snake(1,52) = 4.65,
p < .05, f = .29, better report accuracy for snakes
compared to neutral images, Fneutral-snake(1,52) = 24.11,
4 The analyses of the data of all participants independent of a
correct T1 response led to comparable results.
p < .001, f = .69, and the highest accuracy for spider
images, Fpositive-spider(1,52) = 64.29, p < .001, f = 1.11,
without any group differences, all F < .52, all p > .476.
Additional ‘‘lag’’ � ‘‘group’’ analyses, separately for
each T2 picture type, revealed marginally better spider
detection in the SF group compared to the NAC group,
F(1,52) = 3.23, p = .078, f = .25, but no group differ-
ences regarding the neutral condition, F(1,52) = .13,
p = .724, f = .00, nor the positive condition, F(1,52) =
.11, p = .737, f = .00, nor the snake condition,
F(1,52) = 1.03, p = .316, f = .14. Without group differ-
ences, accuracy was similar at all lag positions of the
spider curve, group � lag: all F(5,260) < 1.05, all
p > .390, lag: Fspider(5,260) = 1.33, p = .252, f = .18,
but differed depending on the lag in the three remaining
valence conditions, Fneutral(5,260) = 9.66, p < .001,
f = .44, Fpositive(5,260) = 7.32, p < .001, f = .37,
Fsnake(5,260) = 6.56, p < .001, f = .35.
In a second analysis, the standard deviations of the
six lag means (used as a measure of the AB effect) of
each T2 curve and each participant were subjected to a
two-way ANOVA with the factors ‘‘T2’’ and ‘‘group’’.
Results (SF: S.D.neutral = .24, S.D.positive = .20, S.D.spi-
der = .06, S.D.snake = .23; NAC: S.D.neutral = .22, S.D.po-
sitive = .20, S.D.spider = .10, S.D.snake = .19) indicated
that in both groups, AB effects were significantly
lowest in the spider condition, T2: F(3,156) = 47.66,
p < .001, f = .96, SF: all tspider-other(25) > 7.91,
p < .001, NAC: all tspider-other(27) > 5.21, p < .001.
In addition, the AB effect in spider curves was slightly
smaller in the SF group than the NAC group,
group � T2: F(3,156) = 3.23, p < .05, f = .25, yielding
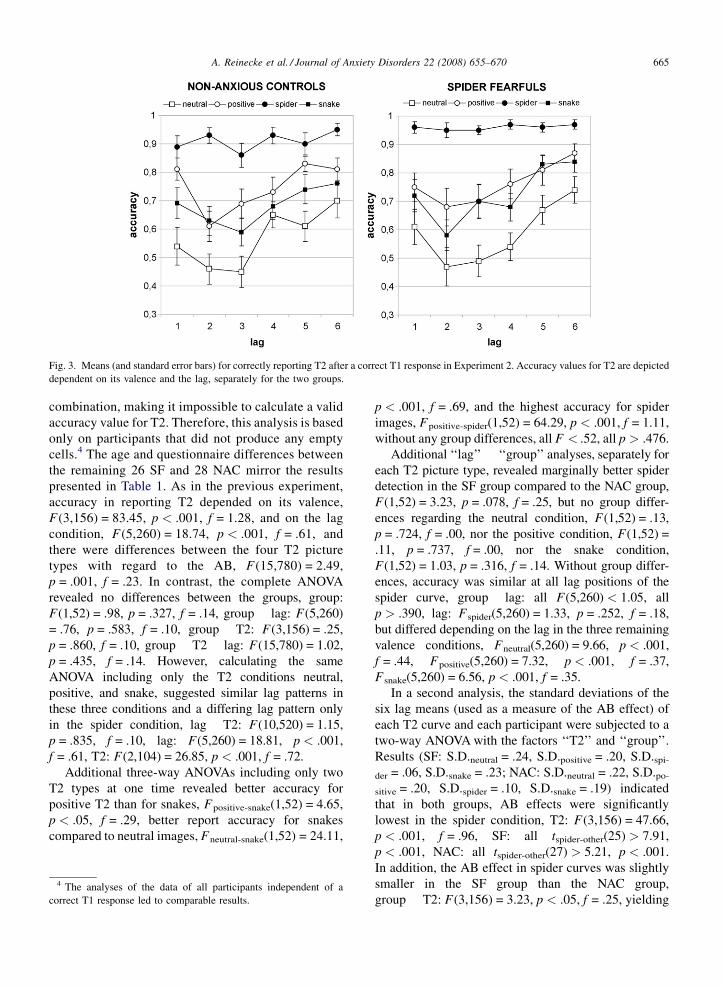
A. Reinecke et al. / Journal of Anxiety Disorders 22 (2008) 655–670666
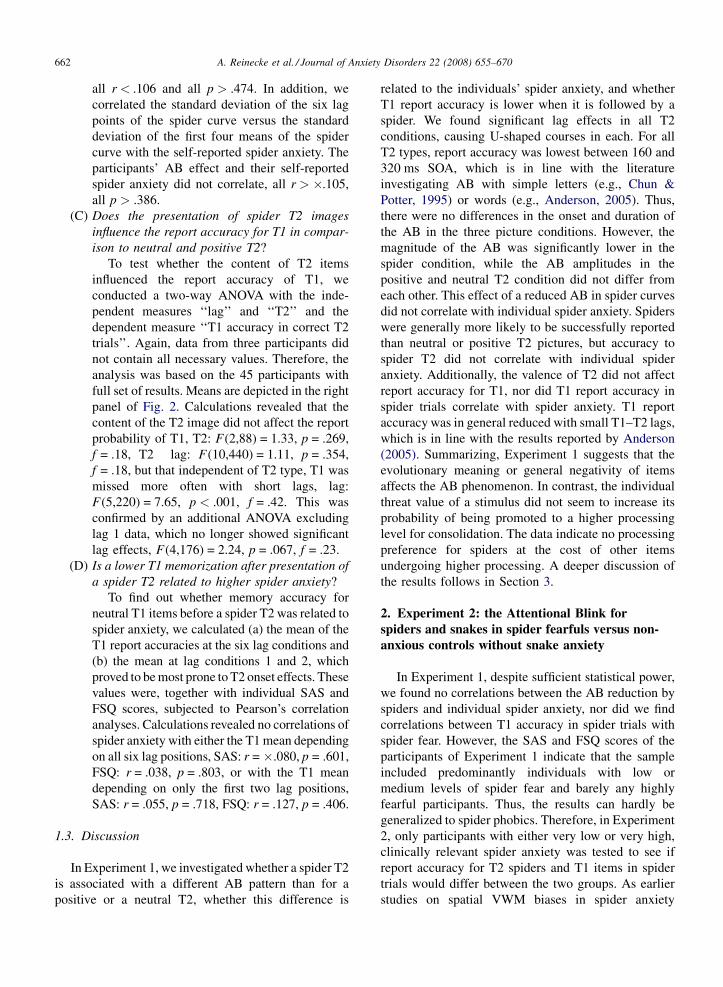
Fig. 4. Means (and standard error bars) for correctly reporting T1, dependent on T2 valence and lag in Experiment 2, for trials with a correct T2
response only, separately for the two groups.
a flatter spider curve in SFs than in NACs. Considering
only the first four lag conditions of each curve for the
calculation of the standard deviations led to similar
results.
(C and D) Do spider fearfuls show lower report
accuracy for the T1 image in spider T2 trials? If so,
does this group difference only occur with spiders,
but not with snakes?
This calculation is based on the 24 SF and 24 NAC
who did not produce any empty cells. In this analysis, we
tested whether the accuracy in reporting T1 depended on
the valence of T2 and group. Therefore, we computed a
three-way ANOVA with the factors ‘‘lag’’, ‘‘T2’’, and
‘‘group’’. Results are depicted in Fig. 4. A lag effect was
observed, which was independent of group or T2 type: T1
accuracy decreased with decreasing lag, lag: F(5,230) =
12.69, p > .001, f = .53, lag � group: F(5,230) = .75,
p = .587, f = .14, lag � T2: F(15,690) = .98, p = .480,
f = .14, lag � group � T2: F(15,690) = 1.02, p = .436,
f = .14. In both groups, T1 performance was higher for
spider T2, T2: F(3,138) = 3.06, p < .05, f = .25,
T2 � group: F(3,138) = 1.22, p = .306, f = .18, and
similar for neutral, positive, and snake T2, F(2,92) =
.21, p = .809, f = .10. In general, NAC T1 performance
was similar to that of SF, group: F(1,46) = 3.51, p = .067,
f = .27.
2.3. Discussion
With Experiment 2, we studied whether two extreme
groups with low versus high spider anxiety would
exhibit any differences in the AB effects yielded with
threatening T2, and if so, whether this group effect
would occur with disorder-specific threatening materi-
als only, or also with other negative stimuli such as
snakes. Both groups reported spiders significantly better
than blossoms, blossoms significantly better than
snakes, and snakes significantly better than mushrooms.
Regarding the latter three T2 conditions, we observed
no differences in the lag patterns, whereas in both
groups, there seemed to be no lag effects at all for spider
T2, which is in contrast to Experiment 1. While the data
indicated no group differences in report accuracy
regarding neutral, positive, and especially snake items,
we observed a slight group difference in the identifica-
tion of a spider T2, with advantages in the spider fearful
group. Analyses of the ‘‘flatness’’ of the T2 curves
revealed that both groups, but especially the SF group,
showed lowest lag dependence in the spider curve. In
addition, both groups unexpectedly revealed higher T1
accuracy in spider T2 trials. To summarize, the data hint
at the relevance of the individual threat value of an item
for the report probability during the AB temporal frame,
but do not indicate relevance of the individual threat
value of an item for the report probability of the target
item seen before.
3. General discussion
In two studies, we investigated the Attentional Blink
in picture strings with T2 materials of differing valence.
In Experiment 1, T2 depicted either a neutral mushroom
image, a positive blossom picture, or a negative spider
image. While on average, spiders were reported with a
A. Reinecke et al. / Journal of Anxiety Disorders 22 (2008) 655–670 667
higher accuracy than blossoms, and blossoms were
more often correctly reported than mushrooms, the AB
typical U-shaped curve occurred in all valence
conditions, implying high accuracy at lag 1, but
significantly reduced report accuracy at lags 2 and 3.
That is, an AB appeared at about 160–320 ms after the
onset of the first attended target without any differences
between the three valence types regarding onset and
duration. While the magnitude of this AB was similar
for neutral and positive T2, it was reduced for spider T2.
We observed no correlation between the flatness of the
spider curve, that is, the reduction of the spider AB
effect, and an individual’s spider anxiety. The T2
valence had no influence on the report probability of T1,
and the T1 accuracy in spider T2 trials was not
correlated with individual spider anxiety. Rather, T1
accuracy was lower at lags 1 and 2 in all T2 conditions.
In Experiment 2, we tested spider fearfuls and non-
anxious controls, both without snake anxiety, for two
negative T2 conditions, a disorder-related spider image
and an unrelated snake image. In both groups, spiders
were better reported than positive items, these were
slightly better identified than snakes, and neutral images
had the lowest report probability. The mean accuracy in
reporting spider T2 was marginally higher in SF. There
were no differences in report accuracy for snake T2
between groups. Moreover, the data revealed similar lag
patterns in the positive, the neutral, and the snake
condition in both groups, and no significant lag effects
at all in the spider condition, again in both groups.
Nevertheless, spider T2 curves were significantly flatter
in the SF group compared to the NAC group as indicated
by the standard deviation of the six lag conditions. In
addition, both groups showed higher T1 accuracy with
spider T2 compared to other T2.
What do these data tell us about the relevance of
emotionality of an item – especially its individual threat
value – for the magnitude of the AB, and about the
existence of temporal working memory biases in
specific anxiety? First, we can conclude that stimuli
with a positive or negative valence are in general
reported more often than neutral stimuli. That is,
participants viewing a very rapid serial presentation of
images preferably select emotional stimuli for higher
level processing. This is in line with processing theories
postulating that emotional information is quickly and
automatically filtered (for a review, see, for instance,
Williams et al., 1997). However, Experiment 1
demonstrated that both neutral and emotional stimuli
are prone to AB effects in a similar manner:
independently of its emotionality, a target is reported
with lower probability when it occurs within the AB
temporal frame of 160–320 ms after the onset of
another, attended target. Regarding the two-stage model
of Chun and Potter (1995), this observation implies that
higher processing of an emotional T2 at least partially
uses the same resources as the higher processing of
neutral items: while T1 is still in the consolidation
phase, T2 has to be held in stage 1, which is more prone
to forgetting, producing an AB phenomenon. However,
in both experiments, the AB magnitude was lower for
spiders at all anxiety levels. This might on the one hand
imply that, when the first target was still under higher
processing, the stage 1 representation of a T2 spider was
either more durable than the stage 1 representation of a
mushroom or a blossom T2 and, thus, was more likely to
survive the processing delay. On the other hand, it might
suggest that in the consolidation of spider images, less
resources are required or some additional, presumably
automatic processing resources are activated. Further
experiments are required to test the validity of these
competing explanations. The advantage to spider T2 at
all anxiety levels is in line with the preparedness theory
(Seligman, 1971), assuming that humans are predis-
posed to be alert to situations or animals that
endangered survival during our evolutionary history.
Possibly, some kind of internal representation of
phylogenetically ‘‘dangerous’’ objects and situations
accelerates the creation of a spider T2 representation.
This will be an interesting avenue for further research.
Earlier research already suggests that emotional
materials are preferentially selected from a stream of
information for encoding in working memory (Ander-
son, 2005; Keil & Ihssen, 2004), and that the encoding
of these items takes less time (Arend & Botella, 2002).
Getting back to our earlier questions—how preferential
is this preferential processing of threatening stimuli in
specific anxiety? Is the reduction of the AB magnitude
related to individual anxiety regarding the emotional
stimuli? Does this possible advantage come at the
expense of items currently undergoing processing,
resulting in premature ejection from being processed?
And if so, is it related to the individual threat value of an
item?
Our data suggest that for samples with a normal
distribution of spider anxiety as in Experiment 1, the
AB magnitude is not related to spider anxiety, and
advantages for negative T2 items are not related to T1
costs. However, it seems that for anxiety states with
clinical relevance, AB patterns are different, implying
the existence of disorder-specific biases in anxiety
disorders. First, in highly spider fearfuls, the AB
magnitude is additionally reduced compared to non-
anxious controls. This enhanced encoding of spider T2
A. Reinecke et al. / Journal of Anxiety Disorders 22 (2008) 655–670668
in spider fearfuls might be due to their experience with
spider materials. According to Cave and Batty (2006),
phobics are faster at identifying feared stimuli due to a
better representation of phobic materials as a result of
their regular preoccupation with those items. Possibly,
such an additional internal representation of the
‘‘feared’’ spider is involved in the enhanced identifica-
tion of spider T2 within the rapid stimuli stream. In
contrast, both high and low spider anxiety participants
exhibited higher T1 performance with spider T2.
Together with the data of Experiment 1, this indicates
that at all anxiety levels, the appearance of a spider T2
does not lead to the interruption of ongoing processing
of a T1 item. The processing of an item is not cancelled
in favor of a spider item, and the general rule ‘‘first in,
first out’’ seems to be valid for both threatening and
neutral items. At extremely high and low levels of
anxiety, the onset of a spider T2 seems to evoke
additional resources for completion of T1 processing.
This implies that at particularly high and low anxiety
levels, negative T2 images may require less processing
resources for their own encoding.
However, some inconsistencies in spider AB results
between Experiments 1 and 2 point to methodological
differences and therefore, interpretational limitations.
Experiment 1 yielded significant lag effects for spider
T2, while Experiment 2 yielded no lag effects for spider
T2 at all. Moreover, missing T1 and T2 enhancement
effects with snake T2 compared to spider T2 in
Experiment 2 also requires explanation. Several
explanations may seem initially plausible for the lack
of AB effects on spider T2 in Experiment 2, but do not
hold upon closer examination: (a) one might argue that
the missing ‘‘no idea’’ button in Experiment 2 may have
encouraged guessing in trials where observers did not
identify a T2, and that they chose the spider button, as
extensive prescreening for spider anxiety might have
primed insights into study interests. However, as
prescreening for snake anxiety was comparably
extensive, we should have observed similar AB effects
in the snake curve as well; (b) participants may have
responded with the spider button when they merely
noticed ‘‘something dark’’. But as only one of the four
spiders was definitely darker than the snakes, the
difference between the snake and the spider curve
should not be that prominent. From earlier studies
investigating the AB with emotional words as T2 (e.g.,
Anderson, 2005; Keil & Ihssen, 2004) we know that it is
not merely stimulus valence that reduces AB effects, but
primarily the arousal value of the target which is
responsible. A closer inspection of our own stimuli
reveals that the most important difference between
spiders and snakes (as well as all other objects) is that
spiders were depicted close to their natural size, while
the others were reduced in size. This may have
produced less arousal for snakes, as compared to
spiders. Unfortunately, we did not collect arousal
ratings for our stimulus materials and therefore cannot
answer this question. However, these effects, relevant or
not, provide no explanation for why we observed spider
T2 lag effects in Experiment 1, but not in Experiment 2.
One could argue that only individuals with medium,
non-extreme anxiety scores, show AB effects to the
threat stimulus.
Another limitation of the current results exists in low
average report performance for T1 items. While earlier
studies report T1 accuracies of 80–90% (e.g., Fox et al.,
2005; Keil & Ihssen, 2004), we observed T1 accuracies
of only 50–60%. As mentioned above, we found similar
T2 results regardless of whether or not incorrect T1
responses were included in the analysis. Nevertheless,
the categorization task for T1 chosen in this study may
have been overly complex for performance at such short
presentation times. Further research should test this
assumption by employing a less demanding T1 task.
In addition, one needs to keep in mind that in
Experiment 2, an analogue participant sample was
tested. Although the spider fearfuls fulfilled relevant
diagnostic criteria, they were not patients seeking
treatment. Previous research suggests that it might be
relevant whether treatment seekers versus analogue
participants are tested (e.g., Perez-Lopez & Woody,
2001; Sawchuk, Meunier, Lohr, & Westendorf, 2002),
because cognitive biases may be intensified in patients.
It would be worthwhile to repeat Experiment 2 with
treatment-seeking spider fearfuls to determine whether
group differences would be even more pronounced than
in the current study.
Despite these limitations, the current study adds to
the growing literature on working memory biases in
specific anxiety. Cognitive biases are relevant main-
taining factors in the pathogenesis of anxiety disorders,
and it seems that disorder-relevant threat is not only
preferentially processed at the level of attention, but
also at the level of working memory. There is evidence
that spider fearfuls reveal spatial VWM biases for
threatening materials, and there is evidence suggesting
that this bias is based on automatic processing of spiders
(Reinecke et al., 2006). In addition, the present study
suggests that fear of spiders might also be related to
temporal working memory biases, implying disorder-
specific enhanced working memory encoding of spider
T2 in an AB task. Interestingly, the enhanced encoding
does not seem to occur at the expense of T1 processing.
A. Reinecke et al. / Journal of Anxiety Disorders 22 (2008) 655–670 669
Acknowledgements
Preparation of this paper was supported by a grant
from the German Research Foundation (DFG) to Eni
Becker and Mike Rinck. We are grateful to Robert
Muenster for his support in programming the experi-
mental script, to Kira Marschner and Kristin Grundl for
their help in recruiting and testing the participants, to
Daniel Fitzgerald for proof-reading the manuscript, and
to two anonymous reviewers for helpful comments on
an earlier version of this article.
References
Anderson, A. K. (2005). Affective influences on the attentional
dynamics supporting awareness. Journal of Experimental Psy-
chology: General, 134, 258–281.
Arend, I., & Botella, J. (2002). Emotional stimuli reduce the atten-
tional blink in sub-clinical anxious subjects. Psicothema, 14(2),
209–214.
Beck, A. T., Emery, G., & Greenberg, R. L. (1985). Anxiety disorders
and phobias. Basic Books.
Brainard, D. H. (1997). The psychophysics toolbox. Spatial Vision,
10(4), 443–446.
Broadbent, D. E., & Broadbent, M. H. P. (1987). From detection to
identification: response to multiple targets in rapid serial visual
presentation. Perception & Psychophysics, 42, 105–113.
Cave, K. R., & Batty, M. J. (2006). From searching for features to
searching for threat: drawing the boundary between preattentive
and attentive vision. Visual Cognition, 14(4–8), 629–647.
Chun, M. M. (1997). Types and tokens in visual processing: a double
dissociation between the attentional blink and repetition blindness.
Journal of Experimental Psychology: Human Perception and
Performance, 23, 738–755.
Chun, M. M., & Potter, M. C. (1995). A two-stage model for multiple
target detection in rapid serial visual presentation. Journal of
Experimental Psychology: Human Perception and Performance,
21, 109–127.
Clark, D. M., & Wells, A. (1995). A cognitive model of social phobia.
In: R. G. Heimberg, M. R. Liebowitz, D. A. Hope, & F. R.
Schneider (Eds.), Social phobia: diagnosis, assessment, treatment
(pp. 69–93). New York: The Guilford Press.
Cohen, J. (1988). Statistical power analysis for the behavioral
sciences. Hillsdale, NJ: Erlbaum.
de Jong, P. J., & Martens, S. (2007). Detection of emotional
expressions in rapidly changing facial displays in high- and
low-socially anxious women. Behaviour Research and Therapy,
45, 1285–1294.
DiNardo, P. A., Brown, T. A., & Barlow, D. H. (1994). Anxiety
disorders interview schedule for DSM-IV: lifetime version
(ADIS-IV-L). Albany, NY: Graywind Publications.
ESEMed/MHEDEA 2000 Investigators. (2004). Prevalence of mental
disorders in Europe: results from the European study of the
epidemiology of mental disorders (ESEMed) project. Acta Psy-
chiatrica Scandinavica, 109, 21–27.
Fox, E., Russo, R., & Georgiou, G. A. (2005). Anxiety modulates the
degree of attentive resources required to process emotional
faces. Cognitive, Affective, & Behavioral Neuroscience, 5,
396–404.
Hiller, W., Zaudig, M., & Mombour, W. (1997). IDCL—Internationale
Diagnosen Checklisten fuer DSM-IV und ICD-10 (Manual, 31
Checklisten nach DSM-IV und Screening-Blatt). Goettingen:
Hogrefe.
Intraub, H. (1985). Visual dissociation: an illusory conjunction of
pictures and forms. Journal of Experimental Psychology: Human
Perception and Performance, 11, 431–442.
Jolicoeur, P., & Dell’Acqua, R. (2000). The demonstration of short-
term consolidation. Cognitive Psychology, 36, 138–202.
Kanwisher, N. G. (1987). Repetition blindness: type recognition
without token individuation. Cognition, 27, 117–143.
Keil, A., & Ihssen, N. (2004). Identification facilitation for emotionally
arousing verbs during the attentional blink. Emotion, 4(1), 23–35.
Kessler, R. C., Chiu, W. T., Demler, O., & Walters, E. E. (2005).
Prevalence, severity, and comorbidity of twelve-month DSM-IV
disorders in the National Comorbidity Survey Replication (NCS-
R). Archives of General Psychiatry, 62, 617–627.
Klorman, R., Hastings, J. E., Weerts, T. C., Melamed, B. G., & Lang, P.
J. (1974). Psychometric description of some specific-fear ques-
tionnaires. Behavior Therapy, 5, 401–409.
Kuehner, C. (1997). Fragebogen zur Depressionsdiagnostik nach
DSM-IV (FDD-DSM-IV). Goettingen, Germany: Hogrefe.
Laux, L., Glanzmann, P., Schaffner, P., & Spielberger, C. D. (1981).
STAI: Das State-Trait-Angstinventar. Weinheim, Germany: Beltz.
Luck, S. J., Vogel, E. K., & Shapiro, K. L. (1996). Word meanings can
be accessed but not reported during the attentional blink. Nature,
383, 616–618.
Magee, W. J., Eaton, W. W., Wittchen, H.-U., McGonagle, K. A., &
Kessler, R. C. (1996). Agoraphobia, simple phobia, and social
phobia in the national comorbidity survey. Archives of General
Psychiatry, 53, 159–168.
Margraf, J., Schneider, S., Soeder, U., Neumer, S., & Becker, E. S.
(1996). Diagnostisches Interview bei psychischen Stoerungen (F-
DIPS), unpublished manual.
Mathews, A., & MacLeod, C. (2005). Cognitive vulnerability to
emotional disorders. Annual Review of Clinical Psychology, 1,
167–195.
Oehman, A., Flykt, A., & Esteves, F. (2001). Emotion drives attention:
detecting the snake in the grass. Journal of Experimental Psy-
chology: General, 130, 466–478.
Olson, I. R., Chun, M. M., & Anderson, A. K. (2001). Effects of
phonological length on the attentional blink for words. Journal of
Experimental Psychology: Human Perception and Performance,
27(5), 1116–1123.
Pelli, D. G. (1997). The Video Toolbox software for visual psycho-
physics: transforming numbers into movies. Spatial Vision, 10(4),
437–442.
Perez-Lopez, J. R., & Woody, S. A. (2001). Memory for facial
expressions in social phobia. Behaviour Research and Therapy,
39, 967–975.
Potter, M. C., Staub, A., & O’Connor, D. H. (2002). The time course of
competition for attention: attention is initially labile. Journal of
Experimental Psychology: Human Perception and Performance,
28(5), 1149–1162.
Raymond, J. (2003). New objects, not new features, trigger the
attentional blink. Psychological Science, 14(1), 54–59.
Raymond, J. E., Shapiro, K. L., & Arnell, K. M. (1992). Temporary
suppression of visual processing in an RSVP task: an attentional
blink? Journal of Experimental Psychology: Human Perception
and Performance, 18, 849–860.
Reeves, A., & Sperling, G. (1986). Attention gating in short-term
visual memory. Psychological Review, 93, 180–206.
A. Reinecke et al. / Journal of Anxiety Disorders 22 (2008) 655–670670
Regier, D. A., Rae, D. S., Narrow, W. E., Kaelber, C. T., & Schatzberg,
A. F. (1998). Prevalence of anxiety disorders and their comorbidity
with mood and addictive disorders. British Journal of Psychiatry,
173, 24–28.
Reinecke, A., Becker E. S., & Rinck, M. (submitted for publication).
Two short-screenings measuring fear of snakes: reliability and
validity by contrast with the SNAQ.
Reinecke, A., Rinck, M., & Becker, E. S. (2006). Spiders crawl easily
through the bottleneck: visual working memory for negative
stimuli. Emotion, 6, 438–449.
Rinck, M., Bundschuh, S., Engler, S., Mueller, A., Wissmann, J.,
Ellwart, T., et al. (2002). Reliability and validity of German
versions of three instruments measuring fear of spiders. Diag-
nostica, 48, 141–149.
Sawchuk, C. N., Meunier, S. A., Lohr, J. M., & Westendorf, D. H.
(2002). Fear, disgust, and information processing in specific
phobia: the application of signal detection theory. Journal of
Anxiety Disorders, 16, 495–510.
Seligman, M. E. P. (1971). Phobias and preparedness. Behavior
Therapy, 2, 307–320.
Shapiro, K. L., Raymond, J. E., & Arnell, K. M. (1994). Attention to
visual pattern information produces the attentional blink in rapid
serial visual presentation. Journal of Experimental Psychology:
Human Perception and Performance, 20(2), 357–371.
Smith, S. D., Most, S. B., Newsome, L. A., & Zald, D. H. (2006). An
emotion-induced attentional blink elicited by aversively condi-
tioned stimuli. Emotion, 6, 523–527.
Szymanski, J., & O’Donohue, W. (1995). Fear of spiders question-
naire. Journal of Behavior Therapy and Experimental Psychiatry,
26, 31–34.
Vogel, E. K., & Luck, S. J. (2002). Delayed working memory
consolidation during the attentional blink. Psychonomic Bulletin
& Review, 9(4), 739–743.
Vogel, E. K., Luck, S. J., & Shapiro, K. L. (1998). Electrophysiolo-
gical evidence for a postperceptual locus of suppression during the
attentional blink. Journal of Experimental Psychology: Human
Perception and Performance, 24, 1656–1674.
Weichselgartner, E., & Sperling, G. (1987). Dynamics of automatic
and controlled visual attention. Science, 238, 778–780.
Williams, J. M. G., Mathews, A., & MacLeod, C. (1996). The
emotional stroop task and psychopathology. Psychological Bulle-
tin, 120, 3–24.
Williams, J. M. G., Watts, F. N., MacLeod, C., & Mathews, A. (1997).
Cognitive psychology and emotional disorders. Chichester: John
Wiley.
Wittchen, H.-U., Nelson, C. B., & Lachner, G. (1998). Prevalence of
mental disorders and psychosocial impairments in adolescents and
young adults. Psychological Medicine, 28, 109–126.
Zimmermann, M., Coryell, W., Wilson, S., & Corenthal, C. (1986). A
self-report scale to diagnose major depressive disorder. Archives of
General Psychiatry, 43, 1076–1081.
Zuvic, S. M., Visser, T. A. W., & DiLollo, V. (2000). Direct estimates
of processing delays in the attentional blink. Psychological
Research, 63, 192–198.