canada's fish and seafood trade, 2018...united states (largest destination) in 2018, canada’s...
TRANSCRIPT


Published by:
Economic Policy and Research
Economic Analysis and Statistics Directorate
Strategic Policy Sector
Fisheries and Oceans Canada
Ottawa, Ontario
K1A 0E6
© Her Majesty the Queen in Right of Canada, 2019. Please refer to http://www.dfo‐mpo.gc.ca/notices‐avis‐eng.htm
Catalogue number: Fs23‐623/2018E‐PDF / 978‐0‐660‐32329‐9
ISSN 2562‐8038
This publication should be quoted as follows: Canada’s Fish And Seafood Trade, 2018.

CANADA’S FISH AND SEAFOOD TRADE, 2018 Highlights
Value of Canada’s fish and seafood exports was $6.92B1, with a 1 per cent increase (+$62M) from the previous year.
Quantity of exports was 600 thousand tonnes with a 3 per cent decline from the previous year, while average fish and seafood export prices increased 4 per cent during the same period.
Top destinations were the United States ($4.27B), China ($1.17B) and the European Union ($0.45B), accounting for 85 per cent of Canada’s fish and seafood total export value.
CANADA’S TOP 3 FISH AND SEAFOOD EXPORTS BY DESTINATION, 2018 2018 VALUE CHANGE2 CHANGE CHANGE SHARE CAGR3 of Exports of Values of Volumes of Prices of Exports of Value
DESTINATION ($B) (%) (%) (%) (%) (%)
US 4.27 -0.8 -9.0 9.0 61.7 8.6 China 1.17 22.7 7.0 14.6 16.9 23.2 EU 0.45 -9.8 -5.0 -5.0 6.5 -0.5 Other 1.03 -6.5 3.3 -9.4 14.9 4.3 Total 6.92 0.9 -3.2 4.3 100.0 9.0
Top species exported were lobster4 ($2.22B), crab5 ($1.31B) and salmon ($1.19B), accounting for 68 per cent of total Canadian fish and seafood export value.
CANADA’S TOP 3 FISH AND SEAFOOD EXPORTS BY SPECIES, 2018 2018 VALUE CHANGE CHANGE CHANGE SHARE CAGR of Exports of Values of Volumes of Prices of Exports of Value
SPECIES ($B) (%) (%) (%) (%) (%)
Lobster 2.22 4.7 1.4 3.2 32.1 10.0 Crab 1.31 -11.4 -20.5 11.5 18.9 10.0 Salmon 1.19 9.1 1.6 7.3 17.2 16.4 Other 2.20 1.5 -2.2 3.8 31.8 4.5 Total 6.92 0.9 -3.2 4.3 100.0 9.0
Top exporting provinces were Nova Scotia ($2.03B), New Brunswick ($1.66B), British Columbia ($1.39B) and Newfoundland and Labrador ($0.94B) accounting for 87 per cent of Canada’s fish and seafood total export value.
Value of Canada’s fish and seafood imports was $3.97B, with a 3 per cent increase from the previous year.
Top suppliers of fish and seafood to Canada were the United States ($1.36B), China ($0.56B) and Thailand ($0.32B), accounting for 57 per cent of Canada’s total fish and seafood import value.
Top species imported were shrimp/prawn ($0.69B), salmon ($0.67B) and lobster ($0.39B), accounting for 44 per cent of Canada’s total fish and seafood import value.
1 Unless otherwise indicated, trade statistics are sourced from Statistics Canada, and were accessed through: Fisheries and Oceans Canada (2019),
EXIM [database], Ottawa. Accessed: March 07, 2019. 2 In the tables, the term “change” indicates yearly change from the previous year, unless otherwise specified. 3 Compound annual growth rate from 2014 to 2018. 4 Lobster refers to the Homarus species. 5 Unless otherwise specified, Canadian exports of crab refer to snow crab, Dungeness crab and unspecified crab species. Based on exporting
provinces and Canadian crab species landings data, Canadian exports of crab consist principally of snow crab.

CANADA’S FISH AND SEAFOOD TRADE, 2018 March 2019
i
ACRONYMS AND NOTES
CAGR Compound annual growth rate
CETA Canada-European Union Comprehensive Economic and Trade Agreement
DFO Department of Fisheries and Oceans Canada
UK United Kingdom
EU European Union
US United States of America
1) Unless otherwise indicated, trade statistics are sourced from Statistics Canada, and were accessed through: Fisheries and Oceans Canada (2019), EXIM [database], Ottawa. Accessed: March 07, 2019.
2) When sources other than Statistics Canada are indicated, note that export statistics reported by one territory are often not the same as the import statistics reported by its trade partner. Import statistics often include additional shipping costs, and territories may apply different rules in the accounting of international trade.
3) Values are nominal not accounting for inflation.
4) Throughout this report’s tables, the term “change” indicates yearly change from the previous year, unless otherwise specified.
5) Compound annual growth rate (CAGR) is used to take into account variances in growth during interim years.
6) Unless otherwise specified, lobster refers to the Homarus species.
7) Canadian exports of crab refer to snow crab, Dungeness crab and unspecified crab species, unless otherwise specified. Based on exporting provinces and Canadian crab species landings data, total Canadian exports of crab consist principally of snow crab.
CANADA’S FISH AND SEAFOOD TRADE, 2018 March 2019
ii
TABLE OF CONTENTS Acronyms and Notes ....................................................................................................................... i
Canada’s Fish and Seafood Exports ............................................................................................ 1
Canada’s Fish and Seafood Exports by Destination ............................................................. 2
United States (largest destination) ........................................................................................ 2
China (2nd largest destination) .............................................................................................. 3
European Union (3rd largest destination) ............................................................................. 4
Other Destinations ................................................................................................................... 5
Canada’s Fish and Seafood Exports by Species ................................................................... 7
Lobster (largest export) ........................................................................................................... 7
Crab (2nd largest export) ......................................................................................................... 9
Salmon (3rd largest export) ................................................................................................... 11
Other Species ......................................................................................................................... 13
Canada’s Fish and Seafood Exports by Province and Territory ........................................ 15
Canada’s Fish and Seafood Imports ......................................................................................... 16
Canada’s Fish and Seafood Imports by Origin .................................................................... 17
Canada’s Fish and Seafood Imports by Species ................................................................. 19
LIST OF TABLES Table 1 Canada’s Fish and Seafood Exports, 2014-2018 .......................................................... 1 Table 2 Canada’s Top 10 Fish and Seafood Exports by Destination, 2018 ............................ 6 Table 3 Canada’s Top 10 Fish and Seafood Exports by Species, 2018 ................................ 14 Table 4 Canada’s Fish and Seafood Exports by Province and Territory, 2018 .................... 15 Table 5 Canada’s Fish and Seafood Imports, 2014-2018 ....................................................... 16 Table 6 Canada’s Top 10 Fish and Seafood Imports by Origin, 2018 ................................... 18 Table 7 Canada’s Top 10 Fish and Seafood Imports by Species, 2018 ............................... 20
LIST OF FIGURES Figure 1 Canada’s Fish and Seafood Exports, 2014-2018 ......................................................... 1 Figure 2 Canada’s Fish and Seafood Exports by Destination, 2018 ($M) .............................. 2 Figure 3 Canada’s Top 10 Fish and Seafood Exports to the US, 2018 ($M) ........................... 3 Figure 4 Canada’s Top 10 Fish and Seafood Exports to China, 2018 ($M) ........................... 4 Figure 5 Canada’s Top 10 Fish and Seafood Exports to the EU, 2018 ($M) ........................... 5 Figure 6 Canada’s Fish and Seafood Exports by Species, 2018 ($M) .................................... 7
CANADA’S FISH AND SEAFOOD TRADE, 2018 March 2019
iii
Figure 7 Canada’s Lobster Exports, 2014-2018 ........................................................................... 8 Figure 8 Canada’s Lobster Exports by Destination, 2018 ($M) ................................................ 9 Figure 9 Canada’s Crab Exports, 2014-2018 ............................................................................. 10 Figure 10 Canada’s Crab Exports by Destination, 2018 ($M) ................................................ 11 Figure 11 Canada’s Salmon Exports, 2014-2018 ....................................................................... 12 Figure 12 Canada’s Salmon Exports by Destination, 2018 ($M) ............................................ 12 Figure 13 Canada’s Fish and Seafood Imports, 2014-2018 .................................................... 16 Figure 14 Canada’s Fish and Seafood Imports by Origin, 2018 ($M) ................................... 17 Figure 15 Canada’s Fish and Seafood Imports by Species, 2018 ($M) ................................ 19

CANADA’S FISH AND SEAFOOD TRADE, 2018 March 2019
1
CANADA’S FISH AND SEAFOOD EXPORTS In 2018, Canada’s fish and seafood exports were valued at $6.92B with an increase of $62M (+1 per cent) from the previous year. Quantity of exports was 600 thousand tonnes with a 3 per cent decline from the previous year, while Canadian fish and seafood export prices increased 4 per cent during the same period.
FIGURE 1 CANADA’S FISH AND SEAFOOD EXPORTS, 2014-2018
From 2014 to 2018, Canadian fish and seafood export value experienced an annual rate of growth of 9 per cent, with growth gradually slowing down since 2016. This growth was mainly driven by annual increase of prices, as Canada’s fish and seafood export prices grew by 8 per cent annually and quantity exported by 1 per cent.
TABLE 1 CANADA’S FISH AND SEAFOOD EXPORTS, 2014-2018
VALUE CHANGE CHANGE CHANGE of Exports of Values of Volumes of Prices
YEAR ($B) (%) (%) (%)
2014 4.91 11.8 -3.6 15.9
2015 5.97 21.6 8.9 11.7
2016 6.55 9.7 3.0 6.5
2017 6.86 4.7 -3.2 8.2
2018 6.92 0.9 -3.2 4.3
CAGR CAGR CAGR Average 6.24 9.0 1.2 7.6

CANADA’S FISH AND SEAFOOD TRADE, 2018 March 2019
2
CANADA’S FISH AND SEAFOOD EXPORTS BY DESTINATION In 2018, the top three destinations for Canadian fish and seafood exports in rank order of value were:
United States (US) $4.27B China $1.17B European Union (EU) $0.45B
Together, these destinations accounted for 85 per cent of Canada’s fish and seafood total export value in 2018.
In 2018, Canadian exports to the remaining destinations were valued at $1.03B, representing 15 per cent of Canada’s total fish and seafood export value. Among these, other significant destinations for Canada’s fish and seafood in 2018 were Japan ($287M), Hong Kong ($176M) and South Korea ($121M).
FIGURE 2 CANADA’S FISH AND SEAFOOD EXPORTS BY DESTINATION, 2018 ($M)
United States (largest destination) In 2018, Canada’s fish and seafood exports to the US were valued at $4.27B, accounting for 62 per cent of total Canadian fish and seafood exports by value. Canadian fish and seafood export value to the US remained nearly the same as in 2017, with a 1 per cent decrease (-$34M). Quantity of exports was 298 thousand tonnes with a 9 per cent decline from the previous year, while fish and seafood export prices to the US increased 9 per cent during the same period.
Since 2014, Canada’s exports of fish and seafood to the US grew by 9 per cent annually in value driven mostly by prices, as fish and seafood export prices grew by 8 per cent annually and quantity exported by less than 1 per cent. Although, the rate of growth of

CANADA’S FISH AND SEAFOOD TRADE, 2018 March 2019
3
export value to the US has been slowing down since 2016, the US remained by far Canada’s largest fish and seafood export destination.
In 2018, Canada’s top fish and seafood exports by value to the US were lobster ($1.52B), salmon ($1.01B) and crab ($0.83B). Together, these three species accounted for 79 per cent of total Canadian fish and seafood exports by value to the US.
FIGURE 3 CANADA’S TOP 10 FISH AND SEAFOOD EXPORTS TO THE US, 2018 ($M)
China (2nd largest destination) In 2018, China maintained its position as the 2nd most valuable export destination for Canada’s fish and seafood as Canada’s exports to China were valued at $1.17B and accounted for 17 per cent of total Canadian fish and seafood exports by value.
Canadian fish and seafood export value to China increased 23 per cent (+$216M) between 2017 and 2018. In 2018, the quantity of fish and seafood exports to China was 119 thousand tonnes with a 7 per cent increase from the previous year, while fish and seafood export prices to China increased 15 per cent during the same period.
From 2014 to 2018, the value of Canadian fish and seafood exports to China has increased at an annual growth rate of 23 per cent driven by both prices and quantities, as fish and seafood export prices and quantity exported to China each grew by 11 per cent annually.
In 2018, Canada’s top fish and seafood exports by value to China were crab ($324M), lobster ($298M) and shrimp/prawn ($205M). Together, these three species accounted for 71 per cent of total Canadian fish and seafood exports by value to China.

CANADA’S FISH AND SEAFOOD TRADE, 2018 March 2019
4
FIGURE 4 CANADA’S TOP 10 FISH AND SEAFOOD EXPORTS TO CHINA, 2018 ($M)
European Union (3rd largest destination) In 2018, Canada’s fish and seafood exports to the EU, 3rd largest export market for Canadian fish and seafood, were valued at $451M, accounting for 7 per cent of total Canadian fish and seafood exports by value.
In 2018, the largest export destination for Canada’s fish and seafood products within the EU continued to be the United Kingdom (UK) with exports valued at $96M, accounting for 21 per cent of Canadian fish and seafood exports to the EU.
Canadian fish and seafood export value to the EU decreased 10 per cent (-$49M) between 2017 and 2018. The quantity of fish and seafood exports to the EU was 49 thousand tonnes in 2018 with a 5 per cent decline since 2017, while fish and seafood export prices to the EU have also decreased by 5 per cent during the same period.
Despite the coming into force of the Canada-EU Comprehensive Economic and Trade Agreement (CETA) in 2017, the value of Canadian fish and seafood exports to the EU has decreased continuously since 2016. The value of Canada’s fish and seafood exports to the EU has indeed declined by 11 per cent in 2016, 3 per cent in 2017 and again by 10 per cent in 2018. For the most part, this decline is attributable to a drop in the quantity of shrimp/prawn exported which coincides with a decline in harvest.
In 2018, Canada’s top fish and seafood exports to the EU by value were lobster ($173M), shrimp/prawn ($123M) and scallop ($36M). Together, these three species accounted for 74 per cent of total Canadian fish and seafood exports by value to the EU.
Notably, Canadian shrimp/prawn export value to the EU was half what it was in 2015, dropping from $242M in 2015 to $123M in 2018. As mentioned previously, this decline is

CANADA’S FISH AND SEAFOOD TRADE, 2018 March 2019
5
mostly due to a drop in the quantity of shrimp/prawn harvested. However, the EU continued to be a key market for Canadian shrimp/prawn, accounting for 26 per cent of Canada’s total shrimp/prawn export value in 2018.
FIGURE 5 CANADA’S TOP 10 FISH AND SEAFOOD EXPORTS TO THE EU, 2018 ($M)
Other Destinations In 2018, Canadian exports of fish and seafood to the remaining destinations were valued at $1.03B, representing 15 per cent of Canada’s total fish and seafood export value. Among these, the main other destinations for Canada’s fish and seafood were Japan ($287M), Hong Kong ($176M) and South Korea ($121M).
Japan, as the 4th largest export market for Canadian fish and seafood, remained a valuable destination. Canada’s top fish and seafood exports by value to Japan were crab ($61M of which 99 per cent was snow crab), salmon ($58M) and lobster ($47M). Together, these three species accounted for 58 per cent of total Canadian fish and seafood exports by value to Japan. Notably, crab exports to Japan jumped to a peak value of $113M in 2017, but then returned to $61M in 2018, a value closer to the average over the last number of years. Export quantity of crab to Japan also peaked and then decreased during the same period, while export prices increased by 2 per cent. Export values of lobster (-21 per cent) and herring (-32 per cent) have also dropped considerably in 2018, while the value of salmon exports to Japan increased 61 per cent (from $36M in 2017 to $58M in 2018).
In 2018, Hong Kong remained the 5th most valuable destination for Canadian fish and seafood exports. By value, the top species exported to Hong Kong in 2018 were eel ($73M), lobster ($34M) and geoduck ($17M). From 2017 to 2018, exports of lobster to Hong Kong decreased significantly both in quantity and value, while the exported quantity and value of eel doubled. In 2018, Hong Kong was Canada’s top export

CANADA’S FISH AND SEAFOOD TRADE, 2018 March 2019
6
destination for eel, accounting for 82 per cent of the total value of eel exports. Essentially all (99.8 per cent by value) eels exported to Hong Kong were live eels.
In 2018, South Korea surpassed Viet Nam as the 6th largest export destination by value for Canadian fish and seafood. In 2018, Canada’s top species exported to South Korea by value was, by far, lobster ($107M), accounting for 88 per cent of Canada’s total fish and seafood export value to South Korea. Notably, the value of exports of Canadian lobster to South Korea almost quadrupled over the past five years, from $28M in 2014.
After experiencing significant growth in recent years, Canadian exports of fish and seafood to Viet Nam declined considerably between 2017 and 2018, both in terms of quantity (-65 per cent) and value (-56 per cent). Fish and seafood exports to Viet Nam went from $137M in 2017 down to $60M in 2018. In particular, lobster exports to Viet Nam declined from $44M in 2017 to $7M in 2018, exports of halibut from $31M to $6M and those of Greenland turbot from $27M to $4M.
TABLE 2 CANADA’S TOP 10 FISH AND SEAFOOD EXPORTS BY DESTINATION, 2018
VALUE CHANGE CHANGE CHANGE SHARE of Exports of Values of Volumes of Prices of Exports
DESTINATION ($M) (%) (%) (%) (%)
US 4,270 -0.8 -9.0 9.0 61.7
China 1,169 22.7 7.0 14.6 16.9
EU 451 -9.8 -5.0 -5.0 6.5
Japan 287 -17.6 -16.8 -1.0 4.2
Hong Kong 176 -5.8 -36.4 48.1 2.5
South Korea 121 12.4 5.7 6.3 1.7
Viet Nam 60 -56.1 -65.0 25.6 0.9
Taiwan 57 42.6 68.0 -15.1 0.8
Ukraine 51 99.5 98.3 0.6 0.7
Indonesia 36 5.3 -9.6 16.6 0.5
Other 244 8.9 19.7 -9.0 3.5
Total 6,923 0.9 -3.2 4.3 100.0

CANADA’S FISH AND SEAFOOD TRADE, 2018 March 2019
7
CANADA’S FISH AND SEAFOOD EXPORTS BY SPECIES In 2018, Canada’s top three fish and seafood exports in rank order of value were:
lobster $2.22B crab $1.31B salmon $1.19B
Together, these three species accounted for 68 per cent of total Canadian fish and seafood exports by value.
Canadian exports of other species were valued at $2.20B, almost a third of Canada’s total fish and seafood export value. The main other species exported in 2018 were shrimp/prawn ($469M), halibut ($178M) and clam and geoduck ($175M).
FIGURE 6 CANADA’S FISH AND SEAFOOD EXPORTS BY SPECIES, 2018 ($M)
Lobster (largest export) In 2018, Canada’s lobster exports were valued at $2.22B, representing 32 per cent of Canada’s total fish and seafood export value. Lobster exports consisted of frozen (52 per cent by value) and live (44 per cent) lobster as well as other products (4 per cent).
In 2018, Nova Scotia ($1.03B) and New Brunswick ($0.84B) continued to be the main provinces exporting lobster products with 46 and 38 per cent, respectively, of total lobster export share by value. They were followed by Prince Edward Island ($174M), Quebec ($113M) and Newfoundland and Labrador ($61M), sharing respectively 8, 5 and 3 per cent of Canada’s lobster export value in 2018.
Canada’s lobster export value increased by 5 per cent (+$99M) between 2017 and 2018, while quantity and export prices of lobster increased by 1 and 3 per cent respectively.

CANADA’S FISH AND SEAFOOD TRADE, 2018 March 2019
8
Since 2014, the value of Canada’s lobster exports experienced an annual growth rate of 10 per cent. During the same period, quantity of lobster exported increased by 4 per cent annually, while export prices of lobster increased by 6 per cent per annum. Most of the growth in both quantity and value occurred from 2014 to 2015, concurrent with a significant weakening of the Canadian dollar in a backdrop of strengthening demand for lobster in Asia.
FIGURE 7 CANADA’S LOBSTER EXPORTS, 2014-2018
In 2018, the US ($1.52B) remained by far the largest destination for Canada’s exports of lobster, representing 68 per cent of Canada’s total lobster export value. By value, Canada’s lobster exports to the US consisted of a mix of frozen lobster (65 per cent in 2018), live lobster (34 per cent) and other lobster products (less than 1 per cent). It is important to note that Canada, mainly the province of New Brunswick, imports large amounts of live lobster from the US for processing which is then destined for export back to the US market. Lobster trade flow between the US and Canada reflects a strong integration in the two countries’ lobster sector and added value opportunities. Canada’s lobster export value to the US increased by 5 per cent (+$74M) between 2017 and 2018, while quantities exported declined by 3 per cent, and export prices of lobster to the US increased by 8 per cent.
With an annual growth rate of 40 per cent since 2014, Canada’s lobster exports to China were valued at $298M in 2018. China remained the 2nd largest destination for Canada’s lobster exports, having surpassed the EU in 2017, and accounting for 13 per cent of Canada’s total lobster export value in 2018. The majority of Canadian lobster was exported live (86 per cent by value in 2018) to China.

CANADA’S FISH AND SEAFOOD TRADE, 2018 March 2019
9
Canada’s lobster exports to the EU, Canada’s 3rd largest destination for lobster by value, were valued at $173M in 2018. Canada’s exports of lobster to the EU consisted of live (50 per cent by value in 2018) and frozen (49 per cent) lobster. After reaching a peak of $192M in 2016, the value of Canada’s exports of lobster to the EU has been decreasing since. In 2018, Canada’s value of lobster exports to the EU decreased by 4 per cent (-$7M) from the previous year. This decline was mostly attributable to a decrease in quantity exported (-5 per cent) as export prices of lobster to the EU experienced a 2 per cent increase during the same period.
Notably, Canada’s lobster exports to South Korea ($107M in 2018) have been rising in importance, with annual growth of 40 per cent in value since 2014.
FIGURE 8 CANADA’S LOBSTER EXPORTS BY DESTINATION, 2018 ($M)
Crab (2nd largest export) In 2018, Canada’s crab exports were valued at $1.31B, representing 19 per cent of Canada’s total fish and seafood export value. By value, 67 per cent of exported Canadian crab was identified as frozen snow crab6.
In 2018, Newfoundland and Labrador ($393M), Nova Scotia ($273M), New Brunswick ($237M) and Quebec ($222M) shared the majority (86 per cent by value) of Canadian crab exports.
In 2018, Canada’s crab export value decreased 11 per cent (-$169M) from a notable peak in the previous year. This decline was attributable to a decrease in the quantity
6 In 2018, 18 per cent ($239M) of Canada’s crab exports were labelled as unspecified frozen crab, which, based on
exporting provinces and Canadian crab species landings data, would mostly be snow crab.

CANADA’S FISH AND SEAFOOD TRADE, 2018 March 2019
10
exported (-21 per cent) as crab export prices increased 11 per cent during the same period.
Despite the 2018 decrease, the value of Canadian exports of crab has grown at an annual rate of 10 per cent since 2014. Crab export prices have increased 16 per cent annually, while quantity exported decreased by 5 per cent during the same period. The changes in exported quantities reflect a similar pattern in quantities landed in Canada's fisheries.
FIGURE 9 CANADA’S CRAB EXPORTS, 2014-2018
In 2018, the US ($833M) remained the largest export destination for Canadian crab, representing 64 per cent of total crab export value, followed by China ($324M) and Japan ($61M), respectively representing 25 per cent and 5 per cent of Canadian crab exports by value.
While 84 per cent of Canadian crab export value to the US was frozen snow crab7, Canada’s crab export value to China was a combination of frozen (55 per cent) and fresh (44 per cent) crab. British Columbia ($146M), Nova Scotia ($85M) and Newfoundland and Labrador ($70M) were the main provinces exporting crab products to China, accounting for 93 per cent of Canada’s crab export value to China in 2018. British Columbia’s exports of crab to China consisted principally of “live, fresh or chilled crabs”, while Nova Scotia and Newfoundland and Labrador mostly exported frozen snow crab. A previously noted, crab exports to Japan jumped to a peak value of $113M in 2017, but then returned to $61M in 2018, a value closer to the average over the last number of years. Export quantity of crab to Japan also peaked and then decreased between 2017 and 2018, while exports prices increased 2 per cent during 7 In 2018, 11 per cent ($94M) of Canada’s crab exports to the US was labelled as unspecified frozen crab which, based
on exporting provinces and Canadian crab species landings data, would mostly be snow crab.

CANADA’S FISH AND SEAFOOD TRADE, 2018 March 2019
11
the same period. In 2018, New Brunswick ($22M) and Nova Scotia ($21M) were the main provinces exporting crab to Japan, representing 36 and 35 per cent of Canada’s total crab export value to Japan respectively. Quebec ($15M) and Newfoundland and Labrador ($3M) followed, sharing respectively 24 and 5 per cent of total crab export value to Japan. In 2018, virtually all of Canadian crab exported to Japan was frozen snow crab.8
FIGURE 10 CANADA’S CRAB EXPORTS BY DESTINATION, 2018 ($M)
Salmon (3rd largest export) In 2018, Canadian salmon exports were valued at $1.19B and represented 17 per cent of Canada’s total value of fish and seafood exports. By value, 82 per cent of Canada’s exports of salmon was Atlantic salmon, which is commercially produced only from aquaculture.
In 2018, British Columbia ($736M) and New Brunswick ($415M) were practically the only exporting provinces of salmon products, sharing respectively 62 and 35 per cent of Canada’s total salmon exports by value.
In 2018, Canada’s salmon export value increased 9 per cent (+$99M) from the previous year. This growth in the value of Canada’s exports of salmon was primarily attributable to an increase in export prices (+7 per cent) as quantity of salmon exported increased 2 per cent during the same period.
8 In 2018, 71 per cent ($44M) of Canada’s crab exports to Japan was labelled as frozen snow crab and another 27 per
cent ($16M) was labelled as unspecified frozen crab, which, based on exporting provinces and Canadian crab species landings data, would mostly be snow crab.

CANADA’S FISH AND SEAFOOD TRADE, 2018 March 2019
12
Since 2014, Canadian salmon exports have grown at an annual rate of 16 per cent in value, with growth attributable to both a 9 per cent annual increase in salmon export prices and a 7 per cent annual growth in quantity of salmon exported.
FIGURE 11 CANADA’S SALMON EXPORTS, 2014-2018
In 2018, the US continued to be the largest export destination for Canadian salmon, representing 85 per cent ($1.01B) of Canada’s total salmon export value, followed (distantly) by China ($60M) and Japan ($58M), both accounting for 5 per cent of total Canadian salmon export value.
FIGURE 12 CANADA’S SALMON EXPORTS BY DESTINATION, 2018 ($M)

CANADA’S FISH AND SEAFOOD TRADE, 2018 March 2019
13
Other Species In 2018, Canadian exports of species other than lobster, crab and salmon were valued at $2.20B, representing 32 per cent of Canada’s total fish and seafood export value. The main other species exported in rank order of value were:
shrimp/prawn $469M halibut $178M clam and geoduck $175M scallop $163M herring $153M hake $116M eel $90M
Canadian export value of shrimp/prawn decreased 0.3 per cent (-$1M) between 2017 and 2018. Although there was a 3 per cent drop in the quantity of shrimp/prawn exported, export prices for shrimp/prawn increased 3 per cent during the same period. The value of Canada’s shrimp/prawn exports to China overtook those to the EU in 2017. Thus, in 2018, Canadian exports of shrimp/prawn were mainly destined towards China ($205M) and the EU ($123M) who shared respectively 45 and 26 per cent of Canada's shrimp/prawn exports by value. The majority (84 per cent by value) of Canadian shrimp/prawn exported in 2018 consisted of frozen cold-water shrimps and prawns.
Canadian exports of halibut were valued at $178M in 2018, with the US ($128M) accounting for 72 per cent of Canada’s total halibut export value. Canadian exports of halibut consisted of either fresh (67 per cent of export value) or frozen (33 per cent) halibut in 2018.
In 2018, Canada exported $120M of clam and $55M of geoduck. Nova Scotia ($86M) and Newfoundland and Labrador ($19M) were the main exporting provinces of clam products, while British Columbia ($55M) was essentially the sole exporter of geoduck. In 2018, most of Canada's geoduck exports were destined for China ($30M), Hong Kong ($17M) and Macao ($8M), and consisted of live, fresh or chilled geoduck.
Notably, Canadian export value for hake increased 30 per cent in value, from $89M in 2017 to $116M in 2018. Also, during the same period, Canadian exports of eel doubled in value, from $45M in 2017 to $90M in 2018. By value, essentially all (98 per cent) of Canadian exports of eel were live and 82 per cent were destined for Hong Kong ($73M).

CANADA’S FISH AND SEAFOOD TRADE, 2018 March 2019
14
TABLE 3 CANADA’S TOP 10 FISH AND SEAFOOD EXPORTS BY SPECIES, 2018
VALUE CHANGE CHANGE CHANGE SHARE of Exports of Values of Volumes of Prices of Exports
SPECIES ($M) (%) (%) (%) (%)
Lobster 2,223 4.7 1.4 3.2 32.1
Crab 1,306 -11.4 -20.5 11.5 18.9
Salmon 1,191 9.1 1.6 7.3 17.2
Shrimp/Prawn 469 -0.3 -2.9 2.7 6.8
Halibut 178 7.0 7.4 -0.4 2.6
Clam and Geoduck 175 3.4 -6.0 10.0 2.5
Scallop 163 -9.6 -1.8 -8.0 2.3
Herring 153 -14.7 -20.7 7.5 2.2
Hake 116 30.1 26.8 2.6 1.7
Eel 90 100.4 10.4 81.6 1.3
Other 859 -1.4 -6.0 4.9 12.4
Total 6,923 0.9 -3.2 4.3 100.0

CANADA’S FISH AND SEAFOOD TRADE, 2018 March 2019
15
CANADA’S FISH AND SEAFOOD EXPORTS BY PROVINCE AND TERRITORY In 2018, the top fish and seafood exporting Canadian provinces were Nova Scotia ($2.03B), New Brunswick ($1.66B), British Columbia ($1.39B) and Newfoundland and Labrador ($0.94B), accounting for 87 per cent of Canada’s total fish and seafood exports by value.
TABLE 4 CANADA’S FISH AND SEAFOOD EXPORTS BY PROVINCE AND TERRITORY, 2018 VALUE QUANTITY MAIN SPECIES
PROVINCE AND TERRITORY ($M) (thousand tonnes) Share* %
Nova Scotia 2,034 141 Lobster Crab Shrimp/Prawn
50.7 13.4
6.8
New Brunswick 1,662 104 Lobster Salmon Crab
50.6 25.0 14.2
British Columbia 1,391 186 Salmon Crab Hake
52.9 11.4
7.4
Newfoundland and Labrador
936 104 Crab Shrimp/Prawn Lobster
42.0 25.5
6.5
Quebec 416 21 Crab Lobster Shrimp/Prawn
53.4 27.1
6.3
Prince Edward Island 266 22 Lobster Mussel Crab
65.4 16.7
7.9
Ontario 150 14 Eel Pickerel Perch
24.8 10.8
8.5
Manitoba 64 7 Whitefish Pike Carp
17.4 3.5 0.5
Other 6 1 Shrimp/Prawn Halibut Lobster
10.0 3.4 2.2
* of province’s fish and seafood exports

CANADA’S FISH AND SEAFOOD TRADE, 2018 March 2019
16
CANADA’S FISH AND SEAFOOD IMPORTS In 2018, Canada’s fish and seafood imports were valued at $3.97B with an increase of $105M (+3 per cent) from the previous year. Quantity of fish and seafood imports was 520 thousand tonnes with a 3 per cent decline from the previous year, while fish and seafood import prices have increased 5 per cent during the same period.
FIGURE 13 CANADA’S FISH AND SEAFOOD IMPORTS, 2014-2018
From 2014 to 2018, Canadian fish and seafood import value experienced an annual rate of growth of 4 per cent. This growth was mainly driven by annual price increases, as fish and seafood import prices grew 4 per cent annually and quantity of fish and seafood imported remained stable.
TABLE 5 CANADA’S FISH AND SEAFOOD IMPORTS, 2014-2018
VALUE CHANGE CHANGE CHANGE of Imports of Values of Volumes of Prices
YEAR ($B) (%) (%) (%)
2014 3.35 13.5 3.9 9.2
2015 3.52 4.9 -2.1 7.1
2016 3.77 7.3 4.3 2.9
2017 3.86 2.4 0.5 1.8
2018 3.97 2.7 -2.6 5.5
CAGR CAGR CAGR Average 3.69 4.3 0.0 4.3

CANADA’S FISH AND SEAFOOD TRADE, 2018 March 2019
17
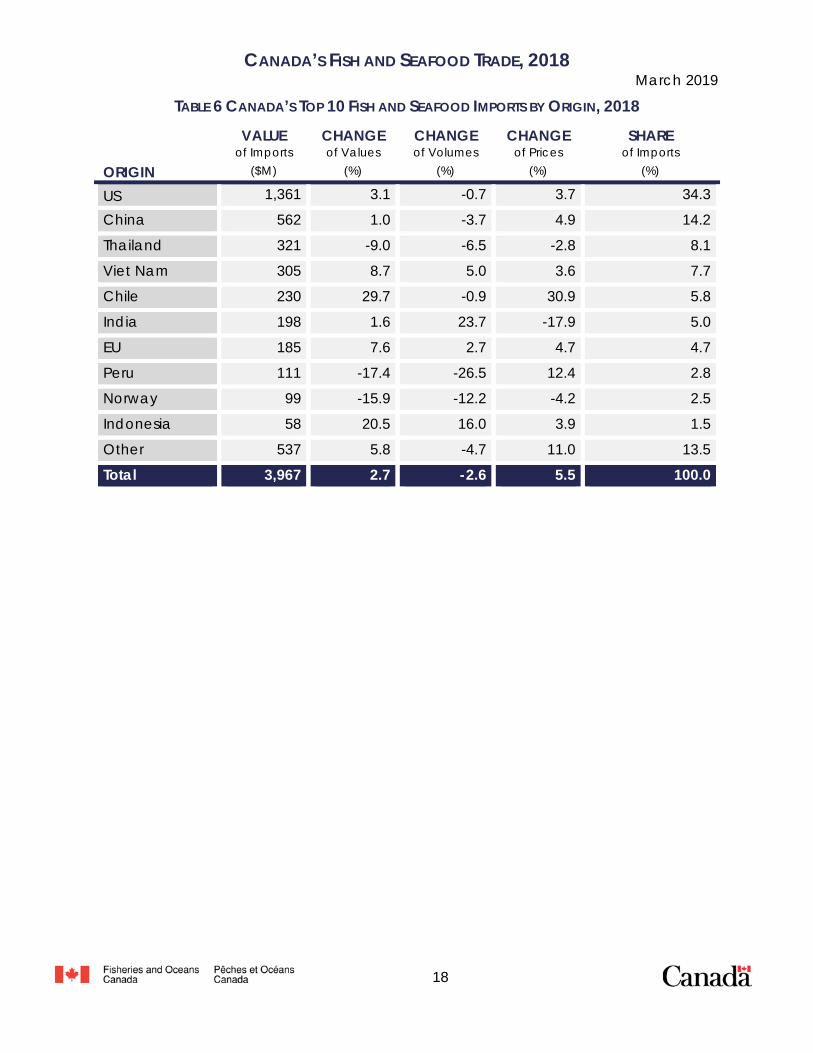
CANADA’S FISH AND SEAFOOD IMPORTS BY ORIGIN In 2018, the top three suppliers of fish and seafood to Canada in rank order of value were:
the US $1.36B China $0.56B Thailand $0.32B
Together, these countries accounted for 57 per cent of Canada’s total fish and seafood import value in 2018, with the US alone accounting for 34 per cent of total import value.
FIGURE 14 CANADA’S FISH AND SEAFOOD IMPORTS BY ORIGIN, 2018 ($M)
In 2018, Canadian fish and seafood imports from other suppliers were valued at $1.72B, representing 43 per cent of Canada’s total fish and seafood import value. Other important suppliers of fish and seafood in 2018 were Viet Nam ($305M), Chile ($230M) and India ($198M). Notably, the value of fish and seafood imports from Chile increased 30 per cent (+$53M) from 2017 due to increased import prices, with salmon being the main species (82 per cent by value) imported.
CANADA’S FISH AND SEAFOOD TRADE, 2018 March 2019
18
TABLE 6 CANADA’S TOP 10 FISH AND SEAFOOD IMPORTS BY ORIGIN, 2018
VALUE CHANGE CHANGE CHANGE SHARE of Imports of Values of Volumes of Prices of Imports
ORIGIN ($M) (%) (%) (%) (%)
US 1,361 3.1 -0.7 3.7 34.3
China 562 1.0 -3.7 4.9 14.2
Thailand 321 -9.0 -6.5 -2.8 8.1
Viet Nam 305 8.7 5.0 3.6 7.7
Chile 230 29.7 -0.9 30.9 5.8
India 198 1.6 23.7 -17.9 5.0
EU 185 7.6 2.7 4.7 4.7
Peru 111 -17.4 -26.5 12.4 2.8
Norway 99 -15.9 -12.2 -4.2 2.5
Indonesia 58 20.5 16.0 3.9 1.5
Other 537 5.8 -4.7 11.0 13.5
Total 3,967 2.7 -2.6 5.5 100.0

CANADA’S FISH AND SEAFOOD TRADE, 2018 March 2019
19
CANADA’S FISH AND SEAFOOD IMPORTS BY SPECIES In 2018, the top three species imported to Canada in rank order of value were:
shrimp/prawn $689M salmon $672M lobster $390M
Together, these species accounted for 44 per cent of Canada’s total fish and seafood import value in 2018.
FIGURE 15 CANADA’S FISH AND SEAFOOD IMPORTS BY SPECIES, 2018 ($M)
In 2018, the top suppliers by value of shrimp/prawn to Canada were Viet Nam (30 per cent), India (25 per cent) and China (17 per cent), with imports valued respectively at $205M, $176M and $114M. By value, most shrimp/prawn imported to Canada in 2018 were frozen.
The US (53 per cent) and Chile (28 per cent) were Canada’s main providers of salmon in 2018, with import values of $356M and $188M respectively. Imports of salmon to Canada consisted primarily of fresh (29 per cent by value) or frozen (21 per cent) fillets.
With 99 per cent of total lobster import value to Canada, the US ($387M in 2018) is considered the sole provider of lobster to Canada. Large quantities of live lobster are in fact imported to Canada from the US for processing into products which are then destined for export back to the US market. After decreasing 31 per cent between 2016 and 2017, Canada’s lobster import value from the US recovered in 2018, with a 29 per cent increase.
Homarus lobster species are principally caught in Canada and the US, who essentially share all the supply of American lobster (Homarus americanus). Small amounts of

CANADA’S FISH AND SEAFOOD TRADE, 2018 March 2019
20
another Homarus species of lobster, the European lobster (Homarus gammarus), are also caught in the EU. Contrary to the rock or spiny lobsters9, which have no large edible claws, the Homarus specie of lobster is clawed and the meat in its claws, body, and tail is commercialized. In contrast, the rock or spiny lobster only has marketable meat in its tail. Another clawed lobster species, the Norway lobster10, also forms an important global catch, but the species is much smaller and is sold separately on markets, mainly within the EU.
In 2018, Canadian imports of species other than shrimp/prawn, salmon and lobster were valued at $2.22B or 56 per cent of Canada’s total fish and seafood import value. The main other species imported in 2018 were tuna ($287M), crab ($165M) and cod ($105M).
TABLE 7 CANADA’S TOP 10 FISH AND SEAFOOD IMPORTS BY SPECIES, 2018
VALUE CHANGE CHANGE CHANGE SHARE of Imports of Values of Volumes of Prices of Imports
SPECIES ($M) (%) (%) (%) (%)
Shrimp/Prawn 689 -2.8 2.0 -4.7 17.4
Salmon 672 5.0 -1.7 6.8 16.9
Lobster 390 28.7 16.6 10.3 9.8
Tuna 287 4.7 -0.9 5.7 7.2
Crab 165 2.0 5.0 -2.9 4.2
Cod 105 7.5 2.6 4.7 2.6
Squid 91 -8.6 -8.9 0.4 2.3
Scallop 88 -9.4 -2.0 -7.5 2.2
Trout 75 -14.1 -6.6 -8.1 1.9
Halibut 50 -5.1 16.5 -18.6 1.3
Other 1,355 1.1 -5.8 7.4 34.2
Total 3,967 2.7 -2.6 5.5 100.0
9 Of the Palinuridae family 10 Nephrops norvegicus

CANADA’S FISH AND SEAFOOD TRADE, 2018 March 2019
21
Note: In preparing this document, the authors have taken care to provide information that is timely and accurate at the time of publication. Since exports market conditions are dynamic, some information presented here may have changed since this document was published. Information contained in this document does not necessarily reflect official policies of Fisheries and Oceans Canada.
Prepared by: Economic Policy and Research Division, Economic Analysis and Statistics Directorate, Fisheries and Oceans Canada, Ottawa
For more information: Please email InfoECON (DFO/MPO): [email protected]
© Her Majesty the Queen in Right of Canada, 2019
Information contained in this publication or product may be reproduced, in part or in whole, and by any means, for personal or public non-commercial purposes, without charge or further permission, unless otherwise specified.