can weather index drought insurance benefit to least ...€¦ · this index should not be...
TRANSCRIPT

1
Can weather index drought insurance benefit to Least Developed Countries' farmers? A case study on Burkina Faso
Alexis Berg (LOCEAN-IPSL), Philippe Quirion* (CIRED-CNRS and LMD-IPSL), Benjamin Sultan (LOCEAN-IPSL)
Abstract
By using a detailed agricultural and climate dataset over Burkina-Faso and very simple assumptions regarding the form of an insurance contract, we investigate the potential feasibility and interest for farmers of a weather-index insurance system in this country. To do so, we explore the results of more than 3.000 simulated contracts applied to 30 districts, 21 years (1984-2004) and 5 crops (cotton, millet, sorghum, maize and groundnut). We find that such an insurance system, even based on a simple weather index like cumulative rainfall during the rainy season, can present a significant economic efficiency. The determinants of the efficiency of such contracts are the correlation between the weather index and yields and the year-to-year variability of the yield. As a consequence of these two determinants, the farmer’s gain from an insurance contract is higher in the driest part of the country. In the same way, maize and groundnuts are the most suitable to implement an insurance system since their respective yields show a large variance and a generally high correlation with the weather index.
We also explore some limits of such insurance contracts. The spatial scale appears to be key issue since the interest of the insurer is likely to have the largest area included in the same contract to cut transaction costs while the high spatial variability of rainfall strongly limits the scale at which one can reasonably implement an insurance contract based on a single weather index. Here we suggested that the district scale (around 7000 km² in average) is the maximum scale appropriate for a single weather index insurance contract. Another important difficulty is the necessity to update, over time, the parameters that define the insurance contract, if the weather index happens to show a trend. In the context of a changing climate, this clearly poses difficulty to the implementation of an insurance system. We suggest a simple “append” method that could be efficient to update the insurance contracts.
* contact author. [email protected]

2
1. Introduction
In the Sudano-Sahelian part of Western Africa, rainfed crop production remains the principal source of households' food and income: 70% of the income according to Abdulai and CroleRees (2001) in Southern Mali, 76% according to Reardon et al. (1992) in Burkina Faso. This production is highly sensitive to climate as means to control the crop environment are largely unavailable to farmers: irrigation is rarely an option (4 percent of cultivated land in Sub-Saharan Africa according to the World Bank, 2007) and use of mechanization, fertilizers, and other off-farm inputs is low (Ingram et al. 2002). Hence African farmers are vulnerable to climate fluctuations and "bad" rainy seasons often have catastrophic consequences. This vulnerability is aggravated by a food deficit crisis resulting from a rapidly growing population combined with stagnant yields of pearl millet, the main source of food and income of the Sahelian people, over the last the last few decades (De Rouw 2004) leading to a decrease of food production per capita (World Bank 1997). In addition, the long-term drought of the last decades (Nicholson 1986), and global climate change further increases the uncertainty of the region’s development (Bazzaz and Sombroek 1996). To protect themselves against adverse effects of climate variability, West African farmers engage in a variety of risk management and coping strategies, e.g., through income diversification, crop diversification, livestock holdings, crop storage and informal credits (Cf. Sakurai and Reardon, 1997, and references therein). However, as shown by Sakurai and Reardon (1997), these strategies suffer from severe inadequacies, and drought insurance might be a way to mitigate these adverse events, by providing an indemnity to farmers in dry years.
Traditional agricultural insurance, based on damage assessment, suffers from an information asymmetry between the farmer and the insurer, especially moral hazard, and from the cost of damage assessment. As a consequence, such insurances are limited to very specific risks (e.g., frost or hail) or exist only thanks to massive subsidies by public authorities, as in the United States or Canada (Hartell et al., 2006). Naturally, low income countries governments do not have the financial resources to distribute such subsidies. An emerging alternative is insurance based on a weather index, e.g., cumulative rainfall over the rainy season. In such a scheme, the farmer pays an insurance premium every year, and receives an indemnity if the weather index falls below a pre-determined level (the "strike"). It does not suffer from the two shortcomings mentioned above, but its weakness is the "basis risk", i.e., the necessarily imperfect correlation between the weather index and the yield. For example, in Sahel, crop yield are generally positively correlated with rainfall, but there may be relatively wet years with a lower than average yield and vice-versa. If the case arises too frequently, meaning that rainfall is a poor predictor for yield, then the basis risk is too large and an insurance based on this index should not be implemented. Such weather index insurances and weather derivatives (similar risk-transfer mechanisms on the financial markets) have been first used by energy suppliers in North America since the late 1990's, to hedge against a loss in profitability induced by an abnormal weather (Hartell et al., 2006). Since 2003, at last two such insurance products have been provided for developing countries farmers: in India since 2003 and in

3
Malawi since 20051. These insurance products have encountered a growing success, with 250 000 policies sold in India in 2005-06, with a premium volume of US$ 17 million, according to Barnett and Mahul (2007), who provide a survey of weather index insurance policies in middle- and lower-income countries. At least ten such insurance policies are currently under development (Barnett and Mahul, 2007).
Although interesting economic and scientific questions arise concerning the use of weather derivatives in agricultural insurance and policy, there are a limited number of articles on the subject in scientific journals. For instance, Giné et al. (2007), using historical rainfall data since 1970, analyse the statistical distribution of indemnities in the case of the weather-index insurance system implemented in India in 2003: they suggest that this contract acts like a disaster insurance, infrequently paying an indemnity, but providing a very high payout during the most extreme rainfall events. More generally, Skees et al. (2007) consider how the use of index-based risk transfer products could improve micro-lending in Peru and Vietnam, while Chantarat et al. (2007) suggests using weather index insurance to improve drought response for famine prevention in Kenya. However, the literature on this topic consists essentially on reports and feasibility studies (e.g., Skees et al., 2001) written by consultants and international organisations. While these professional reports provide useful information, they generally analyse insurance contracts designed following a rule-of-thumb rather than optimised. Moreover, these studies generally focus on a single location and a few crops and do not provide any information on the possible scope of such insurance contracts regarding crops and space.
In the present study, we take a more general approach and use an extended crop and weather dataset in order to evaluate the potential and feasibility of weather index insurance over a whole country for the main crops. To do so, we simulate insurance contracts that are optimal from the farmer’s point of view, under some simple and common assumptions regarding the form of the insurance contract, a participation constraint by the insurer and the utility function of the representative farmer. We chose Burkina Faso as a case study for two reasons. First, the large spatial variability of mean annual rainfall across the country (roughly from 400 to 1100 mm/year, from the North to the South) allows analysing contrasted agricultural situations. Second, Burkina Faso is unique among Western African countries by the availability of an agricultural database that covers 1984-2004 and presents a high spatial resolution (45 districts, or "provinces", of 7000 km² in average). We simulate such contracts for 30 districts of Burkina Faso and for five crops: cotton, millet, sorghum, maize and groundnut, taking the cumulative rainfall as the weather index. We also use rainfall from a dataset of around 150 weather stations obtained from the regional centre Agrhymet thanks to the AMMA (African Monsoon Multidisciplinary analysis) project2.
1 Drought index insurances are also in place in Mexico and Ethiopia but the insured parties are respectively State governments and the World food program, not individual farmers. 2 http://amma-international.org/

4
We mainly address four questions: 1) For what crops and in what locations are such insurances the most interesting? 2) Is a given contract suitable for different crops? 3) What is the geographic scope for a given insurance contract? 4) Is it possible to deal with non-homogeneity in climate time series (e.g. trends) that is expected in the context of climate change?. It is important to notice that since the four questions addressed above are generic questions, we believe that the answers should not depend much on the particular assumptions of our insurance contract and on the case study chosen for this paper and can be extended to other insurance contracts and other tropical countries.
The paper is organized as follows: section 2 presents the data, methods and assumptions, while section 3 presents and discusses the results of the simulations, addressing in turn the four questions mentioned above; section 4 concludes.
2. Material and methods
2.1. Agricultural and weather data
The Agristat agricultural database from the General Department of Agricultural Forecasts and Statistics of Burkina-Faso3 provides us with annual production, area under cultivation and yield for several crops in Burkina-Faso: millet, sorghum, cotton, groundnuts, maize, etc. from 1984 to 2004. Data is given at the district ("province") level, of which there are 45 (see map on fig.3). However, the database suffers from some missing values, with different numbers of missing values for different crops.
The Agrhymet Centre4 provides us with 1971-2006 rainfall data at a 10 days resolution from its network of rain gauges over the Sahel. We associate rainfall stations in Burkina-Faso with the corresponding districts according to their spatial coordinates. From map on fig.1, one can see that Burkina-Faso is densely sampled.
3 http://agristat.bf.tripod.com/ 4 http://www.agrhymet.ne/

5
Fig.1: Localization of the rainfall stations of the Agrhymet network over the Sahel.
As a result, there are for each crop between 23 (cotton) and 30 (millet) districts where crop data and rainfall time series are available over 1984-2004, with at most 4 missing years (1.2 missing year on average). There are between 1 and 8 rainfall stations per district. When several stations are available, we simply take the average value, since we do not have any information on the localization of cultivated areas within districts.
Prices for the different crops are taken from the RESIMAO5. Note that since we are only interested in risks related to weather, not to prices, we assume constant prices throughout the period.
2.2. Methods and assumptions
As in India and in Malawi, we consider that the insured party is an individual farmer, not a macro-level entity as in Ethiopia (cf. section 1 above). We assume a representative farmer with a Constant Relative Risk Aversion (CRRA) utility function as objective criterion, which appears appropriate to describe the farmers' behaviour, as show by the statistical tests performed by Chavas and Holt (1996) or Pope and Just (1991). Under this assumption, the farmer maximises the expected utility:
5 Réseau des Systèmes d'Information des Marchés en Afrique de l'Ouest (http://www.resimao.org).

6
{ }( ){ }( )
{ }1
, 1
, 11
i
ri
i
Log x for rEU x Mean x
for rr
−
⎡ ⎤⎧ =⎢ ⎥⎪= ⎨⎢ ⎥
≠⎪⎢ ⎥⎩ −⎣ ⎦
(1)
Where { }ix is the ensemble of possible farmer's incomes, assumed to have the same
probability of occurrence, i indicates a particular realisation, and r is the coefficient of relative risk aversion6.
The farmer's income without insurance xi is:
( )i ix a cp y c= ⋅ − (2)
Where a is the area cultivated, cp is the crop price, c is the production cost and yi is the yield, which depends on the quality of the rainy season. For { }iy we take the historical series of
yield available (at most 1984-2004) for each crop and district.
The higher is r, the more risk-averse is the farmer. The risk aversion may differ across populations, but unfortunately we did not find any empirical study on West African farmers. In other contexts, many estimates exist. According to Chavas and Holt (1996, p. 333), "previous estimates of the relative risk aversion coefficient in agriculture have varied from 0 to over 7.5, with a median estimate around 1". In particular, Binswanger (1980) and Mythili (2006) find a value close to one for Indian farmers, whose living conditions may be relatively similar to farmers from Burkina Faso. So in this paper, we take r = 1, so ( ) ( )U x Log x= .
From (2), one can compute the certainty-equivalent income (CEI), i.e. the certain income which provides the same utility as a given probability distribution of uncertain incomes.
( )( )
( ) 1 1
, 1
1 , 1r
Exp EU for rV EU
r EU for r−
=⎧⎪= ⎨− ≠⎪⎩
(3)
To give a flavour of the degree of risk aversion implied by our modelling choices, with our log utility assumption, the farmer is indifferent between on the one hand earning 100 with a probability of ½ and 200 with a probability of ½, and on the other hand earning 141 with certainty.
The farmer's income with insurance xai is:
( )i i ixa a cp y c p Indemnity= ⋅ − − + (4)
Where p is the insurance premium, assumed equal to:
[ ]1.1 ip Mean Indemnity= ⋅ (5)
6 The relative risk aversion coefficient of a utility function u(x) is defined as ( ) ( )2 2x u x u x− ∂ ∂ ∂ ∂ (Chavas
and Holt, 1996, p. 333).

7
As explained above, we compute the optimal contract for the farmer, under a participation constraint of the insurer. This constraint is that the insurer's margin is 10 % of the average indemnity. That is, the sum of annual premiums paid by the farmer is 10% higher than the sum of the indemnities he receives: this is the price of the risk transfer. Although available documents for actual weather index insurance contracts do not provide an accurate description of how insurers shape the contracts and build their margins, this 10% margin hypothesis does not seem unrealistic, and has the merit of simplicity.
We then use a typical contract shape, similar to those used in Malawi and in Ethiopia7. with two threshold (eq. 6 and fig 3): when the weather index Ii falls below the first threshold (the “strike” S), the farmer receives an indemnity, equals to the difference between the index and the strike times a "tick" P. However, the indemnity cannot be greater than a maximum value M=(S-X)*P, where X is a saturation threshold, under which indemnities do not increase any more: this is meant to account for saturation of damages when the index is too low (typically, total loss of crop production). Hence we have:
( )( )0, * ,i iIndemnity Min Max S I P M= − (6)
A contract is then described by three parameters: S, X and P.
For every crop and district, we compute the parameters S, X and P that maximise the expected utility (equation 1) and satisfy equations (4), (5) and (6). If no set of parameters can be found that increases the farmer’s utility, the solution of the optimization is “no insurance” and the gain of CEI is nil.
The weather index we consider is the cumulative annual rainfall over the district. This is quite a simple index; however, using more complex indexes, such as results from a water budget model (Ward et al. 2008) or a crop model, would have required more detailed meteorological data, such as potential evapotranspiration, or agricultural data, such as sowing dates, which were not available. Moreover, since this simple index is not adjusted to fit one particular crop production time series, it allows us to consider several different crops with the same weather index. Here, it appeared that cumulative rainfall is not a good weather index for cotton: correlations between cotton yields and annual rainfall remain low for all districts in Burkina Faso, and so are the performances of simulated insurance contracts. This is consistent with previous studies on the main climatic drivers of cotton production (Blanc et al. 2008; Sultan et al., submitted), which found that cumulative rainfall is poorly correlated to cotton yields. Hence, in the rest of the paper, we only focus on the other four crops.
However, we found it necessary to add two constraints to the optimization, in order to obtain realistic solutions: first, the annual premium can not exceed 20 % of the farmer's mean income (without insurance). This is to account for the fact that the farmer might not accept, a
7 The contracts used in India are a bit more complicated, with a third threshold (Giné et al., 2007).
8
priori, to allocate too much of his income to an insurance, even if the resulting indemnity is accordingly important. The other constraint, which is somehow related to the first one, is that the number of years when the farmer is compensated for a low income must not exceed half of the total time series. Indeed, the purpose of the insurance contract is precisely to compensate for the few worst years only: it would be pointless for the farmer to pay a high premium each year in order to receive high indemnities every two years.
We will then consider that a gain of CEI of a few percents (typically more than 2%) corresponds to an interesting contract for the insured party. Fig.2 provides an example of such a contract: the upper left panel shows the contract shape, that is, the indemnities paid to the farmers versus the cumulative rainfall (blue dotted lines show the distribution of annual rainfall). S, X and P are the three parameters of the contract (the strike S, the saturation threshold X, the tick P). The upper right panel shows the evolution of annual rainfall, and the strike (540 mm): the years when rainfall falls below this threshold, there is an indemnity. The lower right panel presents the correlation between yield and cumulative rainfall (in standardized anomalies). Lower left panel shows the indemnity in red (in FCFA, the local currency8), compared to the annual income without insurance, in grey; the annual premium is in green. Blanks correspond to years with missing data (either yield or rainfall). On this example, it appears that the worst years are well compensated (red bars); the gain in CEI is then of 3.01%, with an annual premium of 11000 FCFA.
8 1 euro = 655,96 FCFA (CFA francs).

9
Fig.2: contract for sorghum, district of Bam, over 1984-2004. Upper left: blue lines show the distribution of annual rainfall, colour lines show the shape of the insurance contract (indemnity as a function of cumulative rainfall); upper right: full line is annual rainfall, the dotted line shows the “strike” parameter of contract (which defines the compensated years); bottom left: grey bars represent income without insurance, red bars are indemnities, and green bars show the annual premium; bottom right: yields (red) and rainfall index (blue), expressed in standardized anomalies ((X-mean(X))/std(X)).

10
3. Results and discussion
3.1 Insurance contracts on the district scale
In this section, we present the resulting contracts obtained for all districts and crops (except cotton, as explained above), over 1984-2004, and we analyse what determines their potential economic interest.
Fig.3 shows the gains of CEI on the district scale for the different crops.
Fig.3: Gains of CEI over 1984-2004, in %, for different crops, on the district scale. Figures in brackets are the counts in each interval. The grey shades are the same on the four maps. Districts in white correspond to missing data (mainly yields), that is, 15 districts out of 45.
It appears that the economic interest of the insurance contracts varies a lot across crops and districts. For all crops, most of the interesting contracts are in the northern districts of Burkina-Faso. The highest gain of CEI is obtained for maize in the province of Bam (16.9%). Tab.1 shows the mean gain of CEI over Burkina-Faso for each crop. One can see that, on average, maize and groundnuts are more interesting than millet and sorghum with respect to this criterion.

11
Millet Sorghum Maize Groundnuts
Mean country-wide gain in CEI (%), district-based contracts 0,73 0,64 3,31 1,73
Tab.1: mean gain of CEI over all districts, in %, for each crop
Fig.2, in the previous section, shows an example of a successful contract (for sorghum, on the Bam district).
However, on the whole, lots of contracts are uninteresting with respect to the gain in CEI: on a total of 114, only 24 contracts show a gain in CEI of more than 2% (see figures in brackets on fig.3) - among these, 13 are contracts for maize. For certain districts, the optimization process did not yield any contract at all: with the index we define, no insurance contract was possible (the gain of CEI is then zero). One should however notice that these figures of gain of CEI depend on the assumption made about the farmer’s risk aversion, that is, the r parameter in the utility function: a higher risk aversion yields higher gains in CEI, and conversely a lower aversion yields lower gains. In the following discussion we examine the determinants of success or failure of these contracts.
An obvious prerequisite to the success of an insurance contracts is, a priori, the validity of the chosen weather index: that is, since this index is supposed to be a surrogate to the real yield series, the strength of the correlation between the index and the yield. Indeed, if this correlation is weak, then the chances are greater that a low-yield year does not trigger any indemnity, because the index does not fall under the first “strike” threshold (first Basis Risk); or conversely that a good-yield year gets compensated for because the index is low, which means that the low index value did not prevent the farmer from reaching a correct yield, and moreover irrelevantly allowed him to be compensated (second Basis Risk).
As shown on fig.4, correlations are satisfactory on a few districts, most of the time the driest northern districts, where, unsurprisingly, cumulative rainfall is a main climatic constraint. For other districts where correlations are low, numerous reasons can be considered: first, in the wettest districts it is possible that total rainfall does not strongly limit crop productions. Second, correlations on relatively short time series (21 years, here) are unstable, and highly sensitive to any possible one-year particular mismatch. For example, a pest invasion may cause a low yield in spite of a good rainy season. Third, especially for some vast districts the localization of the rainfall stations may not correspond to the areas under cultivation, so that the rainfall index does not represent the climate experienced by the crops. Indeed, for a given crop, the gain in CEI is negatively correlated with the district area.

12
Fig.4: correlation between index and yields, over 1984-2004, by districts. Districts in white correspond to missing data (mainly yields), that is, 15 districts out of 45.
Fig.5.a presents the resulting gain in certainty-equivalent income for all districts and crops, in function of the correlation coefficient between the index and the yields time series. It appears, as expected, that gain in certainty-equivalent income is overall an increasing function of the correlation between rainfall and yield. However, conversely to what one might have expected, good correlations do not necessarily imply interesting contracts: some contracts with high correlations do not provide any interesting increase in CEI. It can also happen that to a low correlation corresponds, still, an interesting contract.
Indeed, what matters is, more than the accurate correlation between index and yield, the fact that for low-yield years the index defines an important indemnity. The correlation for high-yield years does not really matter, as long as the index is above the strike. Conversely, a high correlation might as well correspond to an uninteresting contract, if for a few low-yield years the index does not fall low enough, below the strike threshold (the correlation could then remain significant though the contract loses its interest). Hence, it appears that the relationship between insurance efficiency and index/yield correlation is not straightforward.

13
Fig.5: Gain in Certainty-Equivalent Income (CEI) in : a) as a function of correlation between index and yield for all districts and crops; b) as a function of the coefficient of variation (σ(X)/mean(X)) of yield for all districts and crops; c) as a function of the coefficient of variation of yield for each district, for contracts based on a virtual weather index that perfectly correlates to the yield series.
We then look at the relation between gain of CEI and yield variability. Fig.5.b shows that the gain in certainty-equivalent income is also an increasing function of the farmers' income variation coefficient (ratio of standard deviation by mean). Indeed, one can consider yield variability for a given crop as a measure of the risk the farmer faces when growing this crop: as expected, the insurance system is all the more efficient that the risk is greater. This relationship seems clearer than the relation between gain of CEI and index/yield correlation. Since maize appears to be the crop with the greatest income variation coefficient (tab.2), because of its greater yield variability, this partly explains its higher gains of CEI. On the contrary, millet and sorghum, for example, show lower variation coefficients, which is probably what explains why, despite sometimes fairly good correlations with annual rainfall, they present only low gains in CEI.
0
2
4
6
8
10
12
14
16
18
20
-0,4 -0,2 0 0,2 0,4 0,6 0,8 1cor
CE gain (%)
millet sorghum maize groundnut
0
2
4
6
8
10
12
14
16
18
20
0 0,1 0,2 0,3 0,4 0,5 0,6 0,7CV
CE gain (%)
millet sorghum maize groundnut
0
2
4
6
8
10
12
14
16
18
20
22
0 0,1 0,2 0,3 0,4 0,5 0,6 0,7
CV
CE gain (%)
millet sorghum maize groundnut
a b
c
0
2
4
6
8
10
12
14
16
18
20
-0,4 -0,2 0 0,2 0,4 0,6 0,8 1cor
CE gain (%)
millet sorghum maize groundnut
0
2
4
6
8
10
12
14
16
18
20
0 0,1 0,2 0,3 0,4 0,5 0,6 0,7CV
CE gain (%)
millet sorghum maize groundnut
0
2
4
6
8
10
12
14
16
18
20
22
0 0,1 0,2 0,3 0,4 0,5 0,6 0,7
CV
CE gain (%)
millet sorghum maize groundnut
0
2
4
6
8
10
12
14
16
18
20
-0,4 -0,2 0 0,2 0,4 0,6 0,8 1cor
CE gain (%)
millet sorghum maize groundnut
0
2
4
6
8
10
12
14
16
18
20
0 0,1 0,2 0,3 0,4 0,5 0,6 0,7CV
CE gain (%)
millet sorghum maize groundnut
0
2
4
6
8
10
12
14
16
18
20
22
0 0,1 0,2 0,3 0,4 0,5 0,6 0,7
CV
CE gain (%)
millet sorghum maize groundnut
a b
c

14
Millet Sorghum Maize Groundnuts
Mean yield (kg/ha) 645 775 959 726
CV 0,30 0,25 0,38 0,35
Tab.2: Arithmetic mean of millet, sorghum, maize and groundnut yields and coefficients of variation (σ(X)/mean(X)) over all districts.
To isolate this effect of yields variability on gains of CEI, we compute optimal contracts on all districts and crops, using yields as the weather index: that is, we artificially set the correlation between index and yields to one. Fig.5.c shows the corresponding gains in CEI as a function of yields variation coefficients
It shows that when the effect of the basis risk is put aside, the gain in CEI clearly depends on the yield variability – although for a given CV large differences between contracts remain. One should note that these gains represent the maximum gains in CEI that could be obtained with a “perfect” weather index on these districts. Even with such an index, the gain in CEI would remain below 2% for a number of contracts, for which the yield variation coefficient is too low.

15
Correlations between index and yields, and yields variability, thus seem to be the major determinants of the economic efficiency – or inefficiency – of the insurance contracts. But finally, these two variables mainly depend initially on the cumulative rainfall. Fig.6 shows the relations between rainfall, yield variability and index/yield correlation. These relations are, unsurprisingly, negative, meaning that the lower the average cumulative rainfall, on a given district, the more it will act as a limiting factor for crop productivity: thus the yields will be more variable, and more correlated with rainfall.
Fig.6: Yields coefficients of variation (up), and correlation between index and yields (bottom), as a function of cumulative rainfall (in mm), all crops and districts.
Hence, given the latitudinal gradient in rainfall across the country, this explains why the most effective contracts tend to be in the northern part of Burkina-Faso (fig.2): yields are more variable, and correlated to rainfall, in the north. This could imply that designing an efficient weather-index insurance system for the southern districts could be difficult, even if one
0
0,1
0,2
0,3
0,4
0,5
0,6
0,7
0 200 400 600 800 1000 1200rainfall
CV
-0,4
-0,2
0
0,2
0,4
0,6
0,8
1
0 200 400 600 800 1000 1200
rainfall
Cor

16
succeeded in computing a climatic index that would well correlate with yields, since in this part of the country yields are intrinsically less variable.

17
3.2. Is it possible to design “multi-crops” contracts?
One may also wonder about the possibility of designing a single contract for multiple crops: indeed, the typical Sahelian farmer does not grow only one type of crop, but rather a mix of several crops. It is then all the more interesting to try and insure as much of his production as possible, and for the insurer to propose him a single contract covering several crops at the same time.
However, designing a contract on the basis of a single average mix of crops (that is, optimizing the contract with a yield series averaged between several crops) potentially excludes farmers who do not grow their different crops in the corresponding proportions, as the contract might not remain optimal if applied to a different mix of crops.
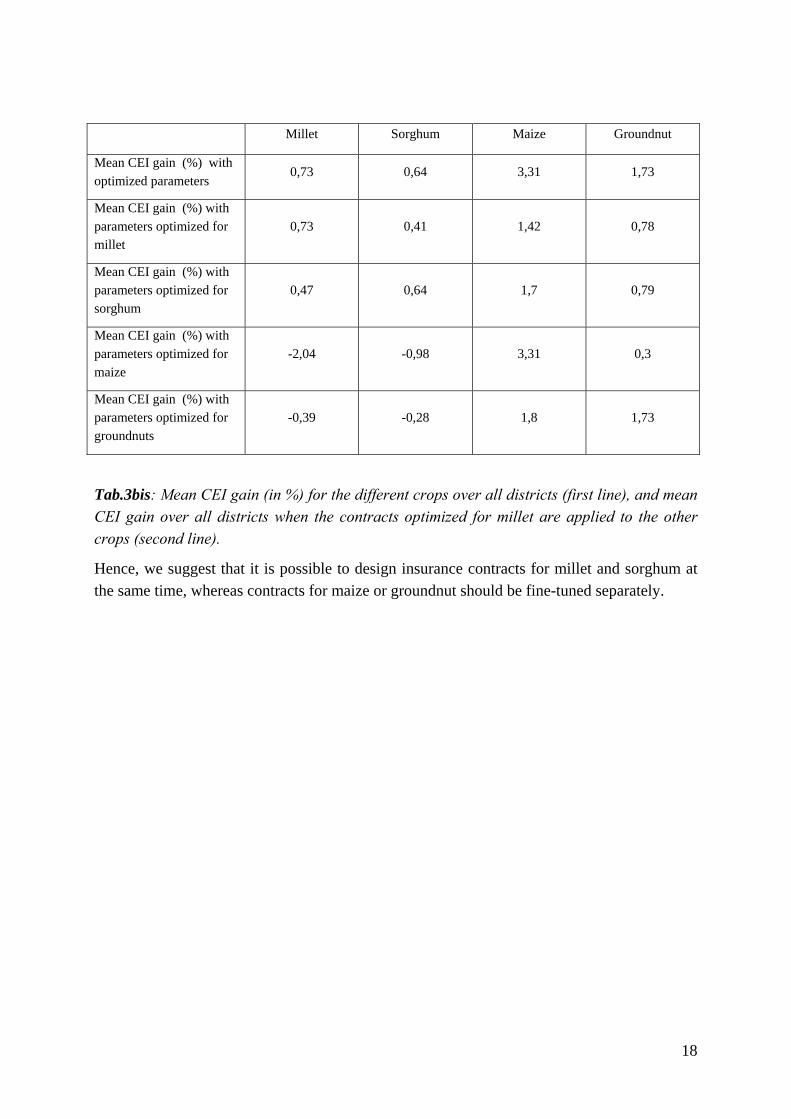
Another option is to use a single set of contract parameters for different crops. Although the sensitivity to climate of the different crops is not the same, it seems possible to separate millet and sorghum from the other crops. Indeed, millet and sorghum are both tropical cereals accustomed to hot and dry regions, robust and, to a certain extent, resistant to drought (millet being even more rustic than sorghum); whereas maize, though potentially more productive, is more sensitive to water limitation and soil fertility. It is thus sometimes grown with fertilizers. Groundnut, on the other hand, also resists well to droughts, but as a leguminous nitrogen-fixing plant its physiological response to climate is likely to differ from that of cereals. Accordingly, tab.3 shows that the correlation between crop yields, when averaged across the whole country, is the greatest for millet and sorghum. Moreover, when used for all other crops on each district, applying the parameters optimized for millet results in lower all-districts averaged CEI gains (see tab.3bis); but this decrease remains the smallest relatively for sorghum. Similarly, using sorghum parameters for all crops results in lower CEI gains, but this decrease is the smallest relatively for millet. In particular, using maize or groundnuts parameters for other crops results in strict losses of CEI for sorghum and millet.
Millet Sorghum Maize Groundnuts
Millet 1 0.67 0.36 0.38
Sorghum / 1 0.49 0.39
Maize / / 1 0.47
Tab.3: Correlation between the different crops (mean of the district-scale correlations). Correlations above 0.42 are significant at the 5% level.
18
Millet Sorghum Maize Groundnut
Mean CEI gain (%) with optimized parameters
0,73 0,64 3,31 1,73
Mean CEI gain (%) with parameters optimized for millet
0,73 0,41 1,42 0,78
Mean CEI gain (%) with parameters optimized for sorghum
0,47 0,64 1,7 0,79
Mean CEI gain (%) with parameters optimized for maize
-2,04 -0,98 3,31 0,3
Mean CEI gain (%) with parameters optimized for groundnuts
-0,39 -0,28 1,8 1,73
Tab.3bis: Mean CEI gain (in %) for the different crops over all districts (first line), and mean CEI gain over all districts when the contracts optimized for millet are applied to the other crops (second line).
Hence, we suggest that it is possible to design insurance contracts for millet and sorghum at the same time, whereas contracts for maize or groundnut should be fine-tuned separately.

19
3.3. What geographic scope for a given contract?
In the previous section we presented results at the district scale, since the raw data we used corresponded to this level. In this section, we investigate if it is possible to design insurance contracts at the regional scale: there are 13 regions in Burkina-Faso, each one regrouping 1 to 5 districts (see fig.8), with an average area of 20 000 km2. Indeed, in our apprehension of weather index insurance (where the insured party corresponds to an individual farmer inside the area covered by the insurance, not a macro-level entity), two converse aspects are to be considered when defining the geographical scope for a weather-index insurance contract. One the one hand, the larger the area insured, the more interesting for the insurer, since it reduces the number of distinct contracts he has to deal with, and simplifies the management of the insurance system. On the other hand, the geographical scope still remains limited by the necessity for the weather index to accurately represent the rainfall characteristics over the area, and thus be able to represent a surrogate to farmer's actual yields and incomes: if the region is too vast, a single weather index masks local diverse rainfall characteristics and crop yields, which cannot be embraced in one single insurance.
When designing insurance contracts at the regional level, the weather index is computed by averaging cumulative rainfall over a whole region, and is correlated with the average yield of that region (fig.7).

20
Fig.7: correlations between cumulative rainfall and yields over 1984-2004, for different crops, on the region scale. Note that compared to fig.3, districts with missing data are not represented here.
A few regions in the North seem suitable to design an interesting contract, for different crops. For instance, a contract for maize in the Central-north region allows for an 8.9% gain in CEI (fig.8). However, as for the district scale, the large majority of contracts are of little interest with respect to the gain in CEI, i.e., lower than 2%. The same relations between gain in CEI, index/yield correlation and yield variability as the ones observed on the district scale, hold up at the regional level (not shown).
Fig.8: Gains of CEI over 1984-2004, in %, for different crops, on the region scale. Figures in brackets are the counts in each interval. The grey shades are the same on the four maps. Note that compared to fig.3, districts with missing data are not represented here.
Interestingly, it appears that the mean country-wide gain in CEI for each crop is lower when considering contracts on the regional scale than with contracts on the district scale (see tab.3). Fig.3 and 8 (in particular, the distribution figures in brackets) show that it results from a smaller number of very interesting contracts. In addition to the lower correlations between index and yield on the regional scale, one reason is also, we suggest, that averaging crop data at the regional level smoothes yields variability (the coefficient of variation typically decreases by 5 percentage points). Since gains in CEI partly depend on the variance of yields and income, it hampers the relevance of insurance contracts at the regional level.

21
Millet Sorghum Maize Groundnut
Mean country-wide gain in CEI (%), district-based contracts
0.73 0.64 3.31 1.73
Mean country-wide gain in CEI (%), region-based contracts
0.43 0.59 2.55 0.9
Mean country-wide gain in CEI (%), region-based contracts applied to inner districts
0,15 0,16 1,95 0,44
Tab.4: Mean CEI gain (in %) for the different crops over all the Burkina-Faso with district-based contracts (first line), region-based contracts (second line), or applying region-based contracts to the corresponding districts (third line).
Moreover, applying these regional contracts to the yield series of the individual districts (that is, adding the indemnities and premiums defined on a regional basis to the different income series of the corresponding inner districts) results in lower gains in CEI than with specific district-based contracts. Tab.4 (third line) shows for each crop the large decrease in gain of CEI, averaged over all districts, when considering region-based contracts (for the inner districts) rather than district-based contracts. While this is unsurprising - since district-based contracts are already optimized to have as large a gain in CEI as possible - it also means that although the contract seems efficient on the regional scale, looking down at the district level reveals that for farmers of one smaller area embedded in the insured region, the contract is not optimal any more. This results from differences in rainfall and yield series between the different districts of the same region.

22
Fig.9 details the distribution of gains in CEI in the standard case (district-based contracts) and the change when applying region-based contracts: a significant number of contracts result in strict losses of CEI.
Fig.9: Distribution histograms of gains in CEI for different crops, for district-based contracts (first line) and when applying region-based contracts to the corresponding districts (second line).
Hence, for these two reasons (lower mean gain of CEI at the regional scale, and differences in yields and rainfall characteristics between districts of a same region), we suggest that it remains more interesting to design specific contracts on the district level – under the assumption that at this low spatial scope it remains interesting for an insurer to set up a contract, all the more if he can design several contiguous district-based contracts at the same time. Naturally, one can also wonder about the spatial heterogeneity of rainfall and yields within one very district: in West Africa, the spatial scale at which rainfall, and resulting yields, remain reasonably homogeneous in their temporal evolution, might be sensibly smaller than the district scale9. This would make it necessary to reduce the spatial extent of the contract, closer to the locations of the rainfall stations used to compute the weather index. However, we do not have the necessary data at lower scale than the district (villages, individual plots…) available to undertake a study of the spatial variations of rainfall and yields at a very detailed scale. Should such a study show that spatial variations in yield are too great, it would highlight the necessity for the insurer to set up more rainfall stations over the region, at his own cost, and to design contracts at a smaller scale, around these stations.
9 As already mentioned, for a given crop, the gain in CEI is negatively correlated with the district area, which is consistent with this hypothesis.
Millet
0
5
10
15
20
25
<(-3
)(-
3)-(
-2)
(-2)
-(-1
)(-
1)-0 0-1
1-2
2-3
3-4
4-5
5-6
6-7
7-8
8-9
9-10
10-2
0
Sorghum
0
5
10
15
20
25
<(-3
)(-
3)-(
-2)
(-2)
-(-1
)(-
1)-0 0-1
1-2
2-3
3-4
4-5
5-6
6-7
7-8
8-9
9-10
10-2
0
Maize
0
5
10
15
20
25
<(-3
)(-
3)-(
-2)
(-2)
-(-1
)(-
1)-0 0-1
1-2
2-3
3-4
4-5
5-6
6-7
7-8
8-9
9-10
10-2
0
Groundnuts
0
5
10
15
20
25
<(-3
)(-
3)-(
-2)
(-2)
-(-1
)(-
1)-0 0-1
1-2
2-3
3-4
4-5
5-6
6-7
7-8
8-9
9-10
10-2
0
Millet
0
5
10
15
20
25
<(-3
)(-
3)-(
-2)
(-2)
-(-1
)(-
1)-0 0-1
1-2
2-3
3-4
4-5
5-6
6-7
7-8
8-9
9-10
10-2
0Sorghum
0
5
10
15
20
25
<(-3
)(-
3)-(
-2)
(-2)
-(-1
)(-
1)-0 0-1
1-2
2-3
3-4
4-5
5-6
6-7
7-8
8-9
9-10
10-2
0
Maize
0
5
10
15
20
25
<(-3
)(-
3)-(
-2)
(-2)
-(-1
)(-
1)-0 0-1
1-2
2-3
3-4
4-5
5-6
6-7
7-8
8-9
9-10
10-2
0
Groundnuts
0
5
10
15
20
25
<(-3
)(-
3)-(
-2)
(-2)
-(-1
)(-
1)-0 0-1
1-2
2-3
3-4
4-5
5-6
6-7
7-8
8-9
9-10
10-2
0

23

24
3.4. How to deal with non-homogeneity in rainfall time series?
In the previous sections, we have designed insurance contracts on a given time period, assuming that all yield and weather data were available and known over that period. In other words, we have retrospectively looked for the optimal contract over that period, in order to investigate the potential interest of weather-index insurance. However, in a real operational context, yields and weather data are not known in advance: farmers perceive indemnities, on a given year, depending on the contract established on the basis of previous years. For instance, in 1992, the potential indemnities for the farmers depend, at best, on the contracts designed over the previous year, i.e. 1971-1991.
In principle, weather-index insurance aims at compensating for variability in yields and income, around a stable average value: if this climatic value remains stable over time, there is no reason why the contract should lose its economic relevancy over time, as long as the correlation between index and yield remains strong enough. However, if this average index value changes over time, the parameters defined for the contract may no longer remain appropriate for the most recent years. For example, in case of a negative trend in rainfall, the index would more and more frequently fall below the strike. The insurer would have to pay indemnities every year to the farmers, hence he would rapidly cancel the contract, or rise up the value of the annual premium. The evidence of such a recent decreasing trend in rainfall in northern Africa is precisely what dissuaded insurers from proposing a weather-index insurance contract in Morocco, although feasibility studies had shown the possibility and interest of implementing such a contract for cereals in this country (Skees et al., 2001).
Similarly, in case of a positive trend in rainfall, the farmer would hardly receive any indemnity while still paying the annual premium, so he would rapidly quit the insurance system.
In this section we illustrate this problematic in the case of Burkina-Faso.
To study the efficiency of the insurance contract after the period on which it is defined, we need to extend the data time series over 21 years. To do so, we take advantage of the longer Agrhymet rainfall time series (1971-2004, while yields from Agristat only cover 1984-2004): that is, we “complete” the Agristat agricultural database by creating some virtual 1971-1983 yield series back in the past. These virtual data are simulated as follows: for each crop and each district, a random 1971-1983 series is created, with the same statistical properties as the real 84-04 yield series (mean and variance), and so that the 1971-2004 total index/yields correlation remains the same as the correlation over 1984-2004 (within a 0.05 error margin). Since rainfall generally shows a negative trend during the 70’s, our simulated yields also show, as a result, a negative trend during this period. For each crop and each district, we are now able to compute the optimal contract for the whole 1971-2004 period; we can also split this period in two and compute the optimal contract for the 71-91 period, and then analyze how this contract behaves over the following 1992-2004 years which were not “seen” by the optimization process. Certainly, in order to verify that the results are not biased due to the

25
simulation of one particular 1971-1983 random series, for each crop and each district, it would have been more appropriate to repeat the computations with a large number of random simulations, i-e, to verify the sensitivity of these computations to the simulated series. However this turned out to be overly time-consuming; in addition, we already randomly simulated 120 yields series (30 districts and 4 crops): one can consider that when averaging the results for each crop, it is unlikely that a systematic bias persists in the mean result.
Fig.10 and 10.bis illustrate two opposite possibilities with respects to the efficiency of the contract when applied routinely without any updating. Fig.10 is the contract for maize on the Yatenga district, in which after 1991 the farmer receives nearly no indemnity - because of a positive shift in rainfall - whereas he keeps on paying the annual premium (defined over 71-91): the gain of CEI over 71-91 is 5.59%, falling to a loss of -16.74% over 1992-2004. Conversely fig.10.bis is the contract for sorghum on the Bam district: since cumulative rainfall stays stable, the gain of CEI over 92-2004 remains acceptably close, at 1.45%, to that of the 71-91 period (2.35%).

26
Fig10 and 10bis: contracts for maize and sorghum, districts of Yatenga and Bam, when defined over 1971-1991 and applied on to 2004 – upper left: blue lines show the distribution of annual rainfall, black line shows the shape of the insurance contract (indemnity as a function of cumulative rainfall); upper right: full line is annual rainfall, dotted lines show the two threshold parameters of the contract; bottom left: grey bars represent income without insurance, red bars are indemnities, and green bars show the annual premium; the vertical dotted line indicates the year 1991; bottom right: yields (red) and rainfall index (blue), expressed in standardized anomalies ((X-mean(X)/std(X))).
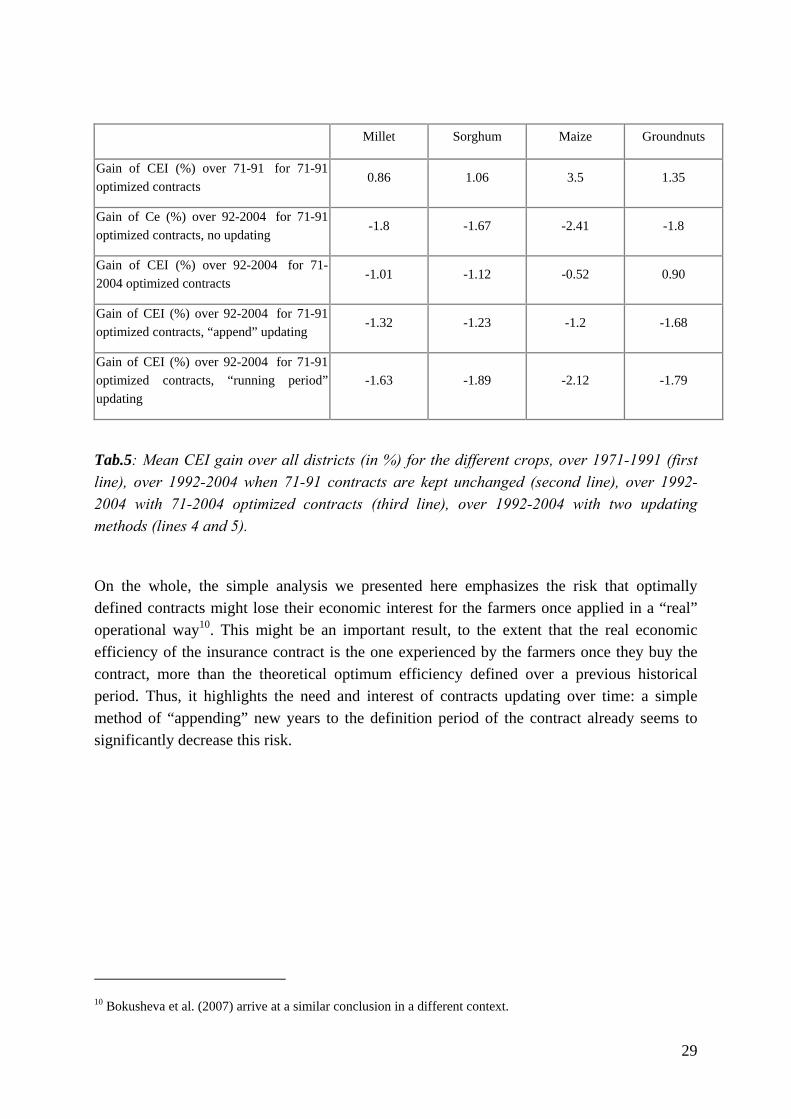
Tab.5 generalizes this for all crops over all districts: it shows the mean country-wide gain in CEI over 71-91 for the contracts optimized over that period (first line). Supposing one is in 1992, this somehow represents the average gain one could expect to obtain over the following years when applying these contracts. However, the second line shows that the gain in CEI, when these contracts are applied as such to the 92-2004 years, is, on average, negative: there is a net loss of CEI. That is, although the contracts defined over the previous years might have let one think that an insurance system could be economically interesting for the farmers (first line), the contrary seems to occur: contracts defined over 1971-1991 generate a loss of CEI over 1992-2004. One should note that this loss also seems inherently due to this particular 92-2004 period: indeed, the third line shows the gain of CE over 1992-2004 for the contracts optimized over the whole 71-2004 period (that is, supposing one is in 2004 and retrospectively looks for the optimal contract over 1971-2004). Even for these optimal contracts, there is a loss, or a small increase, of CEI over 92-2004. However, the loss with 71-

27
91 optimized contracts remains much larger: as shown on fig.11, it can reach several % on certain districts.
Thus, these results suggest, at least, that the contract parameters should be updated over time, so that the insurance contract on a given year takes into account the most recent years since the definition period of the contract, and stays as close as possible to the optimal time-integrated contract.
In a first approach, two updating methods seem easily conceivable:
• to append each new year to the historical series of weather and yields, and to redefine the contract on this extended basis: with ever longer time series, this method consolidates the numerical stability of the contract (the values of the parameters), although it gives less and less importance to the recent years, since each new year weighs proportionally less in the total series;
• each year, to redefine the contract for the following year on the basis of the 21 immediate previous years (by “running periods”); this method gives more importance to the most recent years.
Tab.5 shows the average gain of CEI (over 92-2004) that results from this two methods, applied after 1991 (last two lines). Only the “append” updating method (line 4) allows for slightly better results than not updating the contracts (that is, applying the 71-91 contracts without updating – second line). In particular, the “running periods” method even sometimes worsens the decrease of CEI over 92-2004 compared to no updating at all.
The improvement, when the contract is updated, results in most cases from the decrease in the annual premium paid by the farmer after 1992, rather than in updating the “strike” value and generating new indemnities; see for example fig.11 with the “append” method for the maize on the district of Yatenga: the loss of CEI is now -9.36% (instead of -16.74%), compared to an optimum of -7.8% with a 71-2004 optimized contract. On this example, although the farmer still does not receive any indemnity after 1992, the value of his annual premium decreases, and his loss of utility is then smaller than without updating. It is indeed clear that in such a situation where rainfall exhibits a positive shift, if the strike threshold of the contract is not modified, the value of the annual premium must be lowered: since the farmer does not receive any indemnity, it is hardly legitimate to ask him to pay a constant premium.
Conversely, it can happen that the “running period” method increases the value of the annual premium paid by the farmer: if for example on a given year the 21 previous years are precisely the ones when the farmer receives the more indemnities, the premium will be computed so as to balance this large amount of indemnities, and amount to a higher value than would have been computed otherwise, with the “append” method considering all years since 1971. This explains why the “running periods” method seems less efficient in updating the contracts.

28
Fig.11: contract for maize, district of Yatenga, when defined over 1971-1991 and applied on to 2004 with the “append” updating method– upper left: blue lines show the distribution of annual rainfall, colour lines show the shapes of the successive insurance contracts (indemnity as a function of cumulative rainfall) as the contract is updated over time; upper right: full line is annual rainfall, colour lines show the “strike” parameter of the updated contracts (this parameter actually does not change over time); bottom left: grey bars represent income without insurance, red bars are indemnities, and green bars show the annual premium; the vertical dotted line indicates the year 1991; bottom right: yields (red) and rainfall index (blue), expressed in standardized anomalies ((X-mean(X)/std(X)))
29
Millet Sorghum Maize Groundnuts
Gain of CEI (%) over 71-91 for 71-91optimized contracts
0.86 1.06 3.5 1.35
Gain of Ce (%) over 92-2004 for 71-91optimized contracts, no updating
-1.8 -1.67 -2.41 -1.8
Gain of CEI (%) over 92-2004 for 71-2004 optimized contracts
-1.01 -1.12 -0.52 0.90
Gain of CEI (%) over 92-2004 for 71-91optimized contracts, “append” updating
-1.32 -1.23 -1.2 -1.68
Gain of CEI (%) over 92-2004 for 71-91optimized contracts, “running period” updating
-1.63 -1.89 -2.12 -1.79
Tab.5: Mean CEI gain over all districts (in %) for the different crops, over 1971-1991 (first line), over 1992-2004 when 71-91 contracts are kept unchanged (second line), over 1992-2004 with 71-2004 optimized contracts (third line), over 1992-2004 with two updating methods (lines 4 and 5).
On the whole, the simple analysis we presented here emphasizes the risk that optimally defined contracts might lose their economic interest for the farmers once applied in a “real” operational way10. This might be an important result, to the extent that the real economic efficiency of the insurance contract is the one experienced by the farmers once they buy the contract, more than the theoretical optimum efficiency defined over a previous historical period. Thus, it highlights the need and interest of contracts updating over time: a simple method of “appending” new years to the definition period of the contract already seems to significantly decrease this risk.
10 Bokusheva et al. (2007) arrive at a similar conclusion in a different context.

30
4. Conclusion: limits and outlooks.
By using a detailed agricultural and climate dataset over Burkina-Faso and very simple assumptions regarding the form of an insurance contract, we have investigated the potential feasibility and interest for farmers of a weather-index insurance system in this country. To do so, we have explored the results of more than 3.000 simulated contracts applied to 30 districts, 21 years (1984-2004) and 5 crops (cotton, millet, sorghum, maize and groundnut). From this large simulation database, we found that such an insurance system, even based on a simple weather index like cumulative rainfall during the rainy season, can be relevant, at the district scale, and present a significant economic efficiency. The determinants of the efficiency of such contracts are twofold. First, the quality of the correlation between the weather index and yields greatly determines, as expected, the potential success of the insurance contract. Second, under our assumptions, the variance of the yield plays an important role in the economical value of the contract with a value being greater with a high year-to-year variability of the yield. As a consequence of these two determinants, we found that the farmer’s gain from an insurance contract is higher in the driest part of the country, which is more prone to droughts and exposed to bad harvests. In the same way, among the different crops we considered, maize and groundnuts seemed to be the most suitable to implement an insurance system since their respective yields show a large variance and a generally high correlation with the weather index. On the opposite, the contracts failed for cotton because of insignificant correlations between yields and the weather index; the weather determinants of cotton yields being more complex than a simple cumulative rainfall index. Clearly, we did not try in this study to optimize the definition of the index, mainly for the sake of simplicity and robustness when looking at several different crops. However we acknowledge the possibility to refine the definition of the weather index: thus, there is room for substantial improvements of the economic relevance of the insurance system we presented here. In particular we note that non-climatic index can be considered, such as satellite-based products (like real-time NDVI indexes) or even model-based products (Ward et al., 2008).
We have also used our simulation database to explore difficulties and limits of such assurance contracts. The spatial scale appears to be key issue since the interest of the insurer is likely to have the largest area included in the same contract (to limits costs of index monitoring and contract administration) while the high spatial variability of rainfall strongly limits the scale at which one can reasonably consider implementing an insurance contract based on a single weather index. Here we suggested that the district scale (around 7000 km² in average) is the maximum scale appropriate for a single weather index insurance contract, showing that the larger region scale was, comparatively, inappropriate. However, one should investigate further the problematic of rainfall and yield spatial variability within a single district before considering implementing weather index insurance at this scale. One other important difficulty we underline is the necessity to update, over time, the parameters that define the insurance contract. Indeed, if the weather index happens to show a trend (positive or negative), the economic relevance of the contract, once applied on an operational mode, is bound to decline. In the context of a changing climate, this clearly poses difficulty to the

31
implementation of an insurance system. We suggest a simple “append” method that could be efficient to update the insurance contracts. As a perspective, it also highlights the interest - among many other reasons - of improving regional climate predictions on seasonal and decadal time scale: indeed, it confirms that progressive trends in rainfall might lessen the interest of a weather-index insurance system. In our case, it is precisely well-known that rainfall in West Africa generally exhibits decennial or pluri-decennial trends, due to the variations in the strength of the monsoon system: the drying over West Africa in the 70's and 80's is, for example, the strongest regional climatic signal over the globe during the second half of the 20th century (Nicholson 1986). Being able to reliably forecast these trends would then certainly make it easier to set up, in West Africa, an efficient and sustainable weather-index insurance system, particularly in the context of a changing climate.
To go further in the evaluation of the feasibility of such proposed insurance systems, two important points have to be addressed:
First the social acceptability of an agricultural insurance system in rural western Africa needs to be documented. This is clearly one the major issues: although African rural households already engage in a variety of risk management and coping strategies (for example, income diversification, crop diversification, livestock holdings, informal credits), it remains unclear to what extent a formal system of insurance, with official contracts and monetary costs, can look attractive to such producers, in a rural and largely illiterate environment. Before even considering the implementation of an insurance system in such a region, one should of course undertake the necessary in situ study of social willingness to pay for a risk transfer, and analyse accurately the risk aversion of farmers: indeed, in our study, the economic interest of the insurance system depends a lot on the degree of risk-aversion, which has to be calibrated on the basis of studies led in other countries. This issue is, somehow, related to the question of the form, in concrete terms, under which the insurer is to propose his insurance contract: it remains to be defined what is the most efficient interface between the farmers and the insurer (the village, a union of producers, individual farmers, etc.).
Second, we have to acknowledge that this study is only based on optimizing the farmer’s utility: it does not take into account the particular interests of the insurer – partly because it is not clear what formal rules insurers use to design their contracts. Thus, there is certainly a different optimum to find when accounting for both sides’ interests. For instance, one should examine the sensitivity of the contract benefice for farmers with an increase of the insurers’ margins. A more attractive contract for insurers, which is an important condition for the application of the contract, would not necessary induce a strong loss of benefice for farmers. Another important condition for the insurer is to have a portfolio of contracts where risks are uncorrelated or ideally negatively correlated: that is, not all of the insurance contracts he provides trigger indemnities simultaneously. In the present case, this would depend on the

32
other risks covered by the insurer in other regions, and the possible correlation between the index in Burkina-Faso (rainfall) and these other hazards.
Under the assumption that these numerous limitations are addressed, it is clear from our study that an appropriately designed weather index insurance system would certainly offer significant economic interest for African farmers in some parts of Burkina-Faso. Moreover, since we made some relatively common assumptions about the shape of the insurance contract and the cost of the risk transfer from the farmers to the insurer we believe that the results we found and the limits we addressed in this paper are not strictly limited to Burkina-Faso but can be applied to other regions with rainfed crops in Africa and worldwide
References
Abdulai, A. and A. CroleRees (2001). Determinants of income diversification amongst rural households in Southern Mali. Food Policy 26: 437-452
Barnett, B. and O. Mahul (2007). Weather index insurance for agricultural and rural areas in lower-income countries, American Journal of Agricultural Economics 89(5): 1241-47
Bazzaz, F. and W. Sombroek, 1996 : Global climate change and agricultural production.
Direct and indirect effects of changing hydrological, pedological and plant physiological
processes. John Wiley, FAO, Rome, Italy.
Blanc, E., P. Quirion and E. Strobl (2008). The climatic determinants of cotton yields: evidence from a plot in West Africa, forthcoming in Agricultural and Forest Meteorolology
Bokusheva, R., G. Breustedt and G. Heidelbach (2007). Ex-ante evaluation of weather-based index insurance and area-yield insurance for reducing crop yield risk, European Association of Agricultural Economists 101st Seminar, July 5-6, 2007, Berlin, Germany, http://ageconsearch.umn.edu/handle/123456789/27444
Chavas J.P. and M.T. Holt (1996). Economic behavior under uncertainty: a joint analysis of risk preferences and technology. Review of Economics and Statistics 78: 329-335.
Chantarat, S., Barrett, C.B., Mude, A.G., Turvey, C.G. (2007). Using Weather Index Insurance to Improve Drought Response for Famine Prevention, American Journal of Agricultural Economics 89(5): 1262-1268
De Rouw, A., 2004. Improving yields and reducing risks in pearl millet farming in the
African Sahel. Agricultural Systems, 81, 73-93.
Giné, X., R. Townsend and J. Vickery (2007). Statistical analysis of rainfall insurance payouts in Southern India, American Journal of Agricultural Economics 89(5): 1248-54
Hartell, J., H. Ibarra, J Skees and J. Syroka (2006). Risk management in agriculture for natural hazard, ISMEA, December.

33
Holt, C.A. and S.K. Laury (2002). Risk Aversion and Incentive Effects, The American Economic Review, Vol. 92, No. 5., pp. 1644-1655
Ingram, K.T., M.C. Roncoli, and P.H. Kirshen, 2002. Opportunities and constraints for
farmers of West Africa to use seasonal precipitation forecasts with Burkina Faso as a case
study. Agricultural Systems, 74, 331-349.
IPCC (2007), Climate change 2007, Cambridge university Press
Mythili, G. (2006). Measures of Risk Aversion and Risk Premiums from Land Allocation Model: An Empirical Analysis Based on Farm Level Panel Data. The Icfai Journal of Agricultural Economics, Vol. 3, No. 4, pp. 34-43, October
Nicholson, S.E., (1986). Climate, drought and famine in Africa. In: Hansen, A. and D.E. McMillan, Editors, Food in Sub-Saharan Africa, Lynne Rienner, Boulder (1986), pp. 107–128.
Pope R.D.; R.E. Just (1991). On testing the structure of risk preferences in agricultural supply system. American Journal of Agricultural Economics: 743-748.
Reardon, T., Delgado, C.L., Matlon, P., 1992. Determinants and effects of income diversification amongst farm households in Burkina Faso. Journal of Development Studies 28 (1), 264–296.
Sakurai, T. and T. Reardon (1997). Potential demand for drought insurance in Burkina Faso and its determinants, American Journal of Agricultural Economics, 73: 1196-1207.
Skees, J., Hartell, J., Murphy, A.G. (2007). Using Index-Based Risk Transfer Products to Facilitate Micro Lending in Peru and Vietnam, American Journal of Agricultural Economics 89(5): 1255-1261.
Skees, J., Varangis, P., Lester, R., Gober, S., Kalavakonda, V. (2001) Developing rainfall-based index insurance in Morocco. World Bank Policy Research Working Paper No. 2577
Ward, M.N., Holthaus, E.M., (2008). Index insurance for droughts in the Millennium Villages project. 20th Conference on Climate Variability and Change, 2008.
World Bank (2007). Africa development indicators 2007, Washington D.C.
World Bank, (1997). African development indicators. Washington DC, USA.