can umbrella parties survive? the decline of the indian ... · duverger’s law will work even...
TRANSCRIPT

Full Terms & Conditions of access and use can be found athttp://www.tandfonline.com/action/journalInformation?journalCode=fccp20
Download by: [Universiteit Leiden / LUMC] Date: 26 July 2016, At: 10:04
Commonwealth & Comparative Politics
ISSN: 1466-2043 (Print) 1743-9094 (Online) Journal homepage: http://www.tandfonline.com/loi/fccp20
Can umbrella parties survive? The decline of theIndian National Congress
Adnan Farooqui & E. Sridharan
To cite this article: Adnan Farooqui & E. Sridharan (2016) Can umbrella parties survive? Thedecline of the Indian National Congress, Commonwealth & Comparative Politics, 54:3, 331-361,DOI: 10.1080/14662043.2016.1183308
To link to this article: http://dx.doi.org/10.1080/14662043.2016.1183308
Published online: 26 Jul 2016.
Submit your article to this journal
View related articles
View Crossmark data

Can umbrella parties survive? The decline of the IndianNational Congress
Adnan Farooquia and E. Sridharanb∗
aDepartment of Political Science, Jamia Millia Islamia, New Delhi, India;bUniversity of Pennsylvania Institute for the Advanced Study of India, New Delhi,India
This paper analyses the defeat of the Congress party in the India’s 2014election in which it plummeted to its lowest ever vote share (19 percent) and seat tally (44 of 543). We argue that the defeat is the endresult of a gradual decline punctuated by recoveries that began muchearlier. We show that the Congress was gradually becoming lesscompetitive in more and more states and constituencies as indicated byits falling to third position or worse. We try to relate this to the desertionof the party by social groups that once supported it in a number of statesand other factors. The larger question is whether a Congress-type,encompassing, umbrella party can survive the sharpened politicisation ofsocial cleavages, in the Indian case, religious, caste and regionalcleavages since such a party will tend to lose out to parties based onreligious, caste and regional identities in identitarian outbidding.
Keywords: umbrella party; party system; social cleavage; competitiveness;decline; India; Congress Party
Introduction
In this paper, we analyse the decline of the Indian National Congress Party(henceforth Congress Party or Congress) culminating in its catastrophicdefeat in the 2014 Indian general election, registering its lowest-ever seatand vote shares. We examine the longer term trends in its gradual decline, punc-tuated by electoral recoveries, beginning decades earlier, to identify the driversof decline. We situate our analysis in theories of the relationships between pol-itical (including electoral) systems, social cleavages and party systems to posethe question of whether Congress, and more generically, the dominance of acongress-type, encompassing, umbrella party, can survive the politicisation
# 2016 Informa UK Limited, trading as Taylor & Francis Group
∗Corresponding author. Email: [email protected]
Commonwealth & Comparative Politics, 2016Vol. 54, No. 3, 331–361, http://dx.doi.org/10.1080/14662043.2016.1183308
Dow
nloa
ded
by [
Uni
vers
iteit
Lei
den
/ LU
MC
] at
10:
04 2
6 Ju
ly 2
016

of social cleavages in a heterogeneous society and increasingly federal politicalsystem.
Political systems, social heterogeneity and party systems
There are, broadly speaking, two theories of the determinants of party systems– theories that view political systems (electoral rules, federalism, presidential-ism) as the key determinants of party systems (the distribution of votes andseats), and theories that view social heterogeneity, or more specifically, thenumber of salient social cleavages as the key determinants.1 The best-knownpolitical system theory, the electoral rules theory of party systems, postulatesthat the district magnitude (the number of representatives elected from eachelectoral district), ballot structure (choosing an individual candidate, partylist or a mix of the two), and decision rule or electoral formula to convertvotes into seats (proportional representation, simple plurality, variants ofeach) create varying disproportionalities between votes and seats, and hence,incentives for the coalescing, merging or splitting of political parties whichwill be reflected in the number, relative weight and ideological positioning ofparties, hence, the party system (Lijphart, 1994, pp. 10–21).
For the Indian and other first-past-the-post (single-member district, simpleplurality or SMSP) systems, Duverger’s law predicts that first-past-the-postsystems tend towards two-party systems, a ‘law’ that applies primarily to thedistrict (constituency) level, which can get translated to the state/provincelevel in a federal system or the national level in a British-type unitary system(Duverger, 1963, 1986).
Another variant of the political systemic theory of party systems is that fed-eralism creates incentives to form state/province-level parties, that is, regionalparties, and this is all the more so the greater the powers devolved to theregional level by the system since the fruits of victory at the regional levelalone are considerable in terms of being able to make policies on issueswhich voters care about (Chhibber, 1999; Chhibber & Kollman, 2004, Chapters2 and 5). The more this is so, the less is the incentive for state-level parties tocombine across state boundaries to form a federal party to contest national-levelelections (Chhibber, 2005). The alternative of forming coalitions instead of aunified federal party at the national level becomes a viable alternative in theevent of no unified federal party getting a majority in parliament (Sridharan,2012b).
Hence, Duverger’s law would predict a two-party system at the nationallevel under parliamentarism if federalism is weak and major policy powersare concentrated at the federal level, or alternatively, if federalism is strong, arange of state-level two-party systems, not necessarily of the same twoparties as in the United States but one of multiple bipolarities resulting in a
332 A. Farooqui and E. Sridharan
Dow
nloa
ded
by [
Uni
vers
iteit
Lei
den
/ LU
MC
] at
10:
04 2
6 Ju
ly 2
016

multi-party system nationally and hence a relatively fragmented parliament. Astrong, decentralised federalism would also predict a multi-party system underparliamentarism.
The social cleavages theory of party systems argues that social heterogen-eity would tend to produce a multi-party system reflecting that heterogeneityregardless of the electoral system. The classic statement of the social cleavagestheory would argue that parties get formed around the salient cleavages insociety (what cleavages are salient and why can vary in time and space)(Lipset & Rokkan, 1967).2 For example, in ethno-culturally homogenousindustrialised societies, the class cleavage might be the most salientleading to a party system polarised between conservative and socialist/social-democratic/labour parties. Taagepera and Shugart (1989) predict that thenumber of relevant parties will be one more than the number of salientcleavages. There is an unresolved debate on whether the pull of social hetero-geneity will overcome the effects of electoral rules with Taagepera and Shugart(1989) holding that social heterogeneity will mean more effective parties what-ever the electoral system while Ordeshook and Shvetsova (1994) hold thatDuverger’s law will work even under social heterogeneity. What emerges isthat while Duverger’s law predicts a two-party system, and in a federalsystem state-level two-party systems leading to a national multi-party systemin the case of multiple bipolarities, Duverger’s law along with federalismand social heterogeneity logically predicts multi-party systems organisedaround either regions or social groups such as those based on religion, caste,tribe, class or language.
What is noteworthy is that none of the above theories predicts the domi-nance of an encompassing umbrella party like the Congress, which has ruledIndia in single-party majority governments from 1947–1989 except for1977–1979, and since 1989 as either a minority government (1991–1996)or the lead party in a minority coalition, 2004–2014.
Congress as an umbrella party
Where would one place Congress in a comprehensive party typology? Guntherand Diamond (2001) have ‘congress parties’ as a specific category in theirtypology. In a fivefold classification – elite, mass-based (ideological/socialist,ideological/nationalist, religious), ethnicity-based (ethnic parties, congressparties), electoralist parties (catch-all, programmatic, personalist), movementparties (left-libertarian, post-industrial extreme right), all these being idealtypes, they place congress parties as pluralistic, multi-ethnic parties whichare coalitions of distinct ethnic, religious and regional groups that contain con-flict through sharing of power and resources among ethnic groups, gain votesthrough clientelistic loyalties and appeals to national integration, and have
Commonwealth & Comparative Politics 333
Dow
nloa
ded
by [
Uni
vers
iteit
Lei
den
/ LU
MC
] at
10:
04 2
6 Ju
ly 2
016

coalitional or federative organisation based on regional elites and localnotables. Such a congress-type party can also be described as an umbrellaparty or an encompassing party, as we do in this paper, spanning cleavagesof class, ethnicity (race, caste, religion, language), region and political pro-gramme (moderate right, moderate left).
The other nearest type in their schema is the catch-all party that maximiseselectoral appeal through a broad aggregation of interests but has a weak partyorganisation, weak civil society linkages and is election-focused (Kirchheimer,1966). India’s Congress in its first two decades, and Malaysia’s BarisanNasional (although this is a stable coalition but not a single party), and Niger-ia’s People’s Democratic Party are described as the archetypes of congressparties. We take the position that the difference between an umbrella partyand a catch-all party is that the former is more encompassing and includes con-tradictory social forces. Thus, the Congress in India includes both big businessand the poor, upper castes and Scheduled Castes, as essential components of itssupport base, whereas a catch-all party is typically a class party in origin whichseeks to reach out beyond its traditional base.
Comparatively speaking, the dominance of Congress as a congress-typeparty in a one-party dominant system in India during its heyday was quite dis-tinct from the dominance of other such parties in various countries in that incountries such as Tanzania, Nigeria, Kenya and Mexico, such dominancecame to be associated with authoritarian rule, the only exception being theAfrican National Congress (ANC) in post-apartheid South Africa. In most ofthese countries, there existed constitutional constraints on the formation aswell as functioning of political parties which the ruling parties exploited tomaintain their stranglehold. It is only very recently that most of these countrieshave made a transition from a semi-authoritarian ‘hegemonic’ party system todemocratic one-party dominant system or a multi-party system (SpieB, 2002, p.7). In Kenya and Tanzania, there existed a constitutionally sanctioned one-partysystem. This continued right up to 1991 and 1992, respectively, when undersustained popular and political pressure the ruling parties TanganyikaAfrican National Union (TANU)/Chama Cha Mapinduzi (CCM) in the caseof Tanzania, and Kenyan African National Union (KANU), accepted the tran-sition to a multi-party system. On the other hand, both in Nigeria in the 4thRepublic under the People’s Democratic Party (PDP), and Mexico under Inter-national Revolutionary Party (PRI) the ruling congress-type party maintainedits hold either legally through changes to the electoral laws to the disadvantageof opposition parties or through sheer manipulation and deceit. In the case ofNigeria, PDP which came to power in 1999 ruled uninterruptedly right up to2015 when the party was dislodged by the All Progressive Congress, an alli-ance of Nigeria’s three biggest opposition parties (Aleyomi, 2013). InMexico, the PRI remained the preeminent party from 1929 to the early
334 A. Farooqui and E. Sridharan
Dow
nloa
ded
by [
Uni
vers
iteit
Lei
den
/ LU
MC
] at
10:
04 2
6 Ju
ly 2
016

1990s. The PRI’s dominance was complete right up to the 1980s, with thedivided opposition posing no serious threat. The situation only changedwhen the opposition parties of the right and the left emerged as serious opposi-tion which eventually led to the party losing its majority in both the houses ofthe national legislature in 1997. In 2000 after a continuous reign of 71 years,PRI was dislodged from the presidency (Crespo, 2004).
Thus, going by Sartori’s category of one-party dominant system, we couldargue that Tanzania, Nigeria, Mexico and Kenya have had a dominant–author-itarian party system (Sartori, 2005). This holds true even for countries likeTaiwan and Singapore where the principal parties, Kuomintong (KMT), andPeople’s Action Party (PAP) respectively, displayed an authoritarian streaktowards the opposition parties. This was distinct from the Malaysian casewhere the ruling Barisan Nasional is more of an alliance between the dominantparty United Malay National Organisation (UMNO) and its allies. In all thesecases, we see the eventual erosion of umbrella party dominance. This is unlikeIndia and South Africa where the dominance of an umbrella party enduredunder genuinely democratic conditions and a vibrant multi-party system.Thus, there have been very few durable congress-type parties in full-fledgeddemocracies. How do they emerge and sustain themselves and can theysurvive the politicisation of social cleavages?
What Gunther and Diamond (2001) do not mention is the historical or path-dependent dimension of the formation of congress parties, particularly India’sCongress. It emerged over six decades from 1885 to 1947 as an encompassingparty in a very heterogeneous country because of its role as a mass party of theindependence movement that sought to unite all Indians against British colonialrule, setting aside all other differences of class, ethnicity, religion, caste,language and region. Forged in this anti-colonial, independence movementcontext, it acquired its encompassing, multi-ethnic character and federativeorganisation which was grafted on the provincial structure of British India,and was not challenged by parties based on social cleavages except for theMuslim League which went out of the political arena of independent Indiadue to the Partition of India. Hence, the dominance of Congress after indepen-dence for several decades was determined by a specific colonial-historical tra-jectory that was quite different from the party system evolution of Westerndemocracies. Other such dominant umbrella parties have also been theproduct of either independence movements or revolutions. To an extent, theevolution of Congress can be linked to Lipset and Rokkan’s idea of a nationalrevolution.
In the literature on Indian parties and party systems, Kothari (1970, p. 179)has characterised Congress in its heyday, 1947–1967, as an encompassing‘party of consensus’ surrounded by smaller and narrower-based ‘parties ofpressure’. Lijphart (1996) later characterised Congress as a grand coalition of
Commonwealth & Comparative Politics 335
Dow
nloa
ded
by [
Uni
vers
iteit
Lei
den
/ LU
MC
] at
10:
04 2
6 Ju
ly 2
016

diverse interests because of which it, and the larger Indian political system inwhich Congress was hegemonic, conduced to power-sharing (he went so faras to argue that India was a consociational democracy) and hence, to the con-solidation of democracy despite inconducive features such as social heterogen-eity and poverty.
Chhibber and Petrocik (1990) argued that Congress was not an umbrellaparty at the state level; at that level, it was based on local social cleavagesand particular social groups, varying state by state. Rather it was somewhatlike the Democratic Party in the United States in that it was like a coalitionof state-based parties that aggregated themselves into one party nationally tocompete for the prize of national power. This was supported by later findingsin the 1990s that the Congress’ base by caste and class differed across statesdepending on whether it faced the right-wing Hindu-nationalist BharatiyaJanata Party (BJP) or the Left parties as its principal competitor (Heath &Yadav, 1999; Yadav, 2003). However, aggregated nationally it fits theconcept of a congress-type, encompassing umbrella party.
The evolution of the party system and the rise of competition forCongress
To understand the decline of Congress, we need to trace the evolution of theIndian party system through three major phases, 1947–1967, 1967–1989and 1989–2014. Duvergerian dynamics played themselves out in state afterstate over 1967–1989, continuing after 1989 (Chhibber & Murali, 2006;Sridharan, 2002 for detailed accounts), for both Lok Sabha and state assemblyelections, leading to either a two-party system, or one party versus a coalition,or a two-coalition system, that is, bipolar party systems with the non-Congressopposition consolidating behind a particular party in each state (with excep-tions like Uttar Pradesh). However, this was one of multiple bipolarities –for example, Congress–Jana Sangh (precursor of BJP) in Rajasthan, MadhyaPradesh, Himachal Pradesh and Delhi; Congress–Left in West Bengal,Kerala and Tripura; Congress versus a regional party in Tamil Nadu (after1972, two regional parties were the top two parties), Punjab, Jammu andKashmir, and from the 1980s, Andhra Pradesh and Assam; Congress versusfragments of the Janata Party in Haryana, Karnataka and Odisha. What thisimplied was the possibility, in the event of an anti-Congress wave acrossstates, of the victory of a motley collection of regional and other parties,which was what happened in 1989.
The fragmentation of the party system in the third (1989–2014) phase inparticular reflects three mega-trends: the decline of Congress, the rise of BJP,and the rise and stable presence of regional parties. The net result of theseDuvergerian dynamics was the bipolarisation of state party systems, but one
336 A. Farooqui and E. Sridharan
Dow
nloa
ded
by [
Uni
vers
iteit
Lei
den
/ LU
MC
] at
10:
04 2
6 Ju
ly 2
016

of multiple bipolarities, leading to a fragmented Lok Sabha in which no singleparty obtained a majority in the seven consecutive elections from 1989 to 2009until the BJP’s narrow majority in 2014.
The erosion of Congress competitiveness
To put Congress’ lowest-ever vote and seat shares of 2014 in some historicalperspective, let us focus on some facts about the decline of Congress, nation-ally, state- and constituency-wise.
Loss of national vote share
Congress decline is the other side of the coin of the rise of other parties in theperiod since 1967, especially since 1989. The basic facts are as follows.3 Whilethe Congress suffered two setbacks in 1967 (when it slid to 40 per cent and abare majority, losing power in 8 of the then 16 major states), and in 1977 whenit lost power for the first time to the Janata Party (the unified opposition), it wasable to recover both times with big victories in 1971, 1980 and 1984 (Tables 1and 2).
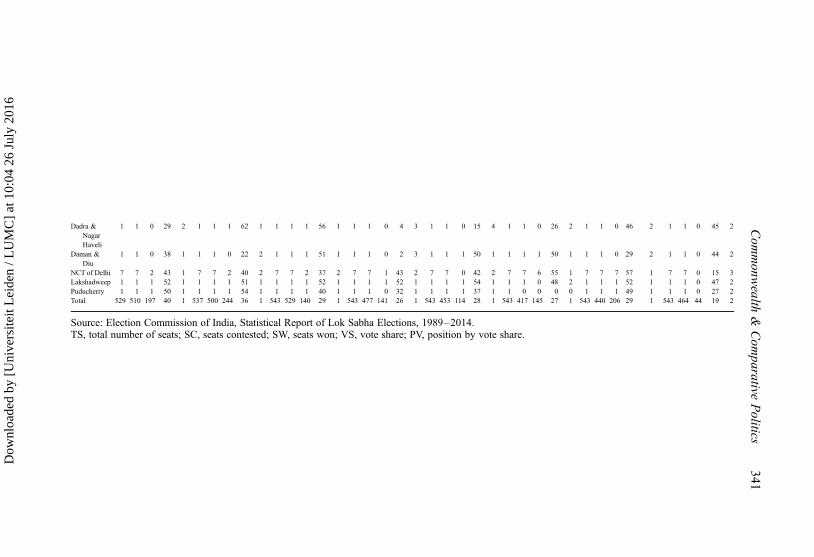
While up to the 1984 election, Congress won majorities on the basis of plur-alities of over 40 per cent of the vote, in 1989 it fell a fraction below 40 per centfor the first time (except for 1977) and since then declined further to as low as25.8 per cent in 1998 recovering slightly in the next three elections but remain-ing under 30 per cent (Table 1). Compared to a majority mark of 273 seats itcrossed 200 only twice (in 1991 and 2009) in the eight elections over 1989–2014, losing its status as the single largest party in 1996, 1998 and 1999despite a slightly higher vote share than the BJP due to the concentration ofthe BJP’s votes in a smaller number of constituencies, mostly in north,central and western India. The space vacated by Congress has been filled byBJP and a range of non-Left regional parties (the Left has remained relativelystagnant), with the non-Congress, non-BJP space being in the 44–53 per centrange over 1989–2014 though divided among a large number of parties. Post-1996, Congress remained below 30 per cent in vote share, the overall slidebeing from almost 40 per cent to 19 per cent over 1989–2014.
Competitiveness in states for general elections
Given the Duvergerian dynamics that have been operating at the constituencyand state levels from over 1967–1989 and since then, a party can be consideredcompetitive in an SMSP system with bipolarised state party systems, that is,having a serious chance of winning and forming a government singly or incoalition if it is in the first or second position in vote share. If it is in the
Commonwealth & Comparative Politics 337
Dow
nloa
ded
by [
Uni
vers
iteit
Lei
den
/ LU
MC
] at
10:
04 2
6 Ju
ly 2
016

Table 1. Performance of Indian National Congress 1967–1984.
State/UnionTerritory
1967 1971 1977 1980 1984
TS SC SW VS% PV
CPthird
orworse TS SC SW VS% PV
CPthird
orworse TS SC SW VS% PV
CPthird
orworse TS SC SW VS% PV
CPthird
orworse TS SC SW VS% PV
CPthird
orworse
AndhraPradesh
41 41 35 46.82 1 0 41 37 28 55.73 1 0 42 42 41 57.36 1 0 42 42 41 56.24 1 0 42 42 6 40.81 2 0
ArunachalPradesh
2 2 1 41.25 1 0 2 2 2 44.13 1 0 2 2 2 43.22 1 0
Assam 14 14 10 45.84 1 0 14 13 13 56.98 1 0 14 14 10 50.56 1 0 14 2 2 51.01 1 0 14 13 4 23.43 1 4Bihar 53 53 34 34.81 1 0 53 47 39 40.6 1 1 54 54 0 22.90 1 5 54 54 30 36.44 1 7 54 54 48 51.84 1 1Goa, Daman
& Diu2 1 0 5.47 3 1 2 1 1 24.76 1 0 2 2 1 39.98 1 0 2 1 0 12.19 3 0 2 2 2 46.21 1 0
Gujarat 24 24 11 46.92 1 0 24 23 11 44.85 1 0 26 26 10 46.92 2 0 26 26 25 54.84 1 0 26 26 24 53.24 1 0Haryana 9 9 7 44.06 1 0 9 9 7 52.56 1 0 10 9 0 17.95 2 1 10 10 5 32.55 1 2 10 10 10 54.95 1 0Himachal
Pradesh6 6 6 48.35 1 0 4 4 4 75.79 1 0 4 4 0 38.58 2 0 4 4 4 52.08 1 0 4 4 4 67.58 1 0
Jammu &Kashmir
6 6 5 50.52 1 0 6 6 5 54.06 1 0 6 3 3 16.37 2 0 6 1 1 18.68 1 0 6 4 3 30.23 2 0
Mysore/Karnataka
27 27 18 49.02 1 0 27 27 27 70.87 1 0 28 28 26 56.80 1 0 28 28 27 56.25 1 0 28 28 24 51.63 1 0
Kerala 19 19 1 36.15 1 1 19 7 6 19.75 2 0 20 11 11 29.13 1 0 20 11 5 26.32 1 0 20 13 13 33.27 1 0Madhya
Pradesh37 37 24 40.78 1 0 37 36 21 45.60 1 0 40 38 1 32.47 2 0 40 39 35 47.20 1 0 40 40 40 57.08 1 0
Maharashtra 45 45 37 48.51 1 0 45 44 42 63.80 1 0 48 47 20 47.02 1 0 48 48 39 53.30 1 0 48 47 43 51.24 1 1Manipur 2 2 0 32.68 1 0 2 2 2 30.02 1 0 2 2 2 45.31 1 0 2 2 1 22.99 1 0 2 2 2 34.95 1 0Meghalaya 2 2 1 35.92 1 0 2 1 1 74.31 1 0 2 2 2 62.42 1 0Mizoram 1 1 0 37.07 1 0 1 NC NC NC NC NCNagaland 1 0 0 0 – 1 0 0 0 – 1 1 0 48.32 2 0 1 NC NC NC NC NC 1 1 1 64.64 1 0Orissa 20 20 6 33.33 1 0 20 19 15 38.46 1 0 21 20 4 38.18 2 0 21 21 20 56.07 1 0 21 21 20 57.46 1 1Punjab 13 13 9 37.31 1 0 13 11 10 45.96 1 0 13 13 0 34.85 2 0 13 13 12 52.45 1 0 13 13 6 41.53 1 0Rajasthan 23 22 10 39.95 1 0 23 23 14 50.35 1 0 25 25 1 30.65 2 0 25 25 18 42.64 1 2 25 25 25 52.72 1 0Sikkim 1 1 1 Single
Contestant1 NC NC NC NC NC NC 1 1 0 25.84 1 0
338A
.F
arooquiand
E.
Sridharan
Dow
nloa
ded
by [
Uni
vers
iteit
Lei
den
/ LU
MC
] at
10:
04 2
6 Ju
ly 2
016

Madras/TamilNadu
39 39 3 41.69 1 0 39 9 9 12.51 3 0 39 15 14 22.27 2 0 39 22 20 31.62 1 0 39 26 25 40.5 1 0
Tripura 2 2 2 58.25 1 0 2 2 0 36.30 2 0 2 2 1 39.74 1 0 2 2 0 22.61 2 1 2 2 0 45.61 1 0Uttar Pradesh 85 85 47 33.44 1 6 85 78 73 48.54 1 0 85 85 0 24.99 2 0 85 85 51 35.90 1 9 85 85 83 53.03 1 0West Bengal 40 40 14 39.69 1 1 40 31 13 28.20 2 0 42 34 3 29.37 3 0 42 41 4 36.51 2 0 42 42 16 48.16 1 0Andaman &
NicobarIslands
1 1 1 52.57 1 0 1 1 1 61.48 1 0 1 1 1 58.45 1 0 1 1 1 53.2 1 0 1 1 1 52.85 1 0
Chandigarh 1 1 0 23.04 1 0 1 1 1 66.85 1 0 1 1 0 28.37 2 0 1 1 1 49.65 1 0 1 1 1 66.02 1 0Dadra &
NagarHaveli
1 1 1 50.14 1 0 1 1 1 39.17 1 0 1 1 1 46.93 1 0 1 1 1 61.89 1 0 1 1 0 40.31 1 0
NCT of Delhi 7 7 1 38.79 2 0 7 7 7 39.17 1 7 7 0 30.15 2 7 7 6 50.40 1 7 7 7 68.72 1 0Lakshadweep 1 NC NC NC NC NC 1 1 1 Single
constestant0 0 1 1 1 58.59 1 0 1 1 0 3.85 3 1 1 1 1 54.47 1 0
Puducherry 1 1 1 39.83 1 0 1 1 1 66.27 1 0 1 NC NC NC NC 1 1 1 66.45 1 0 1 1 1 58.86 1 0Total 520 516 283 40.78 1 9 518 441 352 43.68 1 1 542 492 154 34.52 2 6 542 492 353 42.69 1 22 541 517 414 49. 1 7
Source: Election Commission of India, Statistical Report of Lok Sabha Elections, 1967–1984.TS, total number of seats; SC, seats contested; SW, seats won; VS, vote share; PV, position by vote share; CP, constituency position; NC, not contested.
Com
monw
ealth&
Com
parativeP
olitics339
Dow
nloa
ded
by [
Uni
vers
iteit
Lei
den
/ LU
MC
] at
10:
04 2
6 Ju
ly 2
016

Table 2. Performance of Indian National Congress 1989–2014.
State/UnionTerritory
1989 1991 1996 1998 1999 2004 2009 2014
TS SC SW VS% PV TS SC SW VS% PV TS SC SW VS% PV TS SC SW VS% PV TS SC SW VS% PV TS SC SW VS% PV TS SC SW VS% PV TS SC SW VS% PV
AndhraPradesh
42 42 39 51 1 42 42 25 46 1 42 42 22 40 1 42 42 22 39 1 42 42 5 43 1 42 34 29 42 1 42 42 33 39 1 42 41 2 12 3
ArunachalPradesh
2 2 2 50 1 2 2 2 69 1 2 2 0 29 2 2 2 0 24 2 2 2 2 57 1 2 1 0 10 3 2 2 2 51 1 2 2 1 42 2
Assam – – – – 14 14 8 29 1 14 14 5 32 1 14 13 10 39 1 14 14 10 38 1 14 14 9 35 1 14 14 7 35 2 14 13 3 30 2Bihar 54 54 4 28 2 54 51 1 24 2 54 54 2 13 4 54 21 5 7 5 54 16 4 9 4 40 4 3 5 5 40 37 2 10 4 40 12 2 9 3Goa 2 2 1 47 1 2 2 2 58 1 2 2 0 35 1 2 2 2 32 1 2 2 0 39 2 2 1 1 30 2 2 1 1 22 2 2 2 0 37 2Gujarat 26 26 3 37 1 26 16 5 29 2 26 26 10 39 2 26 25 7 37 2 26 26 6 45 2 26 25 12 44 1 26 26 11 43 2 26 25 0 34 2Haryana 10 10 4 46 1 10 10 9 37 1 10 10 2 23 1 10 10 3 26 1 10 10 0 35 1 10 10 9 42 1 10 10 9 42 1 10 10 1 23 3Himachal
Pradesh4 4 1 42 2 4 4 2 46 1 4 4 4 54 1 4 4 1 42 2 4 4 0 40 2 4 4 3 52 1 4 4 1 46 2 4 4 0 41 2
Jammu &Kashmir
6 3 2 39 1 – – – – 6 6 4 28 1 6 6 1 19 3 6 5 0 18 2 6 3 2 28 1 6 3 2 25 1 6 3 0 23 2
Karnataka 28 28 27 49 1 28 28 23 42 1 28 28 5 31 2 28 28 9 36 1 28 28 18 45 1 28 28 8 37 1 28 28 6 38 2 28 28 9 41 2Kerala 20 17 14 42 1 20 16 13 39 1 20 17 7 38 1 20 17 8 39 1 20 17 8 39 1 20 17 0 32 1 20 17 13 40 1 20 15 8 32 1Madhya
Pradesh40 40 8 38 2 40 40 27 45 1 40 40 8 31 2 40 40 10 39 2 40 40 11 44 2 29 29 4 34 2 29 28 12 40 2 29 29 2 35 2
Maharashtra 48 48 28 45 1 48 48 38 48 1 48 48 15 35 1 48 41 33 44 1 48 42 10 30 1 48 26 13 24 1 48 27 17 20 1 48 26 2 18 3Manipur 2 2 2 45 1 2 2 1 38 1 2 2 2 40 1 2 2 0 19 2 2 2 0 25 1 2 1 1 15 2 2 2 2 43 1 2 2 2 42 1Meghalaya 2 2 2 55 1 2 2 2 57 1 2 2 1 54 1 2 2 2 48 1 2 2 1 33 1 2 2 1 46 1 2 2 1 45 1 2 2 1 39 1Mizoram 1 1 1 49 1 1 1 1 38 1 1 1 1 43 1 1 1 0 35 2 1 2 1 1 1 66 1 1 1 1 49 1Nagaland 1 1 1 60 1 1 1 0 44 1 1 1 1 62 1 1 1 1 87 1 1 1 1 71 1 1 1 0 26 2 1 1 0 30 2 1 1 0 30 2Orissa 21 21 3 38 2 21 21 13 44 1 21 21 16 45 1 21 21 5 41 1 21 20 2 37 1 21 21 2 40 1 21 21 6 33 2 21 21 0 21 2Punjab 13 13 2 27 2 13 13 12 49 1 13 13 2 35 1 13 8 0 26 2 13 11 8 38 1 13 11 2 34 1 13 13 8 45 1 13 13 3 33 1Rajasthan 25 25 0 37 1 25 25 13 44 2 25 25 12 41 2 25 25 18 45 1 25 25 9 45 2 25 25 4 41 2 25 25 20 48 1 25 25 0 31 2Sikkim 1 1 0 22 2 1 1 4 1 1 0 33 2 1 1 0 5 3 1 1 0 27 2 1 1 0 30 2 1 1 0 2 5Tamil Nadu 39 28 27 40 1 39 28 28 43 1 39 29 0 18 3 39 35 0 5 7 39 11 2 11 3 39 10 10 14 3 39 15 8 15 3 39 39 0 4 6Tripura 2 2 2 56 1 2 2 2 83 1 2 2 0 34 2 2 2 0 42 2 2 2 0 14 2 2 2 0 14 2 2 0 0 30.8 2 2 2 0 15 2Uttar Pradesh 85 84 15 32 2 85 80 5 18 3 85 85 5 8 4 85 76 0 6 4 85 76 10 15 4 80 73 9 12 4 80 69 21 18 3 80 67 2 8 4West Bengal 42 41 4 39 1 42 39 5 35 2 42 42 9 40 1 42 39 1 15 3 42 41 3 13 3 42 37 6 15 3 42 13 6 14 3 42 42 4 10 4Chhattisgarh 11 11 1 40 2 11 11 1 37 2 11 11 1 20 2Jharkhand 14 9 6 24 2 14 9 1 15 2 14 9 0 14 3Uttarakhand 5 5 1 38 2 5 5 5 43 1 5 5 0 34 1Andaman &
NicobarIslands
1 1 1 47 1 1 1 1 51 1 1 1 1 58 1 1 1 1 36 1 1 1 0 43 1 1 1 1 56 1 1 1 0 43 2TaT 1 1 0 44 2
Chandigarh 1 1 0 40 2 1 1 1 36 1 1 1 0 30 2 1 1 0 39 2 1 1 1 47 1 1 1 1 52 1 1 1 1 47 1 1 1 0 27 2
340A
.F
arooquiand
E.
Sridharan
Dow
nloa
ded
by [
Uni
vers
iteit
Lei
den
/ LU
MC
] at
10:
04 2
6 Ju
ly 2
016
Dadra &NagarHaveli
1 1 0 29 2 1 1 1 62 1 1 1 1 56 1 1 1 0 4 3 1 1 0 15 4 1 1 0 26 2 1 1 0 46 2 1 1 0 45 2
Daman &Diu
1 1 0 38 1 1 1 0 22 2 1 1 1 51 1 1 1 0 2 3 1 1 1 50 1 1 1 1 50 1 1 1 0 29 2 1 1 0 44 2
NCT of Delhi 7 7 2 43 1 7 7 2 40 2 7 7 2 37 2 7 7 1 43 2 7 7 0 42 2 7 7 6 55 1 7 7 7 57 1 7 7 0 15 3Lakshadweep 1 1 1 52 1 1 1 1 51 1 1 1 1 52 1 1 1 1 52 1 1 1 1 54 1 1 1 0 48 2 1 1 1 52 1 1 1 0 47 2Puducherry 1 1 1 50 1 1 1 1 54 1 1 1 1 40 1 1 1 0 32 1 1 1 1 37 1 1 0 0 0 0 1 1 1 49 1 1 1 0 27 2Total 529 510 197 40 1 537 500 244 36 1 543 529 140 29 1 543 477 141 26 1 543 453 114 28 1 543 417 145 27 1 543 440 206 29 1 543 464 44 19 2
Source: Election Commission of India, Statistical Report of Lok Sabha Elections, 1989–2014.TS, total number of seats; SC, seats contested; SW, seats won; VS, vote share; PV, position by vote share.
Com
monw
ealth&
Com
parativeP
olitics341
Dow
nloa
ded
by [
Uni
vers
iteit
Lei
den
/ LU
MC
] at
10:
04 2
6 Ju
ly 2
016

third or worse rank then it becomes significantly more difficult to win, althoughthere have been exceptions such as seven cases, since 1989, of the BJP’s risefrom a third or worse position to top position by vote share, of which fivewere in the 2014 election (Uttar Pradesh 1991 and 2014, Goa 1998, Bihar,Haryana, Jammu and Kashmir, Maharashtra, 2014). Hence, we define beingcompetitive as being in one of the top two positions by vote share. Lookingat Congress decline in terms of competitiveness at the state and constituencylevel yields a more fleshed-out picture.
While in elections from 1967 to 1984, Congress slipped to third or worse inonly three states for one election each, overwhelmingly retaining second placeeven where it lost, by contrast, in the post-1989 period Congress has slipped tothird or worse position in four major states – U.P., Bihar, West Bengal andTamil Nadu – that total 201 seats or 37 per cent of the seats in the LokSabha (Tables 1 and 2) for several elections. In the largest state of U.P., fromsecond position in vote share in 1989, it fell to third in 1991, fourth in 1996and remained at that except for a recovery to third place in 2009 (second inseats). In Bihar, it slipped from second in 1991 to fourth or worse from1996. In Tamil Nadu, it slipped from first place (due to the then seat-sharingalliances) in 1991 to third in 1996 and remained at that or worse through to2014. In West Bengal, following the breaking away of the Trinamul Congressin 1997, Congress slipped to third place in 1998 and finally to fourth in 2014.
In the debacle of 2014, Congress slipped to third or worse position in asmany as ten states (including the Union Territory of Delhi), that is, in additionto the four major states above, in Andhra Pradesh, Haryana, Jharkhand, Mahar-ashtra, Sikkim and Delhi, thus becoming uncompetitive in states that totalled320 seats, or a majority of 59 per cent of Lok Sabha seats!
Competitiveness in state assembly elections
The pattern is roughly paralleled in Congress performance in state assemblyelections (Table 3). In vote shares in state assemblies (held in varying years,mostly not coincident with Lok Sabha elections), Congress had becomeuncompetitive (third or worse) by the latest assembly elections in as many asnine states including Delhi. Even in states where it remained among the toptwo in vote share, it lagged behind the leading party or coalition and has notbeen in power in some states for many years – Gujarat since 1995, Odishasince 1999, Madhya Pradesh and Chhattisgarh since 2003, Punjab since2007, to name major states.
Palshikar (2015, Table 5) divides the states into three categories – Congressstates (Delhi, Haryana, Maharashtra, Manipur, Assam, Arunachal Pradesh,Meghalaya and Mizoram), Congress-presence states (Himachal Pradesh,Punjab, Rajasthan, Gujarat, Goa, Karnataka, Kerala, Andhra Pradesh,
342 A. Farooqui and E. Sridharan
Dow
nloa
ded
by [
Uni
vers
iteit
Lei
den
/ LU
MC
] at
10:
04 2
6 Ju
ly 2
016

Table 3. Congress performance in the state assembly elections (1989–2014).
State/UnionTerritory TS SC SW PS VS PV TS SC SW PS VS PV TS SC SW PS VS PV TS SC SW PS VS PV TS SC SW PS VS PV TS SC SW PS VS PV TS SC SW PS VS PV
Andhra Pradesh 1989 1994 1999 2004 2009 2014294 287 181 1 47 1 294 294 26 2 34 2 294 293 91 2 41 2 294 234 185 1 39 1 294 294 156 1 37 1 175 173 0 0 3 3
ArunachalPradesh
1990 1995 1999 2004 2009 2014
60 59 37 1 44 1 60 60 43 1 51 1 60 60 53 1 52 1 60 60 34 1 44 1 60 60 42 1 52 1 60 60 42 1 50 1Assam 1991 1996 2001 2006 2011
126 125 66 1 29 1 122 122 34 2 31 1 126 126 71 1 40 1 126 120 53 2 31 1 126 126 78 1 39 1Bihar 1990 1995 2000 2005 (February) 2005 (October) 2010
324 323 71 2 25 2 324 320 29 3 16 2 324 324 23 4 11 3 243 84 10 4 5 4 243 51 9 5 6 5 243 243 4 4 8 4Goa 1989 1994 1999 2002 2007 2012
40 40 20 1 41 1 40 40 18 1 38 1 40 40 21 1 39 1 40 40 16 2 38 1 40 32 16 1 32 1 40 33 9 2 31 2Gujarat 1990 1995 1998 2002 2007 2012
182 181 33 3 31 1 182 181 45 2 33 2 182 179 53 2 35 2 182 180 51 2 39 2 182 173 59 2 38 2 182 176 61 2 39 2Haryana 1991 1996 2000 2005 2009 2014
90 90 51 1 34 1 90 90 9 4 21 4 90 90 21 2 31 1 90 90 67 1 43 1 90 90 40 1 35 1 90 90 15 3 21 3Himachal
Pradesh1990 1993 1998 2003 2007 2012
67 66 9 3 37 2 68 67 52 1 49 1 68 68 31 ∗ 43 1 68 68 43 1 41 1 68 67 23 2 39 2 68 68 36 1 43 1Jammu &
Kashmir1996 2002 2008 2014
87 84 7 3 20 2 87 78 20 2 24 2 87 78 17 3 17 3Karnataka 1989 1994 1999 2004 2008 2013
224 221 178 1 44 1 224 221 34 3 27 2 224 222 132 1 41 1 224 224 65 2 36 1 224 222 80 2 35 1 224 224 122 1 37 1Kerala 1991 1996 2011 2006 2011
140 91 55 1 32 1 140 94 37 2 30 1 140 88 62 1 31 1 140 77 24 2 24 2 140 81 38 2 26 2Madhya Pradesh 1990 1993 1998 2003 2008 2013
320 318 56 2 33 2 320 318 174 1 41 1 320 316 172 1 41 1 230 229 38 2 32 2 230 228 71 2 33 2 230 229 58 2 36 2Maharashtra 1990 1995 1999 2004 2009 2014
288 276 141 1 38 1 288 286 80 1 31 1 288 249 75 1 27 1 288 157 69 1 21 1 288 170 82 1 21 1 288 287 42 3 18 3Manipur 1990 1995 2000 2002 2007 2012
54 54 24 1 34 1 60 60 22 1 29 1 60 47 11 2 18 1 60 58 20 1 26 1 60 59 30 1 34 1 60 60 42 1 42 1Meghalaya 1993 1998 2003 2008 2013
60 60 24 1 35 1 60 59 25 1 35 1 60 60 22 1 30 1 60 60 25 1 33 1 60 60 29 1 35 1Mizoram 1989 1993 1998 2003 2008 2013
40 34 23 1 35 1 40 28 16 1 33 2 40 40 6 2 30 1 40 40 12 2 30 2 40 40 32 1 39 1 40 40 34 1 45 1Nagaland 1989 1993 1998 2003 2008 2013
60 60 36 1 52 1 60 59 35 1 46 1 60 60 53 1 51 1 60 60 21 1 36 1 60 60 23 2 36 1 60 56 8 2 25 2
(Continued)
Com
monw
ealth&
Com
parativeP
olitics343
Dow
nloa
ded
by [
Uni
vers
iteit
Lei
den
/ LU
MC
] at
10:
04 2
6 Ju
ly 2
016
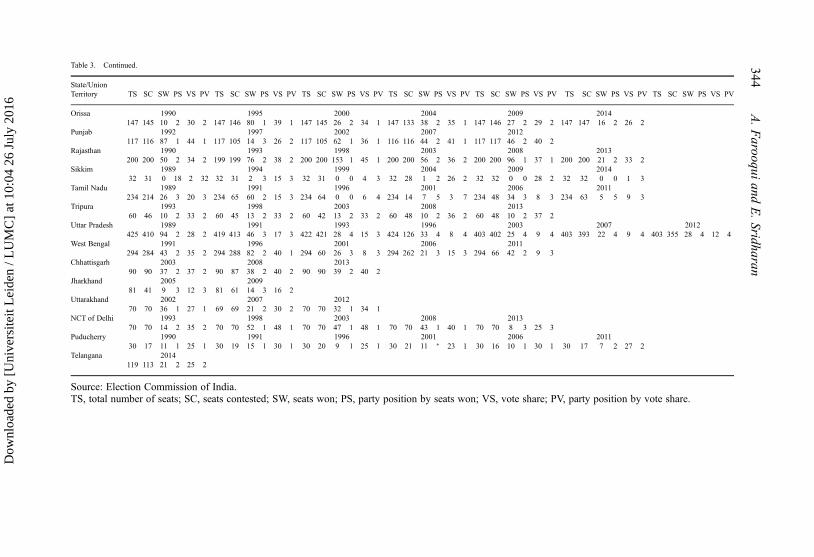
Table 3. Continued.
State/UnionTerritory TS SC SW PS VS PV TS SC SW PS VS PV TS SC SW PS VS PV TS SC SW PS VS PV TS SC SW PS VS PV TS SC SW PS VS PV TS SC SW PS VS PV
Orissa 1990 1995 2000 2004 2009 2014147 145 10 2 30 2 147 146 80 1 39 1 147 145 26 2 34 1 147 133 38 2 35 1 147 146 27 2 29 2 147 147 16 2 26 2
Punjab 1992 1997 2002 2007 2012117 116 87 1 44 1 117 105 14 3 26 2 117 105 62 1 36 1 116 116 44 2 41 1 117 117 46 2 40 2
Rajasthan 1990 1993 1998 2003 2008 2013200 200 50 2 34 2 199 199 76 2 38 2 200 200 153 1 45 1 200 200 56 2 36 2 200 200 96 1 37 1 200 200 21 2 33 2
Sikkim 1989 1994 1999 2004 2009 201432 31 0 18 2 32 32 31 2 3 15 3 32 31 0 0 4 3 32 28 1 2 26 2 32 32 0 0 28 2 32 32 0 0 1 3
Tamil Nadu 1989 1991 1996 2001 2006 2011234 214 26 3 20 3 234 65 60 2 15 3 234 64 0 0 6 4 234 14 7 5 3 7 234 48 34 3 8 3 234 63 5 5 9 3
Tripura 1993 1998 2003 2008 201360 46 10 2 33 2 60 45 13 2 33 2 60 42 13 2 33 2 60 48 10 2 36 2 60 48 10 2 37 2
Uttar Pradesh 1989 1991 1993 1996 2003 2007 2012425 410 94 2 28 2 419 413 46 3 17 3 422 421 28 4 15 3 424 126 33 4 8 4 403 402 25 4 9 4 403 393 22 4 9 4 403 355 28 4 12 4
West Bengal 1991 1996 2001 2006 2011294 284 43 2 35 2 294 288 82 2 40 1 294 60 26 3 8 3 294 262 21 3 15 3 294 66 42 2 9 3
Chhattisgarh 2003 2008 201390 90 37 2 37 2 90 87 38 2 40 2 90 90 39 2 40 2
Jharkhand 2005 200981 41 9 3 12 3 81 61 14 3 16 2
Uttarakhand 2002 2007 201270 70 36 1 27 1 69 69 21 2 30 2 70 70 32 1 34 1
NCT of Delhi 1993 1998 2003 2008 201370 70 14 2 35 2 70 70 52 1 48 1 70 70 47 1 48 1 70 70 43 1 40 1 70 70 8 3 25 3
Puducherry 1990 1991 1996 2001 2006 201130 17 11 1 25 1 30 19 15 1 30 1 30 20 9 1 25 1 30 21 11 ∗ 23 1 30 16 10 1 30 1 30 17 7 2 27 2
Telangana 2014119 113 21 2 25 2
Source: Election Commission of India.TS, total number of seats; SC, seats contested; SW, seats won; PS, party position by seats won; VS, vote share; PV, party position by vote share.
344A
.F
arooquiand
E.
Sridharan
Dow
nloa
ded
by [
Uni
vers
iteit
Lei
den
/ LU
MC
] at
10:
04 2
6 Ju
ly 2
016

Odisha, Madhya Pradesh, Chhattisgarh, Uttarakhand, Tripura, Nagaland, J&K)and non-Congress states (Tamil Nadu, U.P., Bihar, Jharkhand, West Bengal,Sikkim). Of the Congress states, Delhi, Haryana and Maharashtra could be con-sidered to have moved to the Congress-presence category. We notice that non-Congress states add up to 216 Lok Sabha seats. If to this we add Congress-pres-ence states in which Congress has not been in power for over a dozen years(Gujarat, Odisha, M.P., Chhattisgarh) we get a total of 303 seats, that is, Con-gress has become uncompetitive by this broader measure in states adding up toa substantial majority of seats.
Competitiveness at the Lok Sabha constituency level
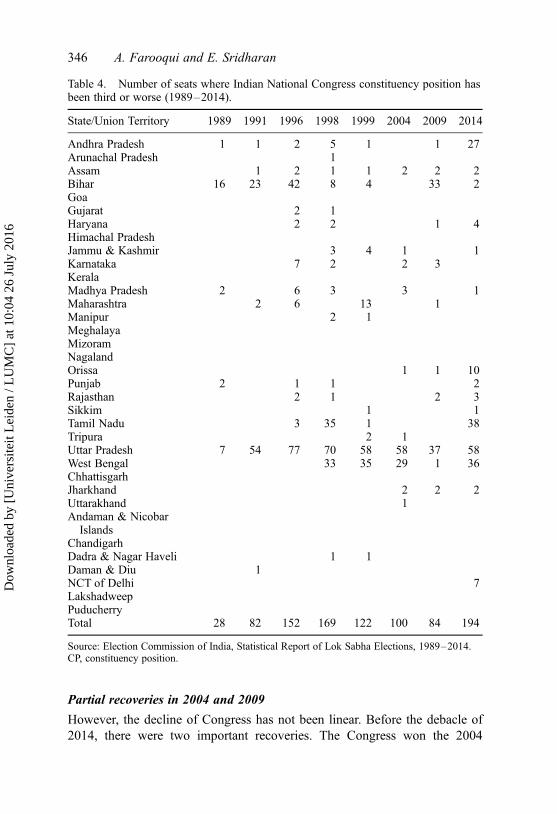
From 1967 to 1984, Congress was third or worse in only as few as 45 consti-tuencies over five elections, of which 22 were in 1980 (Table 1) but since 1989has greatly declined from 28 constituencies in 1989 to 169 in 1998, recoveringto only 84 in 2009, to 194 in 2014 marking a sharp erosion and pointing to asharp contrast between the two periods (Table 4).
Looking at the situation since the elections of the 1990s (Table 5), despiterecoveries in 2004 and 2009, Congress has not won 95 constituencies since1989, another 17 since 1991, another 27 since 1996, another 11 since 1998and another 7 since 1999 to mention only long-standing (since the end of the1990s) lack of competitiveness.
Other than these constituencies there have been as many as 34 that Con-gress has won only once since 1989, eight only once since 1991, 19 onlyonce since 1996, 10 only once since 1998 and six only once since 1999, indi-cating a long-term erosion of competitiveness in the post-1989 period (Table 6).
Part of this lack of competitiveness at the constituency level is because ofslippage of support in the four major states mentioned above, part of it is due tosplits in the party in West Bengal since 1997 and Maharashtra since 1999, fol-lowed most recently by Andhra Pradesh since 2012, all states which were Con-gress strongholds, and part of it due to decisions to hand over seats to allies likein Tamil Nadu and Bihar since the 1990s, later in Maharashtra and WestBengal, also an indication of lack of competitiveness and a process of cedingground (Table 7).
Congress has lost competitiveness in constituencies even outside the fourmajor states; Bihar, Tamil Nadu, West Bengal and Uttar Pradesh; in which ithas been decimated over the past quarter-century. In states other than thesefour, the Congress party had fallen to third or worse position in 4 constitu-encies in 1989, 5 in 1991, 30 in 1996, 22 in 1998, 24 in 1999, 13 in 2004,13 in 2009, and 60 in 2014. In 22 (of the total of 95) constituencies,other than in the above mentioned four major states, party has not wonsince 1989.
Commonwealth & Comparative Politics 345
Dow
nloa
ded
by [
Uni
vers
iteit
Lei
den
/ LU
MC
] at
10:
04 2
6 Ju
ly 2
016
Partial recoveries in 2004 and 2009
However, the decline of Congress has not been linear. Before the debacle of2014, there were two important recoveries. The Congress won the 2004
Table 4. Number of seats where Indian National Congress constituency position hasbeen third or worse (1989–2014).
State/Union Territory 1989 1991 1996 1998 1999 2004 2009 2014
Andhra Pradesh 1 1 2 5 1 1 27Arunachal Pradesh 1Assam 1 2 1 1 2 2 2Bihar 16 23 42 8 4 33 2GoaGujarat 2 1Haryana 2 2 1 4Himachal PradeshJammu & Kashmir 3 4 1 1Karnataka 7 2 2 3KeralaMadhya Pradesh 2 6 3 3 1Maharashtra 2 6 13 1Manipur 2 1MeghalayaMizoramNagalandOrissa 1 1 10Punjab 2 1 1 2Rajasthan 2 1 2 3Sikkim 1 1Tamil Nadu 3 35 1 38Tripura 2 1Uttar Pradesh 7 54 77 70 58 58 37 58West Bengal 33 35 29 1 36ChhattisgarhJharkhand 2 2 2Uttarakhand 1Andaman & Nicobar
IslandsChandigarhDadra & Nagar Haveli 1 1Daman & Diu 1NCT of Delhi 7LakshadweepPuducherryTotal 28 82 152 169 122 100 84 194
Source: Election Commission of India, Statistical Report of Lok Sabha Elections, 1989–2014.CP, constituency position.
346 A. Farooqui and E. Sridharan
Dow
nloa
ded
by [
Uni
vers
iteit
Lei
den
/ LU
MC
] at
10:
04 2
6 Ju
ly 2
016

elections in coalition, with 27 per cent votes and 145 seats, and won again, incoalition, improving its performance in 2009 with 28.6 per cent votes and 206seats, and was in power for 10 years, 2004–2014. These recoveries were on topof an improvement of vote share from 25.8 per cent in 1998 to 28.2 per cent in1999 (though accompanied by a loss of seats). These recoveries also needexplanation as part of the longer term evolution of Congress.
Table 5. Number of seats where the INC has not won since years 1989–1999.
State/Union Territory 1989 1991 1996 1998 1999
Andhra Pradesh 1 1Arunachal PradeshAssam 1Bihar 22 1Goa -Gujarat 3 1HaryanaHimachal PradeshJammu & KashmirKarnataka 2 2Kerala 2Madhya Pradesh 5 2 1Maharashtra 2 3 1 6ManipurMeghalaya 1MizoramNagalandOrissa 1 1 4Punjab 1Rajasthan 1Sikkim 1Tamil Nadu 5 14Tripura 2Uttar Pradesh 32 2West Bengal 14 12Chhattisgarh 2 1Jharkhand 5Uttarakhand 1Andaman & Nicobar IslandsChandigarhDadra & Nagar Haveli 1Daman & DiuNCT of DelhiLakshadweepPuducherryTotal 95 17 27 11 7
Source: Authors own calculations based on Statistical Report of Lok Sabha Elections 1989–2014.
Commonwealth & Comparative Politics 347
Dow
nloa
ded
by [
Uni
vers
iteit
Lei
den
/ LU
MC
] at
10:
04 2
6 Ju
ly 2
016

Table 6. Number of seats won by the INC only once since years 1989–1999.
State/Union Territory 1989 1991 1996 1998 1999
Andhra Pradesh 5£ 1# 1�Arunachal PradeshAssamBihar 2×GoaGujarat 4E l.
Haryana 11Himachal PradeshJammu & Kashmir 1¤Karnataka 7mKerala 28Madhya Pradesh 6#Maharashtra 3+ 1p 3˛ManipurMeghalayaMizoramNagalandOrissa 1$ 4»Punjab 1æRajasthanSikkimTamil Nadu 4+TripuraUttar Pradesh 12^West Bengal 4
∑
Chhattisgarh 1gJharkhand 5@ 2eUttarakhand 1! 3aAndaman & Nicobar Islands 1tChandigarhDadra & Nagar HaveliDaman & DiuNCT of DelhiLakshadweepPuducherryTotal 34 8 19 10 6
Source: Authors own calculations based on Statistical Report of Lok Sabha Elections 1989–2014.Notes: ×Nawada was won again in 2004; ERajkot, Porbandar and Junagadh were won again in 2009,and Amreli in 2004; #Ujjain, Mandsaur and Hoshangabad were won again in 2004, Rewa, Indore andKhajuraho in 1999; +Parbhani was won in 1998, Aurangabad in 1999 and Mumbai South Central in2009; $Jajpur was won again in 1998; ^Aligarh, Mathura and Varanasi were won in 2004, Bareilly,Unnao, Sultanpur, Barabanki, Faizabad, Bahraich and Mahajganj were won again in 2009,Muzaffarnagar and Meerut were won in 1999; @Dhanbad, Singhbhum, Khunti and Lohardargawere won in 2004, Kodarma in 1999; !Garhwal was won in 1989; Warangal, 1Hisar was wonagain in 2004;
∑
Howrah, Srerampur and Tamluk were won again in 1996, Purulia in 2004; aTehriGarhwal, Almora and Hardwar were won again in 2009; £Warangal, Srikakulam, Anakpali,Chittoor and Karimnagar were won in 2009; mBelgaum, Bagalkot, Shimoga, Hasan and BangaloreNorth were won again in 1999, Davnagere was won in 1998 and Chamrajnagar in 2009; pSatarawas one again in 1998; +Nilgiris and Thenkasi were won again in 2004, Tiruchirapalli andCuddalore in 2009; eRajnandgaon and Raigarh were won in 1998; #Mahbubnagar was won in2004; ¤Ladakh was won again in 2009; 8Iduki was won in 2009 and Kotayam in 1999; »Balasoreand Sundargarh were won again in 2009, Sambalpur in 2004 and Dhenkanal in 1999; æGurdaspurwas won again in 2009; gSarguja was won in 1999; �Guntur was won again in 2004; l.ChotaUdaipur was won again in 2004; ˛Dhule was won again in 2004 and Ramtek in 2009; tAndamanand Nicobar Islands were won again in 2004.
348 A. Farooqui and E. Sridharan
Dow
nloa
ded
by [
Uni
vers
iteit
Lei
den
/ LU
MC
] at
10:
04 2
6 Ju
ly 2
016

It has been argued that the best explanation for the Congress’, and its UPAcoalition’s very narrow victory (UPA won a fraction of a percentage point morethan the BJP-led NDA) in 2004 was that the Congress recognised its weaknessin many states and went in for a pre-electoral coalition (Table 7) while the BJPwent alone without a coalition in several states (Sridharan, 2004; Wilkinson,2005; Yadav, 2004). In other words, it was a victory which in some wayswas an admission of weakness (Wilkinson, 2005). Likewise, the Congressand UPA victory in 2009 owed more to fortuna (luck) than to virtu(prowess) according to Yadav and Palshikar (2009), a combination of alarger and more effective coalition than the eroded NDA, five years of recordeconomic growth and some social welfare measures that were made possibleby the revenues from growth.
Decline in Congress competitiveness: possible explanations
What are the possible causes of Congress decline as indicated by this erosion ofcompetitiveness at the state level for both Lok Sabha and assembly elections,and at the Lok Sabha constituency level? We also need to take into account
Table 7. Ceding ground: congress allies since 1991.
Year Allies
1989 Kerala Congress (M), Indian Union Muslim League1991 All India Anna Dravida Munnetra Kazhagam, Indian Union Muslim League,
Kerala Congress (M)1996 Kerala Congress (M), Indian Union Muslim League1998 Kerala Congress (M), Indian Union Muslim League1999 All India Anna Dravida Munnetra Kazgham, Indian Union Muslim League,
Kerala Congress (M), Rashtriya Janata Dal2004 Nationalist Congress Party, Indian Union Muslim League, Pattali Makkal
Katchi, Jharkhand Mukti Morcha, Telangana Rashtra Samiti, Lok JanshaktiParty, Rashtriya Janata Dal, Jammu and Kashmir Peoples Democratic Party,Kerala Congress (M), Marumalarchi Dravida Munnetra Kazhagam, DravidaMunnetra Kazhgam
2009 Nationalist Congress Party, Indian Union Muslim League, Kerala Congress (M),Dravida Munnetra Kazhagam, Viduthalai Chiruthaigal Katchi, Jammu &Kashmir National Conference, All India Trinamool Congress, JharkhandMukti Morcha, Bodo People’s Front, All India Majlis-e-Ittahadul Muslimeen.
2014 Bodo People’s Front, Rashtriya Janata Dal, Nationalist Congress Party, Jammu& Kashmir National Conference, Jharkhand Mukti Morcha, Indian UnionMuslim League, Socialist Janata Dal (Democratic), Revolutionary SocialistParty, Kerala Congress (Mani), People’s Party of Punjab, Rashtriya Lok Dal,Mahan Dal.
Source: Authors’ own compilation from news reports.
Commonwealth & Comparative Politics 349
Dow
nloa
ded
by [
Uni
vers
iteit
Lei
den
/ LU
MC
] at
10:
04 2
6 Ju
ly 2
016

the Congress recoveries in 2004 and 2009; it was not a linear decline. The fol-lowing explanations can be put forward.
General explanations, 1967 onwards
A generic and Rikerian explanation applying coalition theory to congress-type, encompassing, umbrella parties in general, conceiving of such partiesas internal grand coalitions of interests, and assuming primarily office-seeking motivations and power as a fixed sum, or even with some upwardflexibility, would imply that without the resources to keep all major interestssatisfied, a large umbrella party would be fated to disintegrate. This logic canbe applied to the Congress from the late 1960s, particularly its inability toaccommodate newly mobilised interests such as the intermediate-caste,newly rich agrarian interests in north India after the Green Revolution. Ifthe processes of internal democracy were undermined, such disintegrationwould be accelerated.
Following Sridharan (2002), the fragmentation of the national party systemwas due to Duvergerian dynamics at play since 1967 in a federal system withstates with significant powers, and importantly, states which were distinctlinguo-cultural units with their specific identities, which created incentivesfor mobilisation of single-state parties. These incentivised ethno-regionalparties that reacted against the perceived insensitivity of the Congress totheir demands; it also incentivised intermediate-caste agrarian parties in north-ern Indian states in response to upper-caste hegemony and the lack of internaldemocracy in Congress, particularly after the 1969 split after which the IndiraGandhi-led Congress suspended the processes of internal elections and becamea more centralised, top-down party. The de-linking of national and state elec-tions in a growing number of states since the early national election of 1971also had the unintended consequence of furthering the prospects of regionalparties which could take on Congress in state elections on state-level issuesnot overshadowed by a national election in which Congress had no polity-wide challengers and could project itself as the only party capable of leadingthe nation. These explanations can account for the gradual growth of a principalregional opposition party in state after state and a loose national opposition inthe period of Congress hegemony before 1989, continuing since then, creatingbipolar if not two-party systems in most states.
The post-1989 period
However, there are explanations for Congress decline – and for the rise of theBJP and some caste-based regional parties – that are specific to the post-1989period. These can be divided into:
350 A. Farooqui and E. Sridharan
Dow
nloa
ded
by [
Uni
vers
iteit
Lei
den
/ LU
MC
] at
10:
04 2
6 Ju
ly 2
016

Organisational decay of Congress and the relative organisational vigour of theBJP
Chhibber, Jensenius, and Suryanayaran (2012) find that party organisation or thelack of it has a significant impact on the party system. Based on data from 15Indian states they find that the less parties are organised the more politicianshave an incentive to defect. This would lead us to relate the lack of internaldemocracy and generally weak organisation of the Congress to its furtherdecline by defection by politicians representing newly mobilised social constitu-encies to other parties or new parties. Manor (2007) and Hasan (2012) make thesame point in a different way, emphasising the fact that the party now depends ongovernment spending programmes as a substitute for a party organisation that canmobilise voter support as well as, related to the lack of organisation, the lack of aclear ideology or position on what Congress stands for. As Chandra (2000, p. 52)put it: ‘The institutional decay of the Congress party over a period of time trans-formed the party system by gradually creating newer opportunities for the sectionswhich the party had failed to accommodate over the years’.
Greater powers to the states in Indian federalism, linked to economicliberalisation and the rise of regional parties
Chhibber (2005), in an essay on the decline of the Congress (despite its victoryin 2004), also emphasises the role of the changing nature of Indian federalism.He emphasises that compared to the 1980s state governments in India play alarger role in their economies compared to the Central government in thepost-1991, post-liberalisation period with the end of Central licensing of econ-omic activity and states competing for domestic and foreign private investmentin an increasingly private investment-driven economy. There were also otherdevelopments that made state governments more secure such as the prevalenceof multi-party coalition governments since 1996 in which regional partiesplayed a key role, and the Supreme Court’s Bommai judgement (1994)which made it much more difficult to dismiss state governments and imposeCentral rule under Art. 356. The result of these developments, for Congress,was that ‘party aggregation . . . .is more difficult to achieve when voters’ prefer-ences are mostly “state”-based and candidates do not have to coordinate withpoliticians in other states’ (Chhibber, 2005, p. 53).
Sridharan (2012b) makes a similar argument in that he argues that while theIndian system remains a power-sharing one among all significant groups, thenature of power-sharing has shifted in the post-1996 coalition era from oneof power-sharing within an internally grand-coalitional party like Congressin its heyday to one of power-sharing in a coalition of parties at the Centre,each party representing particularistic interests. This makes Congress simplyless relevant to voters in achieving their objectives.
Commonwealth & Comparative Politics 351
Dow
nloa
ded
by [
Uni
vers
iteit
Lei
den
/ LU
MC
] at
10:
04 2
6 Ju
ly 2
016

Furthermore, coalitions at the Centre since 1996 gave incentives for the riseof regional parties (Wyatt, 2002; Ziegfeld, 2012); so does the absence of mean-ingful internal democracy within Congress, leading to the breakaway of signifi-cant parts or even the bulk of the state unit in major states like West Bengal(1997), Maharashtra (1999) and Andhra Pradesh (2012), with these new splin-ter parties enjoying the flexibility to participate in diverse central coalitions, inthe process greatly weakening Congress and forcing it to rely even more on pre-electoral coalitions, sometimes with these same splinter parties.
New communal, caste and class dynamics since 1989
Since 1989, new communal, caste and class dynamics that are often state-specific, with class dynamics related to caste and to economic liberalisationand growth, particularly the rise of the middle classes, including the seemingmaturing of a ‘new social bloc’ and the emergence of aspirational voting in2014, have eroded the Congress base.
The major development for the Congress in the post-1990, post-Mandalera, compared to the 1980s is the rise of Hindu nationalist/anti-Muslim mobil-isation by the BJP in the Ramjanmabhoomi/Ayodhya movement and the mobil-isation by the Other Backward Classes (OBCs) (in effect, backward castes thatare not Scheduled Castes), as well as later in the 1990s and 2000s, the rise of theBahujan Samaj Party (BSP) with its principal support base of Scheduled Casteseating into the traditional Congress base (Heath & Yadav, 1999; Yadav, 1999,for the composition of the Congress voter base; 2014a, 2014b, for the Congressand BJP bases in 2014; Varshney, 2002, pp. 60–86; Varshney, 2014, for anoverview of the BJP’s ideology and politics). The BJP was able to mobilisein several states of northern and western India, but most of all in U.P., its tra-ditional support among the upper castes from the late 1980s, partly due toHindu anxieties arising from separatist movements in Punjab (1980s) andKashmir (post-1989), and a sense that Congress was overly sympathetic tothe Muslim minority, a fallout of the Shah Bano case (1986), as well as gobeyond its traditional upper-caste support. The BJP was also able to mobilise,at least substantially because of the backlash to the Mandal decision to reserve27 per cent of public sector jobs and college admissions for OBCs in 1990, theupper castes, particularly in north India, and thus eat into the Congress base.
The loss of Congress vote share since 1989 among various major segmentsof the electorate, according to CSDS/Lokniti post-election survey data is shownin Table 8. As can be seen, from 1991 to 1999, the Congress vote share amongHindu upper castes plummeted steadily from 36 per cent to 16 per cent, reco-vering partially to 21 per cent and 26 per cent in 2004 and 2009, before plun-ging to 12 per cent in 2014. Among peasant proprietor castes, the support levelof roughly a quarter of the group in 2004 and 2009, the only elections for which
352 A. Farooqui and E. Sridharan
Dow
nloa
ded
by [
Uni
vers
iteit
Lei
den
/ LU
MC
] at
10:
04 2
6 Ju
ly 2
016

this was a separate category, plunged to 15 per cent in 2014. Among HinduOBCs as a whole, support declined from 32 per cent in 1991 to 21 per centin 1998, recovering partly to 27 per cent in 1999, 24 per cent in 2009, and plun-ging to 15 per cent in 2014. There has been somewhat of an erosion evenamong traditionally Congress voters (in most states) like the ScheduledCastes and Scheduled Tribes and even before the dips of 2014, the erosionamong Scheduled Castes at least partly being due to the rise of the BSP inseveral states (in terms of vote share). Only among Muslims, at 38 per centhas the Congress support remained steady between 1991 and 2014.
In 2014, according to the CSDS National Election Survey, the BJP led Con-gress among upper-caste voters (54 per cent to 12 per cent), peasant proprietorcastes (33 per cent to 15 per cent), upper OBCs (30 per cent to 15 per cent),lower OBCs (42 per cent to 16 per cent), Scheduled Castes (24 per cent to19 per cent) and Scheduled Tribes (38 per cent to 28 per cent) and among allfour social classes though with a declining lead as one went down the ladder– upper (32 per cent to 17 per cent), middle (32 per cent to 20 per cent),lower (31 per cent to 19 per cent) and poor (24 per cent to 20 per cent). TheBJP also led Congress both in rural areas (30 per cent to 19 per cent) andurban areas (33 per cent to 20 per cent).
What this reveals about the Congress base is that it has lost significant sec-tions of its erstwhile base to the BJP and other, primarily caste-based, stateparties, mainly in U.P. and Bihar, and become less of an encompassingumbrella party over the past two and a half decades. A rough calculationbased on actual population shares and turnout taken together with group-wise Congress support estimates in Table 8 indicates that over half the
Table 8. Congress vote share among different social groups Lok Sabha elections1991–2014.
Caste/community 1991 1996 1998 1999 2004 2009 2014
Hindu upper 36 27 20 16 21 26 12Peasant proprietor 23 25 15Hindu OBC 32 22 21 27 - 24 15Upper OBC’s 23 22Lower OBC’s 23 27SC 39 32 27 32 28 27 19ST 45 41 38 40 35 39 28Muslim 38 34 43 50 37 38 38Christian 39 38 29Sikh 25 41 21
Source: National Election Study, various years, Centre for Study of Developing Societies, 1996–2014.
Commonwealth & Comparative Politics 353
Dow
nloa
ded
by [
Uni
vers
iteit
Lei
den
/ LU
MC
] at
10:
04 2
6 Ju
ly 2
016

Congress vote in 2014 came from Muslims, Scheduled Castes and ScheduledTribes.
Heath and Yadav (1999) and Yadav, Kumar, and Heath (1999) have out-lined the profile of the Congress voter at the end of the decade (1990s) ofthe ‘second democratic upsurge’ of higher turnout among the relativelydeprived (lower castes and tribes, minorities, the poor and rural areas) aswell as put forward a conception of the emerging BJP base as a loose ‘newsocial bloc’ (Yadav et al., 1999) of upper and dominant castes includingrising peasant castes, and of upper classes including the rising middle class,united by relative economic and social privilege. The Congress profile overthe 1990s had become increasingly dependent on minority, Scheduled Caste,Scheduled Tribe, rural and poor voters while losing upper castes, OBCs andthe upper and middle classes to the BJP and other parties. The BJP’s ‘newsocial bloc’ seems to have come to fruition in 2014, a year in which as highas 49 per cent of the population self-identified as middle class (Kapur & Vaish-nav, 2015), and in which the BJP got more votes than Congress in all caste andreligious groups except Muslims, even among the poor, the Scheduled Castesand Scheduled Tribes.
Further buttressing the ‘new social bloc’ argument is the emergence of whatcan be called aspirational voting, in which voters identify ‘upwardly’ in classterms and vote accordingly. This is particularly so in the 2014 election,which we analyse below. The Congress plunged from 28.2 per cent to 19.3per cent vote share, going below 20 per cent for the first time ever and nolonger being the single largest party by votes, and to a derisory 44 seats, thefirst time it plunged below 100 seats (for attempts at analysis, see Palshikar,2014, 2015; Sridharan, 2014a, 2014b). The BJP’s rise from 19 per cent to 31per cent vote share as part of the NDA coalition’s 38 per cent, and to a majorityof 282 on its own, 336 with the NDA, was due to a regionally highly concen-trated sweep in the entire Hindi belt of northern and central India and thewestern states of Gujarat, Maharashtra and Goa, plus Karnataka in the southand Assam in the northeast. This was a more concentrated performance thanearlier such performances in 1996, 1998 and 1999 when it won more seatsthan the Congress despite a smaller vote share precisely because its voteswere geographically concentrated in the northern, central and western states.As we noted earlier, the emergence of a principal opposition party in everystate opens up the possibility of an anti-Congress sweep that benefits suchopposition parties.
In 2014, it was the BJP that benefited from a combination of factors thatkicked in after 2010 – economic slowdown and slow growth of jobs, persistenthigh inflation which neutralised the effects of populist welfare spending, andloss of legitimacy due to exposure of multiple corruption scandals to whichCongress had no answer, the party split in Andhra and exit of the Trinamul
354 A. Farooqui and E. Sridharan
Dow
nloa
ded
by [
Uni
vers
iteit
Lei
den
/ LU
MC
] at
10:
04 2
6 Ju
ly 2
016
in West Bengal from the UPA coalition, and the party’s organisational weak-ness and decay resulting in a weak mobilisation effort in the campaign (Srid-haran, 2014b). By contrast, the BJP had corruption, inflation andunemployment as weapons and a seemingly effective and inspiring leader inModi, plus extremely effective organisational machinery. There also seemedto be a change of mood and expectations on the part of the electorate, withthe Congress’ populist, pro-poor message not working with a seemingly aspira-tional electorate that wanted more than anti-poverty slogans and programmes –for the first time according to the Lokniti/CSDS post-election survey, more ofthe poor, the Scheduled Castes and Scheduled Tribes voted for the BJP than forthe Congress, representing a significant downward expansion of the former’sbase.
The survey finding that 49 per cent of the population in 2014 self-identifyas middle class (Kapur & Vaishnav, 2015), contrary to estimates by economic,occupational and educational criteria (Kapur, 2010), makes sense only if a largepart of the population is aspirational in that it identifies itself with higher sociallevels. Also, three CSDS/Lokniti post-election survey findings of 2014 thatmakes sense only if the electorate is aspirational, are the responses to threequestions on economic policy and conditions.
First, more voters of each of the four classes including the poor said theystrongly agreed or agreed that government should spend on infrastructurerather than on subsidies for the poor than strongly disagreed or disagreed,something that went counter to the redistributivist Congress line in the electioncampaign and was more in line with the ‘growth and jobs’ Modi pitch(responses to Question 23d of the CSDS National Election Survey 2014).
Second, in response to a question on the improvement or otherwise of theeconomic condition of India over the past five years (Question 8, CSDSNational Election Survey 2014) 40 per cent said it was much better or better,and only 17 per cent said it was worse, seemingly indicating an endorsementof the ruling party that ran against the actual voting results. However, if onefactors in 24 per cent who said it was the same and gives bad marks for a‘same’ response, that is, for an aspirational electorate ‘same’ is stagnationand hence poor performance, this would fit better with the electoral result.The striking result of this table is that for three of the four classes (Rich,Lower and Poor, except Middle), the responses Much Better and Better com-bined were much larger than the response Worse, but if one added the responseSame to Worse it was larger than Much Better plus Better. If one makes theassumption that the electorate was aspirational and considered Same to bepoor performance, the survey result fits the electoral outcome.
Third, in response to a question on the improvement or otherwise of theeconomic condition of ‘your household’ over the past five years (Question16, CSDS National Election Survey 2014) one gets exactly the same result
Commonwealth & Comparative Politics 355
Dow
nloa
ded
by [
Uni
vers
iteit
Lei
den
/ LU
MC
] at
10:
04 2
6 Ju
ly 2
016

as for Question 8 above, for the overall sample as well as for the Lower andPoor classes, again fitting the voting pattern by these classes (more votingfor BJP than Congress) only if one assumes that Same is poor performance.For the Rich and Middle Class, even adding Same to Worse left these responsessmaller in percentage than Much Better plus Better. Given that these classesvoted even more for BJP than for Congress, it would seem that these classes,other factors being equal, were even more aspirational and dissatisfied bytheir perceived improvement in household economic condition.
It would appear that Congress misread the mood of an increasingly impa-tient, aspirational middle class and young electorate in addition to other factorslike corruption scandals, growth slowdown and inflation.
In essence, since 1989, a centrist umbrella party like Congress could notcompete in upping the ante in religion- and caste-based political mobilisationswith parties that were explicitly Hindu nationalist (BJP), or caste-based likeOBC parties or the BSP or some regional parties. In class terms, while thepoor could also be mobilised by competing lower-caste parties, the middleclasses that burgeoned with economic growth, which were disproportionatelyupper or dominant caste in composition, were mobilised by appeal of Hindunationalism or upper caste resentment against reservations for the lowercastes, primarily by the BJP. An aspirational electorate also means thatpoorer and disadvantaged groups might vote ‘upwardly’ for the BJP’s ‘newsocial bloc’.
Taken together, these factors led to a steady erosion of the Congress basedespite a limited recovery in vote share in 2004 and 2009, and electoral vic-tories in those years that were heavily dependent on formation of pre-electoraland post-electoral coalitions which involved giving up turf, eroding itsumbrella character, making it a party more dependent on some segments ofits erstwhile broad bases, viz., minorities, Scheduled Castes and ScheduledTribes, and the poor.
Can Congress survive as an umbrella party? Or has the social cleavagestheory of party systems won out?
Finally, this brings us back to the question of whether an umbrella party likeCongress is viable in the long term once the pre- and post-independence histori-cal momentum that created its dominance peters out, particularly in the contextof the continuing operation of the above factors, particularly the growing andperhaps entrenched salience of regional identities, and varying state-levelcaste and religious cleavages. Is it possible to reconstruct an expanded umbrellaparty in the context of such cleavages? Or has the social cleavages theory ofparty systems won out? Or is the electorate evolving towards rewardinggood governance and economic performance with identity politics around
356 A. Farooqui and E. Sridharan
Dow
nloa
ded
by [
Uni
vers
iteit
Lei
den
/ LU
MC
] at
10:
04 2
6 Ju
ly 2
016

social cleavages assuming a back seat over time? Can Congress recover againas it did after 1967, and again after 1977, and rebuild a new social coalitionaround a new political economy, and win back the social segments it seemsto have lost – the upper and dominant castes and middle classes – while retain-ing its remaining base among minorities, Scheduled Castes and ScheduledTribes and the poor? Can it build a sufficiently broad social coalition in a suffi-cient number of states to make it an umbrella party nationally, given the erosionof its competitiveness and even presence in a large number of states and con-stituencies over the past quarter of century?
As Chhibber (2005) has argued, after 1967, particularly after the split of1969, there was a centralisation of economic powers by Indira Gandhi as wellas several political interventions in state governments, plus the centralisationof the Congress organisation, all of which helped to build support coalitionsbased on centralised dispensation of patronage to substitute for a vibrant, grass-roots-based organisation. This system helped maintain Congress as a coalition ofstate-based party units as well as recover support after the setback of 1967 andthe defeat of 1977. However, this sort of centralisation is no longer possibleafter the deregulation of the economy from the early 1990s, after the bulk ofinvestment in the economy is from private capital, both domestic and foreign,since that time, after the Bommai (1994) judgement made it far more difficultto dismiss state governments and impose President’s Rule, and after the riseand consolidation of multi-state opposition parties like the BJP and powerfulregional parties in a range of states since the 1990s. Most recently, the acceptanceof the Fourteenth Finance Commission’s recommendations for raising the states’share in the divisible pool of Central tax revenues from 32 per cent to 42 per centwill over time make states, and hence state-based parties including the state unitsof Congress (and BJP) more independent of the Central party leadership.Rebuilding a social base while being out of power and without tight control ofstate party units (which can defect as in West Bengal, Maharashtra andAndhra) promises to be that much more difficult.
One ray of hope for the Congress is that the CSDS/Lokniti post-electionsurvey of 2014 indicates fairly robustly that the secular consensus as regardsthe treatment of minorities seems to be intact. Large majorities of 58–68 percent strongly agreed or agreed with the proposition that minorities should betreated equally and also with special provisions for minorities, while onlyabout a sixth disagreed or strongly disagreed (Sridharan, 2014b). This seemsto indicate that the BJP victory was not a victory for ideological Hindutvabut for the promise of ‘better days’ against the backdrop of economic slow-down, inflation and corruption over 2011–14. The Congress’ weak recoveriesof 2004 and 2009 in which it did well among the upper castes, urban and ruralmiddle class and urban seats seems to indicate that a Congress recovery of lostsocial and geographical turf is possible under certain circumstances.
Commonwealth & Comparative Politics 357
Dow
nloa
ded
by [
Uni
vers
iteit
Lei
den
/ LU
MC
] at
10:
04 2
6 Ju
ly 2
016

A broad centrist social coalition built around economic reforms for growthcombined with targeted social expenditure within fiscal limits is a possibility,which is in fact what the Modi government appears to be attempting to builda broader BJP base. However, adopting such a strategy would need the Con-gress not to try to cast itself as only or mainly a pro-poor party (in an aspira-tional electorate in which 49 per cent self-identify as middle class, and thoseBelow Poverty Line are a minority of the population) catering only to itspost-2014 remaining base, but a broad-based growth-cum-social justice partythat does not upset the fine balance between growth-oriented policies and redis-tributive policies that seems to have been upset in the 2014 campaign (Srid-haran, 2014b) and beyond.
However, for such a make-over it will have to address the issues of internaldemocracy and organisational rebuilding along with a new political economythat balances growth and equity in a way that does not alienate the growingmiddle class, urban and younger sections of the electorate whose weight willincrease over time. The reorganisation and revival of the Congress party organ-isation is indeed quite a difficult task, especially after the party’s poor perform-ance in the Lok Sabha elections and the subsequent assembly elections, but it isnot necessarily impossible. Manor (2003) has argued that paradoxically itmight be easier to attempt an organisational rejuvenation especially at thestate level when the party is in opposition than when it is in power becausewhen in power the state leaders have to contend with and resolve issuesbetween different factions vying for their share in spoils of power. Thisfurther weakens the party organisation and simultaneously encouragesfactionalism.
To sum up, if the Congress cannot rebuild an encompassing coalition, as itarguably did in 2009, and recover as an umbrella party, there are two other pos-sibilities – its disintegration and eventual demise by further splits and loss ofsocial base, or its revival but as a broad, left-of-centre coalition of the disadvan-taged, not an umbrella party, facing a broad, BJP-led, right-of-centre coalition.However, in the latter scenario, it would not be an umbrella party but a centre-left party, and the social cleavages theory of party systems would have won out.
AcknowledgementsThe authors would like to acknowledge feedback on earlier drafts from Devesh Kapur,Matt Kavanagh, Jack Nagel, Wilfried Swenden, Milan Vaishnav and Ashutosh Varsh-ney, and two anonymous referees.
Disclosure statementNo potential conflict of interest was reported by the authors.
358 A. Farooqui and E. Sridharan
Dow
nloa
ded
by [
Uni
vers
iteit
Lei
den
/ LU
MC
] at
10:
04 2
6 Ju
ly 2
016

Notes1. See Lipset and Rokkan (1967) for the classic statement of the social cleavage theory
of party systems, and Bartolini and Mair (1990) for a modified version which arguesessentially that social cleavages do not translate automatically into party systemsbut offer easy mobilisation opportunities. Much the same is argued by Kothari(1997, p. 58): ‘Those who complain of “casteism in politics”’ are really lookingfor a sort of politics which has no basis in society . . . Politics is a competitiveenterprise . . . and its process is one of identifying and manipulating existingand emerging allegiances in order to mobilise and consolidate positions . . . ’,thus making the social cleavage theory of party systems appear somehownatural. For works within the electoral rules theory of party systems, see Lijphart(1994), Taagepera and Shugart (1989), Grofman and Lijphart (1986), and forolder classics, Duverger (1963) and Rae (1967).
2. Of the four cleavages discussed by them in the context of European party systems,two, the centre-periphery cleavage and the state-church cleavage were the productof ‘national revolutions’. It is this tension between the core nation-builders and politi-cal, ethnic or cultural peripheries, along with the secular and religious forces to someextent, that explains the emergence of the party system in post-independent India. Inthe initial years, major tension between the Centre and the periphery, and the issue ofsecularism, was resolved within the Congress party. In that sense, the Congress-domi-nated party system was the outcome of the ‘national revolution/movement’.
3. All votes and seats data in this paper from Election Commission of India(www.eci.nic.in).
ReferencesAleyomi, M. B. (2013). Intra-party conflicts in Nigeria: The case study of Peoples
Democratic Party (PDP). Journal of Sustainable Development in Africa, 15(4),281–296.
Bartolini, S., & Mair, P. (1990). Identity, competition and electoral availability: Thestabilisation of European Electorates, 1885–1985. Cambridge: CambridgeUniversity Press.
Chandra, K. (2000). The transformation of ethnic politics in India: The decline ofCongress and the rise of the Bahujan Samaj party in Hoshiarpur. Journal ofAsian Studies, 59(1), 26–61.
Chhibber, P. K. (1999). Democracy without associations. New Delhi: Vistaar.Chhibber, P. K. (2005). Party decline in a mature system: The Congress party of India.
Taiwan Journal of Democracy, 1(1), 49–76.Chhibber, P. K., Jensenius, F. R., & Suryanayaran, P. (2012). Party organization and
party proliferation in India. Party Politics, 18(1), 1–17.Chhibber, P. K., & Murali, G. (2006). Duvergerian dynamics in the Indian States:
Federalism and the number of parties in State assembly elections. Party Politics,12(1), 5–34.
Chhibber, P. K., & Kollman, K. (2004). The formation of National party systems:Federalism and party competition in Canada, great Britain, India and the UnitedStates. Princeton, NJ: Princeton University Press.
Chhibber, P. K., & Petrocik, J. R. (1990). Social cleavages, elections and the Indian partysystem. In R. Sisson & R. Roy (Eds.), Diversity and dominance in Indian Politics(Vol. 1). New Delhi: Sage.
Commonwealth & Comparative Politics 359
Dow
nloa
ded
by [
Uni
vers
iteit
Lei
den
/ LU
MC
] at
10:
04 2
6 Ju
ly 2
016

Crespo, J. A. (2004). The party system and Governance in Mexico. Policy Papers on theAmericas, 15(2), 1–41.
Duverger, M. (1963). Political parties: Their organisation and activity in the modernState. New York, NY: Wiley.
Duverger, M. (1986). Duverger’s law: Forty years later. In B. Grofman & A. Lijphart,Electoral laws and their political consequences (pp. 69–84). New York, NY:Agathon Press.
Grofman, B., & Lijphart, A. (1986). Electoral laws and their political consequences.New York, NY: Agathon Press.
Gunther, R., & Diamond, L. (2001). Types and functions of parties. In L. Diamond & R.Gunther (Eds.), Political parties and democracy (pp. 3–39). Baltimore, MD: JohnsHopkins University Press.
Hasan, Z. (2012). Congress after Indira: Policy, power, political change (1984–2009).New Delhi: Oxford University Press.
Heath, A., & Yadav, Y. (1999). The United colours of Congress: Social profile ofCongress Voters, 1996 and 1998. Economic and Political Weekly, 34(nos 34–35),2518–2528.
Kapur, D. (2010). The middle class in India: A social formation or a political actor?Political Power and Social Theory, 21, 215–240.
Kapur, D., & Vaishnav, M. (2015). Being middle class in India. The Hindu, January 10.Kirchheimer, O. (1966). The transformation of the Western European party systems. In
J. LaPalombara & M. Weiner (Eds.), Political parties and political development.Princeton, NJ: Princeton University Press.
Kothari, R. (1970). Politics in India. Boston: Little, Brown.Kothari, R. (1997). Caste and modern politics. In S. Kaviraj (Ed.), Politics in India (pp.
57–70). Delhi: Oxford University Press.Lijphart, A. (1994). Electoral systems and party systems. New York, NY: Oxford
University Press.Lijphart, A. (1996). The puzzle of Indian Democracy: A consociational interpretation.
American Political Science Review, 90(2), 258–68.Lipset, S. M., & Rokkan, S. (1967). Cleavage structures, party systems, and Voter align-
ments: An introduction. In S. M. Lipset & S. Rokkan (Eds.), Party systems andvoter alignments: Cross-National perspectives (pp. 1–64). London: The Free Press.
Manor, J. (2003). Organisational renewal. Retrieved November 28, 2015, from http://www.india-seminar.com/2003/526/526%20james%20manor.htm
Manor, J. (2007). The Congress Party and the ‘Great Transformation’. RetrievedNovember 28, 2015, from http://www.columbia.edu/~sr793/doc/JManor.pdf
Ordeshook, P., & Shvetsova, O. (1994). Ethnic heterogeneity, district magnitude and thenumber of parties. American Journal of Political Science, 38(1), 100–123.
Palshikar, S. (2014). The defeat of the Congress. Economic and Political Weekly, 49(39),57–63.
Palshikar, S. (2015). Congress in the times of the post-Congress era: Surviving sans poli-tics. Economic and Political Weekly, 50(19), 39–46.
Rae, D. (1967). The political consequences of electoral laws. New Haven: YaleUniversity Press.
Sartori, G. (2005). Parties and party systems: A framework for analysis. Colchester:ECPR Press.
SpieB, C. (2002). One-party-dominance in changing societies: The ANC and INC incomparative perspective (Working Paper No. 10). Retrieved November 9, 2015,from http://archiv.ub.uni-heidelberg.de/volltextserver/4120/1/hpsacp10.pdf
360 A. Farooqui and E. Sridharan
Dow
nloa
ded
by [
Uni
vers
iteit
Lei
den
/ LU
MC
] at
10:
04 2
6 Ju
ly 2
016
Sridharan, E. (2002). The fragmentation of the Indian party system 1952–1999: Sevencompeting explanations. In Z. Hasan (Ed.), Parties and party politics in India (pp.476–503). New Delhi: Oxford University Press.
Sridharan, E. (2004). Electoral coalitions in the 2004 general elections: Theory and evi-dence. Economic and Political Weekly, 39(51), 5418–5425.
Sridharan, E. (2012b). Coalitions and democratic deepening in India. In E. Sridharan(Ed.), Coalition politics and democratic consolidation in Asia (pp. 20–73). NewDelhi: Oxford University Press.
Sridharan, E. (2014a). Class voting in the 2014 Lok Sabha elections: The growing sizeand importance of the middle classes. Economic and Political Weekly, 49(39),72–76.
Sridharan, E. (2014b). India’s watershed vote: Behind Modi’s victory. Journal ofDemocracy, 25(4): 20–33.
Taagepera, R., & Shugart, M. S. (1989). Seats and votes. New Haven: Yale UniversityPress.
Varshney, A. (2014). Hindu Nationalism in power? Journal of Democracy, 25(4),34–45.
Varshney, A. (2002). Ethnic conflict and civic life: Hindus and Muslims in India. NewHaven: Yale University Press.
Wilkinson, S. I. (2005). Elections in India: behind the Congress comeback. Journal ofDemocracy, 16(1), 153–167.
Wyatt, A. (2002). The federal dimension of party politics in Tamil Nadu. Indian Journalof Federal Studies, 3(2), 127–143.
Yadav, Y. (1999). Electoral politics in the time of change: India’s third electoral system,1989–99. Economic and Political Weekly, 35(nos. 34–35), 2393–2399.
Yadav, Y. (2003). The new congress voter. Seminar. Retrieved May 4, 2016, from http://www.india-seminar.com/2003/526/526%20yogendra%20yadav.htm
Yadav, Y. (2004). The Elusive Mandate of 2004. Economic and Political Weekly, 39(51),5383–5398.
Yadav, Y., Kumar, S., & Heath, O. (1999). The BJP’s new social bloc. Frontline, 16(23),Retrieved May 4, 2016 from http://www.frontline.in/static/html/fl1623/16230310.htm
Yadav, Y., & Palshikar, S. (2009). Between Fortuna and Virtu: Explaining the Congress’ambiguous victory in 2009. Economic and Political Weekly, 44(39), 33–46.
Ziegfeld, A. (2012). Coalition Government and party system change: Explaining the riseof regional parties in India. Comparative Politics, 45(1), 69–87.
Commonwealth & Comparative Politics 361
Dow
nloa
ded
by [
Uni
vers
iteit
Lei
den
/ LU
MC
] at
10:
04 2
6 Ju
ly 2
016