can myopic loss aversion explain the equity premium puzzle ... › papers › w22605.pdf · as a...
TRANSCRIPT

NBER WORKING PAPER SERIES
CAN MYOPIC LOSS AVERSION EXPLAIN THE EQUITY PREMIUM PUZZLE?EVIDENCE FROM A NATURAL FIELD EXPERIMENT WITH PROFESSIONAL TRADERS
Francis LarsonJohn A. List
Robert D. Metcalfe
Working Paper 22605http://www.nber.org/papers/w22605
NATIONAL BUREAU OF ECONOMIC RESEARCH1050 Massachusetts Avenue
Cambridge, MA 02138September 2016
We thank Clark Halliday and Joseph Seidel for excellent research assistance and Uri Gneezy, Judd Kessler, and Richard Thaler for comments. The views expressed herein are those of the authors and do not necessarily reflect the views of the National Bureau of Economic Research. For correspondence: [email protected]
NBER working papers are circulated for discussion and comment purposes. They have not been peer-reviewed or been subject to the review by the NBER Board of Directors that accompanies official NBER publications.
© 2016 by Francis Larson, John A. List, and Robert D. Metcalfe. All rights reserved. Short sections of text, not to exceed two paragraphs, may be quoted without explicit permission provided that full credit, including © notice, is given to the source.

Can Myopic Loss Aversion Explain the Equity Premium Puzzle? Evidence from a NaturalField Experiment with Professional TradersFrancis Larson, John A. List, and Robert D. MetcalfeNBER Working Paper No. 22605September 2016JEL No. C9,C93,G02,G11
ABSTRACT
Behavioral economists have recently put forth a theoretical explanation for the equity premium puzzle based on combining myopia and loss aversion. Complementing the behavioral theory is evidence from laboratory experiments, which provide strong empirical support consistent with myopic loss aversion (MLA). Yet, whether, and to what extent, such preferences underlie behaviors of traders in their natural domain remains unknown. Indeed, a necessary condition for the MLA theory to explain the equity premium puzzle is for marginal traders in markets to exhibit such preferences. Using minute-by-minute trading observations from over 864,000 price realizations in a natural field experiment, we find data patterns consonant with MLA: in their normal course of business, professional traders who receive infrequent price information invest 33% more in risky assets, yielding profits that are 53% higher, compared to traders who receive frequent price information. Beyond testing theory, these results have important implications for efficient resource allocation as well as characterizing the optimal structure of social and economic policies.
Francis LarsonNormann 145-157 St John StreetLondon, EC1V 4PWUnited [email protected]
John A. ListDepartment of EconomicsUniversity of Chicago1126 East 59thChicago, IL 60637and [email protected]
Robert D. MetcalfeUniversity of ChicagoSaieh Hall for Economics5757 S. University AvenueChicago IL, [email protected]

1
1. Introduction Explaining means and variances of asset returns has occupied scientists and
practitioners for decades. One particularly active area of recent research revolves around the equity premium puzzle: the average annual real return on U.S. equities over the past century has been roughly 8 percent whereas the real return on relatively riskless securities has been approximately 1 percent (see, e.g., Mehra and Prescott, 1985). Indeed, Siegel’s (1998) work extends the U.S. asset return data to the early 19th century and reveals a similar, but somewhat smaller, premium over the past 200 years. Similar differences have been documented for asset returns in France, Germany, and Japan. All told, across roughly 85 percent of capitalized global equity value, data patterns reveal an equity premium puzzle.
Mehra and Prescott (1985) argued that such behavioral patterns represented a puzzle when their general equilibrium framework with additively separable utility functions required an implausibly large coefficient of relative risk aversion to explain the underlying data. Ever since, there has been considerable effort across economics and finance to explain the puzzle. In fact, it is difficult to find a puzzle that has attracted as much widespread attention across the fields of microeconomics, macroeconomics, and finance. To date, however, standard intertemporal economic models have not fully rationalized the observed data patterns.1
More recently, Benartzi and Thaler (1995) have augmented the standard model by leveraging two general features of human cognition—myopia and loss aversion—to provide an intriguing explanation for the equity premium puzzle. Myopic loss aversion (MLA) is a situation characterized by investors – who are loss averse (see Kahneman and Tversky, 1979) – taking a short-term view on an investment. Under MLA, investors pay too much attention to the short-term volatility of their asset portfolios, reacting negatively to short-term downside changes. In this way, frequent feedback on asset returns is detrimental, in that investors are overly averse to assets with such volatility.2
Complementing the theory is a number of laboratory experiments (with both students and professional traders) that have found evidence consistent with the MLA conjecture (Thaler et al., 1997; Gneezy and Potters, 1997; Gneezy et al., 2003; Haigh and List, 2005). The structure of the experiments revolves around varying the frequency of the feedback to subjects and examining if the information provision affects investment patterns. The underlying hypothesis tests if subjects with infrequent information invest more in a risky asset than subjects who receive more frequent feedback. The literature generally reports that those individuals receiving infrequent feedback invest between
1 Kocherlakota (1996) and Mehra and Prescott (2003) discuss the various frameworks and explanations, and conclude that there is no single model that can explain the underlying data patterns. Azeredo (2014) presents evidence that suggests for a subclass of general equilibrium models in Mehra and Prescott (1985), the equity premium puzzle is even larger than the literature presumes. 2 Barberis et al. (2001) estimate that models based on myopic loss aversion can generate sizeable equity premia. Moreover, Benartzi and Thaler (1999) demonstrate that workers are more likely to invest their retirement savings in stocks when they are given a longer-term horizon of returns data (rather than one year).

2
30%-80% more in the risky asset than those receiving more frequent information, a pattern consistent with MLA.
While the investment patterns observed in laboratory experiments are consistent with MLA, there exists no evidence on whether professional traders in their natural environments behave in line with the MLA theory.3 Since marginal traders are the price setters in markets, this gap in the literature represents an important shortcoming in our understanding of whether the MLA theory can explain the observed asset return patterns. In fact, a necessary condition for MLA to explain the equity premium puzzle is for marginal traders to exhibit such behavioural tendencies in their chosen trading markets.
While in theory this next step is perspicuous, in practice it is nearly impossible to observe traders in their natural environments while maintaining the integrity of a causal field experiment. This fact explains why the literature has focused exclusively on data drawn from laboratory experiments to test the MLA theory. We were presented with an opportunity to depart from the traditional research approach when Normann, a technology firm that beta tests trading platforms, partnered with us to explore features of their new trading program. Within their beta test, we conduct a natural field experiment with professional FX traders around the world, who are not aware that they are part of a scientific experiment when they make their investment choices. Within this natural setting, we follow the spirit of the literature by randomizing information feedback to permit a clean test of whether MLA is evident in trader behavior.
In this manner, we use randomization as our form of identification and couple that instrument with the realism afforded by the field. To maintain a close parallel to the natural environment, we use stakes that are in the relevant range of trader earnings—our subjects could earn more than $1,400 over our two-week beta test. This amount of money is roughly equivalent to 35% of their weekly salary (average annual salary of $103,000). In addition, this setting and trading environment is completely natural for the traders. For example, traders were allowed to trade our real mutual fund-like instrument that tracked the relative value of the US Dollar.
In total, between March and April 2016, hundreds of traders signed up for our beta test. Using over 864,000 minute-by-minute price realizations, we find trading patterns consonant with MLA: traders who receive infrequent price information invest 33% more of their portfolio in risky assets, yielding profits that are 53% higher,
3 There is an active area of research exploring whether behaviors in the lab extend to the field. Levitt and List (2007) discuss six factors that might frustrate such generalizability. For our purposes, reasons why there might be differences between the lab and the field include behavioral, sample selection and sorting, and trader experience (see List, 2003; 2004). In terms of the latter, experience might be important to MLA, in that over time traders might get better at learning how to overcome MLA or they learn their true type and that only ‘good’ traders are left in the job over time (Seru et al., 2010). Thinking like a trader in the lab seems to make people ‘feel’ losses less (Sokol-Hessner et al., 2009), although the artefactual field experiments in this area suggest that traders succumb to MLA in similar ways as students (Haigh and List, 2005; Abdellaoui et al., 2013). Related to this line of inquiry, subjects acting in teams might behave differently (Sutter, 2007), and the general public might invest differently in mutual funds based on information (Beshears et al., 2015; Shaton, 2015). A non-experimental study that explores trade restrictions and investment patterns is due to Klinger and Levit (2009).

3
compared to those traders who receive frequent price information. This evidence is consistent with the hypothesis that professional traders in our natural field experiment exhibit MLA, and this behavioural tendency leads to significantly lower profits. In this way, a puzzle arises: traders in the field constantly seek more frequent return information, yet more might actually mean less in terms of profits. Furthermore, even amongst those with many years of trading experience, the MLA effect is alive and well, consonant with the laboratory results of Haigh and List (2005).
As a whole, our empirical insights provide evidence that MLA is a viable explanation for at least part of the equity premium puzzle observed in the literature. Given that the equity premium puzzle has far-reaching implications—from the costs of macroeconomic variability due to recessions, to estimates of the cost of capital, to the current debate on social security and pensions, to investing in public services—understanding its sources represents a key challenge for advancing efficient public policies. Beyond the equity premium puzzle, our data can also lend insights into other puzzles, such as data patterns describing asset volatility, dividend payouts, and discounting.
Two further insights can be gleaned from this note. First, methodologically, much, if not all, of behavioral finance is devoid of any causal evidence from natural field experiments. Given that natural field experiments estimate important policy and theoretical parameters (see, Al-Ubaydli and List, 2012), we hope that our study catalyzes future field work testing behavioural theories in finance. Second, in a practical sense, if one considers the wealth-building potential of the equity premium in the long-run, it is clear why it is of central importance in portfolio allocation. The behaviour of our professional traders combined with the empirical insights from students in the received literature, suggest important changes in investor information can yield significant gains in investment portfolios. One such example is outlined in Gneezy et al. (2003, p. 821), who discuss Israel’s largest mutual fund manager, Bank Hapoalim, changing its information release about fund performance from every month to every 3 months, noting that “investors should not be scared by the occasional drop in prices.”
The next section of our note discusses the experimental design. Section 3 describes the empirical analysis and results. Section 4 concludes. 2. Experimental Design
As a quick summary, our natural field experiment started when we invited FX traders to take part in a beta test of a new trading platform. Once they signed up for the platform, we randomized them into a frequent information group (second-by-second price information) or an infrequent information group (price information every four hours). Both groups could trade over any of the ten weekdays of our two-week experiment. This experimental setting allowed us to directly test MLA in a natural field experimental setting with a high degree of control to measure causal estimates. We

4
consider this a natural field experiment (see Harrison and List, 2004) because traders do not know that they are part of a scientific experiment, and have traded assets in their everyday jobs that have both instantaneous and infrequent price quote profiles. 2.1 Design of the natural field experiment
We built the trading platform and framed (truthfully) the trading platform to potential traders as a beta test of a new trading platform. Beta testing trading platforms in exchange for early access and credit is a common practice in the industry. We contacted professional traders through email and LinkedIn (i.e. an online professional network). The email list was composed of traders who have applied for, or worked as professional traders in the past. We acquired this list from a proprietary trading firm in London. The LinkedIn messages were sent to those with professional trading experience on their online LinkedIn profiles. We sent nearly 8,000 messages, and each message included a brief invitation to the beta test of the platform followed by a document of the instructions (see Appendix A). Beyond the emails to begin and end the test period, no further communication was completed with the vast majority of traders.
We informed traders that for their two weeks of participation they would earn a portion of their profits as credit on a related options platform. As is common in such tests, although subjects could not immediately withdraw the credit, profits from options contracts purchased with the credit could be withdrawn immediately. In the end, over the ten trading days, the average trader earned GBP £1010 (USD $1454), which amounted to roughly 35% of their weekly salary.
To sign up as platform users, the traders needed to log in with their LinkedIn profile (allowing us to verify their company and current role), accept that they understood the instructions and payment procedure, and fill out a survey about their trading experience, income and asset levels, age, gender, and education level. Traders were largely working in hedge funds, investment banks, and proprietary trading firms, although some were working independently. Most of the traders were based in London, but the experiment was global, as traders came from the Unites States, Europe, Australia, India, Singapore, and Hong Kong, among other countries.
After the registration process was complete, we displayed a message to subjects that we would contact them within 30 days to begin trading. In total, 342 individuals completed the registration between March and April 2016. We randomized and started traders in weekly batches of approximately 85 over that time period. All traders in a group had the same start and end dates. For the randomization, we created a matched pairs design, where we blocked on several variables (i.e., age of trader, trading experience, professional experience, financial service sector, industry experience, income, and education). See Tables A1 and A2 for the balance tables of the overall randomization and of the eventual matched pairs, respectively.

5
To inform subjects to begin the beta test of the platform, we emailed informing them that they had 14 days from the date of the email to trade on the platform. We found that 35% of traders never logged in—this is typical for such exercises.4 Moreover, as we desired to focus on professional traders, we only included professional traders in the analysis, and we also only included traders who logged into the platform at least once, and who made at least one trade. Since traders could not sell the asset without first owning it, and there was no payment without profits, a subject who failed to make a trade clearly did not understand the instructions. Consistent with other natural field experiments, we did not reveal any University affiliations and subjects did not know the request for the beta test was for an academic study. When each group finished we sent out an email informing subjects of their performance and their award. The platform also displayed this final information.
2.2 Design of the risky asset
The experimental platform was a simplified version of what a trader would find at an online broker (see Appendix B). Traders could trade a mutual fund-like instrument (“Fund A”) that tracked the relative value of the US Dollar. Traders had a starting cash balance of GBP £1,000,000 and for every pound they earned on the platform trading Fund A, they would receive GBP £1/500 on the related options platform. Subjects could make trades by buying units at the ask price of the fund or selling units at the bid price. They could not post limit orders and could not have a net negative position. The bid/ask spread of the fund was large (fixed at GBP £2), averaging just above 2% of the price – since we had no other transaction costs, the spread was immaterial for our purposes. Each trader could view their transaction history, a list of the most recent five prices, and average prices paid for their units. Traders could trade over a two-week period during normal over-the-counter foreign exchange market hours, which run 24 hours a day except weekends (so, in total, traders had ten trading days).
We designed Fund A to have a positive expected return regardless of the underlying market movement. The initial mid-price was set at 100 and the underlying asset was the USD/EUR. The initial underlying price was the USD/EUR price at the subject’s respective start time. For every price tick up of the underlying asset, Fund A would go up slightly more than it would for price ticks down. Specifically, for every negative change in mid-price of the USD/EUR, Fund A would go down by the change amount x 300. For every positive change in mid-price, Fund A would go up by the change amount x 1.025 x 300. USD/EUR price ticks arrive 1-3 times a second. Testing this formula with historical pricing data of the prior year indicated that for any two-week period the fund would return 17% on average with a 9% standard deviation and 96% of
4 We can think of several reasons for the high attrition. First, we only sent one email to subjects informing them to start trading. Several subjects reported never seeing the email. Of those who did see it, the email was sent on the same day that their 14-day trading period began, making it difficult if not impossible for them to plan for time to trade on the platform. Several subjects asked to postpone due to scheduling conflicts but we did not accommodate them.

6
the two-week periods were positive. While our formula was arbitrary, we found it necessary to base our fund price off a live price of a real asset to maintain naturalness.
We described Fund A to traders as a “Leveraged USD Index fund” which was a “contract designed to replicate the performance of being long on the US Dollar against other major currencies.” Since the USD/EUR correlates very strongly with other major currencies versus the USD, our claim was vague enough to be accurate and not deceptive. We did not inform participants of the exact formula or the exact underlying instrument. Given the description of the underlying mechanisms and the beta test nature of the trading period, we were satisfied that subjects were not deceived by experiencing an instrument that would only increase in value. In the end, Fund A returned an average of 236% for each period due to one week having extra high return. We were not concerned with the high returns of the single period but it warrants caution with our results.5
To test directly the MLA hypothesis, we randomized subjects into two groups. The “Frequent” group could view price changes every second whereas our “Infrequent” group could view price changes only every four hours. Our platform included a line chart of all prices up until the most recent price available. Traders in the Frequent group saw a chart of prices up to the latest second, while traders in the Infrequent group only saw prices up to the most recent four-hour block. The trader’s portfolio value and position value would also change in relation to the viewed prices. The Frequent trader group therefore saw see their portfolios fluctuating every second, whereas the Infrequent trader group would see only changes every four hours, which aggregated the price movements from the previous four hours. By design, this meant that while the two groups observed the same price realizations, traders in the Frequent group saw more negative draws than traders in the Infrequent group. This represents the crux of the experimental test of MLA. To ensure participants were aware of the feedback frequency, we inserted a small message that noted the frequency of updates for both groups.
Before moving to the results, we should note that some authors have criticized previous MLA experiments for varying both subjects’ ability to make decisions and their information feedback simultaneously (Bellemare et al., 2005). Our approach allows us to identify feedback alone as the driver of MLA. Further, unlike in some previous experiments, and in line with how trading actually occurs in the field, our traders do not need to make an active decision to hold units of the risky asset. If they own units, they can continue to hold units by doing nothing, similar to normal stock investment. 3. Natural Field Experimental Results
We follow the previous literature as closely as possible in our data analysis. First, the lab experiments of Gneezy and Potters (1997) and Haigh and List (2005) have nine
5 Most of the traders were derivatives traders of various types, so they are used to large swings in profit and loss when trading large notional amounts. Traders could not use leverage on our platform. While traders could always view prices outside of our platform, our pricing formula made our fund’s price movement markedly different enough from any related instrument that we were extremely confident price signals came primarily from our platform.

7
rounds (blocks of three for the Infrequent group) and they measure the average amount placed in the risky asset in three-round blocks in the nine rounds plus an average of all rounds. Thaler et al. (1997) have 200 rounds (blocks of 40, 25, 5 for the Infrequent groups), but they only examine the average amount bet for the last 40 periods (the last five years or the last 20% of rounds), and one “final decision” (we do not have such a final decision and therefore do not include here). The Frequent group’s average is the average of the last 40 bets, the yearly is last five bets, and the 5-yearly is the last bet. The simple reason that Thaler et al. (1997) wait until the end of the experiment to measure performance is that the subjects do not know the expected return of the assets at the start of the experiment.6
Our experiment is slightly different from Gneezy and Potters (1997), Haigh and List (2005), and Thaler et al. (1997) because our traders can place investments in the risky asset at any time. It does not necessarily make sense to constrain the traders of the Infrequent group to only bet once in a four hour-period. We do, however, use the same size of the time period to compare the groups. We choose the minute for reporting, but there is no reason we could not choose another interval (our results are virtually the same when we do). Thaler et al. (1997) note that their groups start with the same allocation and it trends to what they eventually report, which is a large treatment difference. In fact, it is difficult for their treatment subjects, or ours, to have meaningfully different allocations from the control group early in the experiment since subjects do not know the expected return—they must learn it over time.7
Whether we follow Thaler et al. (1997) or a different approach, we can measure traders’ risk allocation by how many units of Fund A they hold over time – this can be inferred from the trades made – or their overall portfolio invested in the risky asset.8 If we follow Thaler et al. (1997), each trader’s risk is the percentage of her assets held in 6 Beshears et al. (2015) argue that subjects in Gneezy and Potters (1997), Gneezy et al. (2003), Bellemare et al. (2005), and Haigh and List (2005) did not need to first experience disaggregated ongoing return disclosure before reducing their portfolio risk. Instead, they reduced their demand for risky assets starting in the very first period of the experiments, indicating that they prospectively anticipated the disutility from disaggregated ongoing return disclosure. Thaler et al. (1997) do not tell the subjects the return distributions of the experimental assets; subjects need to play numerous rounds in order to estimate these distributions themselves. The Thaler et al. (1997) experiment is by far most like our experiment. Moreover, Thaler et al.’s (1997) subjects performed an investment activity similar to ours. Given the similarities, we follow the reporting precedent set in Thaler et al. (1997). 7 It may be worth noting that the Infrequent group saw roughly 14 prices on average, whereas the Frequent group saw roughly 1555 prices on average. They could have seen a maximum of 864,000 prices. 8 There are two primary ways for us to measure risk-taking: mean units of the risky asset held and mean percentage of the portfolio allocated to the risky asset. Measuring units held is straightforward and does not change if a trader does nothing. Percentage allocation changes as the asset price changes. When trader A owns 3000 units of Fund A at price £105 and £600,000 in cash, the percentage of her portfolio devoted to risky assets (34.4%) is different than when she owns the same number of units at price £115 (36.5%). Such is how the real world works—asset prices change and the way investors rebalance determines the amount of risk they are in fact taking. Given the naturalness of reporting risk this way, we follow Thaler et al. (1997) and report percent allocation. Specifically, we determine percent allocation to the risky asset at time t by dividing the value of the risky asset held at t (units at t x the prevailing bid price at t) by the total value of the portfolio at t (value of the risky asset + cash held). Reporting units held (as opposed to percent allocation) does have value nonetheless. Since the Infrequent group in fact risked more units, we can be more confident that they did not simply lose interest and forget to rebalance. We also have data on overall profit for the trader. That is measured by subtracting the initial cash amount (£1 million) from the final portfolio value (final units held x the final bid price + cash).

8
Fund A for the last 20% of the experimental time period. Such data are non-normally distributed, as confirmed by a Kolmogorov-Smirnov test. This is similar to Gneezy and Potters (1997) and Haigh and List (2005), so we include results from Mann-Whitney non-parametric tests, which have less power than parametric alternatives. Experimental Results
Our key comparative static result is an examination of the difference in the allocations in the risky asset across the traders randomly placed in the frequent and infrequent groups. Since MLA theory predicts that the average amount placed in the risky asset in the Frequent Treatment should be less than the average amount placed in the Infrequent Treatment, we begin by presenting the temporal nature of the investment patterns. In Figure 1, we average the amount allocated at the individual level in each day for the Frequent Treatment (n=73 traders, daily) and compare these data to observations in the Infrequent Treatment (n=78 traders, daily).
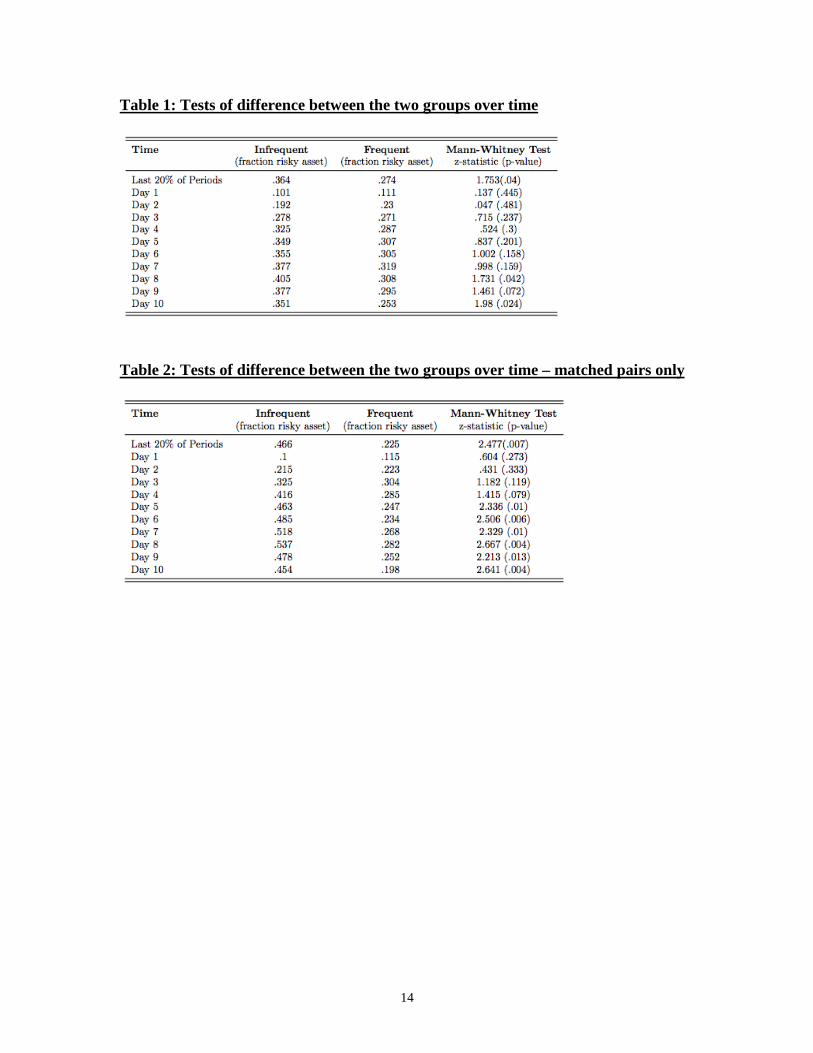
Interestingly, as the data in Figure 1 reveal, the MLA effect takes time to arise since it requires traders to learn the expected value of the risky asset. This result is consistent with some previous studies (especially Thaler et al., 1997). Table 1 complements Figure 1 by providing tests of differences across each of the ten days of the experiment for the two groups, and statistically demonstrates that the differences come about toward the last three days of the experimental period. Indeed, at the end of the experimental time period, traders who receive infrequent information invest significantly more in the risky asset than traders in the frequent information treatment—at a rate roughly 40% higher. This difference is significant at the p < .05 level using a Mann–Whitney test.
As a robustness check, we examine data from matched pairs of traders (at randomization we matched pairs to provide a second empirical test). In Table 2, we find treatment effects that are slightly larger than those reported in Table 1. That is, if we constrain ourselves to the matched pairs sample, for the last 20% of the experiment, we find that the Mann-Whitney test rejects homogeneity at the p < .02 level, with the risky asset investment being 105% higher in the infrequent group. From this matched pairs group, we see significant differences in allocation into the risky asset by day 5.
Another way to summarize the unconditional data is to aggregate investment patterns over the last 20% of the experiment, as in Thaler et al. (1997). We provide this summary in Figure 2, which shows the average investment behavior by group. Again, we find evidence consistent with MLA: while traders invest on average 36.4% of their portfolio in the risky asset in the Infrequent information treatment (n=73), they invest only 27.4% of their portfolio into the risky asset in the Frequent information treatment (n=78). Using a nonparametric Mann–Whitney statistical test, we find that the allocations in the last 20% of the experiment are significantly different at conventional levels.

9
To explore whether these trading patterns lead to differential rates of profits, we also measure profits accrued across the two groups. At the end of the experiment, the average trader in the Infrequent group accrued 615,715 units of profit, and the average trader in the Frequent group accrued 401,634 units of profit—a difference of more than 50%. Using a non-parametric Mann–Whitney statistical test, we find that these profits are significantly different at the p < 0.05 level. Interestingly, the treatment effect is observed across the entire distribution of profits. For example, the 90th percentile earner in the infrequent information group earns over 472,000 units, whereas the 90th percentile earner in the frequent group earns less than 262,000 units. Comparable figures for the lower end of the distribution are similar. For example, whereas the 25th percentile earner in the frequent information group loses money, the similarly situated trader from the infrequent information group turns a profit. If we restrict attention to matched pairs, we find that the average trader in the Infrequent group accrues 883,160 units of profit and the average trader in the Frequent groups accrues 488,663 units of profit, an 81% difference that is significant at conventional levels. In sum, even though traders prefer more frequent feedback, they are certainly worse off when they receive such information.
Although the raw data provides evidence to support the MLA theory, we also examine the interaction with professional trading experience in Tobit regression models. Given our unique data on the trading experience of each of our traders, we can determine how professional experience, as measured by years of market experience, affects the MLA result. In Table 3, we regress the individual investment allocation in the last 10% and 20% of the experimental interval treatment and interact treatment with trading experience to explore if experience affects MLA.
Specifications 1-4 in Table 3 are simple regression models of the percent of the overall portfolio invested in the risky asset on treatment. These models deliver similar results to what we observed in the raw data: empirical evidence is consistent with MLA, whether we consider the entire sample (columns 1 and 2) or the matched pairs sample (columns 3 and 4). Specifications 5-8 augment those simple models with a variable measuring years of market experience and a term that interacted years of market experience and treatment. Each of these specifications suggests two insights: i) those traders with more years of market experience tend to invest less in the risky asset, though the results are too noisy to reject the null hypothesis, and ii) years of professional experience have little influence on the treatment effect. For example, empirical results from specification 5 suggest that those traders with a greater number of years of experience actually show slightly more evidence of MLA in treatment, consistent with the results from Haigh and List’s (2005) lab experiment with Chicago Board Traders, but this result is not significant at conventional levels.
We also perform a similar empirical exercise using profits as the regressand. Again, the results are similar to the raw data presented above on how treatment affects profits. Furthermore, in terms of overall profits, years of market experience is not

10
statistically significant at conventional levels. We do find, however, that experienced traders’ profits are not as penalized by the frequent feedback as those inexperienced traders, but this result is not significant at conventional levels.9 4. Conclusion
Whether, and to what extent, behavioural anomalies manifest themselves in markets outside the lab remains of great import for social scientists. Recently, myopic loss aversion has been advanced as a theoretical explanation for the equity premium puzzle (Benartzi and Thaler, 1995). Coupled with the theory, several key laboratory experiments find that both student and trader subjects in the lab behave according to the theory (see, e.g., Thaler et al., 1997; Gneezy and Potters, 1997; Gneezy et al., 2003, Haigh and List, 2005). In this study, we take the next step in the scientific discovery process by using a natural field experiment to explore if behaviour of professional traders in their natural environment conforms to theoretical predictions.
Making use of professional FX traders who are test bedding a new trading platform, we find that professional traders exhibit MLA in their natural domains. Importantly, we can rule out that the lack of investment flexibility is a reason for the MLA. In our experiment, traders freely trade at any point during the 10-day trading window. At a fundamental level, since our traders are vital components of the price discovery process, their investment patterns reveal that marginal traders behave in a manner that is consistent with MLA. As a result, a necessary condition is satisfied—MLA is evident amongst professional traders in asset markets.
A few normative and positive implications naturally follow. First, our findings suggest that expected utility theory may not be descriptive of professional traders' strategies, and highlight that behavioral finance models are a useful alternative to describing market equilibria. In this way, such models can help to explain other prevalent puzzles in the literature, including excess volatility of asset prices, dividend payout puzzles, and the apparent irrational discounting observed amongst investors. In a positive sense, these findings have direct implications on the communication strategies for the financial market, whereby revealing information on a less frequent basis likely means that investors will be better able to meet their savings goals for retirement. In this way, MLA presents a conundrum: individuals, investors, and traders all want timely information and flexibility in making decisions, but in doing so harm themselves and impact the workings of the financial sector.
9 These results are available upon request.

11
References Abdellaoui, Mohammad, Han Bleichrodt, Hilda Kammoun (2013). Do financial professionals behave according to prospect theory? An experimental study. Theory and Decision, 74, 3, 411-429. Al-Ubaydli, Omar, John A. List (2012). On the generalizability of experimental results in economics. In Frechette, G. and A. Schotter (eds) The Methods of Modern Experiments, Oxford University Press. Azeredo, Francisco (2014). The equity premium: a deeper puzzle. Annals of Finance, 10, 3, 347-373. Barberis, Nicholas, Ming Huang, Tano Santos (2001). Prospect Theory and Asset Prices. Quarterly Journal of Economics, 116, 1, 1–53. Bellemare, C., Krause, M., Kröger, S., & Zhang, C. (2005). Myopic loss aversion: Information feedback vs. investment flexibility. Economics Letters, 87, 3, 319-324. Benartzi, Shlomo, Richard Thaler (1995). Myopic loss aversion and the equity premium puzzle. Quarterly Journal of Economics, 110, 73–92. Benartzi, Shlomo, Richard Thaler (1999). Risk Aversion or Myopia? Choices in Repeatef Gambles and Retirement Investments. Management Science, 45, 364-381. Beshears, John, James J. Choi, David Laibson, Brigitte C. Madrian (2015). Does Aggregated Returns Disclosure Increase Portfolio Risk-Taking? Yale University Working Paper. Gneezy, Uri, Arie Kapteyn, Jan Potters (2003). Evaluation periods and asset prices in a market experiment. Journal of Finance, 58, 821–838. Gneezy, Uri, Jan Potters (1997). An experiment on risk taking and evaluation periods. Quarterly Journal of Economics, 112, 631–645. Haigh, Michael S., John A. List (2005). Do Professional Traders Exhibit Myopic Loss Aversion? An Experimental Analysis. Journal of Finance, 60, 1, 523-534. Harrison, Glenn W., John A. List. (2004). Field Experiments. Journal of Economic Literature, 42, 4, 1009 –55. Kahneman, Daniel, Amos Tversky (1979). Prospect Theory: An Analysis of Decision under Risk. Econometrica, XLVII, 263–91.

12
Klinger, Doron, Boris Levit (2009). Evaluation periods and asset prices: Myopic loss aversion at the financial marketplace. Journal of Economic Behavior & Organization, 71, 361-371. Kocherlakota, Narayana R. (1996). The Equity Premium: It’s Still a Puzzle. Journal of Economic Literature, 34, 1, 42–71. Levitt, Steven D., John A. List (2007). What Do Laboratory Experiments Measuring Social Preferences Reveal About the Real World? Journal of Economic Perspectives, 21, 2, 153-174. List, John A. (2003). Does market experience eliminate market anomalies? Quarterly Journal of Economics, 118, 41–71. List, John A. (2004). Neoclassical theory versus prospect theory: Evidence from the marketplace. Econometrica. 72, 615–625. Mehra, Rajnish, Edward Prescott (1985). The equity premium: A puzzle. Journal of Monetary Economics, 15, 145–161. Mehra, Rajnish, Edward Prescott (2003). The Equity Premium Puzzle in Retrospect. In Handbook of the Economics of Finance, ed. by G.M Constantinides, M. Harris and R. Stulz, North Holland, Amsterdam, 2003. Seru, Amit, Tyler Shumway, Noah Stoffman (2010). Learning by Trading. Review of Financial Studies, 23, 2, 705-739. Shaton, Maya O. (2015). The Display of Information and Household Investment Behavior. Working Paper. Siegel, Jeremy (1998). Stocks for the Long Run. 2nd ed. New York: Irwin. Sokol-Hessner, Peter, Ming Hsu, Nina G. Curley, Mauricio R. Delgado, Colin F. Camerer, Elizabeth A. Phelps (2009). Thinking like a trader selectively reduces individuals' loss aversion. Proceedings of the National Academy of Sciences of the United States of America, 106, 13, 5035-5040. Sutter, Matthias (2007). Are teams prone to myopic loss aversion? An experimental study on individual versus team investment behavior. Economics Letters, 97, 128-132. Thaler, Richard, Amos Tversky, Daniel Kahneman, Alan Schwartz (1997). The Effect of Myopia and Loss Aversion on Risk Taking: An Experimental Test. Quarterly Journal of Economics, 112, 2, 647-661.

13
Figure 1: Mean risky asset investment over the duration of the experiment
Figure 2: Mean risky asset allocation in the last 20% of the experiment
14
Table 1: Tests of difference between the two groups over time
Table 2: Tests of difference between the two groups over time – matched pairs only

15
Table 3: Tobit Regression Results

16
Appendix A: Instructions Beta Overview The Beta Test allows us to work out final details before taking our new fund platform to the public. It takes several minutes a day for two weeks to complete, costs nothing to participate, and we compensate you for your involvement (see below). General Instructions The beta platform allows you to buy and sell our index fund: the Normann Leveraged USD Index. The contract is designed to replicate the performance of being long the US Dollar against other major currencies. You can buy and sell units in the fund with a cash portfolio we provide. Compensation For each pound you earn on the platform, 0.002 pound will be added to your Normann Parlay platform account. For example, if your final invested profit (final balance - starting balance) is GBP 300,000, you will receive GBP 600 (300,000/500) in your Normann Parlay Platform account or alternatively in your account at one of our partners. If you cannot accept the credit due to compliance restrictions or any other reason, you may "gift" the credit to whomever you wish (contact us for details). To Begin Navigate to the beta site. Create an account (only an email and password are required) and connect your LinkedIn Account. After agreeing that you have read the instructions, we require that you complete a short questionnaire. Once submitted, we will notify you within 30 days when you can begin trading on the platform.

17
Appendix B: Platform Panel A: Infrequent treatment group

18
Panel B: Frequent treatment group