can a major national food retailer improve the …
TRANSCRIPT

CAN A MAJOR NATIONAL FOOD RETAILER IMPROVE THE NUTRITIONAL
PROFILE OF US PACKAGED FOOD PURCHASES AND REDUCE DIET-RELATED
DISPARITIES?
Lindsey P. Smith
A dissertation submitted to the faculty of the University of North Carolina at Chapel Hill in
partial fulfillment of the requirements for the degree of Doctor of Philosophy in the Department
of Nutrition in the Gillings School of Global Public Health.
Chapel Hill
2014
Approved by:
Barry Popkin
Mary Story
David Guilkey
Anna Maria Siega-Riz
Shu Wen Ng

ii
© 2014
Lindsey P. Smith
ALL RIGHTS RESERVED

iii
ABSTRACT
Lindsey P. Smith: “Can a healthy foods initiative at a major national food retailer improve the
nutrient profile of US packaged food purchases and reduce diet-related disparities?”
(Under the direction of Barry M. Popkin)
Since 2011, three of the largest national food retailers in the US have implemented
healthier food initiatives (HFIs). Yet, no work has evaluated whether an HFI at a major national
food retailer actually improves the nutrient profile of food purchases. The objective of this
research is evaluate the impact of the food retailer and food-retailer based HFIs on the nutrient
profile of US packaged food purchases (PFPs).
Using a dataset of household PFPs, we employed Walmart as a case study to examine the
impact of a single food retailer as a food source in the US and who is most likely to shop there.
Secondly, using fixed effects models and inverse probability weighting to account for selectivity,
we evaluate whether the nutrient profile of Walmart PFPs improved over time. To test whether
improvements in the nutrient profile of Walmart’s PFP were attributable to the HFI, we
employed counterfactual simulations to compare the observed nutrient profile of post-HFI
purchases to the expected trajectory of nutrient profiles based on pre-HFI trends.
We found that not only do the majority of US households buy PFPs at Walmart, the
proportion of PFPs purchased from Walmart doubled from 2000 to 2012. Low-income non-
Hispanic White and Hispanic households, but not low-income non-Hispanic Black households,
were more likely to buy a larger proportion of PFPs at Walmart. From 2000 to 2012, Walmart
PFPs showed substantial declines in energy density, sugar density, and sodium density, and these

iv
declines were much larger than declines observed in other chain retailers. Hispanics and
non-Hispanic Others showed the largest declines in energy density and sodium density.
However, we found that post-HFI shifts in nutrient profile were similar to what would have been
expected based on pre-HFI trends, indicating that improvements in the nutrient profile of
Walmart PFPs were not attributable to its HFI. Continued evaluation of HFIs at Walmart and
other retailers is needed to understand how retailer-driven changes in food purchasing translate
into changes in food intake and impacts on health outcomes.

v
ACKNOWLEDGMENTS
I would like to thank my advisor, Barry Popkin, for his kindness and encouragement.
Barry has the unique ability to perceive his students’ individual strengths and needs, gives us the
opportunity to explore our own interests and goals, and pushes us to be our best. I am grateful to
have worked for someone who, despite being involved in projects and policies across the globe,
clearly cares so much about his students and staff. Thanks also to Shu Wen Ng, who has been an
incredible mentor both professionally and personally. Shu Wen is a true role model and friend,
and I am certain I am not alone in saying that I aspire to be her someday. Thanks also to Dr.
Guilkey, who patiently taught me the basics of econometrics, as well as Dr. Mary Story and Dr.
Anna Maria Siega-Riz, who provided insightful feedback throughout this process and
contributed an invaluable nutrition policy framework.
I would also like to thank other current and former members of the UNCFRP team and
staff at the Carolina Population Center, including Emily Yoon, the UNCFRP research assistants,
Phil Bardsley, Tom Swasey, Jan Hendrickson-Smith, and Lori Delaney. These individuals are
not only excellent at their jobs, but always do it with a smile on their faces. I feel so fortunate to
work an environment that is not only a productive but a happy place to work. I would especially
like to thank Donna Miles, who created all datasets used in this study, cheerfully responds to
frantic emails, and often serves a hallway therapist to stressed-out students. You’re the best!
My time at UNC has been touched by a number of current and former students, who not
only taught me about nutrition epidemiology, but were great friends, including: Carmen Piernas,

vi
Carolina Batis, Kevin Mathias, Jen Poti, Chris Ford, Lauren Butler, Elyse Powell, and
Nancy Lopez. I would also like to thank a few students in particular, Dalia Stern and Beth
Hopping. Dalia has been my officemate, coworker, and friend, and provided me with a willing
sounding board, a source of encouragement…and a newfound appreciation for the Spanish
language. Beth has been my early-morning workout buddy, late-night confidante, and an all-
around incredible support system. Thank you both for listening to me and laughing with me (or
at me), when I needed it most.
On a personal note, I want to thank my parents, Ann and Nelson Smith, for instilling in
me a desire not only to do well, but to do good. Their dedication to their patients, staff, family,
and community has long been my inspiration to work hard and to commit myself to public
service. I would also like to thank my sister for being such a wonderful friend and cheerleader,
despite living 3,000 miles away. I could not ask for a more loving and supportive family.
Finally, I would like to thank my partner, Paul Taillie. Paul was my chef, housekeeper,
and chauffeur during this dissertation process. His generosity, kindness, and support kept me not
only sane, but smiling. More importantly, Paul has taught me and continues to teach me to find
joy and beauty where I least expect it: in a freezing North Carolina salt marsh, in our bare feet; in
a crowded Shanghai park; in drizzly Seattle, and more often than not, in our own backyard. Paul
helps me to remember to take my work seriously, but not myself.

vii
TABLE OF CONTENTS
LIST OF TABLES ............................................................................................................................. x
LIST OF FIGURES .......................................................................................................................... xi
LIST OF ABBREVIATIONS AND SYMBOLS ........................................................................... xiii
CHAPTER 1. INTRODUCTION ...................................................................................................... 1
Background ........................................................................................................................ 1
Research Aims ................................................................................................................... 3
CHAPTER 2. LITERATURE REVIEW ........................................................................................... 5
Food retailers are important allies in the fight against obesity .......................................... 5
Food retailers, food retailer-based HFIs, and nutritional quality ....................................... 5
Secular trends in consumer purchasing and the food retail industry ................................. 7
Concerns with selection bias when evaluating HFIs ......................................................... 8
HFIs and diet-related disparities ........................................................................................ 9
Current strategies for evaluating nation-wide industry initiatives
to improve nutrition ........................................................................................................ 10
Walmart as a case study ................................................................................................... 10
CHAPTER 3. THE EMERGING ROLE OF WALMART IN US PACKAGED
FOOD PURCHASES: WHO SHOPS THERE, HOW MUCH IS
PURCHASED, AND PUBLIC HEALTH IMPLICATIONS ........................................ 13
Overview .......................................................................................................................... 13

viii
Introduction ...................................................................................................................... 14
Methods............................................................................................................................ 16
Results .............................................................................................................................. 19
Discussion ........................................................................................................................ 20
Conclusion ....................................................................................................................... 24
Tables and Figures ........................................................................................................... 26
CHAPTER 4. THE NUTRIENT PROFILE OF PACKAGED FOOD
PURCHASES AT WALMART AND OTHER CHAIN
RETAILERS IMPROVED FROM 2000 TO 2013. ...................................................... 31
Overview .......................................................................................................................... 31
Introduction ...................................................................................................................... 33
Methods............................................................................................................................ 36
Results .............................................................................................................................. 41
Discussion ........................................................................................................................ 43
Tables and Figures ........................................................................................................... 49
CHAPTER 5. CAN A HEALTHY FOODS INITIATIVE BY A MAJOR
NATIONAL FOOD RETAILER IMPROVE THE NUTRIENT
PROFILE OF US FOOD PURCHASES? ..................................................................... 69
Overview .......................................................................................................................... 69
Introduction ...................................................................................................................... 72
Methods............................................................................................................................ 75
Results .............................................................................................................................. 79
Discussion ........................................................................................................................ 82
Conclusion ....................................................................................................................... 88

ix
CHAPTER 6. SYNTHESIS ........................................................................................................... 115
Overview of findings ..................................................................................................... 115
Strengths and Limitations .............................................................................................. 119
Significance and public health impact ........................................................................... 126
Future Directions ........................................................................................................... 129
REFERENCES .............................................................................................................................. 133

x
LIST OF TABLES
Table 3.1. Household characteristics of the Nielsen Homescan sample by
whether or not a household shopped at Walmart from 2000 to
2012a (n=663,073) ......................................................................................................... 26
Table 4.1. Household characteristics of the Nielsen Homescan sample
in 2000 and 2013a (n=2,611,125) .................................................................................. 49
Table 4.2 Percent volume from top food and beverage groups at Walmart
and other chain retailers (OCR), 2000 to 2013 .............................................................. 51
Table 4.3. Nutrient density of food groups at Walmart and other
chain retailers (OCR) from 2000 to 2012 ...................................................................... 52
Table 4.4 Nutrient profile of OCR and Walmart PFPs by Race/ethnicity ...................................... 56
Supplemental Table 4.1. Food and Beverage Groupings, with Examples....................................... 59
Supplemental Table 4.2 Percent volume of PFP groups purchased at other
chain retailers (OCR) and Walmart for top 30 food groups,
pooled from 2000-2013................................................................................................. 60
Supplemental Table 4.3. Creation of inverse probability weight .................................................... 61
Supplemental Table 4.4 Year coefficients using different inverse probability
weight approaches ......................................................................................................... 63
Supplement Table 4.5 Predicted nutrient Profile of OCR and Walmart PFPs
by Household Incomea ................................................................................................... 67
Table 5.1 Household characteristics of the Nielsen Homescan sample in 2000
and 2013 ......................................................................................................................... 89
Supplemental Table 5.1 Coefficients for switching regression models of energy
density and sodium density of Walmart PFPs, 2000 to 2013 ...................................... 100
xi
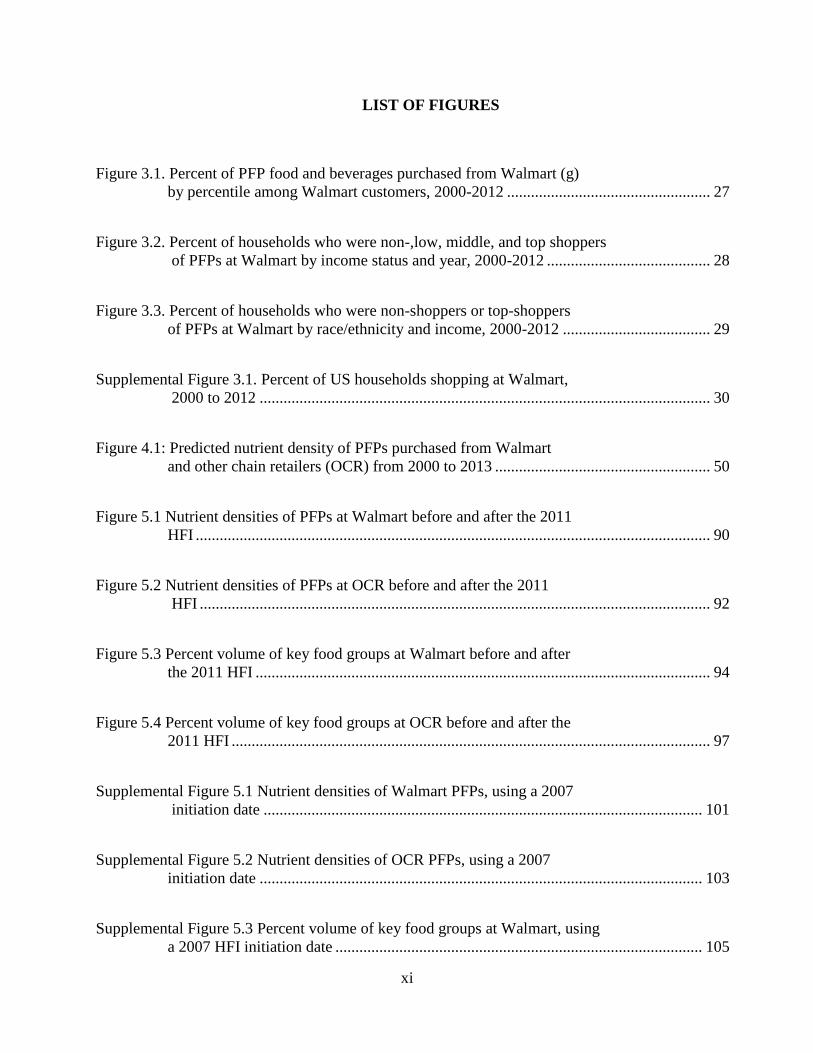
LIST OF FIGURES
Figure 3.1. Percent of PFP food and beverages purchased from Walmart (g)
by percentile among Walmart customers, 2000-2012 ................................................... 27
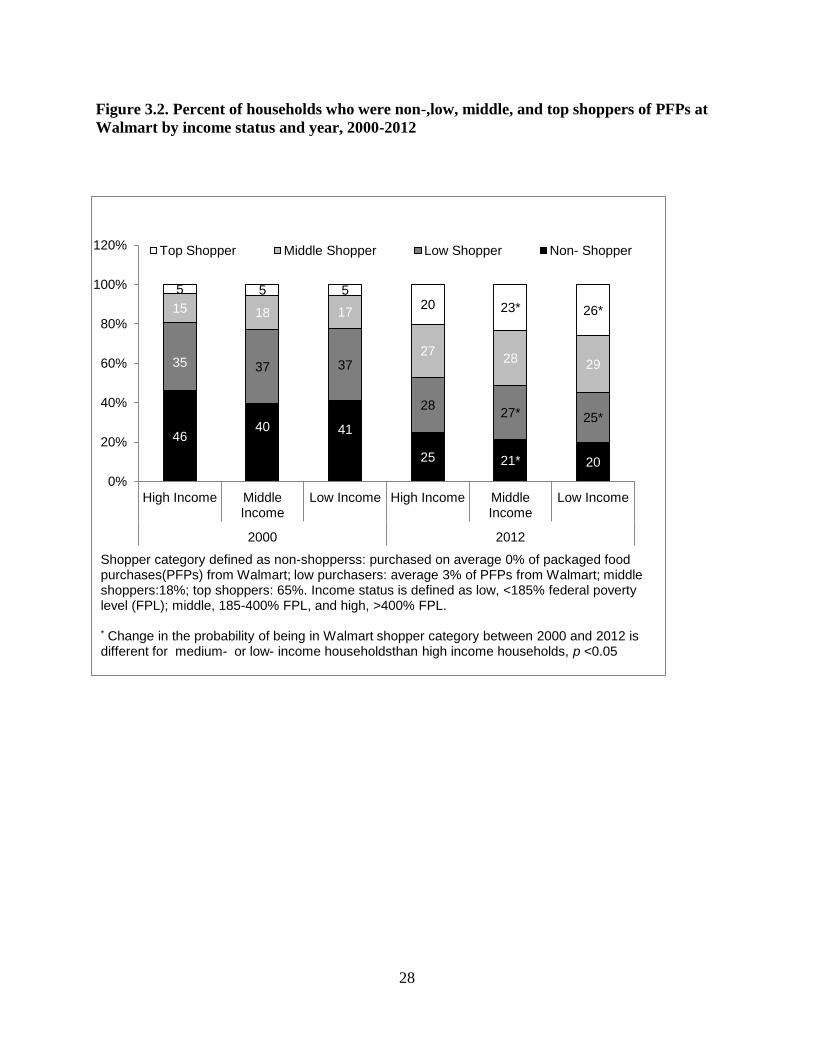
Figure 3.2. Percent of households who were non-,low, middle, and top shoppers
of PFPs at Walmart by income status and year, 2000-2012 ......................................... 28
Figure 3.3. Percent of households who were non-shoppers or top-shoppers
of PFPs at Walmart by race/ethnicity and income, 2000-2012 ..................................... 29
Supplemental Figure 3.1. Percent of US households shopping at Walmart,
2000 to 2012 ................................................................................................................. 30
Figure 4.1: Predicted nutrient density of PFPs purchased from Walmart
and other chain retailers (OCR) from 2000 to 2013 ...................................................... 50
Figure 5.1 Nutrient densities of PFPs at Walmart before and after the 2011
HFI ................................................................................................................................. 90
Figure 5.2 Nutrient densities of PFPs at OCR before and after the 2011
HFI ................................................................................................................................ 92
Figure 5.3 Percent volume of key food groups at Walmart before and after
the 2011 HFI .................................................................................................................. 94
Figure 5.4 Percent volume of key food groups at OCR before and after the
2011 HFI ........................................................................................................................ 97
Supplemental Figure 5.1 Nutrient densities of Walmart PFPs, using a 2007
initiation date .............................................................................................................. 101
Supplemental Figure 5.2 Nutrient densities of OCR PFPs, using a 2007
initiation date ............................................................................................................... 103
Supplemental Figure 5.3 Percent volume of key food groups at Walmart, using
a 2007 HFI initiation date ............................................................................................ 105

xii
Supplemental Figure 5.4 Percent volume of key food groups at Walmart,
using a 2007 HFI initiation date................................................................................... 108
Supplemental Figure 5.5 Energy density of PFPs at Walmart, before and after
the 2011 HFI, by race/ethnicity ................................................................................... 111
Supplemental Figure 5.6 Sodium density of PFPs at Walmart, before and after
the 2011 HFI, by race/ethnicity ................................................................................... 113

xiii
LIST OF ABBREVIATIONS AND SYMBOLS
AFP Average food price
GBD Grain-based dessert
FPL Federal Poverty Level
HFI Healthy Foods Initiative
HWCF Healthy Weight Commitment Foundation
NFP Nutrition Facts Panel
OCR Other chain retailers
PFPs Packaged food purchases
RTE Ready-to-eat
SSB Sugar-sweetened beverage
SNAP Supplemental Nutrition Assistance Program
UNCFRP University of North Carolina Food Research Program

1
CHAPTER 1. INTRODUCTION
Background
Since 2011, a number of the largest supermarkets in the US have implemented healthier
food initiatives (HFIs) to increase the availability and affordability of healthier foods. These
retailer-based strategies have major potential to improve the nutrient profile of what US
households purchase and consume, not only because food stores in general provide the majority
of daily energy for US children and adults (1, 2), but because national trends towards chain
stores and consolidation (3) means that these top retailers account for the majority of US food
purchases (4).
However, no work has examined whether an HFI at a major national food retailer can
improve the nutritional quality of the US diet in a significant way. First, due to lack of access to
retailer data, little work has examined the overall impact of major food retailers on the nutrient
profile of the US food supply. Second, while previous studies have shown that supermarket HFIs
can improve the healthfulness of purchases, most studies were short-term, limited to a few stores,
lacked product-specific nutrient information, and did not examine whether the HFI changed
customer purchasing behaviors or simply attracted different customers. In addition, considering
recent changes in the economic environment, such as the “Great Recession,” and changes in the
food retail environment, it is critical to understand whether the HFI truly changed nutritional
quality of purchases, or whether changes simply reflect overall trends in purchases from chain

2
food retailers during this time period. Finally, HFIs at major national food retailers
represent a potential strategy to reduce diet-related health disparities for key subpopulations,
such as low-income and minorities, who often have nutritionally poorer diets and less access to
healthy foods. Yet, to our knowledge, no one has examined whether HFIs successfully improve
nutritional quality of purchases in these key groups.
This study uses Walmart, the US’ largest supermarket, as a case study to examine the
impact of the food retailer and food-retailer based HFIs on the nutrient profile of US household
packaged food purchases. The overarching goal of this study is to evaluate whether an HFI at a
major national retailer can improve the nutrient profile of food and beverage purchases over
time, as measured by reductions in energy, sugar, saturated fat, and sodium densities. We use
Nielsen Homescan panel data, a longitudinal dataset of packaged food (PFPs) purchased by US
households that has been linked to product-specific nutrition information from 2000 to 2013 for
over 2.4 million household quarters. Using this data, we first characterized the role of Walmart
as source of PFPs in the US, and who is most likely to shop there. Next, using these
characterizations, we developed inverse probability weights to account for the selectivity of
shopping at Walmart vs. other chain retailers over time. We examined whether shifts in the
nutrient profile of Walmart PFPs were greater than trends at other food retailers, whether these
shifts were attributable to Walmart’s HFI, and whether these changes were greater among low-
income and race/ethnic minority households.

3
Research Aims
Aim 1: Examine the role of Walmart as a source of PFPs and describe the profile of
Walmart shoppers (2000-2013)
1a. We examined the trends in the percent of US households shopping at Walmart as well as
changes in the distribution of percentage of PFPs households purchase at Walmart relative to
total food store purchases.
1b. We explored the association between socio-demographic characteristics and who was most
likely to buy the most at Walmart, and how these associations changed over time.
Aim 2: Test whether the nutritional profile of Walmart PFPs improved from 2000 to 2013,
and whether these changes were greater than trends at comparable food retailers:
2a. We developed time-varying inverse probability weights to account for the potential
selectivity bias associated with shopping at Walmart or other chain retailers.
2b. We examined changes in the nutrient profile of Walmart and OCR PFPs over time, including
energy, sugar, saturated fat, and sodium density.
2c. We examined whether these changes were driven by shifts in purchasing or reformulation by
examining changes in percent volume of food groups purchased, as well as changes in the
nutrient profile within these food groups from 2000 to 2013.
2d. We examined whether these changes in nutrient profile were greater among SNAP-eligible or
race/ethnic minority households.
Aim 3: Test whether shifts in the nutrient profile were attributable to Walmart’s HFI:
3a. We conducted counterfactual simulations by comparing the projected pre-HFI trends in

4
nutrient profile of Walmart PFPs to observed post-HFI trends in nutrient profile, and compared
these to concurrent trends in the nutrient profile of PFPs at other chain retailers (OCR).
3b. We tested whether the effect of the HFI varied depending on whether Walmart’s stated pre-
HFI period (2000-2010) or a data-defined pre-HFI period (2000-2006) was used.
3c. We examined whether the HFI was more impactful in shifting the nutrient profile of PFPs
among key subpopulations, including SNAP-eligible households and racial/ethnic minorities.

5
CHAPTER 2. LITERATURE REVIEW
Food retailers are important allies in the fight against obesity
Public health experts have increasingly recognized food retailers as potential agents for
improving nutrition and preventing obesity, (5, 6) because they provide the majority of daily
energy for US children and adults (1, 2), and because of their pivotal positioning between food
manufacturers and the public (5, 6). In fact, since 2011, several of the US’ largest grocers have
implemented “healthier foods initiatives” (HFIs) to encourage healthier food purchases (7-10).
National trends towards chain stores and consolidation (3) means that these top retailers account
for about half of all US food purchases (4) and thus have major potential to influence the nutrient
profile of US food and beverage purchases.
Food retailers, food retailer-based HFIs, and nutritional quality
Currently, it is unclear whether supermarket-based HFIs improve nutritional quality of
purchases over the long term. Field studies on retailer-based HFIs have been equivocal: while
some field studies have found that HFIs demonstrate moderate to high reach (11-13) and
improve healthy food availability, sales of targeted foods, and self-reported knowledge,
purchasing, and intake of healthier food (11, 14-18), others have found that common HFI
components are ineffective at changing long-term purchasing behaviors. For example, while
consumers report that nutrition signs and labels improve knowledge (19-21), these strategies are
not well-understood or highly used (22-24) and do not significantly impact food purchasing
6
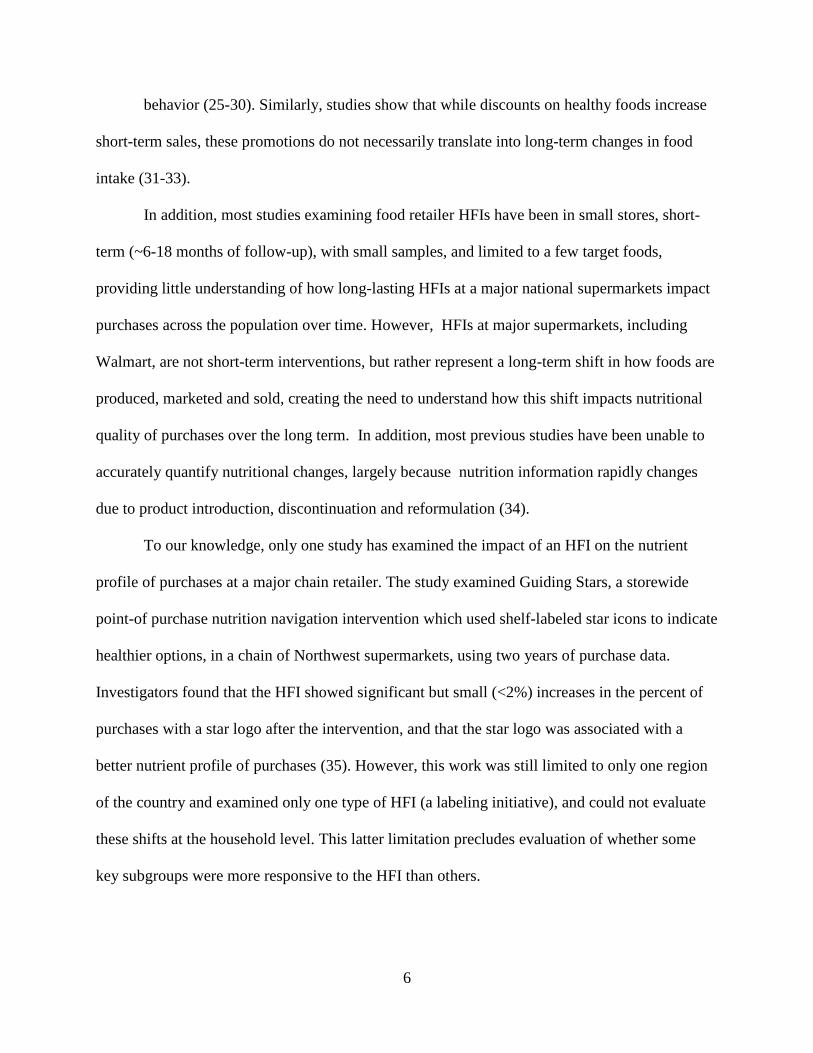
behavior (25-30). Similarly, studies show that while discounts on healthy foods increase
short-term sales, these promotions do not necessarily translate into long-term changes in food
intake (31-33).
In addition, most studies examining food retailer HFIs have been in small stores, short-
term (~6-18 months of follow-up), with small samples, and limited to a few target foods,
providing little understanding of how long-lasting HFIs at a major national supermarkets impact
purchases across the population over time. However, HFIs at major supermarkets, including
Walmart, are not short-term interventions, but rather represent a long-term shift in how foods are
produced, marketed and sold, creating the need to understand how this shift impacts nutritional
quality of purchases over the long term. In addition, most previous studies have been unable to
accurately quantify nutritional changes, largely because nutrition information rapidly changes
due to product introduction, discontinuation and reformulation (34).
To our knowledge, only one study has examined the impact of an HFI on the nutrient
profile of purchases at a major chain retailer. The study examined Guiding Stars, a storewide
point-of purchase nutrition navigation intervention which used shelf-labeled star icons to indicate
healthier options, in a chain of Northwest supermarkets, using two years of purchase data.
Investigators found that the HFI showed significant but small (<2%) increases in the percent of
purchases with a star logo after the intervention, and that the star logo was associated with a
better nutrient profile of purchases (35). However, this work was still limited to only one region
of the country and examined only one type of HFI (a labeling initiative), and could not evaluate
these shifts at the household level. This latter limitation precludes evaluation of whether some
key subgroups were more responsive to the HFI than others.
7
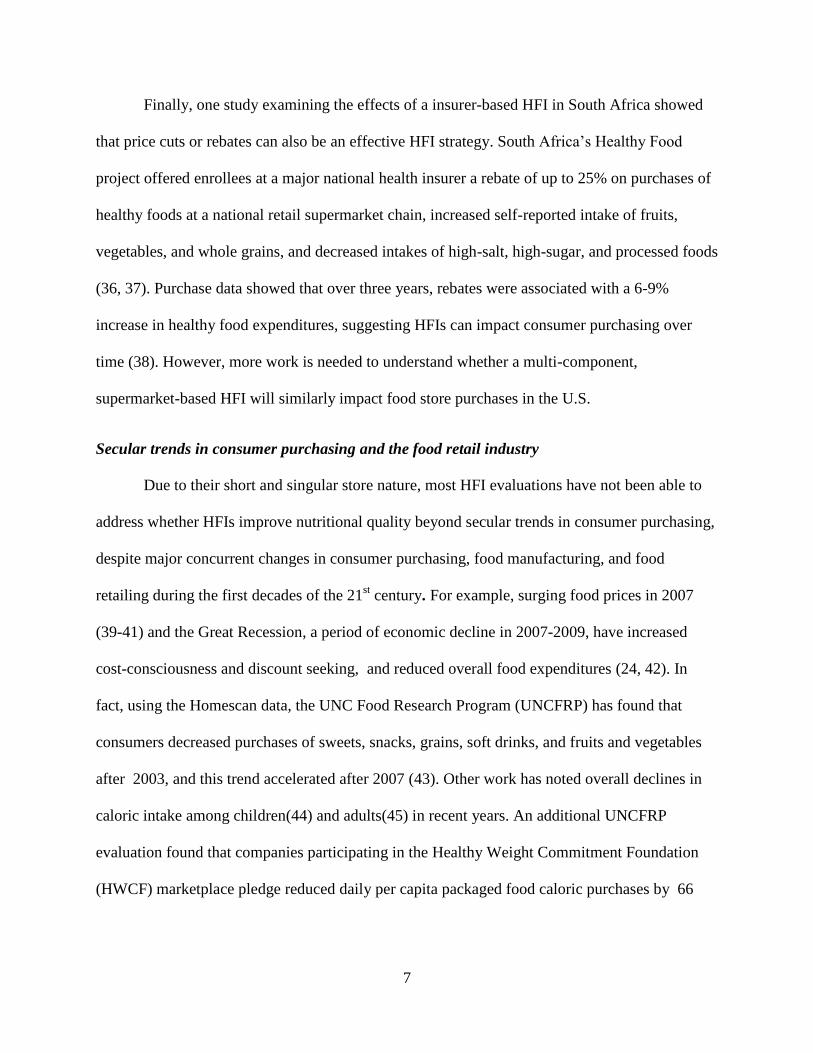
Finally, one study examining the effects of a insurer-based HFI in South Africa showed
that price cuts or rebates can also be an effective HFI strategy. South Africa’s Healthy Food
project offered enrollees at a major national health insurer a rebate of up to 25% on purchases of
healthy foods at a national retail supermarket chain, increased self-reported intake of fruits,
vegetables, and whole grains, and decreased intakes of high-salt, high-sugar, and processed foods
(36, 37). Purchase data showed that over three years, rebates were associated with a 6-9%
increase in healthy food expenditures, suggesting HFIs can impact consumer purchasing over
time (38). However, more work is needed to understand whether a multi-component,
supermarket-based HFI will similarly impact food store purchases in the U.S.
Secular trends in consumer purchasing and the food retail industry
Due to their short and singular store nature, most HFI evaluations have not been able to
address whether HFIs improve nutritional quality beyond secular trends in consumer purchasing,
despite major concurrent changes in consumer purchasing, food manufacturing, and food
retailing during the first decades of the 21st century. For example, surging food prices in 2007
(39-41) and the Great Recession, a period of economic decline in 2007-2009, have increased
cost-consciousness and discount seeking, and reduced overall food expenditures (24, 42). In
fact, using the Homescan data, the UNC Food Research Program (UNCFRP) has found that
consumers decreased purchases of sweets, snacks, grains, soft drinks, and fruits and vegetables
after 2003, and this trend accelerated after 2007 (43). Other work has noted overall declines in
caloric intake among children(44) and adults(45) in recent years. An additional UNCFRP
evaluation found that companies participating in the Healthy Weight Commitment Foundation
(HWCF) marketplace pledge reduced daily per capita packaged food caloric purchases by 66

8
kcal/day among households with children from 2007 to 212, with additional caloric reductions in
non-HWCF purchases and in private-label purchases as well (46).
In addition, major food stores have also implemented HFIs in recent years, such as
Kroger’s “Health Matters” program, Safeway’s “SimpleNutrition” program, or Boston
supermarkets’ recent “Healthier Beverage” initiatives (8, 47, 48). Accounting for these secular
trends is important in order to determine whether changes in nutritional quality of purchases are
actually attributable to the retailer’s HFI and not simply reflections of concurrent trends in food
purchasing, manufacturing, or at other chain retailers.
Concerns with selection bias when evaluating HFIs
Shopping choices are driven by a complex set of factors, which not only determine where
a customer shops, but how much they respond to food retailer HFIs. Sample selection bias may
arise because the choice to shop at a certain store is non-random. For example, less educated,
lower income, and African American individuals more likely to shop at lower-priced
supercenters (49, 50). This choice is also driven by a number of preferences, including quality,
variety of products available, store loyalty, proximity, opportunity cost, how much a shopper
plans to buy, and price expectations (51-56). For example, those who shop for many items at
once prefer “everyday low pricing” stores such as Walmart, which typically set lower, less
variable prices across a wide range of products (53, 55, 56). This sample selection bias poses a
problem because some households are more likely to shop or buy more at one food retailer than
others, and these inherent characteristics also may be associated with the nutritional quality of
purchases. Failure to address selectivity can introduce bias in the relationship between that
retailer’s purchases and nutritional quality, as well as limit the generalizability of study results.
9
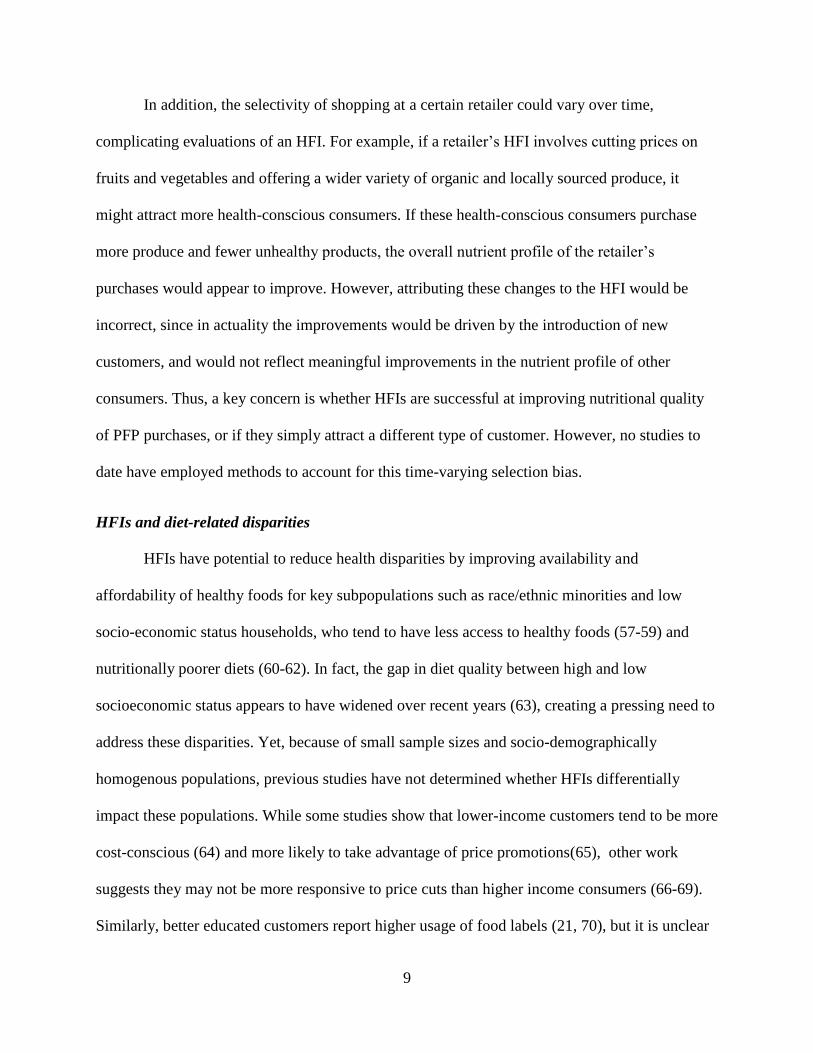
In addition, the selectivity of shopping at a certain retailer could vary over time,
complicating evaluations of an HFI. For example, if a retailer’s HFI involves cutting prices on
fruits and vegetables and offering a wider variety of organic and locally sourced produce, it
might attract more health-conscious consumers. If these health-conscious consumers purchase
more produce and fewer unhealthy products, the overall nutrient profile of the retailer’s
purchases would appear to improve. However, attributing these changes to the HFI would be
incorrect, since in actuality the improvements would be driven by the introduction of new
customers, and would not reflect meaningful improvements in the nutrient profile of other
consumers. Thus, a key concern is whether HFIs are successful at improving nutritional quality
of PFP purchases, or if they simply attract a different type of customer. However, no studies to
date have employed methods to account for this time-varying selection bias.
HFIs and diet-related disparities
HFIs have potential to reduce health disparities by improving availability and
affordability of healthy foods for key subpopulations such as race/ethnic minorities and low
socio-economic status households, who tend to have less access to healthy foods (57-59) and
nutritionally poorer diets (60-62). In fact, the gap in diet quality between high and low
socioeconomic status appears to have widened over recent years (63), creating a pressing need to
address these disparities. Yet, because of small sample sizes and socio-demographically
homogenous populations, previous studies have not determined whether HFIs differentially
impact these populations. While some studies show that lower-income customers tend to be more
cost-conscious (64) and more likely to take advantage of price promotions(65), other work
suggests they may not be more responsive to price cuts than higher income consumers (66-69).
Similarly, better educated customers report higher usage of food labels (21, 70), but it is unclear

10
whether HFIs are more effective at improving nutritional quality of purchases among higher
educated customers. In particular, no work has examined whether HFIs differentially impact
certain types of low-income households, such as households who are eligible to receive or
receive supplemental nutrition assistant program (SNAP) benefits, and could potentially benefit
the most from increased affordability and availability of healthy foods (71-73).
Current strategies for evaluating nation-wide industry initiatives to improve nutrition
To our knowledge, there have been no independent evaluations of HFIs at major national
food retailers. However, as previously mentioned, UNCFRP has been tasked with evaluating a
major initiative by the food industry to cut 1.5 trillion calories from the food supply by 2015. As
with Walmart’s HFI, the HWCF food companies pledge was nation-wide, which means there is
no clear natural experiment or control group to which shifts in calories can be compared. While a
simple approach would be to compare pre-initiative trends to post-initiative trends, this approach
cannot identify whether observed changes were attributable to the HFI or to concurrent shifts in
the economic, socio-demographic, and food retail environments as previously mentioned. To
deal with this concern, the UNCFP developed an approach utilizing counterfactual simulations
(74-76): what would the nutrient profile of purchases look like if the initiative had not been
enacted, if all other factors were held constant (46)? This strategy allows researchers to compare
the expected nutrient profile of post-HFI food purchases based on pre-HFI trends to what
actually happened during the post-HFI period, while controlling for secular trends.
Walmart as a case study
Because of its size and scope, Walmart represents unique opportunity to examine the
impact of a single food retailer as a source of US food purchases, as well as whether national
food retailers can successfully improve the nutritional quality of US food purchases. Walmart is
11
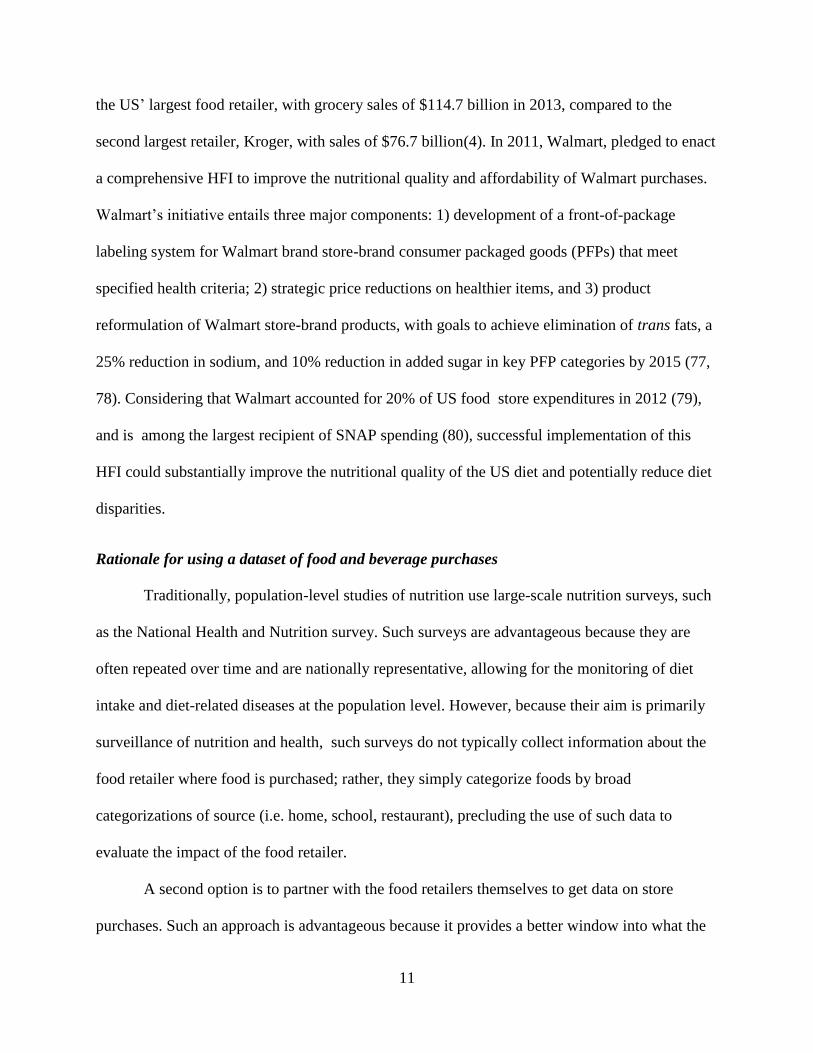
the US’ largest food retailer, with grocery sales of $114.7 billion in 2013, compared to the
second largest retailer, Kroger, with sales of $76.7 billion(4). In 2011, Walmart, pledged to enact
a comprehensive HFI to improve the nutritional quality and affordability of Walmart purchases.
Walmart’s initiative entails three major components: 1) development of a front-of-package
labeling system for Walmart brand store-brand consumer packaged goods (PFPs) that meet
specified health criteria; 2) strategic price reductions on healthier items, and 3) product
reformulation of Walmart store-brand products, with goals to achieve elimination of trans fats, a
25% reduction in sodium, and 10% reduction in added sugar in key PFP categories by 2015 (77,
78). Considering that Walmart accounted for 20% of US food store expenditures in 2012 (79),
and is among the largest recipient of SNAP spending (80), successful implementation of this
HFI could substantially improve the nutritional quality of the US diet and potentially reduce diet
disparities.
Rationale for using a dataset of food and beverage purchases
Traditionally, population-level studies of nutrition use large-scale nutrition surveys, such
as the National Health and Nutrition survey. Such surveys are advantageous because they are
often repeated over time and are nationally representative, allowing for the monitoring of diet
intake and diet-related diseases at the population level. However, because their aim is primarily
surveillance of nutrition and health, such surveys do not typically collect information about the
food retailer where food is purchased; rather, they simply categorize foods by broad
categorizations of source (i.e. home, school, restaurant), precluding the use of such data to
evaluate the impact of the food retailer.
A second option is to partner with the food retailers themselves to get data on store
purchases. Such an approach is advantageous because it provides a better window into what the

12
company actually did, when it was implemented, and how; however, such a partnership also
comes with limitations. First, companies are not always eager to partner with outside researchers
and second, such relationships could influence objectivity. For example, the Guiding Stars HFI
evaluation was funded by the food retailer where the HFI was implemented as well as the
company who designed the nutrition navigation program. While such studies can still provide
useful data, if HFIs were ever to be considered on a bigger scale, policymakers would also need
evidence from independent evaluations, where researchers are not encumbered relationships to
businesses, which are typically concerned most about their image and their bottom line.
Considering these limitations, this study employs a third approach, capitalizing on the
unique features of the Nielsen Homescan panel data, a longitudinal dataset of household
purchases which our team has linked to product-specific nutrition information (Nutrition Facts
Panels, or NFPs) for over 2.4 million household quarters from 2000-2013 (34). These NFPs are
continuously updated and matched to PFP products, providing a more accurate and time-
sensitive measure of nutrition, providing a distinct advantage to studies which simply use
purchase data and thus cannot study changes in nutrient profile. The Homsecan dataset includes
information on all food and beverages with a barcode, including information on price, volume,
unit size, and importantly, the retailer where the product was purchased. This data allows us to
examine the impact of specific retailers on the nutrient profile of US food purchases. Moreover,
the longitudinal nature of this household level data allows us to examine how the nutrient profile
of purchases at the HFI store changed over time, whether these changes were above and beyond
changes at similar retailers over the same time period, and finally, whether these changes were
greater or less in key subpopulations.

13
CHAPTER 3. THE EMERGING ROLE OF WALMART IN US PACKAGED
FOOD PURCASHES: WHO SHOPS THERE, HOW MUCH IS PURCHASED, AND
PUBLIC HEALTH IMPLICATIONS
Overview
Despite a growing focus on the food environment, little is known about the impact of
specific food retailers as a food source in the US, especially among low-income populations. We
examined purchasing trends among the US’ largest food retailer, Walmart, and whether low-
income and race/ethnic minority households are more likely to shop there. Using nationally
representative household purchase data, we analyzed trends in Walmart packaged food purchases
(PFPs) from 2000 to 2012. We find that not only do the majority of households buy food at
Walmart, the proportion of PFPs purchased from Walmart doubled from 2000 to 2012. Low-
income non-Hispanic White and Hispanic households, but not low-income non-Hispanic Black
households, were more likely to buy a larger proportion of PFPs at Walmart. We find that a
single food retailer—Walmart—is an increasingly dominant source of PFPs, especially among
low-income households. As fewer food retailers account for an increasingly large share of PFPs,
more work is needed to understand how shifts in the food retail environment affect the
nutritional quality of the US diet.

14
Introduction
Consensus among public health and nutrition scholars has been growing about the
importance of the food environment for improving our health (81, 82). Perhaps one of the most
important elements of this environment is food stores, which supply the majority of daily caloric
energy for children and adults (1, 2, 83). Public health experts have increasingly recognized food
retailers as potential agents for improving nutrition and preventing obesity (5, 6), in part because
of their major role as a source of food and also because of their pivotal position between food
companies and the public.
Despite this growing awareness of the food environment, to our knowledge, no research
has explicitly examined the role of specific retailers in the US food supply. Yet, an
understanding of the size and scope of food retailers is increasingly important, as the expansion
of chains and consolidation (3) has created a food landscape in which fewer retailers are
accounting for a larger share of grocery sales: the top eight grocery retailers accounted for nearly
50% of US grocery sales in 2012, compared to only 26% in 1992 (4).
Moreover, identifying the extent to which a single food retailer serves as a source of the
US food supply is an important first step in identifying whether and to what degree food retailers
can be leveraged to improve diet quality. Many scholars have noted the need to improve labeling
(e.g., front-of-the-package food profiling) and reformulate food products as critical components
of improving nutrition and combating obesity (84-90). However, few have actually studied these
kinds of initiatives implemented by key food retailers (7, 9, 91), yielding an incomplete
understanding of their potential impact on the nutritional quality of the US diet.
Understanding the role of the food retailer as a source of PFPs is particularly important
among low-income households, who tend to have less food availability and face greater
15
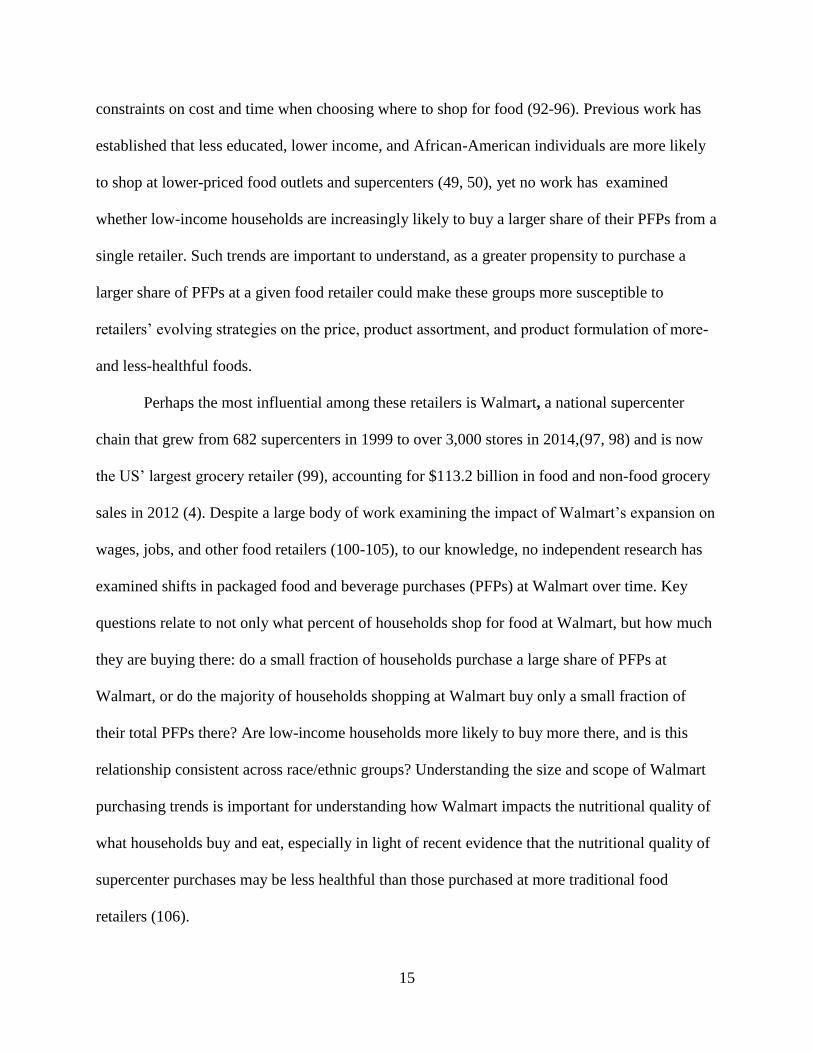
constraints on cost and time when choosing where to shop for food (92-96). Previous work has
established that less educated, lower income, and African-American individuals are more likely
to shop at lower-priced food outlets and supercenters (49, 50), yet no work has examined
whether low-income households are increasingly likely to buy a larger share of their PFPs from a
single retailer. Such trends are important to understand, as a greater propensity to purchase a
larger share of PFPs at a given food retailer could make these groups more susceptible to
retailers’ evolving strategies on the price, product assortment, and product formulation of more-
and less-healthful foods.
Perhaps the most influential among these retailers is Walmart, a national supercenter
chain that grew from 682 supercenters in 1999 to over 3,000 stores in 2014,(97, 98) and is now
the US’ largest grocery retailer (99), accounting for $113.2 billion in food and non-food grocery
sales in 2012 (4). Despite a large body of work examining the impact of Walmart’s expansion on
wages, jobs, and other food retailers (100-105), to our knowledge, no independent research has
examined shifts in packaged food and beverage purchases (PFPs) at Walmart over time. Key
questions relate to not only what percent of households shop for food at Walmart, but how much
they are buying there: do a small fraction of households purchase a large share of PFPs at
Walmart, or do the majority of households shopping at Walmart buy only a small fraction of
their total PFPs there? Are low-income households more likely to buy more there, and is this
relationship consistent across race/ethnic groups? Understanding the size and scope of Walmart
purchasing trends is important for understanding how Walmart impacts the nutritional quality of
what households buy and eat, especially in light of recent evidence that the nutritional quality of
supercenter purchases may be less healthful than those purchased at more traditional food
retailers (106).

16
The objective of this paper is to quantitatively evaluate the degree to which a single food
retailer can serve as a source of PFPs in the US by examining trends in US household PFPs at
Walmart from 2000 to 2012. We use a large, nationally representative dataset of household
purchases to examine trends in percent of US households shopping at Walmart as well as
changes in the distribution of the proportion of PFPs these households purchase there. Secondly,
we examine whether low-income households are more likely to purchase a higher proportion of
PFPs at Walmart than higher-income households, whether this has changed over time, and
whether the association of low-income with Walmart purchasing is constant across race/ethnic
groups.
Methods
This study uses Nielsen Homescan, a commercial dataset containing information on PFPs
at the household-quarter level.(107) PFPs include all food and beverages with a barcode,
including all consumer packaged goods as well as packaged fresh fruit and vegetables (i.e. bag of
lettuce, bag of potatoes) but excluding unpackaged meat and produce (i.e. an apple).
Participating households use a handheld scanner to record all purchases during each shopping
trip. Households are sampled from 76 markets, and weighted to be nationally representative.
Households report detailed information on each PFP purchased from outlet channels, including
grocery (i.e., Kroger’s, Safeway, etc.), drug, supercenters (i.e. Super Target, Walmart), club (i.e.
Sam’s Club), dollar stores, and convenience stores. Because the types of products available may
differ by store type, for this study, we include all PFPs from grocery stores, supermarkets, and
supercenters (i.e. “other food stores”), and exclude warehouse, drug, club, dollar, and
convenience stores to ensure comparability between Wal-Mart purchases and other food store
PFPs. Walmart purchases include all food and beverage PFPs from Walmart Supercenters and

17
Walmart Neighborhood markets, the latter being smaller in size and assortment while offering a
full line of groceries, bakery, and deli items (108). These do not include Sam’s Club and
Walmart Express, which are Walmart’s warehouse and convenience stores, respectively
For this study, purchases were aggregated at the year-household level, for a total of
663,073 household-year observations from 158,382 unique households. For each household in
each year from 2000 to 2012, we summed the PFPs from Walmart and from other food stores,
measured in terms of grams purchased. We measured purchases in grams instead of calories
because our key goal was to understand overall trends in the proportion of PFPs purchased at
Walmart relative to other food stores, whereas changes in calories purchased reflect both changes
in the proportion of PFPs purchased at Walmart as well as changes in the nutrient of foods over
time (7, 109). However, sensitivity analyses conducted using caloric purchases from Walmart
and other food stores revealed similar trends to those presented here.
Statistical Analysis
All statistical analyses were performed using STATA, version 13 (Stata Corporation,
College Station, Texas).
In initial analyses, data were treated as pooled cross-sectional, and weighted to be
nationally representative using Nielsen’s projection factors1. Logistic regression was used to
describe changes in the likelihood of shopping at Walmart (i.e., spent >0$ on any PFP at
Walmart) for each year from 2000 to 2012. From these models, we compared the predicted
percent of shopping at Walmart in each year to 2000. Secondly, in order to examine changes in
the proportion of PFPs purchased at Walmart over time, quantile regression was used to examine
1Survey commands (for logistic regression) and probability weights (for quantile regression) were used to adjust
estimates to be nationally representative. However, models did not account for the non-independence of repeated
measurements on households in the sample over time, because robust covariance estimators are not permitted in
STATA in conjunction with these methods. However, we re-ran all models without adjustment to be nationally
representative but with robust covariance estimators and found that the results were virtually identical.

18
the distribution of the proportion of PFPs purchased at Walmart relative to total food store
purchases at the 50th
, 75th
, and 95th
percentiles. The predicted percent of PFPs purchased at
Walmart in each year was compared to 2000.
Secondly, to examine the association between income, race/ethnicity, and proportion of
PFPs purchased at Walmart, households were divided into quartiles of Walmart shopper, based
on the distribution of proportion of PFPs purchased at Walmart in 2012. On average, non-
shopper households purchased 0% of PFPs from Walmart (range 0.0% to 0.3%), low shopper
households purchased 3% (range 3.0% to 7.2%, medium shoppers purchased 18% (range 7.2%
to 33.9%), and top shoppers purchased 68% (range 33.9% to 100%) of PFPs from Walmart.
Multinomial logistic models included household race (non-Hispanic White, Hispanic, non-
Hispanic Black, and non-Hispanic Other) and household income [low <185% Federal Poverty
Level (FPL), medium 185-400% FPL, high >400% FPL]. These models controlled for head of
household education (≤ high school degree, some college,≥ college degree), household type
(single adult, multiple adults with no kids, adult(s) with kid(s)) and household composition
(numbers of men or women aged 19-29, 30-39, 40-49, 50-59, ≥60y, and numbers of boys and
girls aged 0-1y, 2-5y, 6-12y, 13-18y).
In addition, models controlled for whether there was a Walmart present in a given market
in a given year, as defined by>$10,000 annual sales from PFPs per market per year. Additional
cut-points for determining presence of a market were also tested (>$0 and $5,000) and generally
yielded similar results; however, to be sure that purchases in a market were actually from that
market and not a neighboring market where households may have traveled to purchase items, the
higher cut-point (>$10,000) was used.

19
Additional models tested interactions of income and year, and income and race/ethnicity,
using Wald “chunk” tests for joint significance of interaction.(110) Robust cluster variance
estimators were used to adjust the standard errors to reflect the non-independence of households
who remained in the sample across time.(111, 112) For each model, STATA’s margins
command was used to estimate the predicted percent of households in a shopper category for
each income, race/ethnic, or year combination. All analyses were Bonferroni-corrected for
multiple comparisons, and statistical significance was set at p<0.01 for main effects and p<0.05
for interactions.
Results
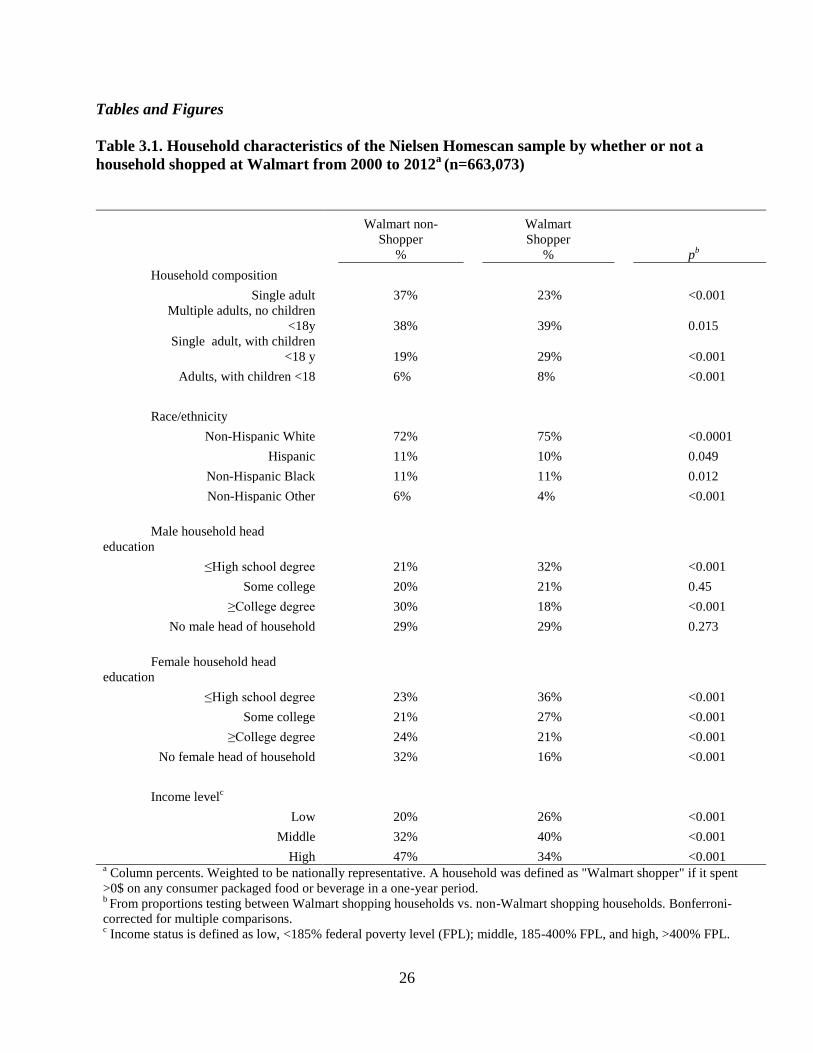
Household demographic characteristics of the sample are presented in Table 3.1.
Walmart-shopping households were more likely to have children, be less educated, be non-
Hispanic White, and have a low- or middle- income.
The percentage of US households who shopped for PFPs at Walmart increased from 71%
in 2000 to 82% in 2012 (p <0.01) (Supplemental Figure 3.1). Among households who shopped
at Walmart, the proportion of PFPs purchased at Walmart also increased substantially from 2000
to 2012 (Figure 3.1). The median Walmart-shopping household nearly doubled the proportion
of PFPs purchased from Walmart, from 10% in 2000 to 19% in 2012 (p <0.01). Increases in the
proportion of PFPs purchased from Walmart were even greater at the upper end of the
distribution. In particular, households in the 95th
percentile of Walmart shoppers increased the
proportion of PFPs purchased at Walmart from 56% in 2000 to 85% in 2012 (p <0.01).
Across all time periods, low- and middle-income households were less likely to be
Walmart non-shoppers than high-income households, and more likely to be top shoppers than
high-income households. All income levels showed a decrease in the percent of Walmart non-
20
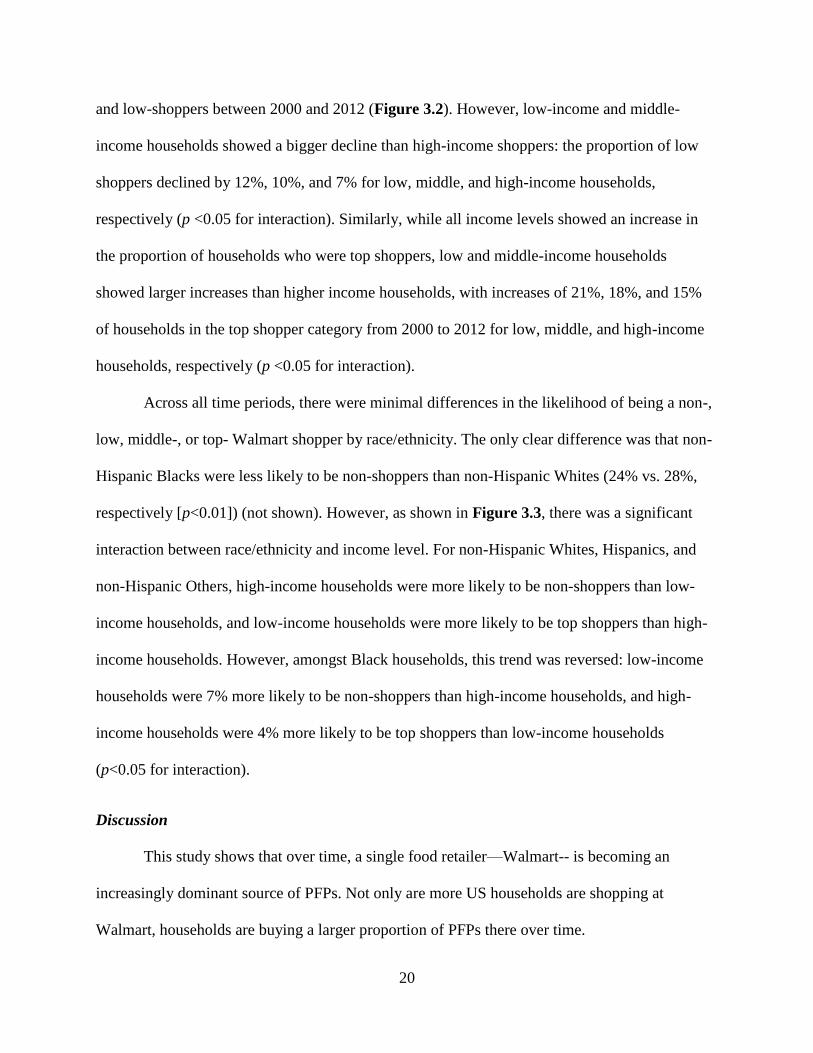
and low-shoppers between 2000 and 2012 (Figure 3.2). However, low-income and middle-
income households showed a bigger decline than high-income shoppers: the proportion of low
shoppers declined by 12%, 10%, and 7% for low, middle, and high-income households,
respectively (p <0.05 for interaction). Similarly, while all income levels showed an increase in
the proportion of households who were top shoppers, low and middle-income households
showed larger increases than higher income households, with increases of 21%, 18%, and 15%
of households in the top shopper category from 2000 to 2012 for low, middle, and high-income
households, respectively (p <0.05 for interaction).
Across all time periods, there were minimal differences in the likelihood of being a non-,
low, middle-, or top- Walmart shopper by race/ethnicity. The only clear difference was that non-
Hispanic Blacks were less likely to be non-shoppers than non-Hispanic Whites (24% vs. 28%,
respectively [p<0.01]) (not shown). However, as shown in Figure 3.3, there was a significant
interaction between race/ethnicity and income level. For non-Hispanic Whites, Hispanics, and
non-Hispanic Others, high-income households were more likely to be non-shoppers than low-
income households, and low-income households were more likely to be top shoppers than high-
income households. However, amongst Black households, this trend was reversed: low-income
households were 7% more likely to be non-shoppers than high-income households, and high-
income households were 4% more likely to be top shoppers than low-income households
(p<0.05 for interaction).
Discussion
This study shows that over time, a single food retailer—Walmart-- is becoming an
increasingly dominant source of PFPs. Not only are more US households are shopping at
Walmart, households are buying a larger proportion of PFPs there over time.

21
Walmart’s growing dominance as a source of PFPs has major implications for the
nutritional quality of US food purchases, as well as obesity prevention efforts. First, limited
evidence suggests that the food available in supercenters may be less healthful than grocery
stores or supermarkets (113), although this work was limited to a small geographic region. More
convincingly, using a large commercial dataset from 1998 to 2006, Volpe et al. found that
consumers purchased less produce and more processed food at supercenters (including Walmart)
relative to supermarkets (106). Secondly, because of its size, changes in Walmart’s product
assortment, reformulation, and price not only influence the healthfulness of what Walmart
customers buy, but what they purchase at other stores as well. For example, Walmart and other
supercenters typically offer lower prices (114), which drives down prices at competing stores,
including prices of produce, dairy, meat, and packaged goods (50, 115-117).
In fact, some researchers contend that these cost and time savings, particularly for
energy-dense, nutritionally-poor processed foods, contribute to excess energy intake and
subsequent obesity (118-122). Yet, evidence on the impact of Walmart and supercenters on
obesity has been mixed: while one ecological study found that the addition of one Walmart
supercenter per 100,000 residents was associated with an increase in the obesity rate of 1 to 2.4
percentage points (123), another ecological study found an inverse association between
supercenters per capita and county-level obesity prevalence (124).
Moreover, these studies have not considered the dramatic changes occurring within
Walmart stores in recent years, such as increasing sales of locally sourced and organic foods
(125, 126). In addition, starting in 2011, Walmart announced a national healthy foods initiative,
including introduction of a front-of-package labeling system, price reductions on healthier foods
including produce, and product reformulations to reduce saturated fat, added sugar, and sodium

22
(77). Currently, it is unclear whether these initiatives have resulted in improvements in the
nutritional quality of consumer purchases. For example, Walmart recently faced criticism for
promoting high- sugar, fat, and sodium foods and beverages in its advertisements targeted at
low-income customers (127). Future research should examine whether the nutritional quality of
PFPs at Walmart differs from similar food retailers, as well whether these purported shifts in
product assortment, formulation, and price have improved the nutritional quality of these
purchases. Regardless, the growing dominance of Walmart as a source of US PFPs suggests that
it and other major national retailers could be key players in strategies to improve diet and reduce
obesity, and should be considered as potentially pivotal agents in efforts to improve the quality
of the US food supply.
These nutritional implications are particularly important for low-income households who,
as we show, are not only more likely to shop at Walmart, but also more likely to purchase a
larger proportion of PFPs there. These results are consistent with previous work showing that
low-income consumers prefer supercenters, primarily because they prioritize consistently low
prices and a large product assortment (49, 55). In addition, Walmart is the recipient of 18% of
SNAP benefits (80). Despite recent cuts to SNAP benefits (128), in its most recent annual
meeting, Walmart’s CEO reported expectations that its market share will actually grow as a
result of SNAP cutbacks, as increasing cost-consciousness will drive low-income consumers to
buy even more at Walmart (129). Taken together, these results underscore the importance of
understanding how Walmart impacts the nutritional quality of purchases of low income
households, who may be especially sensitive to price cuts and promotions on both healthy and
unhealthy foods (65, 130).

23
In this study, we found that among non-Hispanic Whites, Hispanics, and non-Hispanic
others, low-income households were more likely to shop at Walmart than their higher-income
counterparts; however, this trend was reversed for Blacks. It was unclear why income level had a
different effect among Blacks compared to other race/ethnic groups. One possibility is that low-
income Blacks are more likely to live in areas with no Walmart, or less likely to have
transportation means required to access Walmart. Although we controlled for market as well as
whether or not there was a Walmart in the market, some markets cover a wide geographic area
and so even if there is a Walmart in that market, low-income Blacks may not be within a
reasonable distance to access it. Previous work has suggested that lower-income rural and inner-
city populations have lower access to supermarkets and supercenters than higher-income
populations or those living in suburbs (131-133). Although these studies did not consider
differences in access by race/ethnicity, if low-income Blacks are more likely to live in these
areas they may be less likely to have ready access to a Walmart than their higher-income
counterparts.
This trend towards increased purchases at Walmart is consistent with an overall
transformation in the way US households shop for food in recent decades, moving from
traditional, independent grocery stores and supermarkets towards increasing purchases at large
chain supermarkets (134-136) and supercenters (24, 134). Other societal shifts, including greater
cost consciousness (24) and increased perceptions of time scarcity (137), motivate households to
seek out supercenters, which typically maximize both cost and time savings by setting lower, less
variable prices (i.e. “everyday low pricing”) across a wide assortment of products (53, 55, 56),
enabling one-stop shopping (53, 54, 138). However, this shift does not appear to be the result of
the Great Recession: although surging food prices in 2007 (39-41) and the Great Recession

24
increased discount-seeking behavior and reduced overall food expenditures (24, 42), the present
results show that that the largest increases in Walmart PFP purchases began well before the 2007
economic downturn. Although we did not test the effects of the recession of the recession
explicitly, these increases in Walmart purchasing likely reflect the larger trend towards increased
supercenter purchasing that began in the early 2000s and continued during the economic
recovery (24, 139).
Limitations
This study has several important limitations. First, because this dataset included only
products with a barcode, we did not examine changes in purchasing at Walmart related to
unpackaged fresh produce, such as fruits and vegetables. Because shoppers at Walmart tend to
purchase a wide assortment of items, most households who purchase unpackaged fresh produce
at Walmart likely purchased other PFPs as well, and would have been included in our estimates
of Walmart shoppers. Similarly, we are unable to account for non-food-store changes, including
changes in restaurants and prepared food outlets and for cooked unpackaged foods sold at retail
food outlets, and how these interact with purchasing behavior at Walmart and other food stores.
However, given that US consumers consume about 70% of daily energy from food stores, and
this has remained fairly stable from 2000 to 2010 (2), it seems unlikely that changes in away-
from-home food purchases impacted our results.
Conclusion
This study shows that a single food retailer is a major source of the US diet: US
households, and especially low-income households, are increasingly likely to shop for PFPs at
Walmart and buy a larger proportion of PFPs there over time. As fewer retailers account for a
greater share of US food purchases, these individual retailers will have an important and

25
growing impact on the nutritional quality of what people buy and eat. In fact, the growing
dominance of Walmart and other major national retailers presents a major research and policy
opportunity: understanding how these retailers impact the nutrient profile of purchases could
provide valuable insight into strategies and potential avenues for improving the healthfulness of
US food purchases. In particular, more work is needed to understand the effects of Walmart’s
rapid expansion and whether Walmart’s recent healthy foods initiative substantially improved
the nutrient profile of foods purchased there, especially for low-income households, who shop
there most.
26
Tables and Figures
Table 3.1. Household characteristics of the Nielsen Homescan sample by whether or not a
household shopped at Walmart from 2000 to 2012a
(n=663,073)
Walmart non-
Shopper
%
Walmart
Shopper
%
pb
Household composition
Single adult
37%
23%
<0.001
Multiple adults, no children
<18y
38%
39%
0.015
Single adult, with children
<18 y
19%
29%
<0.001
Adults, with children <18
6%
8%
<0.001
Race/ethnicity
Non-Hispanic White
72%
75%
<0.0001
Hispanic
11%
10%
0.049
Non-Hispanic Black
11%
11%
0.012
Non-Hispanic Other
6%
4%
<0.001
Male household head
education
≤High school degree
21%
32%
<0.001
Some college
20%
21%
0.45
≥College degree
30%
18%
<0.001
No male head of household
29%
29%
0.273
Female household head
education
≤High school degree
23%
36%
<0.001
Some college
21%
27%
<0.001
≥College degree
24%
21%
<0.001
No female head of household
32%
16%
<0.001
Income levelc
Low
20%
26%
<0.001
Middle
32%
40%
<0.001
High 47%
34%
<0.001 a Column percents. Weighted to be nationally representative. A household was defined as "Walmart shopper" if it spent
>0$ on any consumer packaged food or beverage in a one-year period. b From proportions testing between Walmart shopping households vs. non-Walmart shopping households. Bonferroni-
corrected for multiple comparisons. c Income status is defined as low, <185% federal poverty level (FPL); middle, 185-400% FPL, and high, >400% FPL.

27
Figure 3.1. Percent of PFP food and beverages purchased from Walmart (g) by percentile
among Walmart customers, 2000-2012
10 11* 13* 17*
19* 20* 19*
24 28*
34*
42* 47* 47* 46*
56
67*
78* 81* 83* 84* 85*
0%
10%
20%
30%
40%
50%
60%
70%
80%
90%
2000 2002 2004 2006 2008 2010 2012
50th 75th 95th
* Within percentile, the proportion of packaged food purchases (PFPs) (g) purchased from Walmart in a given year is different than in 2000, p <0.01
28
Figure 3.2. Percent of households who were non-,low, middle, and top shoppers of PFPs at
Walmart by income status and year, 2000-2012
46 40 41
25 21* 20
35 37 37
28 27* 25*
15 18 17
27 28 29
5 5 5 20 23* 26*
0%
20%
40%
60%
80%
100%
120%
High Income Middle Income
Low Income High Income Middle Income
Low Income
2000 2012
Top Shopper Middle Shopper Low Shopper Non- Shopper
Shopper category defined as non-shopperss: purchased on average 0% of packaged food purchases(PFPs) from Walmart; low purchasers: average 3% of PFPs from Walmart; middle shoppers:18%; top shoppers: 65%. Income status is defined as low, <185% federal poverty level (FPL); middle, 185-400% FPL, and high, >400% FPL. * Change in the probability of being in Walmart shopper category between 2000 and 2012 is different for medium- or low- income householdsthan high income households, p <0.05

29
Figure 3.3. Percent of households who were non-shoppers or top-shoppers of PFPs at
Walmart by race/ethnicity and income, 2000-2012
31
25
30 28*
23
30* 32
27
15
21
14 16*
20
16* 15
19
0%
5%
10%
15%
20%
25%
30%
35%
High Income
Low Income High Income
Low Income High Income
Low Income High Income
Low Income
NH White Hispanic NH Black NH Other
Non-Shopper Top Shopper
Shopper category defined as non-shopper: purchased on average 0% of packaged food purchases (PFPs) (g) from Walmart top shopper: purchased on average 68% of PFPs from Walmart. Income status is defined as low, <185% federal poverty level (FPL); middle, 185-400% FPL, and high, >400% FPL. * Change in the predicted percent in Walmart shopper category between 2000 and 2012 is different for medium- or low- income households than high income households, p <0.01

30
Supplemental Figure 3.1. Percent of US households shopping at Walmart, 2000 to 2012
71
73*
76* 77* 77*
79* 79* 80*
81* 82* 81* 81* 82*
50%
55%
60%
65%
70%
75%
80%
85%
2000 2001 2002 2003 2004 2005 2006 2007 2008 2009 2010 2011 2012
*Percent of households shopping at Walmart was different than 2000, p<0.01

31
CHAPTER 4. THE NUTRIENT PROFILE OF PACKAGED FOOD PURCHASES
AT WALMART AND OTHER CHAIN RETAILERS IMPROVED FROM 2000 TO 2013.
Overview
As fewer retailers account for a larger share of US packaged food purchases (PFPs), it is
increasingly important to understand the impact of the food retailer on the nutrient profile of
PFPs. In particular, little is known about the nutrient profile of PFPs from Walmart, the US’s
largest food retailer, relative to other chain retailers (OCR). Our objective in this aim was to
examine shifts in the nutrient profile of Walmart and OCR PFPs from 2000 to 2013. We used a
national dataset of household PFPs from Nielsen Homescan linked to nutrition data (n=
164,315). Using fixed effects models and inverse probability weights to account for the
selectivity of shopping at Walmart, we examined changes in energy, total sugar, saturated fat,
and sodium density and shifts in percent volume from key food groups at Walmart and OCR
over time, and whether these shifts differed by income or race/ethnicity.
There were substantial declines in overall energy density (-74 kcal/100 g), sugar density
(-8 g/100g) and sodium density (-33 mg/100g) from PFPs at Walmart. These declines were
coupled with decrease in percent volume purchased from sweets (-11%), grain-based desserts (-
2%), and savory snacks (-3%), while percent volume from fruits and vegetables increased (3%
and 1%, respectively). PFPs from OCR had a more favorable nutrient profile than Walmart PFPs
in 2000, and demonstrated similar but smaller shifts in nutrient profile over time. We found only
32
minor differences in changes in nutrient profile by income, but among Walmart PFPs, we
found that disparities in nutrient profile by race/ethnicity shrank over time. The nutrient profile
of PFPs from Walmart has improved. While in 2000, Walmart PFPs were higher in energy,
sugar, sodium, and saturated fat density relative to OCR, in 2013 the nutrient profile of PFPs
purchased at Walmart was comparable to those purchased at OCR.

33
Introduction
Public health experts have increasingly identified the food retail sector (e.g.
supermarkets, supercenters, grocery stores, convenience stores) as unique allies in the fight
against obesity (6, 140) because they provide the majority of daily energy for US children and
adults (1, 2), and because of their pivotal positioning between food manufacturers and the public
(5, 6). As more food retailers account for an increasingly large share of US food purchases (3, 4),
even a single retailer can have a major effect on what people buy and eat.
In particular, Walmart has become an increasingly dominant source of packaged food
purchases (PFPs) in the US: nearly 80% of US households shopped for PFPs at Walmart in 2012.
Among those who shopped at Walmart, the share of PFPs purchased doubled from 10% to 20%
from 2000 to 2012 (141). Low income households in particular have become more likely to shop
there and buy more PFPs over time. Because of Walmart’s increasing importance as a source of
US PFPs, it could be a key leader in strategies to improve nutrition and prevent obesity.
However, little is known about whether foods and beverages purchased at Walmart are
nutritionally comparable to those purchased at other chain retailers, or if the nutrient profile of
Walmart-purchased foods has changed over time.
While one ecological study showed an additional Walmart supercenter per 100,000
residents was linked to an 2.4% increase in the obesity prevalence (123), little is known about
the actual nutrient profile of Walmart PFPs. First, the lack of food-retailer specific information
in most dietary surveys precludes examination of the link between the specific retail outlet and
food intake. Secondly, while a few studies have indicated that increased Walmart store or
supercenter densities are linked to poorer diet, these studies have significant limitations. For
example, Bonnano et al.’s 2012 ecological study found that an increase in Walmart store density

34
was associated with a decreased percentage of the adults consuming five servings of
fruits/vegetables per day (142). However, this study used state-level data on Walmart density and
diet intake, and was unable to evaluate the effect of Walmart on the nutritional quality of actual
household purchases or food intake. Volpe et al. used data on household PFPs, and found that a
1% increase in local market share of supercenters was associated with a 5-22% decrease in
healthful food purchases. However, this study, like the previous study, examined the effect of
store density on total purchases, rather than the nutritional profile of actual Walmart purchases
compared to comparable stores (106). In addition, while the latter study employed a number of
approaches for measuring purchase healthfulness, they were unable to directly link PFPs to
nutrition information, precluding examination of the actual nutritional profile of products.
Perhaps most importantly, no study has examined with whether Walmart purchases are
healthier or less healthy, or whether Walmart (or any food retailer in question) simply attracts a
different type of customer. Shopping choices are driven by a complex set of factors, which not
only determine where a customer shops, but what they buy (51-56). For example, less educated,
lower income, and African American individuals are more likely to shop at lower-priced
supercenters (49, 50). In addition, those who shop for many items at once prefer “everyday low
pricing” stores, which typically set lower, less variable prices across a wide range of products
(53, 55, 56). Selection bias arises if these preferences for shopping at a certain retailer type are
also associated with some underlying preference for less or more healthy foods. In this case, the
perceived link between Walmart and less-healthful purchases may simply be due to differences
in the customers it attracts compared to other food retailers, not due to some inherent attribute of
PFPs purchased there. One key question is whether, after accounting for this selectivity, low-
income and race/ethnic minority households have a worse nutrient profile of Walmart PFP

35
purchases, since these groups are more likely to shop at Walmart, and also are more likely to
nutritionally poorer diets (60-62). Understanding whether Walmart contributes to diet-related
disparities is especially salient for administrators of the Supplemental Nutrition Assistance
program (SNAP), considering Walmart is among the largest recipient of SNAP dollars spent
(80).
This selectivity of shopping at Walmart could also vary over time, as dramatic changes in
the Walmart food landscape over recent years could attract a more nutrition-conscious customer,
yet previous studies did not consider these changes. Walmart has announced major efforts to
increased sales of locally sourced and organic foods (125, 126), and in 2011 announced a
national healthy foods initiative (HFI), including the introduction of a front-of-package labeling
system, price reductions on healthier foods including produce, and product reformulations to
reduce saturated fat, added sugar, and sodium (77). One possibility is that more health-conscious
consumers might begin shopping at Walmart as a result of these initiatives. Thus, a second key
question is whether the nutrient profile of Walmart PFPs has actually changed over time, or
whether changes in nutrient profile simply reflect changes in the type of consumers who shops
there.
Finally, it is unknown whether changes in nutrient profile of PFPs stem from shifts in
purchasing behaviors by customers, or whether nutrients improved, even within the same
purchasing profile. For example: are consumers buying healthier products, or are they simply
buying the same products, which are becoming healthier over time? This has important policy
implications, since efforts to improve diet have focused on product reformulation (88, 109) as
well as changing consumer purchases through strategies such as front-of-package labeling (70,
84, 87). Understanding whether consumer purchasing shifts vs. product formulation are driving

36
improvements in nutrient profile could help policymakers and interventionists better target their
efforts.
The objectives of this study are to examine changes in the nutrient profile of Walmart
PFPs over time, including energy density (kcal/100g, total sugar density (g/100g), saturated fat
density (g/100g), and sodium density (mg/100g), relative to those purchased at other chain
retailers, and whether these changes were greater among SNAP-eligible and race/ethnic minority
households after correcting for selectivity. In addition, we will examine whether these changes
were driven by shifts in purchasing or reformulation by examining changes in percent volume of
food groups purchased, as well as changes in the nutrient profile within these food groups from
2000 to 2013.
Methods
This study uses data from Nielsen Homescan, a commercial dataset of household food
and beverage PFPs from 2000 to 2013 (107). PFPs include all food and beverages with a
barcode, including all consumer packaged goods and packaged fresh fruit and vegetables (i.e., a
bag of potatoes, which has a barcode) but excluding unpackaged meat and produce (i.e., a single
potato, which does not). Households are sampled from 76 metropolitan and non-metropolitan
markets. Households use handheld scanners to record information on each PFP, including date,
number of units, total weight, amount paid, and including location of purchase (143). Walmart
purchases included all PFPs from Walmart Supercenters and Neighborhood Markets, which both
include a full-line of groceries, although the latter is smaller in size and assortment (108).
Because the assortment of products likely differs by store type, to ensure comparability between
Walmart PFPs and other food store purchases, we include all PFPs from chain grocery stores and
supermarkets (≥10 locations), supercenters, and mass merchandisers, such as Super Target,
37
Kroger, Safeway, and others (collectively referred to hereafter as “other chain retailers” [OCR])
(362 different retailers), and exclude warehouse, drug, club, dollar, convenience stores, ethnic
stores, specialty stores, and independent grocers (<10 locations) (144).
Information on store purchases was linked at the barcode level to nutrition data from the
Nutrition Facts Panel (109). Food groups were based on the Nielsen Company, which groups
products into 624 modules according to the department in which they are found within the store
(for example, tortilla chips and pretzels represent two modules). We then aggregated modules
into 56 groups based on how products are consumed (for example, the tortilla chip and pretzel
modules are in a group, “Savory Snacks”) (Supplemental Table 4.1).
Nutrient Outcomes
Nutrient outcomes included energy density (kcal/100 g PFPs from that store type), total
sugar (g/100 g PFPs), saturated fat (g/100 g PFPs), and sodium (mg/100 g PFPs). To examine
shifts in purchasing, we examined shifts in percent volume purchased (% g) from 13 key food
groups from 2000-2013. Key food groups included those which represented top food groups
purchased by volume at both food stores (Supplemental Table 4. 2) or in some cases, food
groups that Walmart has publicly acknowledged to be product categories which have been
reformulated (i.e. processed meat, salad dressing).
Market-level Covariates:
Unemployment rate
To provide a proxy for the overall economic environment experienced by each
household, we used average quarterly market-level unemployment rates derived from the 2000-
2013 Bureau of Labor Statistics Local Area Unemployment Statistics (145).

38
Walmart store density
A key predictor of whether a household shops at a retailer or not is whether that retailer
exists within reasonable proximity to the household. To create an average market-level Walmart
density (Walmart supercenters per 100,000 people), we used data on dates of Walmart
Supercenter openings and conversions of Walmart discount stores to supercenters, linked by
FIPS codes to counties, from 2000-2005 (146, 147). We also used data on Walmart Supercenter
and Neighborhood Markets GPS coordinates , again linked by FIPS code, to derive Walmarts per
county from 2008-2013 (148). Using these annual county-level estimates of Walmart stores, the
number of Walmart food stores per county was interpolated for years 2006 and 2007. These
values were then linked by FIPs code to annual mid-year county population estimates from the
US Census Bureau to derive county-level Walmart density per 100,000 individuals (149). After
linking counties to Homescan markets, we then created an average annual Walmart density score
at for each of Homescan’s 76 markets in which respondents reside.
Average Food Prices
To control for price differences between Walmart and other food retailers, we included
two variables which are the weighted average of prices of products purchased (hereafter refered
to as average food price [AFP]) from 1) Walmart or 2) other chain retailers in each market in
each quarter.
Sample size
PFPs were aggregated at the quarter-household level. Households were included if they
shopped at Walmart or OCR (defined as having purchased >0 g PFPs at a given retailer in a
given quarter). Households were excluded from the sample if they purchased zero grams or zero
calories from any store types over an entire quarter, since the former represents a lack of food

39
purchases and the latter represents an implausible purchasing pattern, or for implausible nutrient
outcomes, including overall PFP energy density >900 kcal/100 g, sugar density >400 kcal/100g,
and saturated or total fat density >900 kcal/gram (n=66,377 observations or 2.5%). Households
were then excluded if they had less than 2 quarters of observations (n=2,516 or 0.1%) since
repeated observations are required for fixed effects models. The final analytic sample included
2,611,125 household-quarter observations from 164,315 unique households. Households have
various compositions, including single adults, adults living together, or adult(s) with children,
with 26% having children under age 18 in the house, and an overall mean age of 50 y (± 18).
Inverse probability weight
As previously mentioned, one concern in these models is selectivity, or the idea that
those who shop at Walmart may be somehow different than those who do not (141), and that this
selectivity could bias the association between purchases and nutritional quality. To address this
concern, we used inverse probability weighting (IPW) to account for the likelihood of being a
Walmart shopper vs. non-Walmart shopper (no vs. any purchases) in each quarter, conditional
upon covariates associated with shopping at Walmart (150-152). Weights were stabilized and
truncated at the upper and lower 0.3rd
percentile, with a mean of 0.96 ± 0.65 (Supplemental
Table 4.3). To test the robustness of estimates to this IPW, we conducted sensitivity analyses
without IPW, with the IPW truncated at the upper/lower 0.3rd
percentile, and IPW truncated at
the upper/lower 1st
percentile. Year coefficients remained consistent in terms of both direction
and magnitude, regardless of which IPW method was used or if no IPW was used.
(Supplemental Table 4.4).

40
Statistical Analysis
All statistical analyses were performed using Stata, version 13 (Stata Corporation,
College Station, Texas).
Covariates were included based on a directed acyclic graph approach (153-155),
including household race (non-Hispanic White, Hispanic, non-Hispanic Black, and non-Hispanic
Other) and whether or not the household was eligible SNAP benefits (household income ≤130%
federal poverty level). All models controlled for head of household education (≤ high school
degree, some college, ≥ college degree), household type (single adult, multiple adults with no
kids, adult(s) with kid(s)) and household composition (numbers of women and men aged 19-49
and ≥50y, and numbers of children aged 0-5y, 6-18y).
We used fixed effects models to separately model all nutrient outcomes at Walmart and OCR,
using Stata’s areg command for use with time-varying inverse probability weights. Fixed effects
models examine average within-household effects, effectively using each household as its own
control and thereby removing potential bias from any unobservable time-invariant household
characteristics that might influence both exposure and outcome (i.e. unmeasured confounding).
Fixed effects models can also be considered a selectivity correction, if the selection is through
fixed characteristics of the household or community, since these characteristics are differenced
out. For example, the fixed effects models help account for any selectivity associated with each
household’s decision regarding where to live, (i.e. if some households choose to live in markets
with more Walmart stores than others). Stata’s margins command was used to predict the mean
nutrient density or percent volume from food groups for each year for each retailer. We
examined contrasts in means within each retailer type across years, with significance achieved at
p<0.01, Bonferroni-adjusted for multiple comparisons. To examine whether SNAP-eligible or
41
race-ethnic households experienced larger changes over time, we used a Wald chunk test to
examine the interaction of income or race/ethnicity with year, with significance achieved at p=
0.10.
Results
Demographic characteristics
Demographic characteristics of the sample in 2000 and 2013 are presented in Table 4.1.
The sample remained predominantly non-Hispanic White, with at least some college education,
but more households were SNAP-eligible in 2013 relative to 2000. As expected, the average
Walmart density, unemployment rate, Walmart AFP, and OCR AFP all increased over time.
Overall shifts in nutrient profile
Figure 4.1 shows shifts in predicted nutrient density of all food and beverage PFPs from
2000 to 2013. For all nutrient densities, Walmart PFP showed a significant decline between 2000
and 2013, with particularly large declines in densities of energy, sugar, and sodium (p<0.01).
However, the average nutrient density of PFPs at Walmart was higher than at OCR in 2000; and
despite smaller declines in nutrient densities at OCRs during the same time period, remained
higher than OCR in 2013.
Shifts in food and beverage groups
Shifts in the percent volume purchased from key food and beverage groups are shown in
Table 4. 2. Percent volume of grain-based desserts, candy, and savory snacks declined at
Walmart from 2000 to 2013, while percent volume from fruits and vegetables increased
(p<0.01). Smaller shifts were observed in percent volume from food groups at OCR.
There were only small changes in percent volume from key beverage groups at both
Walmart and OCR. Among caloric beverages, there were small but significant declines in

42
percent volume of milk, 100% Juice, and SSBs from OCR. At Walmart, the only significant
declines were small decreases in the percent volume of 100% juice and diet beverages.
Nutrient Profile of Food Groups and Beverage Groups
Table 4.3 shows the means and changes in the nutrient density of key food and beverage
groups at Walmart and OCR.
Grain-based desserts showed major declines in energy density and sugar density at
Walmart, while nutrient density of grain-based desserts at OCRs showed smaller decreases over
time. Ready-to-eat breads, ready-to-eat breakfast, and candy all showed declines in energy
density at both Walmart and OCR, although declines at Walmart were larger. At OCR but not
Walmart, savory snacks and processed meats showed small increases in energy density, while
the energy density of fruit increased for both Walmart and OCR. Both 100% juice and SSBs
showed similar small declines in energy density at both retailers, while the energy density of diet
beverages increased slightly.
Examining changes in sodium density, there appeared to be significant declines in
sodium for ready-to-eat bread, ready-to-eat breakfast, processed meat, and salad dressing,
although these changes looked larger among OCR PFPs relative to Walmart PFPs. On the other
hand, the declines in sodium density for savory snacks and vegetables were larger among
Walmart PFPs relative to OCR PFPs.
Socio-economic differences
There were no major differences in changes in nutrient profile of Walmart or OCR PFPs
for higher income vs. SNAP-eligible households, with the exception that higher income
households showed bigger declines in the sodium density of OCR PFPs than did SNAP-eligible
households (-20 mg/100 g vs. -1 mg/100 g respectively, p=0.079) (Supplemental Table 4.5).

43
There were statistically significant, but small, differences in declines in nutrient density
of OCR PFPs by race/ethnicity, with the relative nutrient profile of purchases of each group
remaining somewhat stable over time (Table 4.4). However, among Walmart PFPs, disparities in
the nutrient profile of purchases by race/ethnicity shrank over time. For example, while Hispanic
and Non-Hispanic Others had the highest energy density and sodium density of Walmart PFPs
in 2000, but these showed the largest declines in energy density and sodium density over time
(p=0.054 and p=0.052 for interaction, respectively). The exception to this was non-Hispanic
Blacks, who had virtually identical sodium density as Whites in 2000, but showed smaller
declines in sodium density over time. In contrast, non-Hispanic Blacks also showed the largest
decline in sodium density of OCR PFPs (p<0.001 for interaction).
Discussion
This study shows that PFPs from Walmart, the US’s largest food retailer, showed major
declines in energy density, paralleled by a decline in sodium and total sugar density, and to a
lesser degree, saturated fat; these trends were accompanied by similar but smaller shifts in PFPs
from OCR. While we were unable to examine important distinctions in some of the nutrients (for
example, distinguishing added sugar from naturally occurring sugars, or saturated fat from dairy
vs. meat), declines in saturated fat and sodium densities represent a shift towards a more
healthful nutrient profile in accordance with the 2010 Dietary Guidelines, which suggested
limiting saturated fat to 10% of daily calories and cutting sodium intake(156). In addition, since
high energy density has been linked to excess energy intake and obesity through poor
physiological regulation (84, 86, 87, 90, 157), the observed declines in energy density could
potentially be protective against obesity, although further work is needed to link these declines to
food intake and health outcomes.

44
Moreover, while the healthfulness of food groups can be subjective, declines in groups
like grain-based desserts and sweets is promising, considering that considering that candy and
grain-based desserts are among the largest sources of added sugar in the US, and grain-based
desserts are the top source of solid fats (158). While the increases in fruit and vegetable intake
were relatively small, this may be due to the fact that we were only able to examined packaged
fruits and vegetables, and we would expect increases to be larger among unpackaged, loose
produce, which was the key target of Walmart’s efforts to cut costs and boost sales of locally
sourced and organic foods (125, 126). In fact, if households substituted packaged produce with
unpackaged produce as the availability and affordability of the latter increased, we might have
expected to see the percent volume from packaged produce go down. Yet, our results show that
these increases in packaged produce occurred despite a presumptive increase in unpackaged
produce purchased. Regardless, the end result was such that while the overall nutrient profile of
PFPs at Walmart was “less healthy” in 2000, it became healthier at a faster rate, and was similar
to OCR by 2013.
These shifts in overall nutrient profile indicate two separate but related mechanisms at
work: 1) consumers changed the types of products they were purchasing at Walmart, but not at
OCR, and 2) the nutrient profile of PFPs from Walmart were changing at a faster rate than OCR
PFPs, either due to introduction of new products or through product reformulation. In fact, we
would have expected to see declines in energy density of PFPs purchased at both store types,
considering the large decline in trillions of calories sold by food manufacturers as part of a
pledge to remove calories (109, 159, 160). At the same time, Walmart’s HFI included a pledge to
reformulate Walmart store-brand products, with goals to achieve elimination of trans fats, a 25%
reduction in sodium, and 10% reduction in added sugar in key PFP categories. Although the

45
store announced their initiative in 2011, the store website indicates that these changes may have
begun as early as 2008, possibly explaining some of the observed declines (77, 78). Other HFI
components, including the development of a front-of-package labeling system and strategic price
reductions on healthier items, could explain the observed shifts in purchasing behavior (11, 14-
21).
Our work shows that low income households do not buy disproportionately less healthy
foods at Walmart, which may provide reassurance to SNAP that spending benefits at Walmart
does not equate with poorer nutrient intakes. We also found evidence that disparities in the
nutrient profile of Walmart food purchases lessened over time for race/ethnic minorities,
especially for Hispanics and non-Hispanic Others, who tended to have a “worse” nutrient profile
than non-Hispanic Whites in 2000, but a more comparable profile in 2013. These results beg the
question as to whether Walmart’s HFI is responsible for the observed improvements in nutrient
profile, especially among vulnerable subpopulations. If so, this could indicate that national-scale
HFIs at major national retailers can be useful in reducing diet-related disparities in the US
population. However, more work is needed to fully understand the real impact of this HFI,
especially in light of conflicting evidence about Walmart’s marketing strategies. For example,
Walmart recently faced criticism for promoting high- sugar, fat, and sodium foods and beverages
in its advertisements targeted at low-income customers (127).
Still, it is interesting to note that despite the major changes in nutrient profile and
purchasing patterns at Walmart, there were only small changes at OCR during the same time
period. This could be because the overall nutrient profile at OCR was comparably “healthier” in
earlier years, leaving less room for change: Walmart PFPs have simply shifted to match foods
purchased at other food stores. In fact, these results are comparable to those of Volpe et al., who

46
found that increased supercenter density (i.e., Walmart density) was associated with less
healthful PFPs from 2000 to 2006, but this disparity in healthfulness of purchases between
supercenter and supermarket had mostly diminished by 2006 (106). On the other hand, we might
have expected to see a “compensation effect,” where consumers purchased less-healthy food
groups or higher energy dense products at OCR in response to purchasing healthier PFPs at
Walmart. Instead, we see that on average, the nutrient profile of PFPs from other OCRs remained
static, suggesting that changes in PFPs at one retailer may not carry over to other retailers where
a household shops.
Limitations
One concern is that these results could simply reflect a shift in how people shop at
Walmart: as the years progressed, and people purchased more food at Walmart, they purchased a
wider variety of foods, whereas in early years, they may have only purchased non-perishable
packaged foods, like candy or snacks. This would result in a decline in energy density of
Walmart PFPs, simply because of either a real or perceived shift in Walmart from discount store
to full-grocery supercenter, as more supercenters entered the market and offered a wider
assortment of products. In addition, we were unable account for unobservable shifts in dietary
preference, which could affect how much people buy at Walmart as well as what they buy there,
which limits our ability to establish what caused the observed changes in nutrient profile.
Finally, we did not include food purchases at other non-chain food retailers, like specialty
stores or ethnic food stores. However, considering that the per capita volume of PFPs purchased
from mass merchandisers and grocery chains remained stable from 2000 to 2013 (72% to 70%,
respectively) (144), it seems unlikely that observed changes would be due to differential
purchasing at other food retailers. Similarly, we were unable to account for changes in food

47
purchasing at restaurants, fast food, or other prepared-food outlets. However, we would expect
any changes in these sectors to affect purchases both at Walmart and at OCR. Considering first
that the percent of daily caloric intake from food stores remained stable from 2000 to 2010 (2),
and second, the nutrient profile of PFPs from OCR remained fairly stable, it seems that the shifts
in nutrient profile of Walmart PFPs are true changes in consumer behavior and the nutrient
profile of products, and not simply due to other shifts in away-from-home eating patterns.
However, this study does provide a useful methodology for examining and comparing the
impact of food retailers on the healthfulness of the US food supply. Through the use of time-
varying inverse probability weights and fixed effects models, we accounted for potential
selection bias of individuals who shop at Walmart stores on observed shifts in nutrient profile,
ensuring that the observed increases in healthfulness of PFPs was not simply due to Walmart
attracting more nutrition-minded consumers. Finally, although we could not statistically compare
Walmart PFPs to OCR PFPs, by modeling the predicted nutrient profile of PFPs at each store
type, we were able to observe shifts in nutrient profile of purchases at each store type instead of
simply examining the effect of store density on healthfulness of overall purchases, like most
previous studies. As food retailers are increasingly recognized as potential agents for improving
nutrition and reducing obesity, employing such methods will be essential to understanding how
various elements of the food environment (retail type, size, location) or strategies (reformulation,
price reduction, labeling) influence the nutritional quality of the US food supply, especially
among major national retailers (5, 6, 140).
Conclusion
From 2000 to 2013, PFPs from Walmart showed major decreases in energy density, sugar
density, and sodium density, and these shifts were larger than those observed at other chain

48
retailers during this time period. These changes were attributable to both shifts in food
purchasing (decreases in the percent volume purchased from sweets, GBDs, and savory snacks,
coupled with increases in fruits and vegetables), as well as shifts in nutrient density within food
group. More work is needed to understand whether these shifts were attributable to Walmart’s
Healthy Foods Initiative, and whether these shifts were greater among key subpopulations, who
face the highest barriers to achieving a healthful diet.

49
Tables and Figures
Table 4.1. Household characteristics of the Nielsen Homescan sample in 2000 and 2013a
(n=2,611,125)
2000 2013 pc
Household composition
Single adult, %b
25%
25%
0.070
Multiple adults, no children <18y, %
46%
52%
<0.001
Adults, with children <18,%
28%
22%
<0.001
Race/ethnicity
Non-Hispanic White,%
85%
81%
<0.001
Hispanic, %
5%
5%
0.243
Non-Hispanic Black, %
8%
9%
<0.001
Non-Hispanic Other, %
2%
4%
<0.001
Maximum Household Education
High school or less, %
23%
17%
<0.001
Some college,%
31%
29%
<0.001
≥College degree, %
46%
54%
<0.001
Incomed
SNAP-eligible, federal poverty level
≤130%
6%
10%
<0.001
>130%
94%
90%
<0.001
Walmarts/100,000 people, mean
(SD)
0.2
(0.3)
1.0
(0.6)
<0.001
Unemployment rate, mean (SD)
3.9
(0.9)
7.8
(1.6)
<0.001
Walmart Food Price Index, mean
(SD)
72.2
(12.3)
103.1
(4.4)
<0.001
OCR Price Index, mean (SD)
84.6
(8.4)
117.6
(6.5) <0.001 a University of North Carolina calculation based in part on data reported by Nielsen through its Homescan
Services for all food categories, Including beverages and alcohol for the 2000-2013 periods, for the U.S.
market. Copyright © 2014, The Nielsen Company. b Column percents.
c For categorical variables
, from proportions testing and for continuous variables, from t-tests, comparing
households in the sample in 2000 and 2013. d Supplemental Nutrition Assistance Program (SNAP) eligibility based on household income using percent
of annual federal poverty level

50
Figure 4.1: Predicted nutrient density of PFPs purchased from Walmart and other chain retailers (OCR) from 2000 to 2013
8
7*
16
8*
0
2
4
6
8
10
12
14
16
18
20
2000
2001
2002
2003
2004
2005
2006
2007
2008
2009
2010
2011
2012
2013
g/1
00g
c) Sugar Density
OCR Walmart
* Nutrient density in 2013 was different than 2000, within retailer, p<0.01
206 186*
231
198*
0
50
100
150
200
250
2000
2001
2002
2003
2004
2005
2006
2007
2008
2009
2010
2011
2012
2013
mg
/100g
b) Sodium density OCR Walmart
* Nutrient density in 2013 was different than 2000, within retailer, p<0.01
2 2
3
2*
0
2
4
6
8
10
12
14
16
18
20
2000
2001
2002
2003
2004
2005
2006
2007
2008
2009
2010
2011
2012
2013
g/1
00g
d) Saturated fat density
OCR Walmart
* Nutrient density in 2013 was different than 2000, within retailer, p<0.01
120
109*
198
125*
0
50
100
150
200
250
2000
2001
2002
2003
2004
2005
2006
2007
2008
2009
2010
2011
2012
2013
kcal/100g
a) Energy density OCR Walmart
* Nutrient density in 2013 was different than 2000, within retailer, p<0.01

51
Table 4.2 Percent volume from top food and beverage groups at Walmart and other chain retailers (OCR), 2000 to 2013
OCR
Walmart
2000
Mean %
(SE)
2013
Mean %
(SE)
Difference*
2000
Mean %
(SE)
2013
Mean %
(SE)
Difference*
GBD
1.9
2.0
0.1
5.3
3.0
-2.3***
(0.02)
(0.02)
(0.23)
(0.12)
Fruit
0.6
2.9
2.3***
-0.3
2.8
3.1***
(0.02)
(0.02)
(0.09)
(0.06)
Vegetables
3.7
3.5
-0.2***
2.0
2.8
0.8***
(0.03)
(0.03)
(0.1)
(0.06)
Savory Snacks
2.2
2.3
0.1
6.2
3.1
-3.1***
(0.02)
(0.02)
(0.25)
(0.12)
RTE Bread
2.4
2.6
0.2
1.9
2.8
0.9***
(0.02)
(0.02)
(0.13)
(0.08)
RTE Breakfast
1.7
1.9
0.2***
1.9
3.0
1.1***
(0.02)
(0.02)
(0.14)
(0.08)
Sweets
2
0.8
-1.2***
13.1
1.8
-11.3***
(0.03)
(0.03)
(0.36)
(0.18)
Processed Meat
1.3
1.9
0.6***
1.1
1.9
0.8***
(0.01)
(0.01)
(0.08)
(0.05)
Salad Dressing
0.4
0.6
0.2***
0.2
0.6
0.4***
(0.01)
(0.01)
(0.05)
(0.03)
Milk
10.7
9.2
-1.5***
6.4
6.2
-0.2
(0.05)
(0.05)
(0.19)
(0.11)
100% Juice
3.3
1.6
-1.7***
1.9
1.2
-0.7***
(0.03)
(0.02)
(0.1)
(0.06)
SSB
10.2
9.7
-0.5***
9.3
8.3
-1.0
(0.06)
(0.06)
(0.28)
(0.16)
Diet Bev
5.8
6.1
0.3
5.8
4.7
-1.1***
(0.05) (0.05)
(0.23) (0.13)
* P-value for comparison between predicted percent volume in 2013 compared to 2000, Bonferroni -corrected for multiple comparisons, *** p<0.001, ** p<0.01, * p<0.05

52
Table 4.3. Nutrient density of food groups at Walmart and other chain retailers (OCR) from 2000 to 2012
Energy Density (g/100 g)
Sugar Density (g/100g)
Saturated Fat Density (g/100 g)
Sodium Density (mg/100 g)
OCR
Walmart
OCR
Walmart
OCR
Walmart
OCR
Walmart
Grain-based
desserts
Mean (SE)
Mean (SE)
Mean (SE)
Mean (SE)
Mean (SE)
Mean (SE)
Mean (SE)
Mean (SE)
2000
430.7 (1.7)
447.4 (5.9)
30.0 (0.11)
31.9 (0.4)
6.4 (0.05)
6.8 (0.18)
383.4 (1.72)
376.8 (3.63)
2013
417.5 (1.66)
413.5 (1.98)
29.8 (0.09)
29.3 (0.16)
6.4 (0.04)
6.5 (0.06)
372.6 (3.5)
387.3 (2.17)
Difference
-13.2
-33.9
-0.2
-2.6
0.0
-0.3
-10.8
10.5
p-value
<0.001
<0.001
1.000
<0.001
1.000
1.000
0.117
0.525
Energy Density (g/100 g)
Sugar Density (g/100g)
Saturated Fat Density (g/100 g)
Sodium Density (mg/100 g)
OCR
Walmart
OCR
Walmart
OCR
Walmart
OCR
Walmart
Fruit
Mean (SE)
Mean (SE)
Mean (SE)
Mean (SE)
Mean (SE)
Mean (SE)
Mean (SE)
Mean (SE)
2000
20.4 (0.4)
20.0 (1.59)
4.9 (0.05)
6.1 (0.23)
-0.1 (0.01)
0.0 (0.04)
1.1 (0.09)
2.3 (0.37)
2013
45.8 (0.44)
44.4 (0.93)
6.4 (0.06)
5.9 (0.13)
0.3 (0.01)
0.2 (0.02)
5.0 (0.09)
4.2 (0.26)
Difference
25.4
24.4
1.5
-0.2
0.4
0.2
3.9
1.9
p-value
<0.001
<0.001
<0.001
1.000
<0.001
0.002
0.010
<0.001
Energy Density (g/100 g)
Sugar Density (g/100g)
Saturated Fat Density (g/100 g)
Sodium Density (mg/100 g)
OCR
Walmart
OCR
Walmart
OCR
Walmart
OCR
Walmart
Vegetables
Mean (SE)
Mean (SE)
Mean (SE)
Mean (SE)
Mean (SE)
Mean (SE)
Mean (SE)
Mean (SE)
2000
56.0 (0.15)
48.6 (0.64)
2.7 (0.01)
2.7 (0.04)
0.1 (0)
0.1 (0.01)
40.6 (0.4)
57.4 (1.8)
2013
45.8 (0.15)
44.3 (0.37)
2.2 (0.01)
1.9 (0.02)
0.1 (0)
0.1 (0)
39.5 (0.44)
37.0 (1.08)
Difference
-10.2
-4.3
-0.5
-0.8
0.0
0.0
-1.1
-20.4
p-value
<0.001
<0.001
<0.001
<0.001
<0.001
1.000
1.000
<0.001
Energy Density (g/100 g)
Sugar Density (g/100g)
Saturated Fat Density (g/100 g)
Sodium Density (mg/100 g)
OCR
Walmart
OCR
Walmart
OCR
Walmart
OCR
Walmart
Savory snacks
Mean (SE)
Mean (SE)
Mean (SE)
Mean (SE)
Mean (SE)
Mean (SE)
Mean (SE)
Mean (SE)
2000
458.9 (0.45)
462.1 (1.62)
3.6 (0.03)
5.2 (0.15)
5.1 (0.01)
5.3 (0.06)
812.9 (1.54)
858.0 (6.11)
2013
469.9 (0.44)
464.4 (1.01)
4.5 (0.03)
5.6 (0.08)
4.4 (0.01)
4.7 (0.03)
669.6 (1.41)
680.5 (3.51)
Difference
11.0
2.3
0.9
0.4
-0.7
-0.6
-143.3
-177.5
p-value
<0.001
1.000
<0.001
0.888
<0.001
<0.001
<0.001
<0.001

53
Energy Density (g/100 g) Sugar Density (g/100g) Saturated Fat Density (g/100 g) Sodium Density (mg/100 g)
OCR
Walmart
OCR
Walmart
OCR
Walmart
OCR
Walmart
Ready-to-eat
bread
Mean (SE)
Mean (SE)
Mean (SE)
Mean (SE)
Mean (SE)
Mean (SE)
Mean (SE)
Mean (SE)
2000
262.9 (0.39)
263.6 (0.93)
5.7 (0.02)
5.7 (0.07)
0.6 (0.01)
1.1 (0.04)
529.0 (0.74)
517.6 (2.16)
2013
264.4 (0.41)
260.7 (0.52)
6.4 (0.02)
6.3 (0.05)
0.3 (0.01)
0.1 (0.02)
477.6 (0.77)
478.7 (1.18)
Difference
1.5
-2.9
0.7
0.6
-0.3
-1.0
-51.4
-38.9
p-value
0.553
0.396
<0.001
<0.001
<0.001
<0.001
<0.001
<0.001
Energy Density (g/100 g)
Sugar Density (g/100g)
Saturated Fat Density (g/100 g)
Sodium Density (mg/100 g)
OCR
Walmart
OCR
Walmart
OCR
Walmart
OCR
Walmart
Ready-to-eat
breakfast
Mean (SE)
Mean (SE)
Mean (SE)
Mean (SE)
Mean (SE)
Mean (SE)
Mean (SE)
Mean (SE)
2000
342.0 (0.35)
346.0 (1.32)
21.4 (0.06)
21.9 (0.25)
1.3 (0.01)
1.4 (0.04)
508.8 (0.98)
502.2 (3.78)
2013
333.9 (0.36)
332.4 (0.8)
19.9 (0.06)
20.5 (0.14)
1.5 (0.01)
1.8 (0.02)
429.3 (0.92)
432.3 (2.08)
Difference
-8.1
-13.6
-1.5
-1.4
0.2
0.4
-79.5
-69.9
p-value
<0.001
<0.001
<0.001
<0.002
<0.001
<0.001
<0.001
<0.001
Energy Density (g/100 g)
Sugar Density (g/100g)
Saturated Fat Density (g/100 g)
Sodium Density (mg/100 g)
OCR
Walmart
OCR
Walmart
OCR
Walmart
OCR
Walmart
Candy
Mean (SE)
Mean (SE)
Mean (SE)
Mean (SE)
Mean (SE)
Mean (SE)
Mean (SE)
Mean (SE)
2000
463.7 (9.43)
464.3 (7.75)
63.8 (2.22)
68.8 (1.53)
7.7 (0.06)
6.8 (0.15)
120.7 (1.38)
111.8 (2.58)
2013
423.8 (5.7)
416.1 (4.89)
49.6 (1.28)
47.8 (0.96)
8.4 (0.07)
8.2 (0.1)
105.6 (1.24)
110.7 (1.17)
Difference
-39.9
-48.2
-14.2
-21.0
0.7
1.4
-15.1
-1.1
p-value
0.095
0.001
0.001
<0.001
<0.001
<0.001
<0.001
1.000
Energy Density (g/100 g)
Sugar Density (g/100g)
Saturated Fat Density (g/100 g)
Sodium Density (mg/100 g)
OCR
Walmart
OCR
Walmart
OCR
Walmart
OCR
Walmart
Processed meat
Mean (SE)
Mean (SE)
Mean (SE)
Mean (SE)
Mean (SE)
Mean (SE)
Mean (SE)
Mean (SE)
2000
229.2 (0.44)
227.7 (1.71)
1.5 (0.01)
1.3 (0.03)
6.8 (0.03)
6.7 (0.08)
906.3 (1.59)
919.4 (6.52)
2013
231.8 (0.42)
229.4 (0.97)
1.6 (0.01)
1.6 (0.02)
6.3 (0.03)
6.1 (0.04)
877.7 (1.51)
908.0 (3.57)
Difference
2.6
1.7
0.1
0.3
-0.5
-0.6
-28.6
-11.4
p-value
0.009
1.000
<0.001
<0.001
<0.001
<0.001
<0.001
1.000

54
Energy Density (g/100 g)
Sugar Density (g/100g)
Saturated Fat Density (g/100 g)
Sodium Density (mg/100 g)
OCR
Walmart
OCR
Walmart
OCR
Walmart
OCR
Walmart
Fresh milk
Mean (SE)
Mean (SE)
Mean (SE)
Mean (SE)
Mean (SE)
Mean (SE)
Mean (SE)
Mean (SE)
2000
50.3 (0.03)
51.9 (0.13)
4.9 (0)
5.0 (0.01)
1.0 (0)
1.1 (0.01)
53.7 (0.05)
54.4 (0.18)
2013
50.7 (0.03)
51.2 (0.07)
5.0 (0)
4.9 (0)
1.0 (0)
1.1 (0.01)
54.9 (0.05)
54.9 (0.12)
Difference
0.4
-0.7
0.1
-0.1
0.0
0.0
1.2
0.5
p-value
0.362
1.000
0.489
1.000
<0.001
<0.001
<0.001
0.1
Energy Density (g/100 g)
Sugar Density (g/100g)
Saturated Fat Density (g/100 g)
Sodium Density (mg/100 g)
OCR
Walmart
OCR
Walmart
OCR
Walmart
OCR
Walmart
Salad Dressing
Mean (SE)
Mean (SE)
Mean (SE)
Mean (SE)
Mean (SE)
Mean (SE)
Mean (SE)
Mean (SE)
2000
305.9 (0.92)
297.7 (4.17)
9.9 (0.05)
10.3 (0.23)
3.5 (0.02)
3.3 (0.09)
984.4 (1.97)
964.8 (10.36)
2013
309.6 (0.92)
295.9 (2.37)
10.1 (0.05)
9.8 (0.13)
4.1 (0.02)
3.9 (0.05)
915.6 (2.27)
923.6 (6.65)
Difference
3.7
-1.8
0.2
-0.5
0.6
0.6
-68.8
-41.2
p-value
0.362
1.000
0.489
1.000
<0.001
<0.001
<0.001
<0.001
Energy Density (g/100 g)
Sugar Density (g/100g)
Saturated Fat Density (g/100 g)
Sodium Density (mg/100 g)
OCR
Walmart
OCR
Walmart
OCR
Walmart
OCR
Walmart
100% Juice
Mean (SE)
Mean (SE)
Mean (SE)
Mean (SE)
Mean (SE)
Mean (SE)
Mean (SE)
Mean (SE)
2000
48.2 (0.09)
49.2 (0.43)
10.1 (0.02)
10.4 (0.09)
0.0 (0.01)
0.0 (0.03)
3.5 (0.06)
4.7 (0.27)
2013
47.2 (0.12)
46.6 (0.32)
9.2 (0.02)
9.0 (0.06)
0.2 (0.01)
0.2 (0.02)
3.6 (0.07)
3.3 (0.15)
Difference
-1.0
-2.6
-0.9
-1.4
0.2
0.2
0.1
-1.4
p-value
<0.001
0.002
<0.001
<0.001
<0.001
0.001
1.000
0.002
Energy Density (g/100 g)
Sugar Density (g/100g)
Saturated Fat Density (g/100 g)
Sodium Density (mg/100 g)
OCR
Walmart
OCR
Walmart
OCR
Walmart
OCR
Walmart
Sugar-
sweetened
beverages
Mean (SE)
Mean (SE)
Mean (SE)
Mean (SE)
Mean (SE)
Mean (SE)
Mean (SE)
Mean (SE)
2000
48.8 (0.14)
47.9 (0.38)
12.3 (0.04)
12 (0.1)
0.1 (0)
0.1 (0.01)
14.3 (0.1)
14.6 (0.3)
2013
42.3 (0.13)
42.6 (0.25)
10.5 (0.03)
10.8 (0.06)
0.1 (0)
0 (0.01)
15.2 (0.1)
17.2 (0.19)
Difference
-6.5
-5.3
-1.8
-1.2
0.0
-0.1
0.9
2.6
p-value
<0.001
<0.001
<0.001
<0.001
<0.001
0.226
<0.001
<0.001

55
Energy Density (g/100 g)
Sugar Density (g/100g)
Saturated Fat Density (g/100 g)
Sodium Density (mg/100 g)
OCR
Walmart
OCR
Walmart
OCR
Walmart
OCR
Walmart
Diet beverages
Mean (SE)
Mean (SE)
Mean (SE)
Mean (SE)
Mean (SE)
Mean (SE)
Mean (SE)
Mean (SE)
2000
0.5 (0.04)
0.6 (0.12)
0.1 (0.01)
0.1 (0.03)
0 (0)
0 (0)
14.5 (0.16)
9.8 (0.34)
2013
2.4 (0.05)
1.7 (0.1)
0.5 (0.01)
0.4 (0.02)
0 (0)
0 (0)
11.3 (0.12)
11.1 (0.2)
Difference
1.9
1.1
0.4
0.3
0.0
0.0
-3.2
1.3
p-value <0.001 <0.001 <0.001 <0.001 <0.001 1.000 <0.001 0.137
P-value for the difference between 2013 and 2000, Bonferroni-corrected for multiple comparisons

56
Table 4.4 Nutrient profile of OCR and Walmart PFPs by Race/ethnicity
OCR PFPs
Energy Density (kcal/100 g)
NH White
Hispanic
NH Black
NH Other
Mean (95% CI)
Mean (95% CI)
Mean (95% CI)
Mean (95% CI) p
a 2000
119 (119,120)
115 (113,118)
128 (126,131)
116 (113,119) <0.001
2006
116 (116,117)
115 (114,116)
124 (122,125)
118 (116,119) 2013
108 (107,108)
109 (106,111)
115 (113,117)
116 (114,119)
Differenceb
-11
-6
-13
0
Sugar Density (g/100 g)
NH White
Hispanic
NH Black
NH Other
Mean (95% CI)
Mean (95% CI)
Mean (95% CI)
Mean (95% CI) p 2000
8.3 (8.3,8.4)
8.0 (8,9)
9.4 (9.2,9.6)
8.5 (8.2,8.8) <0.001
2006
8.0 (7.6,7.6)
8.0 (8,8)
8.0 (8.2,8.4)
8.0 (7.6,7.9) 2013
7.0 (6.6,6.7)
7.0 (6,7)
8.0 (7.5,7.8)
7.0 (6.7,7.1)
Difference
-1.3
-1.0
-1.4
-1.5
Saturated Fat Density (g/100 g)
NH White
Hispanic
NH Black
NH Other
Mean (95% CI)
(95%
CI) (95% CI)
Mean (95% CI)
Mean (95% CI) p 2000
1.6 (1.6,1.6)
1.4 (1.4,1.5)
1.5 (1.5,1.6)
1.5 (1.4,1.5) 0.005
2006
1.6 (1.6,1.6)
1.5 (1.4,1.5)
1.6 (1.5,1.6)
1.5 (1.5,1.6) 2013
1.5 (1.5,1.6)
1.4 (1.4,1.5)
1.6 (1.5,1.6)
1.6 (1.5,1.7)
Difference
-0.1
0.0
0.1
0.1
Sodium Density (mg/100 g)

57
NH White
Hispanic
NH Black
NH Other
Mean (95% CI)
Mean (95% CI)
Mean (95% CI)
Mean (95% CI) p 2000
204 (202,205)
202 (196,207)
232 (226,237)
203 (195,211) <0.001
2006
198 (198,199)
199 (196,202)
220 (218,223)
205 (201,209) 2013
184 (182,185)
184 (179,190)
201 (197,206)
191 (185,197)
Difference
-20
-18
-31
-12
Walmart PFPs
Energy Density (kcal/100 g)
NH White
Hispanic
NH Black
NH Other
Mean (95% CI)
Mean (95% CI)
Mean (95% CI)
Mean (95% CI) p 2000
199 (194,203)
210 (191,230)
178 (162,194)
238 (194,281) <0.054
2006
159 (157,160)
155 (149,161)
153 (148,159)
173 (163,184) 2013
123 (121,126)
127 (117,137)
135 (128,143)
127 (114,139)
Difference
-76
-83
-43
-111
Sugar Density (g/100 g)
NH White
Hispanic
NH Black
NH Other
Mean (95% CI)
Mean (95% CI)
Mean (95% CI)
Mean (95% CI) p 2000
15.6 (15.1,16)
18.0 (14,22)
14.0 (12.3,15.7)
18.1 (13.5,22.7) 0.445
2006
11.0 (10.9,11.2)
11.0 (10,12)
11.0 (10.2,11.3)
11.0 (10.3,12.5) 2013
8.0 (7.4,7.9)
7.0 (6,8)
9.0 (8.2,9.7)
8.0 (6.8,9.3)
Difference
-7.6
-11.0
-5.0
-10.1
Saturated Fat Density (g/100 g)
NH White
Hispanic
NH Black
NH Other
Mean (95% CI)
Mean (95% CI)
Mean (95% CI)
Mean (95% CI) p 2000
2.9 (2.8,3)
2.5 (2,3)
2.5 (2.1,2.9)
4.1 (3.2,5.1) 0.127
2006
2.3 (2.3,2.3)
1.9 (1.8,2.1)
2.0 (1.9,2.1)
2.3 (2.1,2.6) 2013
1.6 (1.5,1.7)
1.9 (1.6,2.2)
1.6 (1.4,1.8)
1.5 (1.2,1.8)
Difference
-1.3
-0.6
-0.9
-2.6
Sodium Density (mg/100 g)
NH White
Hispanic
NH Black
NH Other
Mean (95% CI)
Mean (95% CI)
Mean (95% CI)
Mean (95% CI) p 2000
229 (223,235)
256 (227,286)
230 (207,254)
277 (223,331) 0.052
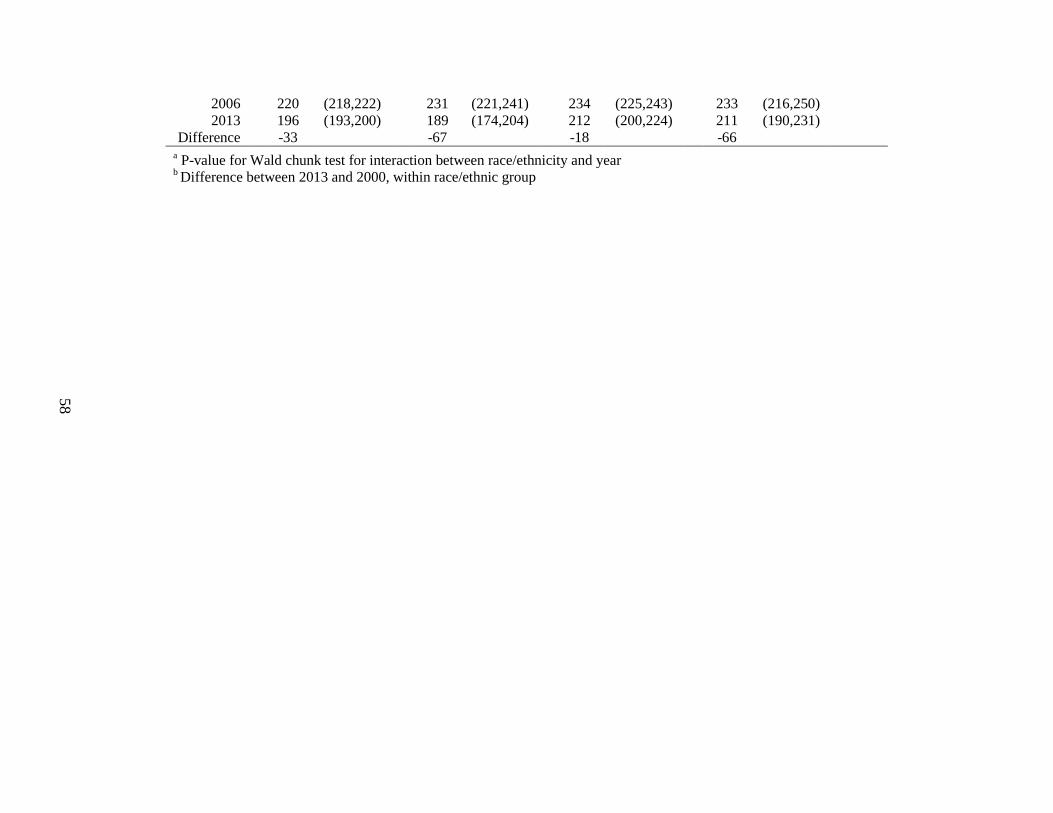
58
2006
220 (218,222)
231 (221,241)
234 (225,243)
233 (216,250) 2013
196 (193,200)
189 (174,204)
212 (200,224)
211 (190,231)
Difference
-33
-67
-18
-66 a
P-value for Wald chunk test for interaction between race/ethnicity and year b Difference between 2013 and 2000, within race/ethnic group

59
Supplemental Table 4.1. Food and Beverage Groupings, with Examples
Food Group Example of modules
SSBs Energy drinks, sports drinks, soda, fruit drinks
Fresh plain milk Refrigerated milk
Coffee (grounds, beans, RTD) Ground and whole bean coffee
Diet beverage Carbonated soft drinks, <20 cal/100g
Tea (bags, loose, RTD) Herbal tea, tea bags
Water and ice Bottled water, bagged ice
Candy Hard candy, chocolate, marshmallows
Savory Snacks Chips, pretzels, frozen hors d'oevres
GBD Frozen cookie dough, ready-to-eat cookies,
RTE breads Fresh bagels, fresh bread, frozen bread
RTE Breakfast Ready-to-eat cereal, granola
Vegetables, fresh or frozen Fresh carrots, frozen broccoli
Dairy-based dessert Ice cream, sherbert, frozen novelties
Shelf-stable soups & stews Ramen noodles, canned soup, soup mixes
Condiments & sauces Ketchup, barbecue sauce, cocktail sauce
Alcohol Wine, liquor, beer, malt beverage
Frozen entrees Frozen dinners
Processed Meat Canned corned beef, lunch meat, bacon
100% Juice Drinks containing 100% juice
Fats and oils Butter, olive oil, margarines and spreads
Cheese American Cheddar cheese, cream cheese, mozzarella
Fruit, fresh & frozen Refrigerated fruit salad, fresh apples, frozen fruits
Sweeteners Granulated sugar, molasses
Vegetables, canned or dried Canned tomatoes, canned artichokes
Yogurt Refrigerated yogurt
Eggs Fresh eggs
Pasta & Rice Boxed spaghetti, instant rice, pasta macaroni
Desserts, prepare-at-home Brownie mix, cake mix, muffin mix
RTE, prepared dishes Refrigerated entrees, refrigerated chili
Potatoes and corn Dehydrated mashed potatoes, canned corn, canned yams
Beef/pork Frozen ground beef, frozen veal
Shelf-stable creamers, evaporated or condensed milks Powdered creamer, liquid creamer
Beans and legumes Garbanzo beans, lima beans, pinto beans
Refrigerated sweetened dairy drinks Refrigerated shakes, eggnog
Nut and fruit spreads Peanut butter, honey, jams, jelly
Canned mixed dishes Canned lasagna, canned chow mein
Nuts and seeds Nuts, unshelled
Flours All-purpose flour, white wheat flour
Frozen/refrigerated dairy-based toppings/condiments Sour cream, whipping cream
Salad dressing Refrigerated salad dressing, dressing mixes
Fruit, canned Canned peaches
Frozen pizza Frozen pizza
Seafood Frozen breaded shrimp, frozen un-breaded fish
Cereals (requires cooking) Wheat germ, hominy grits
Other fruit (dried, etc) Dried cranberries, raisins
Sweets, misc Chocolate syrup
Shelf-stable milks, milk substitutes and milk-based
powders
Powdered milk

60
Supplemental Table 4.2 Percent volume of PFP groups purchased at other chain retailers
(OCR) and Walmart for top 30 food groups, pooled from 2000-2013
OCR
Walmart
Rank
% volume
Food Group
% Volume Food Group
1
10.1
Sugar-sweetened beverages
9.4
Sugar-sweetened beverages
2
9.7
Fresh plain milk
6.9
Fresh plain milk
3
7.2
Coffee (grounds, beans, RTD)
6.7
Coffee (grounds, beans, RTD)
4
6.5
Diet soda and other diet beverages
5.4
Diet soda and other diet beverages
5
5.1
Tea (bags, loose, RTD)
5.2
Tea (bags, loose, RTD)
6
4.3
Water and ice
4.7
Water and ice
7
3.4
Vegetables, fresh or frozen
4.5
Candy & gum
8
3.3
Dairy-based dessert
3.3
Savory Snacks
9
2.6
Alcohol
3.2
GBD
10
2.5
RTE breads
3.0
Beverage powder and concentrates
11
2.5
Shelf-stable soups & stews
2.5
RTE breads
12
2.2
Savory Snacks
2.5
RTE Breakfast
13
2.2
100% Juice
2.4
Vegetables, fresh or frozen
14
2.2
Condiments & sauces
2.3
Dairy-based dessert
15
2.0
Beverage powder and concentrates
2.3
Shelf-stable soups & stews
16
1.9
GBD
2.1
Condiments & sauces
17
1.8
RTE Breakfast
2.0
Alcohol
18
1.7
Frozen entrees
1.9
Frozen entrees
19
1.6
Fruit, fresh & frozen
1.7
Processed Meat
20
1.6
Processed Meat
1.5
100% Juice
21
1.5
Candy & gum
1.4
Cheese
22
1.4
Cheese
1.4
Fats and oils
23
1.3
Vegetables, canned or dried
1.3
Fruit, fresh & frozen
24
1.2
Fats and oils
1.3
Sweeteners
25
1.1
Yogurt
1.1
Yogurt
26
1.1
Pasta & Rice
1.1
Vegetables, canned or dried
27
1.1
Sweeteners
1.0
Eggs
28
1.1
Eggs
0.9
Pasta & Rice
29
0.9
Potatoes and corn
0.8
Desserts, prepare-at-home
30 0.9 RTE, prepared dishes 0.8 RTE, prepared dishes

61
Supplemental Table 4.3. Creation of inverse probability weight
To deal with selectivity, every model includes a time-varying inverse probability weight
for being a Walmart customer (i.e., being in the sample) in a given quarter. We use logistic
regression to predict the probability of being a Walmart customer in a given quarter, using
market-level and household-level covariates which our previous work has shown to be associated
with shopping at Walmart(141).
P(Walmart customer)hq= Household sizeh + Household typeh + Race/ethnicityh + FPLhq
+ Walmart AFPmq + Foodstore AFPmq + + Walmart Densitymy + Unemployment Ratemq
Where h is household, q is quarter, and m is market.
FPL=Indicator variables for federal poverty level decile
Household size= indicator variables for number of individuals in household
Household type= indicator variable for household composition: single adult, multiple adult(s),
adult(s) with child(ren)
AFP= weighted average price of foods and beverages purchased
Walmart density= average annual Walmarts per 100,000 individuals
The weights are then stabilized (150, 151) by including in the numerator the overall probability
of being a Walmart customer in a given quarter:
. P(Walmart customerq) .
P(Walmart customer)hq= Household sizeh + Household typeh + Raceh + FPLhq + Walmart
AFPmq + Foodstore AFPmq + + Walmart Densitymy + Unemployment Ratemq

62
These stabilized were then truncated at the upper and lower 0.3rd
percentile to reduce the
influence of large weights. Large weights occur when individuals who had very high likelihoods
of being a Walmart customer, were not; or when households who had very low likelihoods of
being a Walmart customer, were(152). In this sample, these large weights occurred primarily
because the Walmart density variable was a very strong predictor of whether someone shopped
at Walmart or not, especially for markets with no Walmart. Individuals who shopped at Walmart
despite the presence of no Walmart in their market (or vice versa) tended to have more extreme
weights. Progressively truncating these weights at increases precision by eliminating the
influence of large weight (151). Results appeared robust to the use of various types of inverse
probability weights (Supplemental Tables 3 and 4).
Supplement Table 4.3. Descriptive statistics on inverse probability weights
Walmart
Mean
SD
Minimum
Maximum
IPW 4.86
13.50
1.02
744.36
Stabilized IPW 1.00
0.89
0.24
224.72
Stabilized IPW, truncated at
0.3rd
and 99.7th
percentiles
0.99
0.65
0.36
6.11
OCR
IPW 1.48
0.04
1.00
1.48
Stabilized IPW 1.00
0.2
0.08
140.6
Stabilized IPW, truncated at
0.3rd
and 99.7th
percentiles
0.99
0.11
0.28
1.96
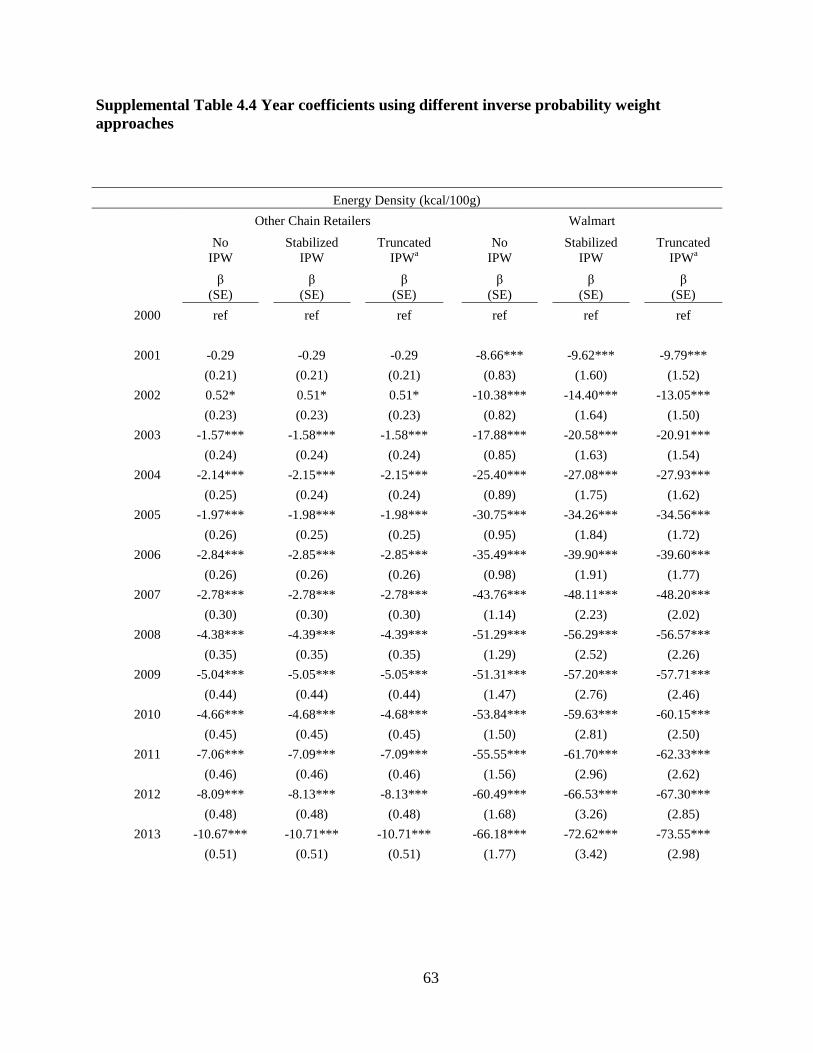
63
Supplemental Table 4.4 Year coefficients using different inverse probability weight
approaches
Energy Density (kcal/100g)
Other Chain Retailers
Walmart
No
IPW
Stabilized
IPW
Truncated
IPWa
No
IPW
Stabilized
IPW
Truncated
IPWa
β
(SE)
β
(SE)
β
(SE)
β
(SE)
β
(SE)
β
(SE)
2000
ref
ref
ref
ref
ref
ref
2001
-0.29
-0.29
-0.29
-8.66***
-9.62***
-9.79***
(0.21)
(0.21)
(0.21)
(0.83)
(1.60)
(1.52)
2002
0.52*
0.51*
0.51*
-10.38***
-14.40***
-13.05***
(0.23)
(0.23)
(0.23)
(0.82)
(1.64)
(1.50)
2003
-1.57***
-1.58***
-1.58***
-17.88***
-20.58***
-20.91***
(0.24)
(0.24)
(0.24)
(0.85)
(1.63)
(1.54)
2004
-2.14***
-2.15***
-2.15***
-25.40***
-27.08***
-27.93***
(0.25)
(0.24)
(0.24)
(0.89)
(1.75)
(1.62)
2005
-1.97***
-1.98***
-1.98***
-30.75***
-34.26***
-34.56***
(0.26)
(0.25)
(0.25)
(0.95)
(1.84)
(1.72)
2006
-2.84***
-2.85***
-2.85***
-35.49***
-39.90***
-39.60***
(0.26)
(0.26)
(0.26)
(0.98)
(1.91)
(1.77)
2007
-2.78***
-2.78***
-2.78***
-43.76***
-48.11***
-48.20***
(0.30)
(0.30)
(0.30)
(1.14)
(2.23)
(2.02)
2008
-4.38***
-4.39***
-4.39***
-51.29***
-56.29***
-56.57***
(0.35)
(0.35)
(0.35)
(1.29)
(2.52)
(2.26)
2009
-5.04***
-5.05***
-5.05***
-51.31***
-57.20***
-57.71***
(0.44)
(0.44)
(0.44)
(1.47)
(2.76)
(2.46)
2010
-4.66***
-4.68***
-4.68***
-53.84***
-59.63***
-60.15***
(0.45)
(0.45)
(0.45)
(1.50)
(2.81)
(2.50)
2011
-7.06***
-7.09***
-7.09***
-55.55***
-61.70***
-62.33***
(0.46)
(0.46)
(0.46)
(1.56)
(2.96)
(2.62)
2012
-8.09***
-8.13***
-8.13***
-60.49***
-66.53***
-67.30***
(0.48)
(0.48)
(0.48)
(1.68)
(3.26)
(2.85)
2013
-10.67***
-10.71***
-10.71***
-66.18***
-72.62***
-73.55***
(0.51)
(0.51)
(0.51)
(1.77)
(3.42)
(2.98)

64
Sugar (g/100 g)
Other Chain Retailers Walmart
No
IPW
Stabilized
IPW
Truncated
IPW
No
IPW
Stabilized
IPW
Truncated
IPW
β
(SE)
β
(SE)
β
(SE)
β
(SE)
β
(SE)
β
(SE)
2000
ref
ref
ref
ref
ref
ref
2001
-0.07***
-0.07***
-0.07***
-1.08***
-1.27***
-1.27***
(0.02)
(0.02)
(0.02)
(0.09)
(0.18)
(0.17)
2002
0.00
0.00
0.00
-1.45***
-1.90***
-1.79***
(0.02)
(0.02)
(0.02)
(0.08)
(0.18)
(0.17)
2003
-0.27***
-0.27***
-0.27***
-2.31***
-2.71***
-2.79***
(0.02)
(0.02)
(0.02)
(0.09)
(0.19)
(0.17)
2004
-0.51***
-0.51***
-0.51***
-3.23***
-3.59***
-3.65***
(0.02)
(0.02)
(0.02)
(0.09)
(0.20)
(0.18)
2005
-0.66***
-0.66***
-0.66***
-3.64***
-4.16***
-4.19***
(0.02)
(0.02)
(0.02)
(0.10)
(0.20)
(0.19)
2006
-0.77***
-0.77***
-0.77***
-3.95***
-4.55***
-4.54***
(0.02)
(0.02)
(0.02)
(0.10)
(0.21)
(0.20)
2007
-0.82***
-0.82***
-0.82***
-4.66***
-5.36***
-5.37***
(0.03)
(0.03)
(0.03)
(0.12)
(0.25)
(0.23)
2008
-0.95***
-0.95***
-0.95***
-5.39***
-6.12***
-6.15***
(0.03)
(0.03)
(0.03)
(0.13)
(0.28)
(0.25)
2009
-0.90***
-0.90***
-0.90***
-5.29***
-6.09***
-6.14***
(0.04)
(0.04)
(0.04)
(0.15)
(0.30)
(0.27)
2010
-0.90***
-0.90***
-0.90***
-5.33***
-6.14***
-6.18***
(0.04)
(0.04)
(0.04)
(0.15)
(0.31)
(0.28)
2011
-1.08***
-1.08***
-1.08***
-5.56***
-6.45***
-6.50***
(0.04)
(0.04)
(0.04)
(0.16)
(0.33)
(0.29)
2012
-1.28***
-1.28***
-1.28***
-6.11***
-7.01***
-7.08***
(0.04)
(0.05)
(0.05)
(0.17)
(0.36)
(0.32)
2013
-1.71***
-1.71***
-1.71***
-6.81***
-7.78***
-7.86***
(0.05)
(0.05)
(0.05)
(0.18)
(0.38)
(0.33)

65
Saturated Fat (g/100g)
Other Chain Retailers Walmart
No
IPW
Stabilized
IPW
Truncated
IPW
No
IPW
Stabilized
IPW
Truncated
IPW
β
(SE)
β
(SE)
β
(SE)
β
(SE)
β
(SE)
β
(SE)
2000
ref
ref
ref
ref
ref
ref
2001
0.01
0.01*
0.01*
-0.12***
-0.14***
-0.14***
(0.01)
(0.00)
(0.00)
(0.02)
(0.04)
(0.03)
2002
0.06***
0.05***
0.05***
-0.13***
-0.19***
-0.16***
(0.01)
(0.01)
(0.01)
(0.02)
(0.04)
(0.03)
2003
0.05***
0.05***
0.05***
-0.22***
-0.25***
-0.24***
(0.01)
(0.01)
(0.01)
(0.02)
(0.04)
(0.03)
2004
0.04***
0.04***
0.04***
-0.30***
-0.34***
-0.33***
(0.01)
(0.01)
(0.01)
(0.02)
(0.04)
(0.04)
2005
0.02**
0.02***
0.02***
-0.45***
-0.49***
-0.49***
(0.01)
(0.01)
(0.01)
(0.02)
(0.04)
(0.04)
2006
0.02
0.02*
0.02*
-0.52***
-0.59***
-0.57***
(0.01)
(0.01)
(0.01)
(0.02)
(0.04)
(0.04)
2007
-0.02
-0.02*
-0.02*
-0.69***
-0.74***
-0.73***
(0.01)
(0.01)
(0.01)
(0.03)
(0.05)
(0.05)
2008
-0.05***
-0.05***
-0.05***
-0.88***
-0.95***
-0.93***
(0.01)
(0.01)
(0.01)
(0.03)
(0.06)
(0.05)
2009
0.03*
0.03*
0.03*
-0.82***
-0.91***
-0.90***
(0.01)
(0.01)
(0.01)
(0.04)
(0.07)
(0.06)
2010
0.09***
0.09***
0.09***
-0.87***
-0.96***
-0.95***
(0.01)
(0.01)
(0.01)
(0.04)
(0.07)
(0.06)
2011
0.07***
0.07***
0.07***
-0.91***
-1.01***
-1.00***
(0.01)
(0.01)
(0.01)
(0.04)
(0.07)
(0.06)
2012
0.06***
0.06***
0.06***
-1.02***
-1.12***
-1.11***
(0.02)
(0.01)
(0.01)
(0.04)
(0.08)
(0.07)
2013
-0.03
-0.03
-0.03
-1.14***
-1.25***
-1.23***
(0.02)
(0.01)
(0.01)
(0.04)
(0.08)
(0.07)

66
Sodium (mg/100g)
Other Chain Retailers Walmart
No
IPW
Stabilized
IPW
Truncated
IPW
No
IPW
Stabilized
IPW
Truncated
IPW
β
(SE)
β
(SE)
β
(SE)
β
(SE)
β
(SE)
β
(SE)
2000
ref
ref
ref
ref
ref
ref
2001
0.46
0.47
0.47
1.98
3.60
3.65
(0.48)
(0.47)
(0.47)
(1.41)
(2.16)
(2.10)
2002
0.09
0.09
0.09
4.63***
4.43*
5.32*
(0.51)
(0.51)
(0.51)
(1.40)
(2.26)
(2.08)
2003
-1.20*
-1.21*
-1.21*
2.18
5.61*
5.20*
(0.54)
(0.55)
(0.55)
(1.45)
(2.28)
(2.14)
2004
-2.32***
-2.32***
-2.32***
-3.83*
-0.40
-1.38
(0.55)
(0.55)
(0.55)
(1.52)
(2.44)
(2.26)
2005
-2.12***
-2.14***
-2.14***
-8.78***
-4.87
-5.89*
(0.57)
(0.58)
(0.58)
(1.62)
(2.56)
(2.40)
2006
-5.21***
-5.25***
-5.25***
-12.73***
-7.92**
-9.05***
(0.59)
(0.59)
(0.59)
(1.66)
(2.66)
(2.46)
2007
-6.73***
-6.76***
-6.76***
-20.04***
-13.60***
-15.45***
(0.68)
(0.69)
(0.69)
(1.93)
(3.12)
(2.84)
2008
-5.76***
-5.76***
-5.76***
-18.95***
-12.74***
-15.06***
(0.79)
(0.81)
(0.81)
(2.20)
(3.57)
(3.19)
2009
-9.64***
-9.64***
-9.64***
-20.17***
-13.32***
-16.07***
(0.98)
(1.00)
(1.00)
(2.49)
(3.98)
(3.52)
2010
-11.27***
-11.29***
-11.29***
-29.14***
-21.92***
-24.77***
(1.00)
(1.03)
(1.03)
(2.55)
(4.06)
(3.59)
2011
-14.08***
-14.11***
-14.11***
-31.27***
-23.90***
-27.07***
(1.02)
(1.04)
(1.04)
(2.65)
(4.28)
(3.75)
2012
-17.68***
-17.69***
-17.69***
-36.09***
-27.35***
-31.16***
(1.08)
(1.11)
(1.11)
(2.87)
(4.70)
(4.08)
2013
-19.89***
-19.88***
-19.88***
-37.90***
-28.80***
-33.00***
(1.14)
(1.17)
(1.17)
(3.02)
(4.94)
(4.28) a IPWs truncated at the upper and lower 0.3rd percentile
* p<0.05, ** p<0.01, ***p<0.001

67
Supplement Table 4.5 Predicted nutrient Profile of OCR and Walmart PFPs by Household Incomea
OCR PFPs
Energy Density (kcal/100 g)
Sugar Density (g/100 g)
Higher Income
SNAP-eligible
Higher Income
SNAP-eligible
Mean (95% CI)
Mean (95% CI) pb
Mean (95% CI)
Mean (95% CI) p
2000
119 (119,120)
125 122 0.091
8.4 (8.3,8.4)
9.0 (8.7,9.3) 0.022
2006
116 (116,117)
122 121
7.6 (7.6,7.6)
8.2 (8.1,8.4)
2013
108 (108,109)
114 111
6.7 (6.6,6.7)
7.0 (6.8,7.2)
Differencec -11
-11
-1.7
-2.0
Saturated Fat Density (g/100 g)
Sodium Density (mg/100 g)
Higher Income
SNAP-eligible
Higher Income
SNAP-eligible
Mean (95% CI)
Mean (95% CI) p
Mean (95% CI)
Mean (95% CI) p
2000
1.6 (1.5,1.6)
1.7 (1.6,1.8) 0.065
205 (204,206)
209 (202,215) 0.079
2006
1.6 (1.6,1.6)
1.7 (1.7,1.7)
200 (199,207)
211 (205,217)
2013
1.5 (1.5,1.6)
1.6 (1.5,1.7)
185 (183,206)
208 (203,213)
Difference
-0.1
-0.1
-20
-1
Walmart PFPs
Energy Density (kcal/100 g)
Sugar Density (g/100 g)
Higher Income
SNAP-eligible
Higher Income
SNAP-eligible
Mean (95% CI)
Mean (95% CI) p
Mean (95% CI)
Mean (95% CI) p
2000
200 (195,204)
190 (175,205) 0.245
15.7 (15.2,16.2)
14.6 (12.5,16.6) 0.620
2006
159 (158,161)
154 (149,159)
11.1 (10.9,11.2)
11.0 (10.5,11.5)
2013
124 (122,126)
127 (120,134)
7.7 (7.4,7.9)
8.4 (7.7,9.2)
Difference
-76
-63
-8.0
-6.2
Saturated Fat Density (g/100 g)
Sodium Density (mg/100 g)
Higher Income
SNAP-eligible
Higher Income
SNAP-eligible
Mean (95% CI)
Mean (95% CI) p
Mean (95% CI)
Mean (95% CI) p
2000
2.8 (2.7,2.9)
2.8 (2.5,3.2) 0.284
231 (225,238)
231 (210,252) 0.049
2006
2.3 (2.2,2.3)
2.2 (2.1,2.3)
222 (220,241)
236 (218,253)

68
2013
1.6 (1.5,1.6)
1.6 (1.5,1.8)
198 (194,201)
200 (190,210)
Difference -1.2 -1.2 -33 -31 a Household income categorized as higher income (income >130% the federal poverty level [FPL]) or Supplemental Nutrition Assistance Program
eligible (income ≤ 130% FPL) b P-value for Wald chunk test for interaction
c Difference between 2013 and 2000, within race/ethnic group

69
CHAPTER 5. CAN A HEALTHY FOODS INITIATIVE BY A MAJOR
NATIONAL FOOD RETAILER IMPROVE THE NUTRIENT PROFILE OF US FOOD
PURCHASES?
Overview
The goal of this study is evaluate whether a healthy foods initiative (HFI) to improve the
affordability and availability of health foods at a major national US food retailer (Walmart)
improved the nutrient profile of packaged food and beverage purchases (PFPs), especially among
households eligible for the Supplemental Nutrition Assistance Program (SNAP) and race/ethnic
minorities. We used a longitudinal dataset of US household PFPs from Walmart and other chain
retailers (OCR) to compare trends in the nutrient density (energy, total sugar, saturated fat, and
sodium) of PFPs and percent volume of key food group in the pre-HFI period (2000-2010) and
post-HFI period (2011-2013), controlling for concurrent changes in the social, economic, and
food retail environment. We used time-varying inverse probability weights and fixed effects
models to account for potential selectivity of customers into Walmart and OCR stores over time,
and also tested whether the HFI was more impactful among low-income and race/ethnic minority
households.
While Walmart PFPs showed major declines in energy, sodium, and sugar density from
2000 to 2013 as well as declines in the percent volume of sugary beverages, grain-based desserts,
snacks, and candy, these declines were steepest in the 2000 to 2007 period. For most nutrient

70
densities and food groups, post-HFI declines were similar to what would be expected based on
pre-HFI trends, indicating that the HFI did not have a major impact. The effect of the HFI

71
appeared consistent for SNAP-eligible households compared to higher income
households, and for race/ethnic minorities compared to non-Hispanic Whites. PFPs from OCR
showed only minor declines across the time period, and post-HFI trends at OCR were similar to
those expected based on pre-HFI trends. While the nutrient profile of Walmart PFPs improved
over time, these trends were already well underway by the time the HFI was initiated. The HFI
was not more effective in any socio-economic group, suggesting a more targeted approach may
be needed to reduce diet disparities.

72
Introduction
Food retailers represent unique and critical allies in the fight against obesity (6, 140). In
fact, since 2011, three of the US’ largest grocers have implemented “healthier foods initiatives”
(HFI) to encourage healthier food purchases2. These initiatives typically consist of an effort to
help consumers identify healthier options through shelf or front-of-package labels, and
sometimes additional measures, such as price cuts on produce, product reformulation, or
additional educational or marketing initiatives. Such retailer-based strategies have major
potential to improve the nutrient profile of what US households purchase and consume, not only
because food stores in general provide the majority of daily energy for US children and adults (1,
2), but because national trends towards chain stores and consolidation (3) means that these top
retailers account for the majority of US food purchases (4).
Yet, no independent work has evaluated whether an HFI at a major national retailer
actually improves the nutritional quality of food purchases. To date, field studies on HFIs have
been equivocal: while some have found that HFIs demonstrate moderate to high reach (11-13)
and improve healthy food availability, sales of targeted foods, self-reported knowledge, and
intake of healthier food (11, 14-18), other studies have found that common HFI components are
ineffective at changing long-term purchasing behaviors, including nutrition signs and labels (25-
30) and discounts on healthy foods (31-33). However, most studies examining food-retailer-
based HFIs have been short-term (<2 years) and small scale, typically representing only one
store or perhaps a handful of stores in a single region, or limited to a few target foods, providing
little understanding of how an HFI at a major national supermarkets impacts purchases across the
population over time.
2“Healthier food purchases” means different things at different retailers, but usually refers to fruits and vegetables,
whole grains, and/or products which have less trans fat, saturated fat, sodium and added sugars.

73
Evaluating the effects of a national-scale retailer based HFI is further complicated by data
limitations: retailers are not always willing to share their data with independent evaluators, and
currently, national health and nutrition surveys do not indicate from which retailers foods were
purchased, making it difficult to attribute any changes to a specific retailer or initiative. In fact,
the only study to our knowledge to examine the effects of a chain-retailer based HFI had access
to the chain’s sales data, and was funded by the company who created the shelf-labeling system.
The study, which examined a storewide supermarket point-of purchase nutrition navigation
intervention using shelf-labeled star icons in a chain of Northwest supermarkets, found that the
HFI showed significant but small (<2%) increases in the percent of purchases with a star logo
after the intervention (35).
These evaluation efforts are further complicated by concerns about selectivity issues: as
the retailer implements its HFI, it may attract more customers seeking out these new healthier
food options. Thus, a key question is whether a retailer truly improved the nutrient profile of
packaged food purchases (PFPs), or whether it simply attracted a more health-conscious
consumer base as opposed to changing the behaviors of current customers.
The lack of an appropriate control group also poses a major barrier to evaluations of
national-scale HFIs, since there are no stores which remain “unexposed” to the intervention. A
basic approach would be to simply look at the nutrient profile of foods before and after the HFI
was initiated. However, such an approach cannot distinguish whether changes are attributable to
the HFI, or other concurrent secular trends that impacted food purchasing, including the “Great
Recession,” the skyrocketing of global food prices, shifts in the US socio-demographic
composition, or shifts in the food retail environment (24, 39-42, 134, 161). Ideally, we would
want to observe the counterfactual (74-76): what would the nutrient profile of purchases look

74
like if the HFI had not been enacted, if all other factors were held constant? This approach was
recently used by Ng et al. to examine whether food manufacturers’ pledge to cut calories was
associated with a decline in the calories purchased (46), but has not yet been applied to examine
HFIs by food retailers.
To address these concerns, we use Walmart as a case study to examine whether an HFI at
a national food retailer can improve the nutrient profile of packaged food purchases (PFPs) of its
customers in the US. Walmart is the US’ largest food retailer (4), with over 80% of households
shopping there in 2012 (141). In 2011, Walmart announced an HFI to improve the nutritional
quality and affordability of their products. Walmart’s initiative entails three major components:
1) development of a front-of-package labeling system for Walmart brand store-brand PFPs that
meet specified health criteria; 2) strategic price reductions on healthier items, and 3) product
reformulation of Walmart store-brand products, with goals to achieve elimination of trans fats, a
25% reduction in sodium, and 10% reduction in added sugar in key PFP categories by 2015 (77,
78). However, one key question is what is the appropriate baseline period against which to
measure these changes: although Walmart formally announced the HFI in January of 2011, much
of their online marketing suggests an earlier start date (i.e. “between 2008 and 2011 we removed
1.5 million pounds of salt across the commercial bread category)(77).
Finally, it is unclear whether major HFIs to date differentially impact key subpopulations,
such as low-income and race/ethnic minority households, who typically have less access to
healthy foods (57-59) and nutritionally poorer diets (60-62), and thus could benefit the most
from increased availability and affordability of healthier food. Considering Walmart is among
the largest recipient of Supplemental Nutrition Assistance Program (SNAP) spending(80),
75
evaluation of Walmart’s HFI among SNAP-eligible households in particular is important for
understanding if such strategies could be useful for reducing diet disparities among the poor.
The objective of this study is to examine whether Walmart’s HFI improved the nutrient
profile of PFPs from pre-HFI (2000-2010) to post-HFI (2011-2013). We conduct counterfactual
simulations by comparing the projected pre-HFI trends in nutrient profile of Walmart PFPs to
observed post-HFI trends in nutrient profile, and also compare these to concurrent trends in PFPs
at other chain retailers (OCR). To deal with selectivity, we employ fixed effects models and
inverse probability weights, to ensure that the sample remains balanced overtime. We also
examine whether results varied by whether Walmart’s stated pre-HFI period vs. a data-driven
pre-HFI period were used. Finally, we examine whether the HFI differentially impacted key
subpopulations, including SNAP-eligible households and race/ethnic minorities.
Methods
Dataset
This study uses data on household food and beverage PFPs from 2000 to 2013 from the
Nielsen Homescan longitudinal commercial purchase dataset. Details of the sampling frame and
methodology have been published elsewhere (107, 143, 162). In brief, households are sampled
from 76 metropolitan and non-metropolitan US markets, and use a handheld scanner to record
information on all PFPs purchased during each shopping trip. PFPs include all food and
beverages with a universal bar code, including all consumer packaged goods and packaged fresh
fruit and vegetables (i.e., bag of lemons), but excluding unpackaged meat and produce (i.e., a
lemon). Walmart PFPs included all PFPs from Walmart Supercenters and Neighborhood
Markets, which both include a full-line of groceries, although the latter is smaller in size and
assortment (108).

76
In order to understand whether shifts in the nutrient profile of Walmart PFPs were above
and beyond industry trends, we also examined shifts in PFPs from other chain retailers (OCRs),
who are the most comparable group of stores given their scope, size, and product assortment.
OCR purchases include all PFPs from chain grocery stores and supermarkets (≥10 locations),
supercenters, and mass merchandisers, but excluding warehouse, drug, club, dollar, convenience
stores, ethnic stores, specialty stores, and independent grocers (<10 locations) (362 different
retailers) (144). Information on PFPs was linked at the barcode level to nutrition data from the
Nutrition Facts Panel (109). PFPs were aggregated at the household-quarter level. Household-
quarter observations were included if they shopped for PFPs at Walmart (n= 1,212,803) or OCR
(n= 2,521,128) for at least two quarters.
Nutrition Outcomes
Nutrient outcomes were evaluated separately for Walmart and OCR PFPs, and included
energy density (kcal/100 g), total sugar (g/100 g), saturated fat (g/100 g), and sodium (mg/100
g). To examine shifts in purchasing, we examined shifts in percent volume purchased (% g) from
key food groups, including sugar-sweetened beverages (SSBs), grain-based desserts (GBDs),
savory snacks, candy, fresh/frozen fruit, and fresh/frozen vegetables. We used percent volume
rather than percent calories to evaluate changes in food groups, since shifts in calories could
reflect changes in either purchasing or changes in product reformulation.
Addressing selectivity
As previously mentioned, one concern in these models is selectivity, or the idea that as a
retailer implements an HFI, it may attract more health-conscious consumers, and that this shift in
consumer base may be responsible for any shifts in nutrient profile of purchases (141). To
address this concern, we created two sets of quarterly inverse probability weights (IPW) to

77
account for: a) the likelihood of being a Walmart shopper, and b) the likelihood of being an OCR
shopper (these are separate and non-mutually exclusive because a household could shop in both
Walmart and OCR in any given quarter). Each of these are IPWs are created conditional upon
covariates associated with shopping at a certain food retailer, including socio-demographics
(household composition, race/ethnicity, maximum household education, and household income),
average retailer food prices, and density of Walmart supercenters in the market (150-152). Both
Walmart and OCR IPWs were stabilized and truncated at the upper and lower 0.3rd
percentile,
with means of 0.99and 1.00 respectively. Sensitivity analyses revealed that results were robust
to the use of Walmart and OCR IPWs, and year coefficients remained consistent in direction and
magnitude.
In addition, we use fixed effects models examine average within-household effects over
time. Fixed effects models can correct for selectivity if the likelihood of shopping at a certain
retailer is associated with fixed characteristics of the household (i.e. income, race/ethnicity),
since in the model each household essentially serves as its own control.
Counterfactual simulation:
We first identified potential dates when the HFI occurred by using switching regression
(163) for both energy and sodium density of Walmart PFPs, since food industry initiatives to
reduce sodium in processed foods began prior to Walmart’s HFI (164). This technique uses
linear regression to test for an interaction of the time trend with each potential HFI starting date,
along with shifts from year to year in the directionality of this interaction, to identify time points
when shifts in the nutrient density of PFPs occurred (and thus presumably when the HFI began),
and also evaluates whether one starting point better fits the data than other starting points.
Changes in the direction of the time trend*HFI start date interaction indicated shifts at 2011 as

78
well as a shift at 2007 and 2013 (Supplemental Table 5.1). However, the summary statistics
were virtually identical across models, suggesting that no one model better fit the data, or there
was no clear “switch”. Sodium density also had no clear switch point; rather, there were switches
in different directions at 2- and 3-year increments across the time period, and again summary
statistics were similar across models. Thus, we chose to use 2011 as the beginning of the post-
HFI period for all main models for all nutrient densities, since this was Walmart’s stated HFI
initiation date, while examining 2007 as the beginning of the post-HFI period as a sensitivity
analysis.
Using these HFI start dates, we then tested the shape of the trend. For energy models
(energy, sugar, and saturated fat), we found that using the 2011 HFI start date, a quadratic trend
provided the best fit (based on model R2
and visual inspection), whereas using the 2007 HFI start
date, a linear trend provided the best fit. For sodium, a linear trend provided the best fit for the
2011 HFI start date, while a quadratic term provided the best fit for the 2007 start date. Models
with the appropriate terms were then used for the remainder of analyses.
Statistical Analysis
We used fixed effects models to separately model all nutrient outcomes at Walmart and
OCR, using Stata’s areg command for use with time-varying inverse probability weights. In
order to control for secular trends that occurred alongside Walmart’s HFI, all models included
covariates representing the economic, food retail, and price environments, including average
quarterly market-level unemployment rates (145), the weighted average of prices purchased from
each retailer type, and average market-level Walmart density variable (Walmart supercenters per
100,000 people) (146-149). Household-level covariates included household race (non-Hispanic
White, Hispanic, non-Hispanic Black, and non-Hispanic Other) and SNAP eligibility (≤130%

79
federal poverty level). All models controlled for head of household education (≤ high school
degree, some college, ≥ college degree), household type (single adult, multiple adults with no
kids, adult(s) with kid(s)) and household composition (numbers of adults aged 19-49 and ≥50y,
and numbers of children aged 0-5y, 6-18y).
To examine the observed nutrient profile of purchases pre-and post-HFI, Stata’s margins
command was used to predict the mean nutrient density or percent volume from food groups for
each year for each retailer. For models examining the counterfactual post-HFI nutrient profile,
the pre-HFI time trend (2011 or 2007; linear or quadratic) for each nutrient outcome was
estimated, then Stata’s predict command was used to predict mean nutrient outcomes during the
post-HFI period. The observed mean nutrient profile was considered statistically significantly
different from the counterfactual mean nutrient profile if 99% confidence intervals did not
overlap (p<0.01) or for race/ethnic comparisons, the 95% confidence intervals (p<0.05). To test
whether the effect of the HFI varied by key socio-demographic groups, we first examined the
interaction between time and subgroup (SNAP-eligible or race/ethnicity) using Wald chunk tests,
indicating that the nutrient profile of Walmart PFPs in this group differentially changed over
time. If the test for interaction was significant, we then employed counterfactual simulations in
stratified models to examine the effect of the HFI in each group. All statistical analyses were
performed using STATA, version 13 (Stata Corporation, College Station, Texas).
Results
Graphs comparing the nutrient density of Walmart PFPs prior to the HFI with the best-fit
counterfactual based on pre-HFI trend are shown in Figure 5.1. Walmart PFPs showed a 74
kcal/100g decline in energy density from 2000 to 2013, although this decline leveled off around
the late 2000’s. In fact, after the 2011 HFI, Walmart PFPs declined less in energy density than

80
what would be expected based on the pre-HFI trend (p<0.01 in 2013). While the rate of decline
for total sugar density of Walmart PFPs also slowed around 2007, the sugar density of PFPs
during the post-HFI period was very similar to what we would expect based on pre-HFI trends,
and in 2013, the sugar density of Walmart PFPs was less than what we would expect based on
pre-HFI trends (p <0.01). The saturated fat density of Walmart PFPs showed small declines from
2000 to 2013, but again, the saturated fat density of PFPs during the post-HFI period was slightly
but significantly higher than expected based on the pre-HFI trend (p <0.01). Sodium density
decreased by 33 mg/100g from 2000 to 2013, but post-HFI sodium density was virtually
identical to the sodium density we would have expected based on pre-HFI trends.
During the 2000 to 2013 time period, OCR also showed declines across all nutrient
densities, but generally these were substantially smaller than those observed at Walmart (Figure
5.2). The energy density of OCR PFPs declined by 11 kcal/100g from 2000 to 2013 during the
post-HFI period (p<0.01), and this decline were bigger than expected based on pre-HFI trends
(p<0.01). Similarly, while total sugar density and sodium density showed minor declines over
time, (<2 g/100g and 20mg/100g, respectively), during the post-HFI period, these declines were
bigger than expected based on pre-HFI trends (p<0.01 in 2013 for each nutrient density).
Saturated fat density of OCR PFPs remained stable over time.
Figures 5.3 and 5.4 show the percent volume purchased of key food groups at Walmart
and OCR, respectively. Overall, the percent volume of SSBs from Walmart declined only
slightly, although this decline was less than expected based on pre-HFI trend (p <0.01). Percent
volume of fruits and vegetables increased only slightly, and increases during the post-HFI period
were the same as expected. Percent volume of grain-based desserts, savory snacks, and candy
from Walmart also declined, although the post-HFI declines were no different than expected

81
from pre-HFI trends. At OCR, percent volume from food groups showed similar but smaller
shifts over time. In the post-HFI period, these changes represented negligible deviations from
what would have been expected based on pre-HFI trends, except for SSBs, which declined
slightly less than expected (p <0.01).
Using 2007 as the HFI cut-point tended to amplify the results for Walmart PFPs, and in
some cases reversed them, with the general effect being that observed post-2007 HFI nutrient
densities were even higher than what would be expected based on the pre-2007 trend. For
example, the disparity between the observed decline in energy density of Walmart PFPs and
what we would have expected based on pre-HFI trends widened (Supplemental Figure 5.1).
Using the 2007 HFI start date reversed the result for sugar density, with post-HFI sugar density
substantially higher than what would be expected based on pre-2007 trends (p <0.01). For OCR,
there were no substantive differences in results if the 2007-start date was used (Supplemental
Figure 5.2).
Similar results were found when we examined shifts in percent volume of food groups
from Walmart, with a reversal or widening of the gap so that post-HFI nutrient densities declined
less than expected. For example, using the 2007 start-date, we find that there was no difference
between the percent volume of SSBs purchased fromWalmart post-HFI and what would have
been expected based on pre-HFI trends (Supplemental Figure 5.3). For savory snacks, candy,
and fruit, changes in the percent volume purchased post-HFI were less than expected based on
pre-HFI trends. For OCR, using 2007 as a cut-point did not seem to have an effect on percent
volume of food groups purchased (Supplemental Figures 5.4).
Wald chunk tests indicated that there was no significant differences in changes in nutrient
profiles of Walmart PFPs for SNAP-eligible vs. non-SNAP eligible households over time. There

82
were significant differences in shifts energy density and sodium density by race/ethnicity (p
<0.05). However, these differences were in place prior to the HFI. For all race/ethnicities, post-
HFI energy density and sodium density declined either similar to or less than expected relative
to pre-HFI trends (Supplemental Figures 5.5 and 5.6), suggesting no differential effect of the
HFI on income or race/ethnic subpopulations.
Discussion
From 2000 to 2013, food and beverage purchases from Walmart showed substantial
declines in calorie, sugar, and sodium density, and these changes were greater than what was
observed in PFPs purchased from other chain food retailers. On the whole, however, using 2011
as the date for which the HFI was enacted, we find that post-HFI shifts in nutrient density and
percent volume of key food groups (SSBs, grain-based desserts, savory snacks, fruits, and
vegetables) were similar to or less than what we would expect had pre-HFI trends simply
continued. These results are contrary to what we would expect if the HFI truly marked a turning
point in how Walmart formulates, prices, and markets its foods: if anything, we would expect
nutrient densities of Walmart PFPs to have declined more quickly after the HFI was enacted.
Instead, we see that the declines in nutrient density and shifts in percent volume from key
food groups were steepest in the early 2000’s, and leveled off around 2007/2008. These declines
are consistent with other work showing that caloric intake and purchases have been declining
since the early 2000’s, independent of changing economic conditions (45, 143, 165). In fact,
these results mirror a recent evaluation of the “Healthy Weight Commitment Foundation”
(HWCF) pledge by food manufacturers to cut 1.5 trillion calories by 2015: Ng et al. found that
annual US calories sold by HWCF companies was declining by roughly a trillion calories a year
prior to the pledge, but that post-pledge declines in caloric purchases were smaller than expected
83
based on the pre-pledge trend (46). In the current example, the declines in the earlier 2000’s
followed by a leveling off around 2007 could simply reflect Walmart’s continued expansion of
its grocery lines within Supercenters, as well as increased consumer perception of Walmart as a
place to shop for groceries, not just for household items and the occasional sweet or soda. In fact,
by the end of the observation period, purchases at Walmart simply resemble those at other chain
retailers. It will be interesting in the future to see whether the nutrient profile of Walmart
purchases continues its decline, or remains similar to other retailers.
One notable exception is the percent volume of SSBs purchased from Walmart. Although
the total decline in SSBs was only 1% from 2000 to 2013, the percent of SSBs purchased at
Walmart was less than we would have expected given pre-HFI SSB purchasing trends, which
indicated that SSB purchases were actually increasing prior to the 2011 HFI. Given that Walmart
has not publically indicated whether their HFI has targeted SSB purchases, it is unclear whether
this shift in SSB purchases was truly the result of the HFI. An alternate possibility is that these
changes simply reflect a shift in the public attitudes towards SSBs as a result of public health
campaigns and emerging policies about the potential health consequences of SSBs--- although,
in all likelihood, such a shift in awareness would have also resulted in a downwards shift in SSB
purchases at OCR as well, which we did not see. In general, both Walmart and OCR SSB results
are contradictory to recent findings showing that caloric purchases from SSBs have decreased
over recent years (165, 166). However, since our results focused on only on volume purchased,
the lack of decline in SSB volume purchased could indicate that consumers are not decreasing
the total volume of SSBs purchased, but simply shifting to less energy dense purchases as more
beverages with lower-calorie sweeteners are introduced(167).

84
This lack of post-HFI changes raises the major question of whether Walmart, aware of
the declines in calories, sugar, saturated fat, and sodium over the past decade, was simply
marketing an HFI that simply reflected pre-existing trends. As Mozzafarian points out, such a
strategy could be beneficial to food manufacturers or retailers, with the HFI providing a
promising opportunity to improve its public image and get ahead of mounting pressure from
public health advocates to improve the nutritional quality of US foods and beverages (168). On
the other hand, it is not uncommon for organizations to initiate changes in products prior to the
formal beginning of a program or policy: for example, schools started more-healthful school
feeding programs prior to the initiation of national policies (169, 170) and some New York City
chain restaurants voluntarily posted calorie information prior to mandatory labeling laws (171).
Walmart itself has acknowledged it likely started earlier than its official announcement, since
they use 2008 as a baseline in their materials documenting the effectiveness of their HFI—
although the use of 2008 as a baseline could be viewed as conservative, given that we show the
majority of changes occurred prior to 2008.
Regardless, these results show that identifying the appropriate starting point for
evaluating food industry efforts can be complicated, and that this choice matters in determining
whether initiatives are responsible for the observed changes. In the current example, when we
use a 2007 start-date for the HFI, we find that declines in the energy, sugar, sodium, and
saturated fat density of Walmart PFPs are markedly less than we would have expected. This
likely occurred because for the energy-containing nutrients, the majority of declines occurred
prior to 2007, and then leveled off. Thus, when 2011 is used as the start-date, the quadratic trend
fits best and creates a post-HFI trajectory that is very similar to what was actually observed for
energy, sugar, and saturated fat densities. However, a 2007 start dates yields us a linear post-HFI

85
trajectory, and since these declines were occurring at a relatively steeper rate prior to 2007, when
we look to see what happened after 2007, the post-HFI nutrient densities declined less than we
would have expected had the pre-HFI trend continued.
It was also surprising to note that although the energy density, sugar, and sodium density
of OCR PFPs declined more rapidly than expected during the post-HFI period, these overall
declines were minimal. Even though the time trend was based on Walmart’s HFI, we would have
expected to see larger declines, especially after 2007 and 2011, in part because of Walmart’s
influence. Because of its size, Walmart’s price cuts on produce or negotiations with suppliers to
reformulate products could have likely led to lower prices on produce or the introduction of
healthier options (i.e. items with lower added sugar, sodium, etc) at other chain retailers as well
(115-117). Additionally, we would have expected to see steeper declines in later years due to the
implementation of HFIs by other major retailers, including Safeway’s shelf-tag labeling system
for healthier items (8) and other shelf- and product- nutrition labeling initiatives by Kroger (9,
47), DelHaize subsidiaries (10), and others, although the geographic scope of these HFIs is
currently unclear. One possibility is that PFPs purchased from OCR were already “healthier”
even in the early 2000’s, so there was less potential for HFI-related shifts in nutrient profile. An
alternate possibility is that these HFIs, which were comprised primarily of shelf- and front-of-
package nutrition labeling to identify “healthier” options, were not powerful enough to create
observable shifts in nutrient profiles. More work is needed to explicitly examine the effects of
HFIs at these other retailers.
Finally, the Walmart HFI did not appear to have a differential effect on SNAP-eligible
households or race/ethnicities. Previous work has been equivocal regarding whether socio-
demographic subgroups respond differentially to various HFI components. For example, while

86
some studies show that lower-income customers tend to be more cost-conscious (64) and more
likely to take advantage of price promotions(65), other work suggests they may not be more
responsive to price cuts than higher income consumers (66-69). Lower-SES groups may also be
less likely to utilize other elements of Walmart’s HFI, like its front-of-packaging food labeling
system (21, 70). While our work shows that the HFI was similarly effective across groups, a
more targeted approach may be needed to further improve the nutrient profile of these key
demographic groups and reduce diet disparities.
Strengths & Limitations
This study has several limitations which might have precluded our ability to detect all
potential HFI-related changes in Walmart PFPs. For example, Walmart pledged to reduce
sodium, added sugar, and trans fat in “key categories” of products (i.e. food groups). Since we
did not examine changes in nutrient profile of specific food groups, it is possible that post-HFI
changes were greater in some of these key categories than for overall purchases; however, it is
impossible to know without access to Walmart data what all of these key categories are or what
foods they comprise. Similarly, we could not distinguish added sugar from total sugar, or trans
fat from other saturated fats; however, we would expect if these changes were large enough to be
meaningful, they would have been detected in the overall nutrient profile of PFPs.
A second major limitation is that the Homescan dataset captures only foods that are
purchased and also have a barcode. First, food purchases do not necessarily equate to food
consumed, and further work is needed to understand how HFIs are related to changes in dietary
behaviors and intake. Secondly, while our dataset included fresh produce with a barcode (for
example, bagged lettuce) it misses unpackaged products like a single apple or bunch of bananas.
Given that much of Walmart’s initiative has focused on increasing the availability and

87
affordability of produce, including increasing sales of locally sourced and organic foods (125,
126), our observed declines in energy density and increases in fruit and vegetable purchases are
likely an underestimate . In fact, we might have expected to see declines in packaged fruits and
vegetables as consumers shifted to fresh produce (which we could not capture). More work is
needed to understand the degree to which the HFI impacted fresh fruits and vegetable purchases,
and how this shift may link to shifts in PFP purchasing patterns.
We were unable to explicitly examine shifts in the nutrient profile of Walmart private-
label products vs. OCR private-label products, although private-label products of each retailer
type are included in the totals. Since Walmart’s purported efforts on product reformulation and
front-of-package labeling focused on their private-label products, and considering that private-
label products account for an increasing proportion of foods purchased (139), we may have
observed more substantial post-HFI declines if we had been able to distinguish private-label
PFPs from non-private-label.
In addition, we were unable to explicitly examine each distinct component (reformulation
vs. labeling vs. price cuts) of the HFI to identify which pieces were most effective. In using these
results to craft future policies, it would be useful to understand whether declines were
attributable to shifts in consumer behavior (purchasing), or whether product reformulations were
the major driver. In addition, we did not look at how HFI-related changes in purchasing may
have impacted other foods that were purchased, at Walmart or other retailers. For example, it is
unclear whether decreases in SSB purchases were substituted with other beverages, replaced by
more SSB purchases from away-from-home food outlets, or whether consumers just purchased
fewer beverages.

88
While our estimates likely represent a conservative estimate of shifts in nutrient profile
related to Walmart’s HFI, this analysis still represents the first independent evaluation of an HFI
at a major national retailer. Further work should delve more deeply into specific HFI
components, to understand which strategies are the most effective and the most feasible for
implementation by other food retailers.
Conclusion
From 2000 to 2013, the largest food retailer in the US, Walmart, showed major declines
in energy, sugar, and sodium density of PFPs, above and beyond concurrent trends in
comparable food retailers. However, the majority of these changes occurred prior to the
implementation of its HFI. Furthermore, we illuminate the importance of identifying the
appropriate initiative start date when evaluating efforts by food retailers or food manufacturers,
in order to establish whether ostensible HFI-related shifts in nutrient profiles are related to actual
changes in the food supply, or simply reflective of pre-existing purchasing trends. Regardless,
these declines suggest that while Walmart’s HFI might not be the sole factor in improving the
nutrient profile of purchases, food retailers are a key player in strategies to improve nutrition and
reduce obesity, and should be included in the national conversation developing policies to
improve the health of the US population.

89
Table 5.1 Household characteristics of the Nielsen Homescan sample in 2000 and 2013a
Other Chain Retailers
Walmart
2000
2013 pc
2000
2013 pc
Households who shopped at retailer, %
99
95 <0.001
31
70 <0.001
Total grams purchased, %
94
81 <0.001
28
42 <0.001
Household composition
Single adult, %
b
25
25 67%
19
22 <0.001
Multiple adults, no children <18y, %
46
52 <0.001
51
55 <0.001
Adults, with children <18,%
28
22 <0.001
30
23 <0.001
Race/ethnicity
Non-Hispanic White,%
84
81 <0.001
86%
82 <0.001
Hispanic, %
5
5 0.128
5%
5 0.778
Non-Hispanic Black, %
8
10 <0.001
8%
10 <0.001
Non-Hispanic Other, %
2
5 <0.001
1%
4 <0.001
Maximum Household Education
High school or less, %
23
17 <0.001
27
20 <0.001
Some college,%
31
29 <0.001
32
31 <0.001
≥College degree, %
46
54 <0.001
40
49 <0.001
Income
d
SNAP-eligible, federal poverty level ≤130%
6
10 <0.001
7
12 <0.001
Federal poverty level, >130%
94
90 <0.001
93
88 <0.001
Walmarts/100,000 people, mean (SD)
0.2
(0.3)
1.0
(0.6) <0.001
0.4 (0.3)
1.2 (0.5) <0.001
Unemployment rate, mean (SD)
3.9
(0.9)
7.8
(1.6) <0.001
3.8 (0.8)
7.7 (1.6) <0.001
Walmart Food Price Index, mean (SD)
72 (12)
103 (4) <0.001
68 (8)
102 (4) <0.001
OCR Price Index, mean (SD) 84 (8)
118 (6) <0.001
81 (6)
116 (6) <0.001 a University of North Carolina calculation based in part on data reported by Nielsen through its Homescan Services for all food
categories, Including beverages and alcohol for the 2000-2013 periods, for the U.S. market. All estimates are an average of values
of four quarterly periods in the relevant year for households who shopped at OCR or Walmart. b Column percents.
c For categorical variables, from proportions testing and for continuous variables, from t-tests, comparing households in the
sample in 2000 and 2013. d Supplemental Nutrition Assistance Program (SNAP) eligibility based on household income using percent of annual federal
poverty level

90
Figure 5.1 Nutrient densities of PFPs at Walmart before and after the 2011 HFI
0
50
100
150
200
250
2000 2001 2002 2003 2004 2005 2006 2007 2008 2009 2010 2011 2012 2013
kcal/100 g
5.1a. Energy Density of PFPs at Walmart, 2011 HFI
Pre-HFI purchases
Post HFI purchases
Best-fit counterfactual based on pre-HFI trend, 2011
* Post-HFI purchases differ from best-fit counterfactual based on pre-HFI trend, p <0.01
0
2
4
6
8
10
12
14
16
18
2000 2001 2002 2003 2004 2005 2006 2007 2008 2009 2010 2011 2012 2013
g/1
00 g
5.1b.Sugar Density of Walmart PFPs, 2011 HFI
Pre-HFI purchases
Post HFI purchases
Best-fit counterfactual based on pre-HFI trend, 2011
* Post-HFI purchases differ from best-fit counterfactual based on pre-HFI trend, p <0.01 *

91
0
0.5
1
1.5
2
2.5
3
3.5
4
4.5
5
2000 2001 2002 2003 2004 2005 2006 2007 2008 2009 2010 2011 2012 2013
g/1
00 g
5.1c. Saturated Fat Density of Walmart PFPs, 2011 HFI
Pre-HFI purchases
Post HFI purchases
Best-fit counterfactual based on pre-HFI trend, 2011
* Post-HFI purchases differ from best-fit counterfactual based on pre-HFI trend, p <0.01
* * *
0
50
100
150
200
250
300
2000 2001 2002 2003 2004 2005 2006 2007 2008 2009 2010 2011 2012 2013
mg
/100 g
5.1d. Sodium Density of PFPs at Walmart, 2011 HFI
Pre-HFI purchases
Post HFI purchases
Best-fit counterfactual based on pre-HFI trend, 2011
* Post-HFI purchases differ from best-fit counterfactual based on pre-HFI trend, p <0.01

92
Figure 5.2 Nutrient densities of PFPs at OCR before and after the 2011 HFI
0
20
40
60
80
100
120
140
2000 2001 2002 2003 2004 2005 2006 2007 2008 2009 2010 2011 2012 2013
kcal/100 g
5.2a. Energy Density of PFPs of OCR PFPs, 2011 HFI
Pre-HFI purchases
Post HFI purchases
Best-fit counterfactual based on pre-HFI trend, 2011
* Post-HFI purchases differ from best-fit counterfactual based on pre-HFI trend, p <0.01
*
0
1
2
3
4
5
6
7
8
9
10
2000 2001 2002 2003 2004 2005 2006 2007 2008 2009 2010 2011 2012 2013
g/1
00 g
5.2b. Sugar Density of OCR PFPs, 2011 HFI
Pre-HFI purchases
Post HFI purchases
Best-fit counterfactual based on pre-HFI trend, 2011
* Post-HFI purchases differ from best-fit counterfactual based on pre-HFI trend, p <0.01 * *
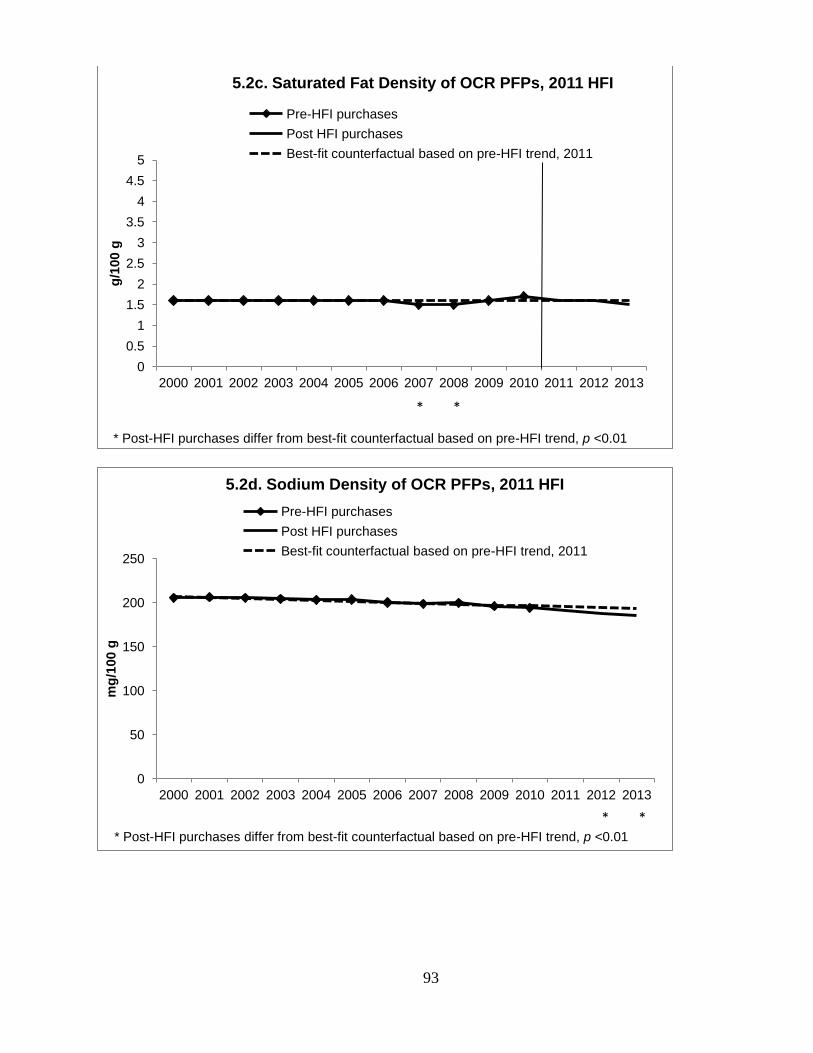
93
0
0.5
1
1.5
2
2.5
3
3.5
4
4.5
5
2000 2001 2002 2003 2004 2005 2006 2007 2008 2009 2010 2011 2012 2013
g/1
00 g
5.2c. Saturated Fat Density of OCR PFPs, 2011 HFI
Pre-HFI purchases
Post HFI purchases
Best-fit counterfactual based on pre-HFI trend, 2011
* *
* Post-HFI purchases differ from best-fit counterfactual based on pre-HFI trend, p <0.01
0
50
100
150
200
250
2000 2001 2002 2003 2004 2005 2006 2007 2008 2009 2010 2011 2012 2013
mg
/100 g
5.2d. Sodium Density of OCR PFPs, 2011 HFI
Pre-HFI purchases
Post HFI purchases
Best-fit counterfactual based on pre-HFI trend, 2011
* Post-HFI purchases differ from best-fit counterfactual based on pre-HFI trend, p <0.01
* *
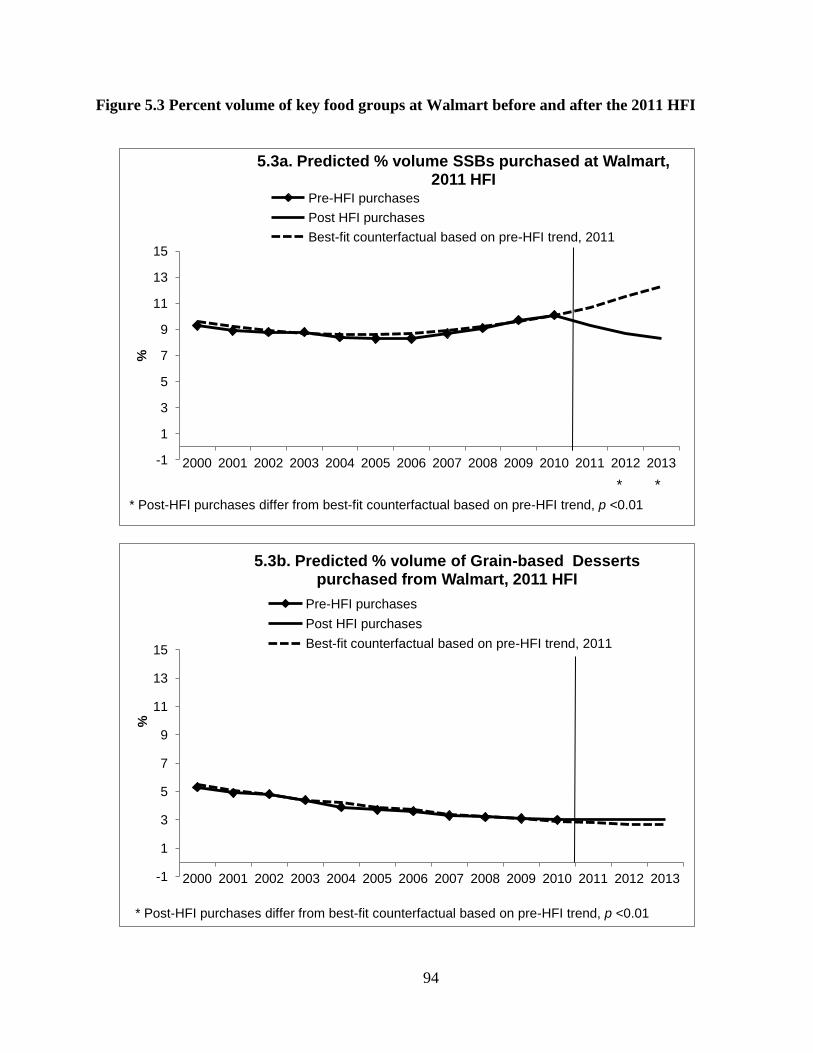
94
Figure 5.3 Percent volume of key food groups at Walmart before and after the 2011 HFI
-1
1
3
5
7
9
11
13
15
2000 2001 2002 2003 2004 2005 2006 2007 2008 2009 2010 2011 2012 2013
%
5.3a. Predicted % volume SSBs purchased at Walmart, 2011 HFI
Pre-HFI purchases
Post HFI purchases
Best-fit counterfactual based on pre-HFI trend, 2011
* *
* Post-HFI purchases differ from best-fit counterfactual based on pre-HFI trend, p <0.01
-1
1
3
5
7
9
11
13
15
2000 2001 2002 2003 2004 2005 2006 2007 2008 2009 2010 2011 2012 2013
%
5.3b. Predicted % volume of Grain-based Desserts purchased from Walmart, 2011 HFI
Pre-HFI purchases
Post HFI purchases
Best-fit counterfactual based on pre-HFI trend, 2011
* Post-HFI purchases differ from best-fit counterfactual based on pre-HFI trend, p <0.01

95
0
2
4
6
8
10
12
14
2000 2001 2002 2003 2004 2005 2006 2007 2008 2009 2010 2011 2012 2013
g/1
00 g
5.3c. Predicted % volume of Savory Snacks purchased from Walmart, 2011 HFI
Pre-HFI purchases
Post HFI purchases
Best-fit counterfactual based on pre-HFI trend, 2011
* Post-HFI purchases differ from best-fit counterfactual based on pre-HFI trend, p <0.01
0
2
4
6
8
10
12
14
2000 2001 2002 2003 2004 2005 2006 2007 2008 2009 2010 2011 2012 2013
mg
/100 g
5.3d. Predicted % volume of Candy purchased from Walmart, 2011 HFI
Pre-HFI purchases
Post HFI purchases
Best-fit counterfactual based on pre-HFI trend, 2011
* Post-HFI purchases differ from best-fit counterfactual based on pre-HFI trend, p <0.01

96
0
1
2
3
4
5
2000 2001 2002 2003 2004 2005 2006 2007 2008 2009 2010 2011 2012 2013
mg
/100 g
5.3e. Predicted % volume of Fruit purchased from Walmart, 2011 HFI
Pre-HFI purchases
Post HFI purchases
Best-fit counterfactual based on pre-HFI trend, 2011
* Post-HFI purchases differ from best-fit counterfactual based on pre-HFI trend, p <0.01
0
1
2
3
4
5
2000 2001 2002 2003 2004 2005 2006 2007 2008 2009 2010 2011 2012 2013
mg
/100 g
5.3f. Predicted % volume of Vegetables purchased from Walmart, 2011 HFI
Pre-HFI purchases
Post HFI purchases
Best-fit counterfactual based on pre-HFI trend, 2011
*
* Post-HFI purchases differ from best-fit counterfactual based on pre-HFI trend, p <0.05

97
Figure 5.4 Percent volume of key food groups at OCR before and after the 2011 HFI
-1
1
3
5
7
9
11
13
15
2000 2001 2002 2003 2004 2005 2006 2007 2008 2009 2010 2011 2012 2013
%
5.4a. Predicted % volume SSBs purchased at OCR 2011 HFI
Pre-HFI purchases
Post HFI purchases
Best-fit counterfactual based on pre-HFI trend, 2011
* *
* Post-HFI purchases differ from best-fit counterfactual based on pre-HFI trend, p <0.01
0
2
4
6
8
10
12
14
2000 2001 2002 2003 2004 2005 2006 2007 2008 2009 2010 2011 2012 2013
%
5.4b. Predicted % volume of Grain-based Desserts purchased from OCR, 2011 HFI
Pre-HFI purchases
Post HFI purchases
Best-fit counterfactual based on pre-HFI trend, 2011
* Post-HFI purchases differ from best-fit counterfactual based on pre-HFI trend, p <0.01

98
0 1 2 3 4 5 6 7 8 9
10 11 12 13 14 15
2000 2001 2002 2003 2004 2005 2006 2007 2008 2009 2010 2011 2012 2013
g/1
00 g
5.4c. Predicted % volume of Savory Snacks purchased from OCR, 2011 HFI
Pre-HFI purchases
Post HFI purchases
Best-fit counterfactual based on pre-HFI trend, 2011
* Post-HFI purchases differ from best-fit counterfactual based on pre-HFI trend, p <0.01
0
2
4
6
8
10
12
14
2000 2001 2002 2003 2004 2005 2006 2007 2008 2009 2010 2011 2012 2013
mg
/100 g
5.4d. Predicted % volume of Candy purchased from OCR, 2011 HFI
Pre-HFI purchases
Post HFI purchases
Best-fit counterfactual based on pre-HFI trend, 2011
* Post-HFI purchases differ from best-fit counterfactual based on pre-HFI trend, p <0.01

99
0
1
2
3
4
5
2000 2001 2002 2003 2004 2005 2006 2007 2008 2009 2010 2011 2012 2013
mg
/100 g
5.4e. Predicted % volume of Fruit purchased from OCR, 2011 HFI
Pre-HFI purchases
Post HFI purchases
Best-fit counterfactual based on pre-HFI trend, 2011
* Post-HFI purchases differ from best-fit counterfactual based on pre-HFI trend, p <0.01
0
1
2
3
4
5
2000 2001 2002 2003 2004 2005 2006 2007 2008 2009 2010 2011 2012 2013
mg
/100 g
5.4f. Predicted % volume of Vegetables purchased from OCRt, 2011 HFI
Pre-HFI purchases
Post HFI purchases
Best-fit counterfactual based on pre-HFI trend, 2011
* *
* Post-HFI purchases differ from best-fit counterfactual based on pre-HFI trend, p <0.01

100
Supplemental Table 5.1 Coefficients for switching regression models of energy density and sodium density of Walmart PFPs,
2000 to 2013
Supplement Table 1. Coefficients for switching regression models of energy density and sodium density of Walmart PFPs, 2000 to 2013
Energy Densitya 2001
2002
2003
2004
2005
2006
2007
2008
2009
2010
2011
2012
2013
β
β
β
β
β
β
β
β
β
β
β
β
β
Year -7.3
-7.1
***
-7.2
***
-7.0
***
-7.0
***
-7.1
***
-6.9
***
-6.9
***
-7.1
***
-6.9
***
-7.1
***
-6.9
***
-7.5
***
Year squared 0.4
***
0.3
***
0.4
***
0.3
***
0.3
***
0.3
***
0.3
***
0.3
***
0.3
***
0.3
***
0.3
***
0.3
***
0.4
***
Year*Switch year -3.0
**
0.1 0.2 0.3 0.0 0.2
**
-0.2
**
-.1
**
0.0 -0.2
***
0.2
***
0.2
***
-0.4
***
Adjusted R-
squared
0.30 0.30 0.30 0.30 0.30 0.30 0.30 0.30 0.30 0.30 0.30 0.30 0.30
MSE 93.14 93.13 93.13 93.13 93.13 93.13 93.13 93.12 93.13 93.13 93.13 93.13 93.13
Sodium Density 2001 2002 2003 2004 2005 2006 2007 2008 2009 2010 2011 2012 2013
β β β β β β β β β β β β β
Year -1.1 -1.1
***
-1.0
***
-1.1
***
-1.1
***
-1.2
***
-1.2
***
-1.1
***
-1.1
***
-1.1
***
-1.1
***
-1.0
***
-1.1
***
Year*Switch year -1.1 1.4
*
2.1
***
0.4 -0.2 -0.3
*
-0.8
***
0.3
***
0.7
***
-0.2
***
0.0 -0.1
*
0.0
Adjusted R-
squared
0.19 0.19 0.19 0.27 0.19 0.19 0.19 0.19 0.19 0.19 0.19 0.19 0.19
MSE 152.8
2
152.8
2
152.8
2
152.8
2
152.8
2
152.8
2
152.8
2
152.8
2
152.8
2
152.8
2
152.8
2
152.8
2
152.8
2
*** p<0.001, **p<0.01, *p<0.05
BOLD represents a switching point as indicated by a change in both sign of coefficient and statistical significance in the coefficient for year trend*HFI year aModel for energy density contains a quadratic time term for best fitting model. The interaction between the time trend squared and HFI year drops out of the model due
to collinearity. The model for sodium density contains only a linear term for best fit.

101
Supplemental Figure 5.1 Nutrient densities of Walmart PFPs, using a 2007 initiation date
0
50
100
150
200
250
2000 2001 2002 2003 2004 2005 2006 2007 2008 2009 2010 2011 2012 2013
kcal/100 g
S5.1a. Energy Density of Walmart PFPs, 2007 HFI
Pre-HFI purchases
Post HFI purchases
Best-fit counterfactual based on pre-HFI trend, 2007
* * * * * Post-HFI purchases differ from best-fit counterfactual based on pre-HFI trend, p <0.05
0
2
4
6
8
10
12
14
16
18
2000 2001 2002 2003 2004 2005 2006 2007 2008 2009 2010 2011 2012 2013
g/1
00 g
S5.1b. Sugar Density of Walmart PFPs, 2007 HFI
Pre-HFI purchases
Post HFI purchases
Best-fit counterfactual based on pre-HFI trend, 2007
* Post-HFI purchases differ from best-fit counterfactual based on pre-HFI trend, p <0.05
* * * *

102
0
0.5
1
1.5
2
2.5
3
3.5
4
4.5
5
2000 2001 2002 2003 2004 2005 2006 2007 2008 2009 2010 2011 2012 2013
g/1
00 g
S5.1c. Saturated Fat Density of Walmart PFPs, 2007 HFI
Pre-HFI purchases
Post HFI purchases
Best-fit counterfactual based on pre-HFI trend, 2007
* Post-HFI purchases differ from best-fit counterfactual based on pre-HFI trend, p <0.05
0
50
100
150
200
250
300
2000 2001 2002 2003 2004 2005 2006 2007 2008 2009 2010 2011 2012 2013
mg
/100 g
S5.1d. Sodium Density of Walmart PFPs, 2007 HFI
Pre-HFI purchases
Post HFI purchases
Best-fit counterfactual based on pre-HFI trend, 2007
* Post-HFI purchases differ from best-fit counterfactual based on pre-HFI trend, p <0.05
* * *

103
Supplemental Figure 5.2 Nutrient densities of OCR PFPs, using a 2007 initiation date
-10
10
30
50
70
90
110
130
150
2000 2001 2002 2003 2004 2005 2006 2007 2008 2009 2010 2011 2012 2013
kcal/100 g
S5.2a. Energy Density of OCR PFPs, 2007 HFI
Pre-HFI purchases
Post HFI purchases
Best-fit counterfactual based on pre-HFI trend, 2007
* Post-HFI purchases differ from best-fit counterfactual based on pre-HFI trend, p <0.01
* * *
0
1
2
3
4
5
6
7
8
9
10
2000 2001 2002 2003 2004 2005 2006 2007 2008 2009 2010 2011 2012 2013
g/1
00 g
S5.2b. Sugar Density of OCR PFPs, 2007 HFI
Pre-HFI purchases
Post HFI purchases
Best-fit counterfactual based on pre-HFI trend, 2007
* Post-HFI purchases differ from best-fit counterfactual based on pre-HFI trend, p <0.01
* * * *

104
0
0.5
1
1.5
2
2.5
3
3.5
4
4.5
5
2000 2001 2002 2003 2004 2005 2006 2007 2008 2009 2010 2011 2012 2013
g/1
00 g
S5.2c. Saturated Fat Density of OCR PFPs, 2007 HFI
Pre-HFI purchases
Post HFI purchases
Best-fit counterfactual based on pre-HFI trend, 2007
* * *
* Post-HFI purchases differ from best-fit counterfactual based on pre-HFI trend, p <0.01
0
50
100
150
200
250
2000 2001 2002 2003 2004 2005 2006 2007 2008 2009 2010 2011 2012 2013
mg
/100 g
S5.2d. Sodium Density of OCR PFPs, 2007 HFI
Pre-HFI purchases
Post HFI purchases
Best-fit counterfactual based on pre-HFI trend, 2007
* Post-HFI purchases differ from best-fit counterfactual based on pre-HFI trend, p <0.01

105
Supplemental Figure 5.3 Percent volume of key food groups at Walmart, using a 2007 HFI
initiation date
-1
1
3
5
7
9
11
13
15
2000 2001 2002 2003 2004 2005 2006 2007 2008 2009 2010 2011 2012 2013
%
S5.3a. Predicted % volume of SSBs purchased at Walmart, 2007 HFI
Pre-HFI purchases
Post HFI purchases
Best-fit counterfactual based on pre-HFI trend, 2007
* * * Post-HFI purchases differ from best-fit counterfactual based on pre-HFI trend, p <0.01
-1
1
3
5
7
9
11
13
15
2000 2001 2002 2003 2004 2005 2006 2007 2008 2009 2010 2011 2012 2013
%
S5.3b. Predicted % volume of Grain-based Desserts purchased from Walmart, 2007 HFI
Pre-HFI purchases
Post HFI purchases
Best-fit counterfactual based on pre-HFI trend, 2007
* Post-HFI purchases differ from best-fit counterfactual based on pre-HFI trend, p <0.01
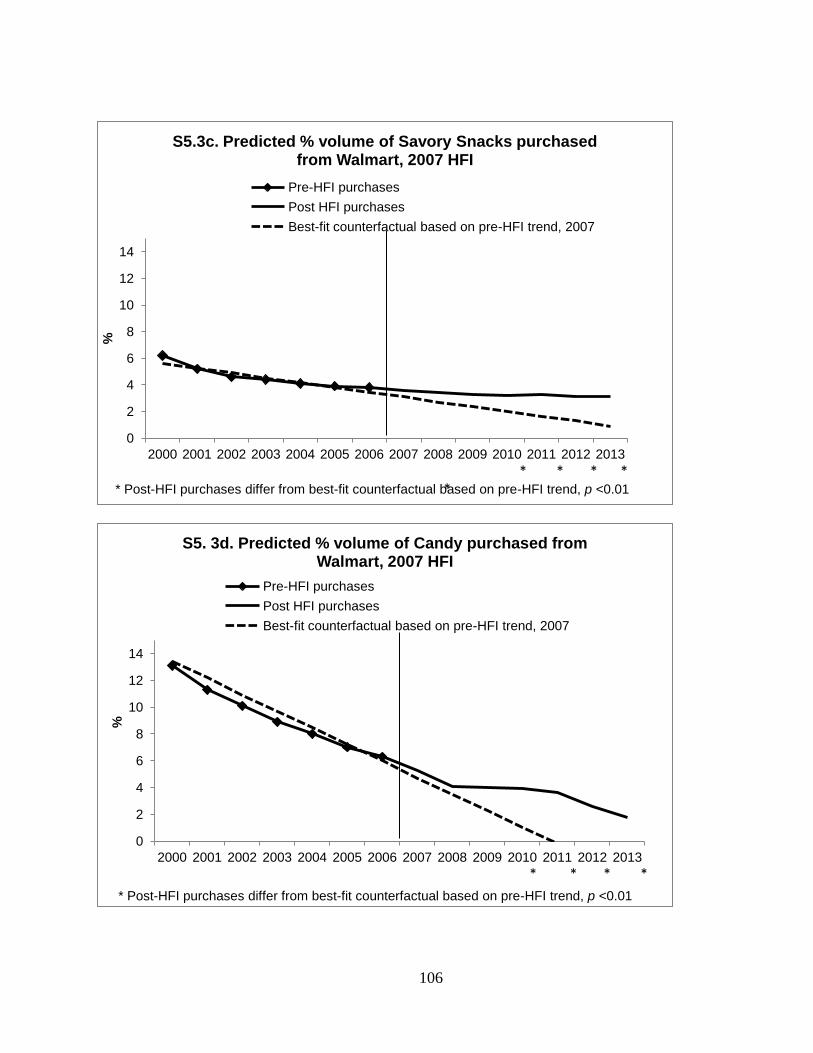
106
0
2
4
6
8
10
12
14
2000 2001 2002 2003 2004 2005 2006 2007 2008 2009 2010 2011 2012 2013
%
S5.3c. Predicted % volume of Savory Snacks purchased from Walmart, 2007 HFI
Pre-HFI purchases
Post HFI purchases
Best-fit counterfactual based on pre-HFI trend, 2007
* Post-HFI purchases differ from best-fit counterfactual based on pre-HFI trend, p <0.01 * * * * *
0
2
4
6
8
10
12
14
2000 2001 2002 2003 2004 2005 2006 2007 2008 2009 2010 2011 2012 2013
%
S5. 3d. Predicted % volume of Candy purchased from Walmart, 2007 HFI
Pre-HFI purchases
Post HFI purchases
Best-fit counterfactual based on pre-HFI trend, 2007
* Post-HFI purchases differ from best-fit counterfactual based on pre-HFI trend, p <0.01
* * * *

107
0
1
2
3
4
5
2000 2001 2002 2003 2004 2005 2006 2007 2008 2009 2010 2011 2012 2013
%
S5. 3e. Predicted % volume of Fruit purchased from Walmart, 2007 HFI
Pre-HFI purchases
Post HFI purchases
Best-fit counterfactual based on pre-HFI trend, 2007
* Post-HFI purchases differ from best-fit counterfactual based on pre-HFI trend, p <0.01 * * *
0
1
2
3
4
5
2000 2001 2002 2003 2004 2005 2006 2007 2008 2009 2010 2011 2012 2013
%
S5.3f. Predicted % volume of Vegetables purchased from Walmart, 2007 HFI
Pre-HFI purchases
Post HFI purchases
Best-fit counterfactual based on pre-HFI trend, 2007
* Post-HFI purchases differ from best-fit counterfactual based on pre-HFI trend, p <0.05

108
Supplemental Figure 5.4 Percent volume of key food groups at Walmart, using a2007 HFI
initiation date
0
2
4
6
8
10
12
2000 2001 2002 2003 2004 2005 2006 2007 2008 2009 2010 2011 2012 2013
%
S5.4a. Predicted % volume of SSBs purchased at Walmart, 2007 HFI
Pre-HFI purchases
Post HFI purchases
Best-fit counterfactual based on pre-HFI trend, 2007
* Post-HFI purchases differ from best-fit counterfactual based on pre-HFI trend, p <0.01 * * * * *
0
2
4
6
8
10
12
2000 2001 2002 2003 2004 2005 2006 2007 2008 2009 2010 2011 2012 2013
%
S5.4b. Predicted % volume of Grain-based Desserts purchased from OCR, 2007 HFI
Pre-HFI purchases
Post HFI purchases
Best-fit counterfactual based on pre-HFI trend, 2007
* Post-HFI purchases differ from best-fit counterfactual based on pre-HFI trend, p <0.01

109
0
2
4
6
8
10
12
2000 2001 2002 2003 2004 2005 2006 2007 2008 2009 2010 2011 2012 2013
%
S5.4c. Predicted % volume of Savory Snacks purchased from OCR, 2007 HFI
Pre-HFI purchases
Post HFI purchases
Best-fit counterfactual based on pre-HFI trend, 2007
* Post-HFI purchases differ from best-fit counterfactual based on pre-HFI trend, p <0.01 *
0
2
4
6
8
10
12
2000 2001 2002 2003 2004 2005 2006 2007 2008 2009 2010 2011 2012 2013
%
S5.4d. Predicted % volume of Candy purchased from OCR, 2007 HFI
Pre-HFI purchases
Post HFI purchases
Best-fit counterfactual based on pre-HFI trend, 2007
* Post-HFI purchases differ from best-fit counterfactual based on pre-HFI trend, p <0.01
*
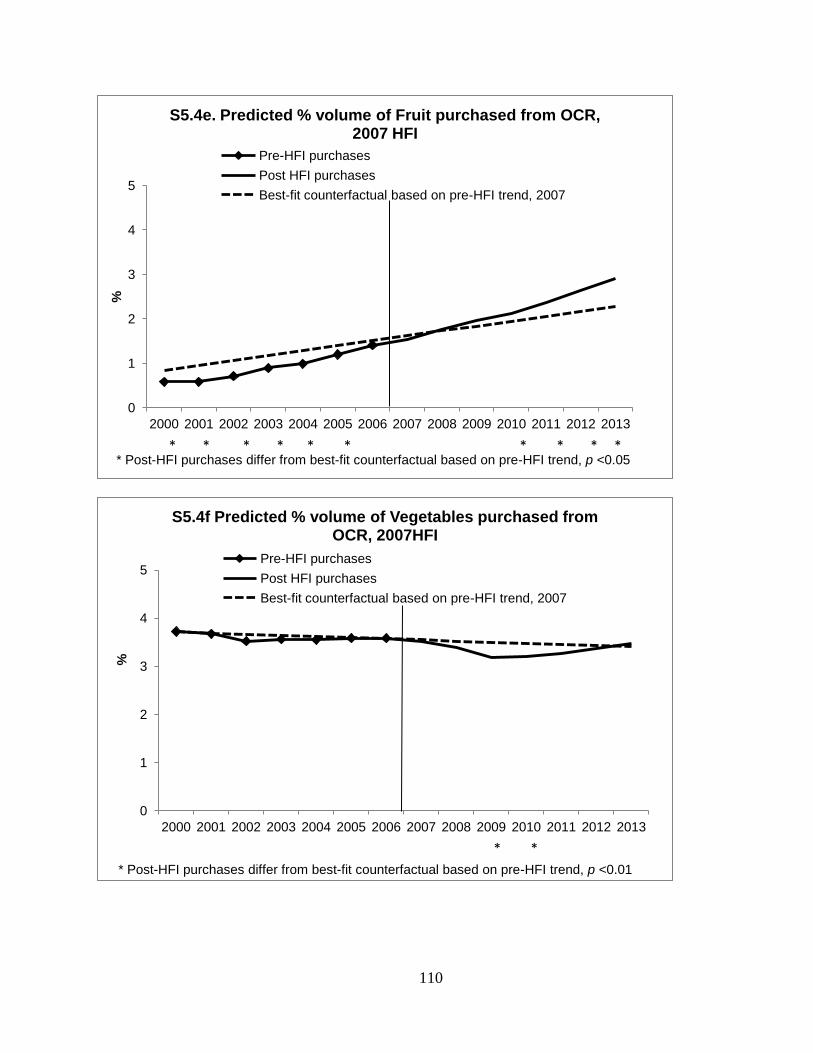
110
0
1
2
3
4
5
2000 2001 2002 2003 2004 2005 2006 2007 2008 2009 2010 2011 2012 2013
%
S5.4e. Predicted % volume of Fruit purchased from OCR, 2007 HFI
Pre-HFI purchases
Post HFI purchases
Best-fit counterfactual based on pre-HFI trend, 2007
* Post-HFI purchases differ from best-fit counterfactual based on pre-HFI trend, p <0.05 * * * * * * * * * *
0
1
2
3
4
5
2000 2001 2002 2003 2004 2005 2006 2007 2008 2009 2010 2011 2012 2013
%
S5.4f Predicted % volume of Vegetables purchased from OCR, 2007HFI
Pre-HFI purchases
Post HFI purchases
Best-fit counterfactual based on pre-HFI trend, 2007
* Post-HFI purchases differ from best-fit counterfactual based on pre-HFI trend, p <0.01
* *
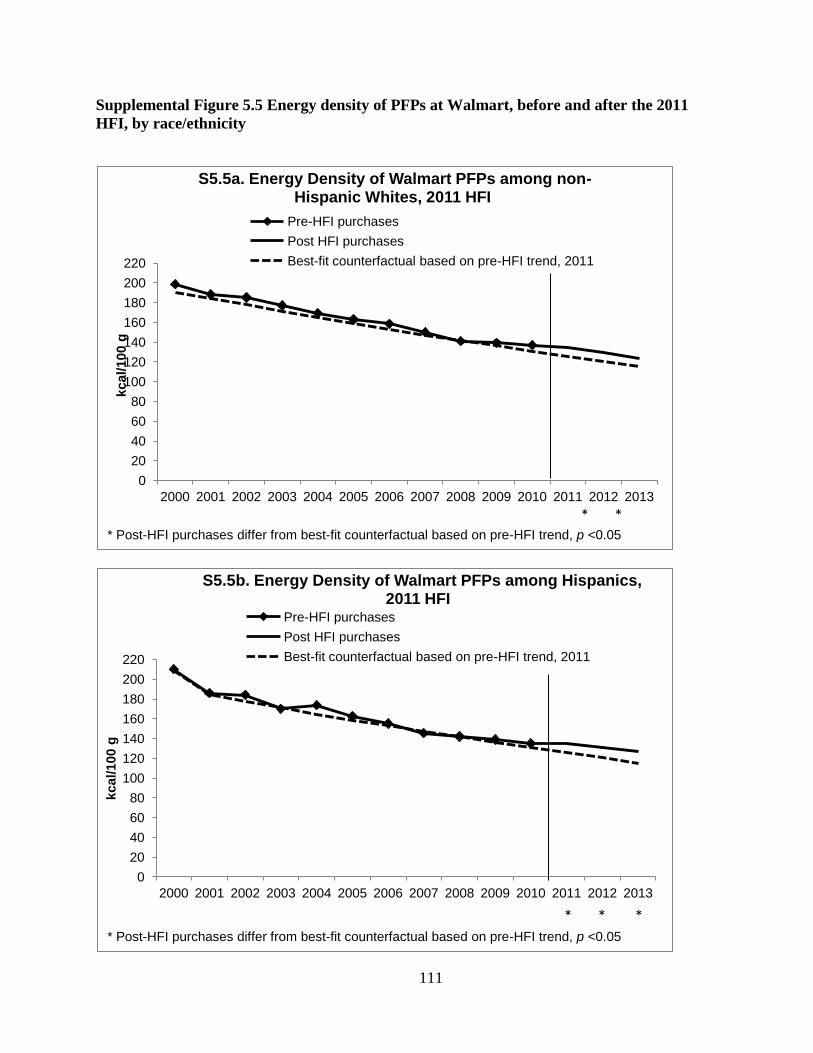
111
Supplemental Figure 5.5 Energy density of PFPs at Walmart, before and after the 2011
HFI, by race/ethnicity
0
20
40
60
80
100
120
140
160
180
200
220
2000 2001 2002 2003 2004 2005 2006 2007 2008 2009 2010 2011 2012 2013
kcal/100 g
S5.5a. Energy Density of Walmart PFPs among non-Hispanic Whites, 2011 HFI
Pre-HFI purchases
Post HFI purchases
Best-fit counterfactual based on pre-HFI trend, 2011
* Post-HFI purchases differ from best-fit counterfactual based on pre-HFI trend, p <0.05
* *
0
20
40
60
80
100
120
140
160
180
200
220
2000 2001 2002 2003 2004 2005 2006 2007 2008 2009 2010 2011 2012 2013
kcal/100 g
S5.5b. Energy Density of Walmart PFPs among Hispanics, 2011 HFI
Pre-HFI purchases
Post HFI purchases
Best-fit counterfactual based on pre-HFI trend, 2011
* Post-HFI purchases differ from best-fit counterfactual based on pre-HFI trend, p <0.05
* * *
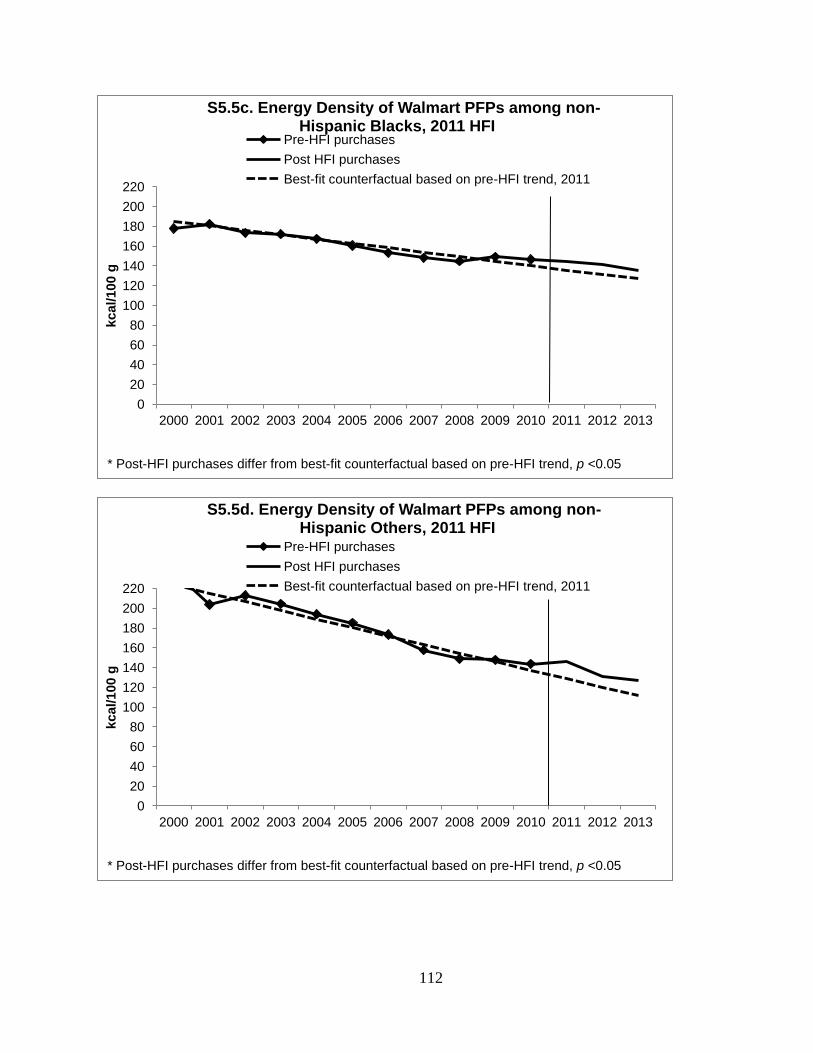
112
0
20
40
60
80
100
120
140
160
180
200
220
2000 2001 2002 2003 2004 2005 2006 2007 2008 2009 2010 2011 2012 2013
kcal/100 g
S5.5c. Energy Density of Walmart PFPs among non-
Hispanic Blacks, 2011 HFI Pre-HFI purchases
Post HFI purchases
Best-fit counterfactual based on pre-HFI trend, 2011
* Post-HFI purchases differ from best-fit counterfactual based on pre-HFI trend, p <0.05
0
20
40
60
80
100
120
140
160
180
200
220
2000 2001 2002 2003 2004 2005 2006 2007 2008 2009 2010 2011 2012 2013
kcal/100 g
S5.5d. Energy Density of Walmart PFPs among non-Hispanic Others, 2011 HFI
Pre-HFI purchases
Post HFI purchases
Best-fit counterfactual based on pre-HFI trend, 2011
* Post-HFI purchases differ from best-fit counterfactual based on pre-HFI trend, p <0.05

113
Supplemental Figure 5.6 Sodium density of PFPs at Walmart, before and after the 2011
HFI, by race/ethnicity
0
50
100
150
200
250
300
2000 2001 2002 2003 2004 2005 2006 2007 2008 2009 2010 2011 2012 2013
mg
/100 g
S5.6a. Sodium Density of Walmart PFPs among non-Hispanic Whites, 2011 HFI
Pre-HFI purchases
Post HFI purchases
Best-fit counterfactual based on pre-HFI trend, 2011
* Post-HFI purchases differ from best-fit counterfactual based on pre-HFI trend, p <0.05
0
50
100
150
200
250
300
2000 2001 2002 2003 2004 2005 2006 2007 2008 2009 2010 2011 2012 2013
mg
/100 g
S5.6b. Sodium Density of Walmart PFPs among Hispanics, 2011 HFI
Pre-HFI purchases
Post HFI purchases
Best-fit counterfactual based on pre-HFI trend, 2011
* Post-HFI purchases differ from best-fit counterfactual based on pre-HFI trend, p <0.05

114
0
50
100
150
200
250
300
2000 2001 2002 2003 2004 2005 2006 2007 2008 2009 2010 2011 2012 2013
mg
/100 g
S5.6c. Sodium Density of Walmart PFPs among non-
Hispanic Blacks, 2011 HFI
Pre-HFI purchases
Post HFI purchases
Best-fit counterfactual based on pre-HFI trend, 2011
* Post-HFI purchases differ from best-fit counterfactual based on pre-HFI trend, p <0.05
0
50
100
150
200
250
300
2000 2001 2002 2003 2004 2005 2006 2007 2008 2009 2010 2011 2012 2013
mg
/100 g
S5.6d. Sodium Density of Walmart PFPs among non-Hispanic Others, 2011 HFI
Pre-HFI purchases
Post HFI purchases
Best-fit counterfactual based on pre-HFI trend, 2011
* Post-HFI purchases differ from best-fit counterfactual based on pre-HFI trend, p <0.05
115
CHAPTER 6. SYNTHESIS
Overview of findings
In a climate of increasing food retailer consolidation and chain stores, this research
investigated the impact of a single food retailer, and a retailer-based healthy foods initiative, on
the nutrient profile of US packaged food purchases (PFPs). Using Walmart as a case study of a
major national retailer, in Aim 1, we quantified how many households shopped there, how much
they purchased there, and which socio-demographic characteristics were associated with buying
more foods and beverages. In Aim 2, we examined shifts in the nutrient profile of PFPs from
Walmart, compared these to trends at other chain retailers, and evaluated whether shifts were
greater among low-income and race/ethnic minority households. In Aim 3, we employed
counterfactual simulations to test whether Walmart’s HFI was responsible for changes in nutrient
profile by comparing the observed nutrient profile of purchases during the post-HFI period
(2011-2013) to the expected trajectory of nutrient profile of purchases based on the pre-HFI
period (2000-2010), controlling for concurrent changes in the socio-demographic, economic, and
food retail environments. Again, we examined whether these changes were different for key
subpopulations.
To conduct this research, we used a longitudinal commercial dataset of household PPFs
from Nielsen Homescan from 2000 to 2012 (Aim 1) or 2013 (Aim 2 and Aim 3). This unique
dataset captures information on all PFPs purchased during each shopping trip, including price,

116
unit, and importantly, location of purchases, and also contains socio-demographic
information, including household composition, race/ethnicity, income, and market of residence.
For this study, we included all PFPs from Walmart and from other chain retailers (chain grocery
stores and supermarkets [≥10 locations], supercenters, and mass merchandisers), who were the
most comparable to Walmart given their scope, size, and product assortment. Information on
PFPs was linked at the barcode level to nutrition data from the Nutrition Facts Panel. We also
used datasets on Walmart store openings and store location, along with national datasets on
population and unemployment rates, to capture and control for key changes in the economic and
food retail environments.
1. Walmart is an increasingly dominant source of US PFPs, and low-income households
are more likely to shop there.
Despite growing awareness of the food environment, to our knowledge, no research
has explicitly examined the impact of a specific retailer as a source of US food and beverage
purchases. Yet, the expansion of chains and consolidation of retailers has created a food
landscape in which fewer retailers are accounting for a larger share of grocery sales,
suggesting that a single retailer could have a major impact on purchases and subsequent diet.
To address this gap, we used the Homescan dataset to examine purchasing trends among the
US’ largest food retailer, Walmart, and whether low-income and race/ethnic minority
households were more likely to shop there. We found that not only do the majority of
households buy food at Walmart, the proportion of PFPs purchased from Walmart doubled
from 2000 to 2012. Low-income non-Hispanic White and Hispanic households, but not low-
income non-Hispanic Black households, were more likely to buy a larger proportion of PFPs

117
at Walmart. In summary, we found that a single food retailer, Walmart, is an increasingly
dominant source of PFPs, especially among low income households.
2. The nutrient profile of PFPs at Walmart improved from 2000 to 2013
Little is known about the nutrient profile of PFPs from Walmart compared to other
chain retailers (OCR), and how these have changed over time. In addition, most previous
work has not accounted for whether any changes in nutrient profile at a given retailer are
simply the result of attracting more health-conscious customers (i.e. selectivity). Using fixed
effects models and inverse probability weighting to account for selectivity, we evaluated
whether the nutrient profile of Walmart and OCR PFPs improved over time, and whether
these changes were greater among households eligible for the Supplemental Nutrition
Assistance Program (SNAP) and race-ethnic minorities. We also examined whether observed
shifts were driven by shifts in consumer purchasing (i.e. buying more or less of certain food
groups), or driven by product reformulation or introduction of lower-calorie options (i.e.,
shifts in nutrient profiles within food groups).
From 2000 to 2013, Walmart PFPs showed substantial declines in energy density,
total sugar density, and sodium density, and these declines were much larger than declines
observed among OCR PFPs in the same time period. Although there were no major
differences by income status, Hispanics showed the largest declines in energy density and
sodium density. Overall shifts were driven in part by changes in food purchasing, including
declines in “less healthy” food groups, like grain-based desserts, candy, and snack foods, as
well as by changes in product formulation, as demonstrated by major declines in nutrient
densities within food groups. In summary, while in 2000 Walmart PFPs were higher in
energy, sugar, sodium, and saturated fat density relative to OCR, by 2013, relatively larger

118
declines in nutrient densities at Walmart compared to OCR resulted in similar nutrient
profiles between the two retailers.
3. Shifts in nutrient profile of PFPs do not appear to be attributable to Walmart’s HFI
Since 2011, three of the largest national food retailers in the US have implemented
healthier food initiatives (HFIs). However, no independent work has evaluated whether an
HFI at a major national food retailer actually improves the nutrient profile of food purchases.
To test whether improvements in the nutrient profile of Walmart’s PFP were attributable to
the HFI, we employed counterfactual simulations to compare the observed nutrient profile of
post-HFI (2011-2013) purchases to the expected trajectory of nutrient profiles based on the
pre-HFI (2000-2010) trend, controlling for concurrent changes in the social, economic, and
food retail environment. We tested whether choice of a baseline period (2000-2010 vs. a
2000-2007) changed the results, and whether the HFI was more impactful among SNAP-
eligible and race/ethnic minority households.
While Walmart PFPs showed major declines in energy, sodium, and sugar density
from 2000 to 2013, as well as declines in the percent volume of sugary beverages, grain-
based desserts, snacks, and candy, these declines were steepest in the 2000 to 2007 period.
For most nutrient densities and food groups, post-HFI declines were similar to what would be
expected based on pre-HFI trends, indicating that the HFI did not have a major impact on the
nutrient profile of purchases. The effect (or lack thereof) of the HFI appeared consistent for
SNAP-eligible households compared to higher income households, and for race/ethnic
minorities compared to non-Hispanic Whites. PFPs from OCR showed only minor declines
across the time period, and post-HFI trends were similar to those expected based on pre-HFI
trends. In summary, while the nutrient profile of Walmart PFPs improved over time, these

119
trends were already well underway by the time the HFI was initiated, and were not more
effective among key socio-demographic populations.
Strengths and Limitations
A key strength of this work was the use of a commercial dataset of household packaged
food purchases, which captures information on not only what was purchased, how much was
purchased, and the cost, but also records where the food was purchased. This ability to identify
food retailer was essential to evaluating the role of a food retailer’s HFI on the nutrient profile of
foods, yet is an element that is typically missing from national health and nutrition surveys.
Another option to obtain retailer-specific data would be to partner with the retailer in question;
however, many retailers are not keen on engaging with academic researchers, and moreover,
such data would not provide information on other similar retailers to serve as a comparison
group. By using a dataset of household purchases, we were able to objectively evaluate shifts in
the nutrient profile of Walmart purchases, as well as compare them to trends at comparable
retailers. In addition, because our dataset was comprised of all purchases at Walmart and other
chain retailers, we were also able to develop an inverse probability weight to identify and
account for the probability that some households were more likely to shop at Walmart or OCR
than other households. Utilization of methods like inverse probability weighting is critical if the
likelihood of shopping at a given retailer is linked to inherent dietary preferences (for example, if
those who tend to shop at Walmart also prefer higher energy dense foods). Dealing with
selectivity is also essential for ensuring that observed changes are not attributable to a retailer
simply attracting a more health-conscious consumer, especially after HFI implementation, but
actually due to effects of the HFI itself.

120
Another key advantage of this study is that this purchase dataset was linked to
information from the nutrition facts panel, which allowed us to examine the actual nutrient
profile of purchases at specific retailers. This ability to examine both food groups and nutrients
was a key advantage over other studies also using the Homescan dataset, which typically apply
an ecological approach linking the densities of a food retailer or retailer type (i.e. supercenters)
to some approximation of healthfulness of purchases (by assigning scores to certain foods
groups, or by examining fruits and vegetables only) (106, 172). Here, we were actually able to
monitor shifts in nutrient densities of purchases from Walmart and other chain retailers over time
at the household level, as well as examine shifts in food groups. Another advantage of using the
commercial purchases data is that it provides accurate information on household packaged food
purchasing: while some studies have found that Homescan may suffer from sample selection and
participation biases (173), others have found these biases can be adjusted for by controlling for
household demographics (162). Moreover, comparison of the Homescan data from grocery
retailers sales data (174, 175) and household expenditures diary surveys (162) confirm the
validity of the Homescan data for packaged food purchases.
Finally, by using commercial purchase data on items purchased, price, and socio-
demographic data, coupled with data on Walmart store openings, US population shifts, and the
unemployment rate, we were able to control for concurrent changes in the socio-demographic,
economic, and food retail environment. This was critical to our effort, as major events like the
“Great Recession,” or secular trends, such as the proliferation of Walmart supercenters, could
have potentially biased our results. In addition, the longitudinal nature of our data, as well as the
inclusion of households sampled from across the country, allowed us to explore the long-term

121
effects of the HFI on a larger sample of the US population, as opposed to previous HFI
evaluations, which were typically short-term and geographically localized.
However, the use of commercial purchase data to examine the effects of a retailer-based
HFI also had several significant limitations, which likely attenuated the observed effects of the
HFI. Perhaps the most important of these is that the Homescan data includes only foods that are
purchased (as opposed to consumed) and those with a barcode. First, food purchases do not
necessarily equate to food consumed, due to wastage and spoilage, and further work is needed to
understand how HFIs are related to changes in dietary behaviors and intake. Secondly, limiting
the dataset to foods with a barcode misses foods like loose fruits or vegetables, which typically
do not have a barcode. Failure to capture these products could impose a major restriction on our
ability to evaluate Walmart’s HFI, since one of its major goals was increasing the availability
and affordability of produce, including increasing sales of locally sourced and organic foods
(125, 126). If we were able to include these items, we would likely see a bigger impact of the
HFI on the nutrient profile of foods and beverages, as well as higher increases in fruits and
vegetables. On the other hand, using data on PFP expenditures from 2007-2011, we found that
on average, only 5% of total food expenditures was spent on unpackaged food purchases at
Walmart, and only 2% of total food expenditures was on unpackaged produce, whereas packaged
food purchases accounted for 93% of expenditures. Thus, even though we could not measure
changes in unpackaged fruits and vegetables, these foods represent only a minor fraction of
overall Walmart food purchases.
We were able to examine key elements of Walmart’s HFI which affected packaged food
purchases, including as product formulation (reformulating products, removing products, or
introducing new products) and front-of-package labeling, focused on packaged foods and
122
beverages. Our methodology was appropriate for examining these changes, as well as HFIs at
other major retailers, which have also focused primarily on shelf- and package-labeling
initiatives that are targeted towards packaged foods. In addition, food manufacturers and
suppliers are increasingly packaging fresh produce in mesh or plastic bags, and multi-packs, to
encourage increased purchasing (e.g., a bag of three avocados) or in one-serving, snack-sized
containers, to appeal to evolving consumer preferences and an increased market for convenience
foods (176). This suggests that datasets of packaged food purchases may be better able to capture
fresh produce over time, and in the meantime, can still capture the impact of key HFI elements
like product reformulation and labeling.
Similarly, with the available data, we could only evaluate changes in overall purchasing,
and could not distinguish effects from individual HFI components to determine which
component was most effective. We were also limited in the degree to which we could explore
shifts in nutrient profile. Most importantly, we could not explicitly examine decreases in added
sugar or trans fats, which were two targets of Walmart’s HFI. In addition, we were partially
limited in our examination of food-group specific changes because we do not have data on which
products Walmart purportedly targeted for its reformulation efforts. However, we were able to
examine whether shifts in overall nutrient profile were driven by changes in consumer
purchasing (i.e. shifts in food groups purchased) or by changes in product formulation (i.e. shifts
in nutrient profile within food groups purchased). In the future, we would like to build on this
work by more carefully examining certain food and beverage groups, and linking shifts more
directly to individual HFI components (i.e. price cuts vs. labeling vs. reformulation), in order to
determine which elements are most useful.

123
Another key limitation is that our analysis includes only three years of post-HFI data,
which may not provide a long enough period to fully capture HFI-related shifts in purchasing,
given that Walmart’s pledge was to complete all changes by 2015. Evaluating the HFI prior to
this 2015 deadline means that we may not be able to capture the effects of all product
reformulations, and it also may not allow for enough time for consumers to respond to the HFI.
However, by 2013, Walmart had announced that they had already achieved a 9% decline in
sodium and a 50% reduction in industrial produced trans fats, due to product reformulation, as
well as a 10% decline in added sugars, attributable to reformulation, which they attribute to the
entrance of new low-sugar products, and consumers making healthier choices (77). Although our
findings did not confirm the magnitude of these shifts, nor did our findings indicate that the
shifts we did observe were attributable to the HFI, the fact that Walmart was willing to make
these announcements suggests that changes were well underway. Thus our evaluation still
provides useful evidence as to whether the HFI has begun to shift the nutrient profile of Walmart
purchases.
A further limitation also contributed to our likely underestimation of the impact of
Walmart’s HFI. We were unable to explicitly examine changes in Walmart private-label
products vs. non-private-label products, in part due to confidentiality agreements with the
vendors, and in part because linkages of packaged food purchases to nutrition information were
less accurate for private-label products than non-private-label products. In many cases, a private-
label product without a direct linkage to that product’s nutrition facts panel would be assigned
the average nutrient profile of all private-label products. For example, a “Great Value” brand soft
drink without the corresponding nutrition facts panel information would be linked to an average
nutrient profile of all private-label soft drinks. Since Walmart’s purported efforts on product

124
reformulation and front-of-package labeling focused on their private-label products, and
considering that private-label products account for an increasing proportion of foods purchased
(139), we may have observed more substantial post-HFI declines if we had been able to
distinguish private-label PFPs from non-private-label. However, in addition to reformulating its
own products, Walmart also asked manufacturers of branded PFPs to reformulate their products,
and our dataset was more likely to capture shifts in the reformulations of these products. Still, in
order to better understand whether private-label products did show greater changes in nutrient
profile than branded products, we plan to conduct a sensitivity analysis examining only products
that were the most accurately linked to nutrition data. Although such an analysis might still miss
a number of private label products, it would provide a sense of whether changes in private label
products were greater than branded products during this time period.
An additional concern is that these results could simply reflect a shift in how people shop
at Walmart: as the years progressed, and people purchased more food at Walmart, they
purchased a wider variety of foods, whereas in early years, they may have only purchased non-
perishable packaged foods, like candy or snacks. This would result in a decline in energy density
of Walmart PFPs, simply because of either a real or perceived shift in Walmart from discount
store to full-grocery supercenter, as more supercenters entered the market and offered a wider
assortment of products. In addition, we were unable to measure household dietary preference,
which could affect how much people buy at Walmart as well as what they buy there, which
limits our ability to establish what caused the observed changes in nutrient profile.
A final limitation relates to the generalizability of our results. While we employed
multiple strategies for addressing selectivity within our sample, the Homescan sample overall
tends to be more highly educated, more non-Hispanic White, and higher income than the general
125
US population. Moreover, participation in Homescan requires using a handheld scanner to scan
all purchases a household makes, without direct financial compensation (participants are enrolled
in various lotteries to win prizes or given points they can redeem for gifts). Households with
limited time resources, or those for whom gift rewards hold little value, may not be interested in
participating.
We also restricted our sample to Walmart and OCR customers, in order to examine
comparable groups, and because major retailers like Walmart and OCR account for the highest
proportion of grocery sales, and are thus the most poised to affect the food system. Households
that shopped at either OCR or at Walmart accounted for 98% of total households participating in
Homescan, with only 2% of households shopping at only ethnic stores, club stores, convenience
stores, individual grocery stores, specialty stores, or other small stores. However, households that
shop at only farmer’s markets, local stores, or convenience stores/drug stores may have a
different response to similar measures enacted in the places where they shop than the households
included in this study. Thus, more work in varying samples is needed to truly understand how
HFIs impact different segments of the population. For example, Sheetz, a chain of convenience
stores, recently implemented a healthier foods initiative, and it would be useful to understand
how this type of initiative impacts households who buy groceries there.
Because of these concerns, the results of this study should not be interpreted as “HFIs do
not work.” While a key strength of our work was our ability to harness the unique characteristics
of a dataset of household purchases, this dataset also contained a number of limitations which
reduced our ability to detect the effect of the HFI. To get a comprehensive understanding of
whether HFIs impact the nutrient profile of purchases, ideally we would triangulate our results
with those from field studies, which could test individual HFI components, and data from

126
retailers, which could provide information on key elements like unpackaged produce and private-
label products. Data from a number of sources, from HFIs in various store settings (for example,
a chain retailer vs. regional grocery store), and from various populations would provide a
stronger evidence base to establish the effectiveness of HFIs for improving nutrition.
Significance and public health impact
This study provides a novel methodology for evaluating how a single food retailer, and a
retailer-based HFI, impacts the nutritional profile of US food purchases. First, lack of data on
retailers in national nutrition surveys, and difficulty in partnering with food retailers to access
store-level data, necessitate use of commercial purchase data. However, our study shows that a
dataset of household purchases can be used to examine the impact of a single food retailer as a
food source in the US food supply. Our study provided further evidence that as food retailers
consolidate and chains grow, a single retailer can have a major impact on what US households
buy and eat. In addition, by using household food purchases, we were able to examine shifts in
the nutrient profile of Walmart purchases, and examine whether these shifts were above and
beyond those observed at other chain retailers, as opposed to relying on ecological data to link
store densities, or proximity to stores, with nutritional quality. Moreover, by using the price and
socio-demographic data provided by Homescan, coupled with data on Walmart store locations,
we were able to control for concurrent trends that may have otherwise impacted the observed
shifts in nutrient profile. These characteristics are necessary in order to understand whether
changes in nutrient profile and purchasing were attributable to the HFI and not simply the
reflection of secular trends.
Secondly, this work provides a useful methodology for evaluating national-scale food
initiatives, such as soda bans or menu labeling, which often do not have an appropriate control

127
group for comparison. First, conducting counterfactual simulations by comparing post-initiative
results to expected results based on pre-initiative trends, while controlling for concurrent trends,
allows researchers to determine whether changes are attributable to the initiative in question. We
were also able to use inverse probability weighting to account for selectivity, or the potential for
shifts in the consumer base over time. This approach could also be useful in the evaluation of
major national food policies, or for smaller-scale HFIs, if there is some suspected relationship
between the likelihood of being “exposed” to the policy or HFI, and shifts in nutrient profile. For
example, to examine the effects of Berkeley’s recent soda tax, investigators would want to
compare soda purchases in Berkeley to those in a comparable city that did not implement the tax.
However, since the populations living in the two cities would still have some different
characteristics, inverse probability weighting could be used to deal with the possibility that those
who live in Berkeley may different underlying nutritional preferences (perhaps they drink less
soda) and thus may be more or less responsive to such a ban than those in Toledo.
On a related note, we also found that evaluation of an HFI or similar effort requires
identifying an appropriate baseline period. Since manufacturers, retailers, or even government
entities may begin making shifts prior to the official start date of the initiative, examining the
data to determine when the shift actually occurred can provide a more appropriate reference
point for evaluating post-HFI changes. Similarly, understanding pre-baseline trends is a necessity
for understanding whether the party in question truly made a change, or simply claimed
responsibility for what was actually a preexisting trend. This consideration could be critical in
evaluating other food and nutrition policies. For example, in evaluating the effect of mandatory
calorie labeling on menus stemming from the Affordable Care Act, it would be important first to
understand whether away-from-home calories were already declining prior to implementation, as

128
well as when restaurants actually made these changes. As our results show, the choice of a
baseline period is not always obvious, and can make a difference in how impactful an initiative
appears, and thus requires careful consideration.
In the current study, we found that although the nutrient profile of packaged food
purchases from Walmart improved above and beyond trends at other chain retailers, the vast
majority of these improvements occurred prior to the HFI. However, given that we were unable
to examine individual HFI components or evaluate shifts in unpackaged produce, it is likely that
our estimates of HFI-related changes are conservative. Moreover, we show that Walmart is a
major source of packaged food purchases in the US—especially among low-income households.
These results suggest that Walmart and other major food retailers can be key leaders in efforts to
improve nutrition and prevent obesity, and should be included in conversations and
collaborations on industry food initiatives to achieve these goals. One example is the Partnership
for a Healthy America, which has already partnered with Walmart, food manufacturers,
convenience stores, and other companies to improve the healthfulness of food choices and reduce
obesity (177).
This study also has implications for understanding how retailers could contribute to, or
reduce, diet-related disparities. We found that while Hispanics and non-Hispanic Others had
worse nutrient profile of purchases in 2000 relative to non-Hispanic Whites, they showed the
largest declines in energy density and sodium density over time. In addition, both SNAP-eligible
households showed shifts towards a more favorable nutrient profile. However, for all groups, the
HFI did not seem particularly impactful at creating shifts above and beyond what was already
expected given pre-HFI trajectories. On one hand, this trend towards more favorable nutrient
profiles over time is promising, given that Walmart is the largest recipient of SNAP benefits, but

129
on the other, more work needs done to understand whether more targeted efforts can be more
impactful at reducing diet disparities in these vulnerable subpopulations.
In summary, Walmart is a major source of PFPs in the US, particularly among low-
income households. While the nutrient profile of PFPs improved over time, and these
improvements were greatest among Hispanic and non-Hispanic Other households, Walmart’s
HFI did not have a clear impact in pushing these improvements beyond what was expected given
their pre-existing trajectories. Regardless, this work demonstrates that food retailers can have a
major impact on the nutrient profile of US food and beverage purchases, and can be important
contributors in strategies to improve nutrition. Public health advocates, nutrition scientists, and
policymakers should engage and work collaboratively with food retailers to further improve the
diet of the US population.
Future Directions
While this research examined whether an HFI at a major national retailer impacted the
nutrient profile of packaged food purchases, more work is needed to understand how HFIs affect
non-packaged produce, diet intake, and health outcomes, as well as also their impact at other
retailers. Ultimately we would want to know whether these initiatives are actually successful at
improving diet, and diet-related disease like obesity, diabetes, and cardiovascular disease.
For example, future research should explore how HFIs impact the purchases of
unpackaged fruits and vegetables, as well as whether these purchases translate into increased
intake, or changes in weight status. To address the unpackaged produce element, one option
would be to use Homescan’s expenditures data, which includes the amount spent on packaged
products as well as unpackaged fresh produce (although further detail is not included, such as the
volume or units purchased). As long as price cuts on produce were controlled for, such analysis
130
would allow us to see how people’s total expenditures changed over time, whether they
purchased relatively more unpackaged produce after the HFI, and potentially whether
substitutions were made (i.e. unpackaged produce for packaged produce). Currently, we only
have access to limited years of this expenditures data (2007-2011). However, we do plan to
conduct a sensitivity analysis using this data to understand what proportion of total produce
expenditures is accounted for by unpackaged produce, and whether this differs between Walmart
and other chain retailers.
Additional analyses could also focus on understanding how shopping patterns and
initiatives across retailers work together to produce changes in total food purchases across all
stores where households shop. This is especially important considering that many households
shop at multiple retailers or only buy certain products at certain retailers, and because other
major retailers have also introduced initiatives to help consumers make healthier choices. If
households buy more produce at the HFI retailer, but compensate by buying less produce at
another retailer where they shop, the HFI may not be a useful strategy for promoting increased
produce purchases. In the current study, we only examined concurrent trends in purchasing at the
HFI retailer and comparable retailers; however, in the future, we will also examine whether
households made substitutions or additions of produce or other products as a result of the HFI.
Along these lines, it would also be useful to understand whether retailer-based HFIs
produce changes in people’s purchasing patterns. Our analysis only looked at changes in
nutrients and key food groups. However, people do not consume nutrients or foods in isolation,
but rather as part of an overall diet, which may be more predictive of disease risk (178). Thus,
one key question to address in the future is whether HFIs promote healthier purchasing patterns:

131
for example, after an HFI is implemented, are households more likely to have a purchasing
pattern that reflects the Mediterranean dietary pattern (179-181)?
Future work should also seek to understand what could be done to boost the impact of
these retailer-based HFIs. One potential reason for the lack of effect is that while the HFI
focused on improving the availability and affordability of healthy foods, it did not work to
decrease the availability of unhealthy foods through price increases, product placement, or
package labeling—perhaps over concerns regarding profit loss. However, previous work has
shown that increased shelf-space devoted to more energy-dense snack foods is associated with an
increase in BMI (182), suggesting that interventions to reduce the availability of unhealthy foods
might be needed alongside interventions to boost the availability of healthy foods. Thus, one
question for future exploration is whether a combined approach of boosting healthy foods
coupled with reducing the availability of unhealthful foods is financially sustainable, and
whether it can yield a more powerful impact on nutrient profile. Other policy options, such as a
tax on SSBs or on junk food, as recently implemented in Mexico, could also achieve the goal of
reducing the affordability of healthful foods, and don’t depend on the retailer to make choices
that might impact its bottom line.
Finally, more research is needed to understand how food retailers can be leveraged to
reduce diet-related disparities in low-income and race/ethnic minority households. One option
could be to target small, non-chain food stores, which are more common in neighborhoods with
high proportions of low-income and race/ethnic minority households (183-185), and have been
suggested as a potential target for improving diets among these key groups (186). In fact, a 2012
systematic review found that small-store HFIs consistently improve the availability, purchase,
and consumption of healthier foods (32). In this study, we did not examine these small stores

132
because they tend to offer a smaller assortment of products than Walmart and other chain
retailers, and thus may not be an appropriate comparison group. However, future work should
examine whether HFIs are more impactful at different types of retailer (for example, drug stores,
club stores, convenience stores, mass merchandisers), or whether across-the-board changes are
needed to see an impact. Such work also provides a critical opportunity to integrate data from
national-scale studies like ours, which can show how such initiatives work at the population
level, with smaller, isolated field studies, which can tease out which HFI components might be
most effective, and in which geographic regions or socio-demographic subpopulations.

133
REFERENCES
1. Poti JM, Popkin BM. Trends in energy intake among US children by eating location and
food source, 1977-2006. J Am Diet Assoc 2011;111(8):1156-64.
2. Smith LP, Ng SW, Popkin BM. Trends in US home food preparation and consumption:
analysis of national nutrition surveys and time use studies from 1965–1966 to 2007–
2008. Nutr J 2013;12(1):45.
3. Wood S. Revisiting the US food retail consolidation wave: regulation, market power and
spatial outcomes. Econ Geog 2013:lbs047.
4. United States Department of Agriculture Economic Research Service. Retail Trends.
2014.
5. Hawkes C. Dietary implications of supermarket development: a global perspective. Dev
Policy Rev 2008;26(6):657-92.
6. Glanz K, Bader MD, Iyer S. Retail grocery store marketing strategies and obesity: an
integrative review. Am J Prev Med 2012;42(5):503-12.
7. Wal-mart Stores Inc. Walmart Launches Major Initiative to Make Food Healthier and
Healthier Food More Affordable. Washington, D.C., 2011.
8. BusinessWire. Internet:
http://www.businesswire.com/news/home/20110215007790/en/Safeway-Announces-
%E2%80%98SimpleNutrition%E2%80%99-In-Store-Shelf-Tag-
System#.VD57YvldWSo 2014).
9. Kroger. Internet: https://www.kroger.com/topic/health-matters-3 (accessed May 2014).
10. Food Lion. Internet:
http://www.foodlion.com/NutritionWellBeing/Nutrition/GuidingStars (accessed October
2014).
11. Gittelsohn J, Song H-J, Suratkar S, Kumar MB, Henry EG, Sharma S, Mattingly M,
Anliker JA. An urban food store intervention positively affects food-related psychosocial
variables and food behaviors. Health Educ Behav 2010;37(3):390-402.
12. Gittelsohn J, Suratkar S, Song H-J, Sacher S, Rajan R, Rasooly IR, Bednarek E, Sharma
S, Anliker JA. Process evaluation of Baltimore Healthy Stores: a pilot health intervention
program with supermarkets and corner stores in Baltimore City. Health Promot Pract
2010;11(5):723-32.
134
13. Curran S, Gittelsohn J, Anliker J, Ethelbah B, Blake K, Sharma S, Caballero B. Process
evaluation of a store-based environmental obesity intervention on two American Indian
Reservations. Health Educ Res 2005;20(6):719-29.
14. Song H-J, Gittelsohn J, Kim M, Suratkar S, Sharma S, Anliker J. A corner store
intervention in a low-income urban community is associated with increased availability
and sales of some healthy foods. Public Health Nutr 2009;12(11):2060.
15. Gittelsohn J, Dyckman W, Tan ML, Boggs MK, Frick KD, Alfred J, Winch PJ, Haberle
H, Palafox NA. Development and implementation of a food store–based intervention to
improve diet in the Republic of the Marshall Islands. Health Promot Pract 2006;7(4):396-
405.
16. Gittelsohn J, Dyckman W, Frick KD, Boggs MK, Haberle H, Alfred J, Vastine A,
Palafox N. A pilot food store intervention in the Republic of the Marshall Islands. Pac
Health Dialog 2007;14(2):43-53.
17. Gittelsohn J, Vijayadeva V, Davison N, Ramirez V, Cheung LW, Murphy S, Novotny R.
A food store intervention trial improves caregiver psychosocial factors and children's
dietary intake in Hawaii. Obesity 2010;18(S1):S84-S90.
18. Levy AS, Mathews O, Stephenson M, Tenney JE, Schucker RE. The impact of a nutrition
information program on food purchases. J Public Policy Mark 1985:1-13.
19. Food Marketing Institute. Trends in the United Stats- Consumer Attitudes and the
Supermarket, 2000. Washington, DC, 2000.
20. Vyth EL, Steenhuis IH, Mallant SF, Mol ZL, Brug J, Temminghoff M, Feunekes GI,
Jansen L, Verhagen H, Seidell JC. A front-of-pack nutrition logo: a quantitative and
qualitative process evaluation in the Netherlands. J Health Commun 2009;14(7):631-45.
21. Williams P. Consumer understanding and use of health claims for foods. Nutr Rev
2005;63(7):256-64.
22. Mhurchu CN, Gorton D. Nutrition labels and claims in New Zealand and Australia: a
review of use and understanding. Aust N Z J Public Health 2007;31(2):105-12.
23. Rayner M, Boaz A, Higginson C. Consumer use of health-related endorsements on food
labels in the United Kingdom and Australia. J Nutr Educ 2001;33(1):24-30.
24. Food Marketing Institute. US Grocery Shopper Trends 2012 Executive Summary. 2012.
25. Jeffery RW, Pirie PL, Rosenthal BS, Gerber WM, Murray DM. Nutrition education in
supermarkets: an unsuccessful attempt to influence knowledge and product sales. J Behav
Med 1982;5(2):189-200.
135
26. Ernst ND, Wu M, Frommer P, Katz E, Matthews O, Moskowitz J, Pinsky JL, Pohl S,
Schreiber GB, Sondik E. Nutrition education at the point of purchase: the foods for health
project evaluated. Prev Med 1986;15(1):60-73.
27. Mayer JA, Dubbert PM, Elder JP. Promoting nutrition at the point of choice: a review.
Health Educ Behav 1989;16(1):31-43.
28. Steenhuis I, van Assema P, van Breukelen G, Glanz K. The effectiveness of nutrition
education and labeling in Dutch supermarkets. Am J Health Promot 2004;18(3):221-4.
29. Olson CM, Bisogni CA, Thonney PF. Evaluation of a supermarket nutrition education
program. J Nutr Educ 1982;14(4):141-5.
30. Kristal AR, Goldenhar L, Muldoon J, Morton RF. Evaluation of a supermarket
intervention to increase consumption of fruits and vegetables. Am J Health Promot
1997;11(6):422-5.
31. Hawkes C. Sales promotions and food consumption. Nutr Rev 2009;67(6):333-42.
32. Gittelsohn J, Rowan M, Gadhoke P. Interventions in small food stores to change the food
environment, improve diet, and reduce risk of chronic disease. Prev Chronic Dis 2012;9.
33. Geliebter A, Ang IY, Bernales-Korins M, Hernandez D, Ochner CN, Ungredda T, Miller
R, Kolbe L. Supermarket discounts of low-energy density foods: Effects on purchasing,
food intake, and body weight. Obesity 2013;17(10):20484.
34. Ng SW, Popkin BM. Monitoring foods and nutrients sold and consumed in the United
States: dynamics and challenges. J Acad Nutr Diet 2012;112(1):41.
35. Sutherland LA, Kaley LA, Fischer L. Guiding stars: the effect of a nutrition navigation
program on consumer purchases at the supermarket. Am J Clin Nutr 2010;91(4):1090S-
4S.
36. An R, Patel D, Segal D, Sturm R. Eating better for less: a national discount program for
healthy food purchases in South Africa. Am J Health Behav 2013;37(1):56.
37. Lambert EV, Kolbe‐Alexander TL. Innovative Strategies Targeting Obesity and
Non‐communicable Diseases in South Africa: What Can We Learn from the Private
Health Care Sector? Obesity Rev 2013.
38. Sturm R, An R, Segal D, Patel D. A Cash-Back Rebate Program for Healthy Food
Purchases in South Africa: Results from Scanner Data. Am J Prev Med 2013;44(6):567-
72.
136
39. Brinkman H-J, de Pee S, Sanogo I, Subran L, Bloem MW. High food prices and the
global financial crisis have reduced access to nutritious food and worsened nutritional
status and health. J Nutr 2010;140(1):153S-61S.
40. Bernstein AM, Bloom DE, Rosner BA, Franz M, Willett WC. Relation of food cost to
healthfulness of diet among US women. Am J Clin Nutr 2010;92(5):1197-203.
41. Monsivais P, Drewnowski A. The rising cost of low-energy-density foods. J Am Diet
Assoc 2007;107(12):2071-6.
42. Beatty TK, Senauer B. The New Normal? U.S. Food Expenditure Patterns and the
Changing Structure of Food Retailing. Am J Agric Econ 2012.
43. Ng SW, Annis I, Guilkey D, Popkin BM. The Great Recession and purchase of consumer
packaged foods and beverages among US households. Working paper. Chapel Hill, NC:
UNC Food Research Program.
44. Slining MM, Mathias KC, Popkin BM. Trends in Food and Beverage Sources among US
Children and Adolescents: 1989-2010. J Acad Nutr Diet 2013;2(13):00679-5.
45. Ford ES, Dietz WH. Trends in energy intake among adults in the United States: findings
from NHANES. Am J Clin Nutr 2013;97:848-53.
46. Ng SW, Popkin BM. The Healthy Weight Commitment Foundation Marketplace
Commitment and Consumer Packaged Goods purchased by US households with children.
Am J Prev Med 2014;47(4):520-30.
47. Kentucky.Com. Internet: http://www.kentucky.com/2010/03/03/1165084/kroger-stores-
begin-testing-nutritional.html (accessed November 2013).
48. City of Boston. Press Release: Mayor Menino and Boston's biggest supermarkets launch
partnership to promote healthy beverages. 2013.
49. Carpenter JM, Moore M. Consumer demographics, store attributes, and retail format
choice in the US grocery market. IJRRBP 2006;34(6):434-52.
50. Hausman J, Leibtag E. Consumer benefits from increased competition in shopping
outlets: Measuring the effect of Wal‐Mart. Journal of Applied Econometrics
2007;22(7):1157-77.
51. Marmorstein H, Grewal D, Fishe RP. The value of time spent in price-comparison
shopping: survey and experimental evidence. J Consum Res 1992:52-61.
52. Kim B-D, Park K. Studying patterns of consumer's grocery shopping trip. J Retailing
1998;73(4):501-17.

137
53. Tang CS, Bell DR, Ho T-H. Store choice and shopping behavior: how price format
works. Calif Manage Rev 2001;43(2):56-74.
54. Bell DR, Ho T-H, Tang CS. Determining where to shop: fixed and variable costs of
shopping. J Marketing Res 1998:352-69.
55. Fox EJ, Montgomery AL, Lodish LM. Consumer Shopping and Spending Across Retail
Formats. J Bus 2004;77(S2):S25-S60.
56. Bell DR, Lattin JM. Shopping behavior and consumer preference for store price format:
Why “large basket” shoppers prefer EDLP. Market Sci 1998;17(1):66-88.
57. Gustafson A, Hankins S, Jilcott S. Measures of the Consumer Food Store Environment:
A Systematic Review of the Evidence 2000-2011. J Community Health 2012;37(4):897-
911. doi: 10.1007/s10900-011-9524-x.
58. Larson NI, Story MT, Nelson MC. Neighborhood environments: disparities in access to
healthy foods in the US. Am J Prev Med 2009;36(1):74-81. e10.
59. Baker EA, Schootman M, Barnidge E, Kelly C. Peer reviewed: The role of race and
poverty in access to foods that enable individuals to adhere to dietary guidelines. Prev
Chronic Dis 2006;3(3).
60. Wang Y, Chen X. How much of racial/ethnic disparities in dietary intakes, exercise, and
weight status can be explained by nutrition-and health-related psychosocial factors and
socioeconomic status among US adults? J Am Diet Assoc 2011;111(12):1904-11.
61. Dubowitz T, Heron M, Bird CE, Lurie N, Finch BK, Basurto-Dávila R, Hale L, Escarce
JJ. Neighborhood socioeconomic status and fruit and vegetable intake among whites,
blacks, and Mexican Americans in the United States. Am J Clin Nutr 2008;87(6):1883-
91.
62. Hiza HA, Casavale KO, Guenther PM, Davis CA. Diet quality of Americans differs by
age, sex, race/ethnicity, income, and education level. J Acad Nutr Diet 2013;113(2):297-
306.
63. Wang DD, Leung CW, Li Y, Ding EL, Chiuve SE, Hu FB, Willett WC. Trends in dietary
quality among adults in the United States, 1999 through 2010. JAMA Intern Med
2014;174(10):1587-95.
64. Steenhuis IH, Waterlander WE, de Mul A. Consumer food choices: the role of price and
pricing strategies. Public Health Nutr 2011;14(12):2220-6.
65. Walters R, Jamil M. Measuring cross-category specials purchasing: theory, empirical
results, and implications. JMFM 2002;5(1):25-42.

138
66. Bartlett RW. Fluid Milk Sales as Related to Demand Elasticities. J Dairy Sci
1964;47(12):1314-21.
67. Huang KS, Lin B-H. Estimation of food demand and nutrient elasticities from household
survey data: US Department of Agriculture, Economic Research Service, 2000.
68. Park JL, Holcomb RB, Raper KC, Capps O. A demand systems analysis of food
commodities by US households segmented by income. Am J Agric Econ 1996;78(2):290-
300.
69. Gould BW, Cox TL, Perali F. The demand for fluid milk products in the US: a demand
systems approach. Western J Agr Econ 1990:1-12.
70. Vyth EL, Steenhuis IH, Vlot JA, Wulp A, Hogenes MG, Looije DH, Brug J, Seidell JC.
Actual use of a front-of-pack nutrition logo in the supermarket: consumers’ motives in
food choice. Public Health Nutr 2010;13(11):1882.
71. Nguyen BT, Shuval K, Njike VY, Katz DL. The Supplemental Nutrition Assistance
Program and Dietary Quality Among US Adults: Findings From a Nationally
Representative Survey. Mayo Clin Proc 2014;89(9):1211-9.
72. Bleich SN, Vine S, Wolfson JA. American adults eligible for the Supplemental
Nutritional Assistance Program consume more sugary beverages than ineligible adults.
Prev Med 2013;57(6):894-9.
73. Leung CW, Ding EL, Catalano PJ, Villamor E, Rimm EB, Willett WC. Dietary intake
and dietary quality of low-income adults in the Supplemental Nutrition Assistance
Program. Am J Clin Nutr 2012;96(5):977-88.
74. Hofler M. Causal inference basedon counterfactuals. BMC Med Res Methodol
2005;5(1):28.
75. Robins J. Causal inference from complex longitudinal data. Edtion ed. In: Berkane M, ed.
Latent Variable Modeling and Applications to Causality: Lecture Notes in Statistics 120.
New York: Springer-Verlag, 1997:69-117.
76. Robins JM, Hernán MÁ, Brumback B. Marginal structural models and causal inference
in epidemiology. Epidemiology 2000;11(5):550-60.
77. Wal-Mart Stores Inc. Internet: http://corporate.walmart.com/global-responsibility/hunger-
nutrition/our-commitments (accessed October 2013).
78. Wal-mart Stores Inc. Internet: http://corporate.walmart.com/global-responsibility/hunger-
nutrition/great-for-you (accessed October 2013).
79. Wal-mart Stores Inc. Walmart 2013 Annual Report. 2013.

139
80. Banjo S, Gasparro A. Retailers Brace for Reduction in Food Stamps. Wall Street Journal
2013. Internet:
http://online.wsj.com/news/articles/SB10001424052702303843104579168011245171266
accessed Date Accessed)|.
81. Morland K, Wing S, Roux AD. The contextual effect of the local food environment on
residents' diets: the atherosclerosis risk in communities study. Am J Public Health
2002;92(11):1761-8.
82. Story M, Kaphingst KM, Robinson-O'Brien R, Glanz K. Creating healthy food and eating
environments: policy and environmental approaches. Annu Rev Public Health
2008;29:253-72.
83. Poti JM, Slining MM, Popkin BM. Where Are Kids Getting Their Empty Calories?
Stores, Schools, and Fast-Food Restaurants Each Played an Important Role in Empty
Calorie Intake among US Children During 2009-2010. J Acad Nutr Diet
2013;4(13):01336-1.
84. Roodenburg A, Popkin B, Seidell J. Development of international criteria for a front of
package nutrient profiling system: international Choices Programme. Eur J Clin Nutr
2011;65(11):1190-200.
85. Sacks G, Rayner M, Swinburn B. Impact of front-of-pack 'traffic-light' nutrition labelling
on consumer food purchases in the UK. Health Promot Int 2009;24(4):344-52.
86. Rayner M, Scarborough P, Kaur A. Nutrient profiling and the regulation of marketing to
children. Possibilities and pitfalls. Appetite 2013;62(0):232-5. doi:
http://dx.doi.org/10.1016/j.appet.2012.06.021.
87. IOM C. Examination of Front-of-Package Nutrition Rating Systems and Symbols: Phase
I Report. In: Wartella A, Lichtenstein A, Boon C, eds.: Institute of Medicine, 2010.
88. Vyth EL, Steenhuis IH, Roodenburg AJ, Brug J, Seidell JC. Front-of-pack nutrition label
stimulates healthier product development: a quantitative analysis. Int J Behav Nutr Phys
Act 2010;7:65.
89. Vyth EL, Steenhuis IH, Vlot JA, Wulp A, Hogenes MG, Looije DH, Brug J, Seidell JC.
Actual use of a front-of-pack nutrition logo in the supermarket: consumers' motives in
food choice. Public health nutrition 2010;13(11):1882-9.
90. Wartella EA, Lichtenstein AH, Boon CS, Editors, eds. Examination of Front-of-Package
Nutrition Rating Systems and Symbols: Phase 1 Report. Washington DC: National
Academy Press, 2010.
140
91. Cawley J, Sweeney MJ, Sobal J, Just DR, Kaiser HM, Schulze WD, Wethington E,
Wansink B. The impact of a supermarket nutrition rating system on purchases of
nutritious and less nutritious foods. Public Health Nutr 2014;FirstView:1-7.
92. Institute of Medicine, National Research Council. The public health effects of food
deserts: workshop summary. Washington, DC, 2009.
93. Bitler M, Haider SJ. An Economic View of Food Deserts in the United States. J Policy
Anal Manage;In press.
94. Cummins S, Macintyre S. Food deserts---evidence and assumption in health policy
making Br Med J 2002;325:436-38.
95. Walker RE, Keane CR, Burke JG. Disparities and access to healthy food in the United
States: A review of food deserts literature. Health Place 2010;16(5):876-84. doi:
http://dx.doi.org/10.1016/j.healthplace.2010.04.013.
96. Gordon C, Purciel-Hill M, Ghai NR, Kaufman L, Graham R, Van Wye G. Measuring
food deserts in New York City's low-income neighborhoods. Health Place
2011;17(2):696-700. doi: http://dx.doi.org/10.1016/j.healthplace.2010.12.012.
97. Holmes TJ. The diffusion of Wal-mart and economies of density. Econometrica
2011;79(1):253-302.
98. Walmart Inc. Internet: http://corporate.walmart.com/our-story/our-business/locations/.
99. Euromonitor International. Grocery Retailers in the US. 2013.
100. Artz GM, Stone KE. Analyzing the impact of Wal-Mart supercenters on local food store
sales. Am J Agr Econ 2006;88(5):1296-303.
101. Basker E. Job creation or destruction? Labor market effects of Wal-Mart expansion. Rev
Econ Stat 2005;87(1):174-83.
102. Goetz SJ, Rupasingha A. Wal-Mart and social capital. Am J Agric Econ
2006;88(5):1304-10.
103. Neumark D, Zhang J, Ciccarella S. The effects of Wal-Mart on local labor markets.
Journal of Urban Economics 2008;63(2):405-30.
104. Basker E. The causes and consequences of Wal-Mart's growth. J Econ Perspect
2007;21(3):177-98.
105. Drewianka S, Johnson D. Wal-Mart and Local Labor Markets, 1990-2004. University of
Wisconsin-Milwaukee Working Paper, 2006.

141
106. Volpe R, Okrent A, Leibtag E. The effect of supercenter-format stores on the
healthfulness of consumers’ grocery purchases. Am J Agric Econ 2013;95(3):568-89.
107. Nielsen Company. Internet: http://www.nielsen.com/us/en/nielsen-solutions/nielsen-
measurement/nielsen-retail-measurement.html (accessed April 2014).
108. Wal-Mart Stores Inc. Internet: corporate.walmart.com/our-story/our-business/walmart-us
May 2014).
109. Slining MM, Ng SW, Popkin BM. Food companies' calorie-reduction pledges to improve
U.S. diet. Am J Prev Med 2013;44(2):174-84.
110. Kleinbaum DG, Klein M. Modeling strategy for assessing interaction and confounding.
Edtion ed. Logistic Regression: Springer, 2010:203-39.
111. Williams RL. A note on robust variance estimation for cluster-correlated data. Biometrics
2000;56:645-6.
112. Rogers WH. Regression standard errors in clustered samples. Stata Technical Bulletin
1993;13:19-23.
113. Bustillos B, Sharkey JR, Anding J, McIntosh A. Availability of more healthful food
alternatives in traditional, convenience, and nontraditional types of food stores in two
rural Texas counties. J Am Diet Assoc 2009;109(5):883-9.
114. Kaufman PR, MacDonald JM, Lutz SM, Smallwood DM. Do the Poor Pay More for
Food? Item Selection and Price Differences Affect Low-Income Household Food Costs.
Food and Rural Economics Division, Economic Research Service, US Department of
Agriculture, 1997.
115. Basker E, Noel M. The Evolving Food Chain: Competitive Effects of Wal‐Mart's Entry
into the Supermarket Industry. J Econ Manag Strategy 2009;18(4):977-1009.
116. Volpe RJ, Lavoie N. The effect of Wal-Mart supercenters on grocery prices in New
England. Appl Econ Perspect Pol 2008;30(1):4-26.
117. Leibtag ES, Barker C, Dutko P. How much lower are prices at discount stores? An
examination of retail food prices. United States Department of Agriculture, Economic
Research Service, 2010.
118. Chou S-Y, Grossman M, Saffer H. An economic analysis of adult obesity: results from
the Behavioral Risk Factor Surveillance System. J Health Econ 2004;23(3):565-87.
119. Lakdawalla D, Philipson T. The growth of obesity and technological change: a theoretical
and empirical examination. National Bureau of Economic Research, 2002.

142
120. Drewnowski A. Obesity and the food environment: dietary energy density and diet costs.
Am J Prev Med 2004;27(3 Suppl):154.
121. Ludwig DS. Technology, diet, and the burden of chronic disease. JAMA
2011;305(13):1352-3. doi: 10.1001/jama.2011.380.
122. Monteiro CA, Levy RB, Claro RM, de Castro IR, Cannon G. Increasing consumption of
ultra-processed foods and likely impact on human health: evidence from Brazil. Public
Health Nutr 2011;14(1):5-13. doi: 10.1017/S1368980010003241.
123. Courtemanche C, Carden A. Supersizing supercenters? The impact of Walmart
Supercenters on body mass index and obesity. J Urban Econ 2011;69(2):165-81.
124. Jilcott SB, Keyserling T, Crawford T, McGuirt JT, Ammerman AS. Examining
associations among obesity and per capita farmers' markets, grocery stores/supermarkets,
and supercenters in US counties. J Am Diet Assoc 2011;111(4):567-72.
125. Martinez S, Hand M, Da Pra M, Pollack S, Ralston K, Smith T, Vogel S, Clark S, Lohr
L, Low S, et al. Local Food Systems: Concepts, Impacts, and Issues. US Department of
Agriculture, Economic Research Service, 2010.
126. Walmart Inc. Internet: http://corporate.walmart.com/global-responsibility/environment-
sustainability/sustainable-agriculture April 2014).
127. Harkinson J. Internet: http://www.motherjones.com/mojo/2013/11/walmart-targets-low-
income-consumers-junk-food May 2014).
128. United States Congress. Federal Agriculture Reform and Risk Management Act of 2013,
One Hundred Thirteenth Congress, Second Session, January 27, 2014. In: House of
Representatives Committee on Agriculture, ed. Washington: Government Printing Office,
2014.
129. Walmart. The 20th Annual Meeting for the Investment Community. 2013.
130. Hoch SJ, Kim B-D, Montgomery AL, Rossi PE. Determinants of store-level price
elasticity. Journal of Marketing Research 1995:17-29.
131. Sharkey JR, Horel S, Han D, Huber JC, Jr. Association between neighborhood need and
spatial access to food stores and fast food restaurants in neighborhoods of colonias. Int J
Health Geogr 2009;8(9):8-9.
132. Dean WR, Sharkey JR. Rural and urban differences in the associations between
characteristics of the community food environment and fruit and vegetable intake. J Nutr
Educ Behav 2011;43(6):426-33.

143
133. Kaufman PR. Measuring Access to Nutritious, Affordable Food: A National Assessment.
JFDR 2010;41(1).
134. Stiegert KW, Sharkey T. Food pricing, competition, and the emerging supercenter
format. Agribusiness 2007;23(3):295-312.
135. Balto DA. Supermarket merger enforcement. J Public Policy Mark 2001;20(1):38-50.
136. Davis DE. Prices, promotions, and supermarket mergers. JAFIO 2010;8(1).
137. Jabs J, Devine CM. Time scarcity and food choices: an overview. Appetite
2006;47(2):196-204. doi: 10.1016/j.appet.2006.02.014.
138. Seiders K, Simonides C, Tigert DJ. The impact of supercenters on traditional food
retailers in four markets. IJRRBP 2000;28(4/5):181-93.
139. Tropp D, Ragland E, Barham J. The Dynamics of Change in the US Food Marketing
Environment. Washington, DC: U.S. Department of Agriculture, 2008.
140. Cummins S, Petticrew M, Higgins C, Findlay A, Sparks L. Large scale food retailing as
an intervention for diet and health: quasi-experimental evaluation of a natural experiment.
J Epidemiol Community Health 2005;59(12):1035-40.
141. Smith LP, Ng SW, Popkin BM. The emerging role of Walmart in US packaged food
purchases: who shops there, how much is purchased, and public health implications.
Under review 2014.
142. Bonanno A, Goetz SJ. Food Store Density, Nutriton Education, Eating Habits and
Obesity. International Food and Agribusiness Management Review 2012;15(4):1-26.
143. Ng SW, Slining MM, Popkin BM. Turning point for US diets? Recessionary effects or
behavioral shifts in foods purchased and consumed. Am J Clin Nutr 2014;99(3):609-16.
144. Stern D, Ng SW, Popkin BM. Where do we shop? Understanding the nutrient profile of
US households packaged food purchases by type of store. In preparation 2014.
145. Bureau of Labor Statistics. Internet: http://www.bls.gov/lau/ June 2014).
146. Holmes TJ. The Diffusion of Wal‐Mart and Economies of Density. Econometrica
2011;79(1):253-302.
147. Holmes TJ. Internet:
http://www.econ.umn.edu/~holmes/data/WalMart/store_openings.html June 2014).
148. AggData. Internet: http://www.aggdata.com/aggdata/complete-list-walmart-locations
June 2014).

144
149. United States Census Bureau. Internet: http://www.census.gov/popest/data/ June 2014).
150. Hogan JW, Lancaster T. Instrumental variables and inverse probability weighting for
causal inference from longitudinal observational studies. Stat Methods Med Res
2004;13(1):17-48.
151. Cole SR, Hernán MA. Constructing inverse probability weights for marginal structural
models. Am J Epidemiol 2008;168(6):656-64.
152. Seaman SR, White IR. Review of inverse probability weighting for dealing with missing
data. Stat Methods Med Res 2013;22(3):278-95.
153. Greenland S. Modeling and variable selection in epidemiologic analysis. Am J Public
Health 1989;79(3):340-9.
154. Weng H-Y, Hsueh Y-H, Messam LLM, Hertz-Picciotto I. Methods of covariate selection:
directed acyclic graphs and the change-in-estimate procedure. Am J Epidemiol
2009;169(10):1182-90.
155. Greenland S, Pearl J, Robins JM. Causal diagrams for epidemiologic research.
Epidemiology 1999;10(1):37-48.
156. U.S. Department of Agriculture and U.S. Department of Health and Human Services.
Dietary Guidelines for Americans, 2010. 7th ed. Washington, D.C., 2010:1-91.
157. Prentice AM, Jebb SA. Fast foods, energy density and obesity: a possible mechanistic
link. Obesity Rev 2003;4(4):187-94.
158. Agriculture USDo, Services USDoHaH. Dietary Guidelines for Americans, 2010. 7th ed.
Washington, DC, 2010.
159. Ng SW, Slining MM, Popkin BM. The Healthy Weight Commitment Foundation
Marketplace Commitment and Consumer Packaged Goods purchased by US households
with children Am J Prev Med 2014;47(4):520-30.
160. Ng SW, Slining MM, Popkin BM. The healthy weight commitment foundation pledge:
calories sold from U.S. Consumer packaged goods, 2007-2012. Am J Prev Med
2014;47(4):508-19.
161. Bower KM, Thorpe Jr RJ, Rohde C, Gaskin DJ. The intersection of neighborhood racial
segregation, poverty, and urbanicity and its impact on food store availability in the
United States. Prev Med 2014;58:33-9.
162. Zhen C, Taylor JL, Muth MK, Leibtag E. Understanding differences in self-reported
expenditures between household scanner data and diary survey data: a comparison of
145
Homescan and consumer expenditure survey. Appl Econ Perspect Pol 2009;31(3):470-
92.
163. Akin JS, Guilkey DK, Popkin BM. The school lunch program and nutrient intake: A
switching regression analysis. Am J Agric Econ 1983;65(3):477-85.
164. Dötsch M, Busch J, Batenburg M, Liem G, Tareilus E, Mueller R, Meijer G. Strategies to
reduce sodium consumption: a food industry perspective. Crc Cr Rev Food Sci
2009;49(10):841-51.
165. Ford CN, Ng SW, Popkin BM. Are food and beverage purchases in households with
preschoolers changing?: a longitudinal analysis from 2000 to 2011. Am J Prev Med
2014;47(3):275-82.
166. Kit BK, Fakhouri TH, Park S, Nielsen SJ, Ogden CL. Trends in sugar-sweetened
beverage consumption among youth and adults in the United States: 1999-2010. Am J
Clin Nutr 2013;98(1):180-8.
167. Piernas C, Ng S, Popkin B. Trends in purchases and intake of foods and beverages
containing caloric and low‐calorie sweeteners over the last decade in the United States.
Pediatr Obes 2013.
168. Mozaffarian D. The Healthy Weight Commitment Foundation Trillion Calorie Pledge:
Lessons from a Marketing Ploy? Am J Prev Med 2014;47(4):e9-e10.
169. Marcason W. What are the new national school lunch and breakfast program nutrition
standards? J Acad Nutr Diet 2012;112(7):017.
170. Ohri-Vachaspati P, Turner L, Chaloupka FJ. Fresh Fruit and Vegetable Program
participation in elementary schools in the United States and availability of fruits and
vegetables in school lunch meals. J Acad Nutr Diet 2012;112(6):921-6.
171. Bassett MT, Dumanovsky T, Huang C, Silver LD, Young C, Nonas C, Matte TD,
Chideya S, Frieden TR. Purchasing behavior and calorie information at fast-food chains
in New York City, 2007. Am J Public Health 2008;98(8):1457-9.
172. Bonanno A, Goetz SJ. Adult Obesity and Food Stores’ Density–Evidence from State-
Level Panel Data. Agricultural and Applied Economics Association, Denver, CO 2010.
173. Lusk JL, Brooks K. Who Participates in Household Scanning Panels? Am J Agric Econ
2011;93(1):226-40.
174. Einav L, Leibtag E, Nevo A. Not-so-classical measurement errors: a validation study of
Homescan. National Bureau of Economic Research, 2008.

146
175. Einav L, Leibtag E, Nevo A. Recording discrepancies in Nielsen Homescan data: Are
they present and do they matter? QME 2010;8(2):207-39.
176. Spinner J. Internet: http://www.foodproductiondaily.com/Markets/Food-packaging-
reflects-trends-in-fresh-products October 2014).
177. Partnership for a Healthier America. Internet: http://ahealthieramerica.org/our-partners/
November 2014).
178. Hu FB. Dietary pattern analysis: a new direction in nutritional epidemiology. Curr Opin
Lipidol 2002;13(1):3-9.
179. Calton EK, James AP, Pannu PK, Soares MJ. Certain dietary patterns are beneficial for
the metabolic syndrome: reviewing the evidence. Nutr Res 2014;34(7):559-68.
180. Steffen LM, Van Horn L, Daviglus ML, Zhou X, Reis JP, Loria CM, Jacobs DR, Duffey
KJ. A modified Mediterranean diet score is associated with a lower risk of incident
metabolic syndrome over 25 years among young adults: the CARDIA (Coronary Artery
Risk Development in Young Adults) study. Br J Nutr 2014;19:1-8.
181. Jacobs S, Harmon BE, Boushey CJ, Morimoto Y, Wilkens LR, Le Marchand L, Kroger J,
Schulze MB, Kolonel LN, Maskarinec G. A priori-defined diet quality indexes and risk
of type 2 diabetes: the Multiethnic Cohort. Diabetologia 2014;16:16.
182. Rose D, Hutchinson PL, Bodor JN, Swalm CM, Farley TA, Cohen DA, Rice JC.
Neighborhood food environments and Body Mass Index: the importance of in-store
contents. Am J Prev Med 2009;37(3):214-9.
183. Morland K, Wing S, Diez Roux A, Poole C. Neighborhood characteristics associated
with the location of food stores and food service places. Am J Prev Med 2002;22(1):23-9.
184. Galvez MP, Morland K, Raines C, Kobil J, Siskind J, Godbold J, Brenner B. Race and
food store availability in an inner-city neighbourhood. Public Health Nutr
2008;11(6):624-31.
185. Powell LM, Slater S, Mirtcheva D, Bao Y, Chaloupka FJ. Food store availability and
neighborhood characteristics in the United States. Prev Med 2007;44(3):189-95.
186. Bodor JN, Rice JC, Farley TA, Swalm CM, Rose D. The association between obesity and
urban food environments. J Urban Health 2010;87(5):771-81.