cambodia msme project final monitoring … cambodia msme strengthening project final monitoring and...
TRANSCRIPT

CAMBODIA MSME PROJECT
FINAL MONITORING AND EVALUATION
REPORT
OCTOBER, 2008
This publication was produced for review by the United States Agency for International Development. It was prepared by Indochina Research Limited (IRL) for USAID funded Cambodia MSME Project implemented by DAI.

USAID-Funded Cambodia MSME Strengthening Project Final Monitoring And Evaluation Survey 2008 2
Cambodia Micro, Small and Medium-sized Enterprise (MSME) Strengthening Project
Contract Number: GEG-1-000-0200014-00
Implemented by Development Alternatives, Inc. (DAI)
The authors’ views expressed in this publication do not necessarily reflect the views of the United States Agency for International Development or the United States Government.

USAID-Funded Cambodia MSME Strengthening Project Final Monitoring And Evaluation Survey 2008 3
TABLE OF CONTENTS
1. SUMMARY RESULTS ...............................................................................................................................................11
1.1. MSME INDICATOR FRAMEWORK TARGETS AND ACTUAL RESULTS IN 2008 ........................................................11 1.2. MSME INDICATOR FRAMEWORK RESULTS BY COMPONENT, BASELINE TO FINAL EVALUATION 2008.................15 1.3. AGGREGATE MSME PROJECT ECONOMIC IMPACTS ON ENTERPRISES AND THE ECONOMY IN 2008......................21
2. BACKGROUND, OBJECTIVES AND METHODOLOGY....................................................................................24
1.4. BACKGROUND AND OBJECTIVES OF RESEARCH ....................................................................................................24 1.5. METHODOLOGY.....................................................................................................................................................25 1.6. ANALYSIS AND DATA LIMITATIONS ......................................................................................................................27
3. STUDY RESULTS.......................................................................................................................................................27
2. PIG VALUE CHAIN -PIG PRODUCERS ................................................................................................................28
2.1. DEMOGRAPHIC PROFILE........................................................................................................................................28 2.2. PROJECT COLLABORATION & TRAINING BENEFITS ...............................................................................................28 2.3. IMPACTS ON NEW CAPITAL INVESTMENTS & CREDIT, GROSS SALES VOLUME & REVENUE, COST OF PRODUCTION
& GROSS PROFIT .................................................................................................................................................................30 2.4. IMPACT ON LABOR EMPLOYMENT & BUSINESS SERVICE UTILIZATION.................................................................34 2.5. BUSINESS PRODUCTIVITY IMPACTS.......................................................................................................................35 2.6. PERCEIVED LINKS TO POVERTY ALLEVIATION......................................................................................................38 2.7. IMPACT ON BUSINESS ACCOUNTING & BUSINESS POLICY ADVOCACY.................................................................39
3. PIG VALUE CHAIN -VETERINARIANS................................................................................................................39
3.1. DEMOGRAPHIC PROFILE........................................................................................................................................40 3.2. PROJECT COLLABORATION & TRAINING BENEFITS ...............................................................................................40 3.3. IMPACTS ON NEW CAPITAL INVESTMENTS & CREDIT, GROSS SALES VOLUME & REVENUE, COST OF PRODUCTION
& GROSS PROFIT, ................................................................................................................................................................43 3.4. IMPACTS ON LABOR EMPLOYMENT & BUSINESS SERVICE UTILIZATION ...............................................................46 3.5. BUSINESS PRODUCTIVITY IMPACTS.......................................................................................................................46 3.6. PERCEIVED LINKS TO POVERTY ALLEVIATION......................................................................................................46 3.7. IMPACT ON BUSINESS ACCOUNTING & BUSINESS POLICY ADVOCACY.................................................................46 3.8. DEMOGRAPHIC PROFILE........................................................................................................................................47 3.9. PROJECT COLLABORATION & TRAINING BENEFITS ...............................................................................................47 3.10. IMPACTS ON NEW CAPITAL INVESTMENTS & CREDIT, GROSS SALES VOLUMES & REVENUE, COSTS OF
PRODUCTION & GROSS PROFITS, .........................................................................................................................................51 3.11. IMPACTS ON LABOR EMPLOYMENT & BUSINESS SERVICE UTILIZATION ...............................................................54 3.12. BUSINESS PRODUCTIVITY IMPACTS.......................................................................................................................54 3.13. PERCEIVED LINKS TO POVERTY ALLEVIATION......................................................................................................54
USAID-Funded Cambodia MSME Strengthening Project Final Monitoring And Evaluation Survey 2008 4
3.14. IMPACTS ON BUSINESS ACCOUNTING & BUSINESS POLICY ADVOCACY ...............................................................55
4. PIG VALUE CHAIN - MSME TECHNOLOGY/BENEFITS SPREAD TO NON-PROJECT PIG PRODUCERS ........................................................................................................................................................................55
4.1. DEMOGRAPHIC PROFILE........................................................................................................................................55 4.2. IMPROVED PIG TECHNOLOGY AWARENESS & TRAINING AMONG NON-PROJECT PRODUCERS..............................56 4.3. COMPARATIVE PIG PRODUCTION ENTERPRISE CHARACTERISTICS: NON-PROJECT PIG PRODUCERS VERSUS
MSME PIG PRODUCERS ......................................................................................................................................................58
5. FISH VALUE CHAIN - FISH PRODUCERS...........................................................................................................60
5.1. DEMOGRAPHIC PROFILE........................................................................................................................................60 5.2. PROJECT COLLABORATION & TRAINING BENEFITS ...............................................................................................61 5.3. IMPACT ON NEW CAPITAL INVESTMENTS & CREDIT, GROSS SALES VOLUME & REVENUE, COST OF PRODUCTION
& GROSS PROFIT .................................................................................................................................................................62 5.4. IMPACTS ON LABOR EMPLOYMENT .......................................................................................................................67 5.5. BUSINESS PRODUCTIVITY IMPACTS.......................................................................................................................67 5.6. PERCEIVED LINKS TO POVERTY ALLEVIATION......................................................................................................68 5.7. IMPACTS ON BUSINESS ACCOUNTING & BUSINESS POLICY ADVOCACY ...............................................................69
6. FISH VALUE CHAIN - MSME TECHNOLOGY/BENEFITS SPREAD TO NON-PROJECT FISH PRODUCERS ........................................................................................................................................................................69
6.1. DEMOGRAPHIC PROFILE........................................................................................................................................69 6.2. IMPROVED FISH TECHNOLOGY AWARENESS & TRAINING AMONG NON-PROJECT PRODUCERS ............................70 6.3. COMPARATIVE FISH PRODUCTION ENTERPRISE CHARACTERISTICS: NON-PROJECT FISH PRODUCERS VERSUS
MSME FISH PRODUCERS ....................................................................................................................................................72
7. BRICK AND TILE MAKERS....................................................................................................................................74
7.1. DEMOGRAPHIC PROFILE........................................................................................................................................74 7.2. PROJECT COLLABORATION & TRAINING BENEFITS ...............................................................................................74 7.3. IMPACTS ON NEW CAPITAL INVESTMENTS & CREDIT, GROSS SALES VOLUMES & REVENUE, COSTS OF
PRODUCTION & GROSS PROFITS, .........................................................................................................................................75 7.4. IMPACTS ON LABOR EMPLOYMENT .......................................................................................................................80 7.5. BUSINESS PRODUCTIVITY IMPACTS.......................................................................................................................81 7.6. PERCEIVED LINKS TO POVERTY ALLEVIATION......................................................................................................81 7.7. IMPACTS ON BUSINESS ACCOUNTING & BUSINESS POLICY ADVOCACY ...............................................................82
8. CONCLUSIONS ..........................................................................................................................................................83
9. ANNEX .........................................................................................................................................................................84
9.1. STUDY BACKGROUND TABLES ....................................................................................................................84 9.2. PIG VALUE CHAIN-PIG PRODUCERS TABLES ............................................................................................84 9.3. PIG VALUE CHAIN- PIG INPUT SUPPLIERS TABLES................................................................................101 9.4. FISH VALUE CHAIN-FISH PRODUCERS TABLES......................................................................................108 9.5. BRICK & TILE VALUE CHAIN- BRICK & TILE MAKERS TABLES ..........................................................111

USAID-Funded Cambodia MSME Strengthening Project Final Monitoring And Evaluation Survey 2008 5
Tables
TABLE 1 SUMMARY RESULTS: PROJECT INDICATOR FRAMEWORK TARGET AND ACTUAL RESULTS 2008 ...............................12 TABLE 2 SUMMARY RESULTS: PROJECT INDICATOR FRAMEWORK COMPONENT 1A ................................................................15 TABLE 3 SUMMARY RESULTS: PROJECT INDICATOR FRAMEWORK COMPONENT 1B.................................................................16 TABLE 4 SUMMARY RESULTS: PROJECT INDICATOR FRAMEWORK COMPONENT 2...................................................................18 TABLE 5 SUMMARY RESULTS: PROJECT INDICATOR FRAMEWORK COMPONENT 3...................................................................19 TABLE 6 SUMMARY RESULTS: PROJECT INDICATOR FRAMEWORK COMPONENT 4...................................................................21 TABLE 7 SUMMARY RESULTS: AGGREGATE MSME PROJECT ECONOMIC IMPACTS ON CAPITAL INVESTMENTS......................21 TABLE 8 SUMMARY RESULTS: AGGREGATE MSME PROJECT ECONOMIC IMPACTS BY INCREASED VALUE OF SALES.............22 TABLE 9 MSME EVALUATION 2008 TOTAL SAMPLE STRUCTURE ...........................................................................................26 TABLE 10 PIG ENTERPRISES: MONTHS SINCE JOINING THE MSME PROJECT ............................................................................28 TABLE 11 PIG PRODUCERS: MEAN VALUE OF NEW INVESTMENTS SINCE JOINING THE MSME PROJECT (USD) ......................30 TABLE 12 PIG PRODUCERS: COST OF PIG PRODUCTION FOR THE YEAR 2007-2008 (USD) .......................................................31 TABLE 13 PIG PRODUCERS: NUMBER OF HEAD SOLD IN THE YEAR 2007-2008 ........................................................................32 TABLE 14 PIG PRODUCERS: GROSS SALES REVENUE 2007-2008 (USD) ..................................................................................33 TABLE 15 PIG PRODUCERS: GROSS PROFIT DURING PROJECT 2007-2008 & PRE-PROJECT (USD) ..........................................33 TABLE 16 PIG PRODUCERS: HOUSEHOLD LABOR EMPLOYMENT DURING PROJECT 2008 (PERSONS) .......................................34 TABLE 17 PIG PRODUCERS: SERVICE PROVIDER UTILIZATION RATES PRE-PROJECT & DURING PROJECT 2008. .....................35 TABLE 18 VETERINARIANS: NUMBER OF MONTHS WORKING WITH THE MSME PROJECT.......................................................40 TABLE 19 VETERINARIANS: SPECIFIC GOODS & SERVICES PROVIDED. ....................................................................................41 TABLE 20 VETERINARIANS: MEAN ENTERPRISE NEW INVESTMENTS SINCE JOINING THE MSME PROJECT (USD). ................43 TABLE 21 VETERINARIANS: COSTS OF BUSINESS MAY 2007 TO APRIL 2008 (USD). ...............................................................44 TABLE 22 VETERINARIANS: VOLUME OF SALES/NUMBER OF CUSTOMERS MAY 2007-APRIL 2008. .......................................44 TABLE 23 VETERINARIANS: GROSS SALES REVENUE MAY 2007-APRIL 2008..........................................................................45 TABLE 24 VETERINARIANS: GROSS PROFIT DURING PROJECT 2008 & PRE-PROJECT...............................................................45 TABLE 25 INPUT SUPPLIERS: DURATION OF COLLABORATION WITH THE MSME PROJECT.......................................................47 TABLE 26 INPUT SUPPLIERS: SPECIFIC GOODS & SERVICES PROVIDED....................................................................................48 TABLE 27 INPUT SUPPLIERS: MEAN ENTERPRISE NEW INVESTMENTS SINCE JOINING THE MSME PROJECT (USD). ...............51 TABLE 28 INPUT SUPPLIERS: COSTS OF BUSINESS MAY 2007 TO APRIL 2008 (USD)...............................................................52 TABLE 29 INPUT SUPPLIERS: VOLUME OF SALES/NUMBER OF CUSTOMERS MAY 2007-APRIL 2008. ......................................52 TABLE 30 INPUT SUPPLIERS: GROSS SALES REVENUE MAY 2007-APRIL 2008. .......................................................................53 TABLE 31 INPUT SUPPLIERS: GROSS PROFIT DURING PROJECT 2008 & PRE-PROJECT. ............................................................53 TABLE 32 NON-PROJECT PIG PRODUCER BENEFITS SPREAD SURVEY: KNOWLEDGE & ADOPTION RATES OF IMPROVED PIG
ENTERPRISE TECHNOLOGIES...........................................................................................................................................57 TABLE 33 NON-PROJECT PIG PRODUCER BENEFITS SPREAD SURVEY: HOW THEY LEARNED ABOUT IMPROVED PIG
ENTERPRISE TECHNOLOGIES...........................................................................................................................................58 TABLE 34 NON-PROJECT PIG PRODUCER BENEFITS SPREAD SURVEY: COMPARATIVE ENTERPRISE CHARACTERISTICS NON-
PROJECT PIG PRODUCERS VERSUS MSME PIG PRODUCERS............................................................................................59 TABLE 35 FISH PRODUCERS: MONTHS SINCE JOINING THE MSME PROJECT ............................................................................61 TABLE 36 FISH PRODUCERS: MEAN VALUE OF NEW INVESTMENTS SINCE JOINING THE MSME PROJECT (USD).....................62 TABLE 37 FISH PRODUCERS: COST OF FISH PRODUCTION 2008 (USD) ....................................................................................63 TABLE 38 FISH PRODUCERS: MATURE FISH SALES VOLUMES TOTAL & BY PROVINCE 2008 ..................................................64 TABLE 39 FISH PRODUCERS: MATURE FISH SALES VOLUMES TOTAL & BY PROVINCE PRE- PROJECT ....................................64
USAID-Funded Cambodia MSME Strengthening Project Final Monitoring And Evaluation Survey 2008 6
TABLE 40 FISH PRODUCERS: GROSS SALES REVENUE TOTAL & BY PROVINCE 2008 (USD) ...................................................65 TABLE 41 FISH PRODUCERS: GROSS PROFIT 2008 & PRE-PROJECT (USD) ..............................................................................66 TABLE 42 FISH PRODUCERS: HOUSEHOLD LABOR EMPLOYMENT DURING PROJECT 2008 (PERSONS) ......................................67 TABLE 43 FISH PRODUCERS: PRODUCTIVITY INDICATORS PRE-PROJECT & DURING PROJECT 2008 ........................................68 TABLE 44 NON-PROJECT FISH PRODUCER BENEFITS SPREAD SURVEY: KNOWLEDGE & ADOPTION RATES OF IMPROVED FISH
ENTERPRISE TECHNOLOGIES...........................................................................................................................................71 TABLE 45 NON-PROJECT FISH PRODUCER BENEFITS SPREAD SURVEY: HOW THEY LEARNED ABOUT IMPROVED FISH
ENTERPRISE TECHNOLOGIES...........................................................................................................................................71 TABLE 46 NON-PROJECT FISH PRODUCER BENEFITS SPREAD SURVEY: COMPARATIVE ENTERPRISE CHARACTERISTICS: NON-
PROJECT FISH PRODUCERS VERSUS MSME FISH PRODUCERS ........................................................................................72 TABLE 47 BRICK & TILE MAKERS: MONTHS SINCE JOINING THE MSME PROJECT...................................................................74 TABLE 48 BRICK & TILE MAKERS: MEAN VALUE OF NEW INVESTMENTS SINCE JOINING THE MSME PROJECT (USD)...........76 TABLE 49 BRICK & TILE MAKERS: MEAN VALUE OF NEW INVESTMENTS BY TYPE (USD) .....................................................76 TABLE 50 BRICK & TILE MAKERS: COST OF PRODUCTION FOR THE YEAR 2008 (USD) ...........................................................76 TABLE 51 BRICK & TILE MAKERS: SALES VOLUMES 2008 ......................................................................................................78 TABLE 52 BRICK & TILE MAKERS: GROSS SALES REVENUE 2008 (USD)................................................................................79 TABLE 53 BRICK & TILE MAKERS: GROSS PROFIT 2008 & PRE-PROJECT (USD).....................................................................79 TABLE 54 BRICK & TILE MAKERS: HIRED LABOR EMPLOYMENT BY ENTERPRISE 2008 (PERSONS).........................................80 TABLE 55 BRICK & TILE MAKERS: HIRED LABOR EMPLOYMENT TOTALS PRE-PROJECT & 2008 (PERSONS) ..........................81 TABLE 56 BRICK & TILE MAKERS: PRODUCTIVITY INDICATORS PRE-PROJECT & DURING PROJECT 2008 ..............................81 TABLE A57 TOTAL NUMBER OF DAI MSME CLIENTS AT APRIL 2008 ....................................................................................84 TABLE A58 PIG PRODUCERS: NUMBER & GENDER BY PROVINCE............................................................................................84 TABLE A59 PIG PRODUCERS: EDUCATION LEVEL BY PROVINCE..............................................................................................84 TABLE A60 PIG PRODUCERS: AGE & PIG RAISING EXPERIENCE ..............................................................................................85 TABLE A61 PIG PRODUCERS: HOUSEHOLD MEMBERS .............................................................................................................85 TABLE A62 PIG PRODUCERS: MSME PROJECT FACILITATED TRAININGS................................................................................85 TABLE A63 PIG PRODUCERS: GENDER BREAKDOWN OF MSME PROJECT FACILITATED TRAINING.........................................86 TABLE A64 PIG PRODUCERS: REPORTED VALUE CHAIN DIVERSIFICATION AFTER MSME PROJECT FACILITATED TRAINING.86 TABLE A65 PIG PRODUCERS: VALUES OF FIXED CAPITAL INVESTMENTS SINCE JOINING THE PROJECT (USD) .......................86 TABLE A66 PIG PRODUCERS: FIXED CAPITAL INVESTMENTS SINCE JOINING THE PROJECT (QUANTITIES) ..............................87 TABLE A67 PIG PRODUCERS: PIG STOCK IN MAY 2007 (HEAD)...............................................................................................87 TABLE A68 PIG PRODUCERS: PIG STOCK VALUE IN MAY 2007 (USD)....................................................................................87 TABLE A69 MSME PIG PRODUCERS: PIG STOCK VALUE ONE YEAR BEFORE JOINING THE PROJECT (USD)...........................87 TABLE A70 PIG PRODUCERS: COST OF PIG PRODUCTION ONE YEAR BEFORE JOINING THE PROJECT (USD)..............................88 TABLE A71 PIG PRODUCERS: CREDIT- INVESTMENT CAPITAL BY SOURCE (USD) ...................................................................88 TABLE A72 PIG PRODUCERS: CREDIT TYPE (USD)..................................................................................................................88 TABLE A73 PIG PRODUCERS: CREDIT AMOUNT BY TYPE (USD) .............................................................................................88 TABLE A74 PIG PRODUCERS: NUMBER OF HEAD SOLD THE LAST YEAR BEFORE JOINING THE PROJECT ....................................89 TABLE A75 PIG PRODUCERS: GROSS SALES REVENUE: THE LAST YEAR BEFORE JOINING THE PROJECT (USD) .......................89 TABLE A76 PIG PRODUCERS: GROSS SALE REVENUE AS A PERCENTAGE OF TOTAL COST DURING PROJECT 2008 & THE LAST
YEAR BEFORE JOINING THE PROJECT (USD)....................................................................................................................89 TABLE A77 PIG PRODUCERS: PERCENTAGE WITH GROSS PROFIT > $0 USD............................................................................89 TABLE A78 PIG PRODUCERS: HOUSEHOLD LABOR EMPLOYMENT PRE-PROJECT (PERSONS) ....................................................89
USAID-Funded Cambodia MSME Strengthening Project Final Monitoring And Evaluation Survey 2008 7
TABLE A79 PIG PRODUCERS: HIRED LABOR EMPLOYMENT PRE-PROJECT & DURING PROJECT (PERSONS) .............................90 TABLE A80 PRODUCTIVITY INDICATORS PIG MORTALITY PRE-PROJECT.................................................................................90 TABLE A81 PRODUCTIVITY INDICATORS: PIG MORTALITY DURING PROJECT 2008.................................................................90 TABLE A82 PRODUCTIVITY INDICATORS: PIG EPIDEMICS PRE-PROJECT & DURING PROJECT 2008.........................................90 TABLE A83 PRODUCTIVITY INDICATORS: MEAN FEEDER PIG SALE WEIGHT KG. PRE-PROJECT 2008......................................90 TABLE A84 PRODUCTIVITY INDICATORS: MEAN FEEDER PIG SALE WEIGHT KG. DURING PROJECT 2008 ...............................91 TABLE A85 PRODUCTIVITY INDICATORS: MONTHS FOR PIG GROWTH TO 80-90 KG. DURING PROJECT 2008 ..........................91 TABLE A86 PRODUCTIVITY INDICATORS: MONTHS FOR PIG GROWTH TO 80-90 KG. PRE-PROJECT .........................................91 TABLE A87 PIG PRODUCERS: PIG ENTERPRISE AS PERCENT OF TOTAL HOUSEHOLD INCOME PRE-PROJECT & 2008...............92 TABLE A88 PIG PRODUCERS: RATED IMPORTANCE OF MSME ASSISTANCE FOR BROAD RURAL POVERTY ALLEVIATION......92 TABLE A89 PIG PRODUCERS: MSME IMPACT ON EXTENSION OF YEARS OF CHILDREN’S EDUCATION ...................................92 TABLE A90 PIG PRODUCERS: MSME IMPACT NUMBER OF CHILDREN’S EDUCATION YEARS EXTENDED................................92 TABLE A91 PIG PRODUCERS: ADOPTION RATES OF IMPROVED ACCOUNTING PRACTICES .......................................................92 TABLE A92 PIG PRODUCERS: ADOPTION RATES OF IMPROVED ACCOUNTING PRACTICES DUE TO MSME ..............................93 TABLE A93 PIG PRODUCERS: PERCENTAGE JOINING BUSINESS ASSOCIATIONS/GROUPS SINCE JOINING MSME......................93 TABLE A94 VETERINARIANS: NUMBER OF SAMPLE ENTERPRISES AND OWNER GENDER BY PROVINCE..................................94 TABLE A95 VETERINARIANS: EDUCATION LEVELS BY PROVINCE ...........................................................................................94 TABLE A96 VETERINARIANS: AGE & ENTERPRISE EXPERIENCE ..............................................................................................94 TABLE A97 VETERINARIAN: HOUSEHOLD MEMBERS...............................................................................................................95 TABLE A98 VETERINARIANS: MSME PIG PRODUCER CLIENT CAPACITY BUILDING ACTIVITIES ............................................95 TABLE A99 VETERINARIANS: NON- PROJECT PIG PRODUCER CAPACITY BUILDING ACTIVITIES .............................................96 TABLE A100 VETERINARIANS: MEAN NEW INVESTMENTS SINCE JOINING THE MSME PROJECT (QUANTITIES). ....................96 TABLE A101 VETERINARIANS: SOURCES OF CAPITAL FOR INVESTMENT 2008.........................................................................96 TABLE A102 VETERINARIANS: SOURCES OF CREDIT FOR INVESTMENT 2008...........................................................................96 TABLE A103 VETERINARIANS: CREDIT LOAN AMOUNTS 2008 (USD).....................................................................................97 TABLE A104 VETERINARIANS: PROPORTION WITH SALE OF GOODS & SERVICES ON CREDIT 2008. ........................................97 TABLE A105 VETERINARIANS: TYPES OF CLIENTS WITH GOOD & SERVICES ON CREDIT 2008. ...............................................97 TABLE A106 VETERINARIANS: CREDIT AMOUNTS FOR GOOD & SERVICES BY CLIENT TYPE 2008 (USD). .............................97 TABLE A107 VETERINARIANS: PROPORTION WITH CASH LOAN CREDIT TO CLIENTS 2008......................................................97 TABLE A108 VETERINARIANS: TYPES OF CLIENTS WITH CASH LOAN CREDIT 2008. ...............................................................97 TABLE A109 VETERINARIANS: CASH LOAN CREDIT AMOUNTS BY TYPE OF CLIENT 2008 (USD). .........................................97 TABLE A110 VETERINARIANS: COSTS OF BUSINESS PRE-PROJECT (USD)...............................................................................98 TABLE A111 VETERINARIANS: VOLUME OF SALES/NUMBER OF CUSTOMERS PRE-PROJECT...................................................98 TABLE A112 VETERINARIANS: GROSS SALES REVENUES PRE-PROJECT. .................................................................................98 TABLE A113 VETERINARIANS: HOUSEHOLD LABOR EMPLOYMENT PRE-PROJECT. .................................................................98 TABLE A114 VETERINARIANS: HOUSEHOLD LABOR EMPLOYMENT DURING THE PROJECT 2008.............................................99 TABLE A115 VETERINARIANS: HOUSEHOLD LABOR PRE-PROJECT & DURING THE PROJECT 2008 (PERSONS). .......................99 TABLE A116 VETERINARIANS: HIRED LABOR EMPLOYMENT PRE-PROJECT & DURING THE PROJECT 2008. ...........................99 TABLE A117 VETERINARIANS: PRODUCTIVITY INDICATORS PRE-PROJECT & DURING THE PROJECT 2008..............................99 TABLE A118 VETERINARIANS: VET. ENTERPRISE AS PERCENT OF TOTAL HOUSEHOLD INCOME PRE-PROJECT & 2008 ........100 TABLE A119 VETERINARIANS: RATED IMPORTANCE OF MSME ASSISTANCE FOR BROAD RURAL POVERTY ALLEVIATION .100 TABLE A120 VETERINARIANS: MSME IMPACT ON EXTENSION OF YEARS OF CHILDREN’S EDUCATION ...............................100 TABLE A121 VETERINARIANS: MSME IMPACT NUMBER OF CHILDREN’S EDUCATION YEARS EXTENDED ...........................100

USAID-Funded Cambodia MSME Strengthening Project Final Monitoring And Evaluation Survey 2008 8
TABLE A122 INPUT SUPPLIERS: NUMBER OF SAMPLE ENTERPRISES & OWNER GENDER BY PROVINCE.................................101 TABLE A123 INPUT SUPPLIERS: EDUCATION LEVEL BY PROVINCE ........................................................................................101 TABLE A124 INPUT SUPPLIERS: AGE & ENTERPRISE EXPERIENCE.........................................................................................101 TABLE A125 INPUT SUPPLIERS: HOUSEHOLD MEMBERS........................................................................................................101 TABLE A126 INPUT SUPPLIERS: MSME PROJECT FACILITATED TRAININGS ..........................................................................102 TABLE A127 INPUT SUPPLIERS: NON- PROJECT PIG PRODUCER CAPACITY BUILDING ACTIVITIES ........................................102 TABLE A128 INPUT SUPPLIERS: MEAN NEW INVESTMENTS SINCE JOINING THE MSME PROJECT (QUANTITIES). .................103 TABLE A129 INPUT SUPPLIERS: COSTS OF BUSINESS PRE-PROJECT (USD)............................................................................103 TABLE A130 INPUT SUPPLIERS: SOURCES OF CAPITAL FOR INVESTMENT 2008. ....................................................................103 TABLE A131 INPUT SUPPLIERS: SOURCES OF CREDIT FOR INVESTMENT 2008. ......................................................................103 TABLE A132 INPUT SUPPLIERS: PROPORTION WITH SALE OF GOODS & SERVICES ON CREDIT 2008. .....................................104 TABLE A133 INPUT SUPPLIERS: TYPES OF CLIENTS WITH GOOD & SERVICES ON CREDIT 2008.............................................104 TABLE A134 INPUT SUPPLIERS: CREDIT AMOUNTS FOR GOOD & SERVICES BY CLIENT TYPE 2008 (USD)...........................104 TABLE A135 INPUT SUPPLIERS: COSTS OF BUSINESS PRE-PROJECT (USD)............................................................................104 TABLE A136 INPUT SUPPLIERS: VOLUME OF SALES/NUMBER OF CUSTOMERS PRE-PROJECT. ..............................................105 TABLE A137 INPUT SUPPLIERS: VOLUME OF SALES/NUMBER OF CUSTOMERS 2008.............................................................105 TABLE A138 INPUT SUPPLIERS: GROSS SALES REVENUES PRE-PROJECT...............................................................................105 TABLE A139 INPUT SUPPLIERS: PERCENTAGE WITH GROSS PROFIT > $0 USD ......................................................................105 TABLE A140 INPUT SUPPLIERS: HOUSEHOLD LABOR EMPLOYMENT PRE-PROJECT ...............................................................105 TABLE A141 INPUT SUPPLIERS: HOUSEHOLD LABOR EMPLOYMENT DURING THE PROJECT 2008. ........................................106 TABLE A142 INPUT SUPPLIERS: HOUSEHOLD LABOR PRE-PROJECT & DURING THE PROJECT 2008 (PERSONS).....................106 TABLE A143 INPUT SUPPLIERS: HIRED LABOR EMPLOYMENT PRE-PROJECT & DURING THE PROJECT 2008.........................106 TABLE A144 INPUT SUPPLIERS: HIRED LABOR DAILY PAY RATES DURING THE PROJECT 2008. ...........................................106 TABLE A145 INPUT SUPPLIERS: HIRED LABOR DAILY PAY RATES PRE-PROJECT 2008. ........................................................106 TABLE A146 INPUT SUPPLIERS: PRODUCTIVITY INDICATORS PRE-PROJECT & DURING THE PROJECT 2008. .........................107 TABLE A147 INPUT SUPPLIERS: ENTERPRISE AS PERCENT OF TOTAL HOUSEHOLD INCOME PRE-PROJECT & 2008 ...............107 TABLE A148 INPUT SUPPLIERS: RATED IMPORTANCE OF MSME ASSISTANCE FOR BROAD RURAL POVERTY ALLEVIATION 107 TABLE A149 INPUT SUPPLIERS: MSME IMPACT ON EXTENSION OF YEARS OF CHILDREN’S EDUCATION..............................107 TABLE A150 INPUT SUPPLIERS: MSME IMPACT NUMBER OF CHILDREN’S EDUCATION YEARS EXTENDED..........................107 TABLE A151 FISH PRODUCERS: MSME PROJECT FACILITATED TRAININGS ..........................................................................108 TABLE A152 FISH PRODUCERS: MSME PROJECT FACILITATED TRAININGS GENDER BALANCE............................................108 TABLE A153 FISH PRODUCERS: FIXED CAPITAL INVESTMENTS SINCE JOINING THE PROJECT BY TYPE..................................109 TABLE 154 FISH PRODUCERS: GROSS SALES REVENUE PRE-PROJECT (USD) TOTAL & BY PROVINCE..................................109 TABLE A155 FISH PRODUCERS: HOUSEHOLD LABOR EMPLOYMENT PRE-PROJECT (PERSONS)..............................................109 TABLE A156 FISH PRODUCERS: HIRED LABOR EMPLOYMENT DURING PROJECT 2008 (PERSONS).........................................109 TABLE A157 FISH PRODUCERS: HIRED LABOR EMPLOYMENT PRE-PROJECT 2008 (PERSONS)...............................................109 TABLE A158 FISH PRODUCERS: PRODUCTIVITY INDICATORS DURING PROJECT 2008 ...........................................................110 TABLE A159 FISH PRODUCERS: PRODUCTIVITY INDICATORS PRE-PROJECT ..........................................................................110 TABLE A160 BRICK & TILE MAKERS: NUMBER & GENDER BY PROVINCE ............................................................................111 TABLE A161 BRICK & TILE MAKERS: EDUCATION LEVEL BY PROVINCE ..............................................................................111 TABLE A162 BRICK & TILE MAKERS: AGE & ENTERPRISE EXPERIENCE ...............................................................................111 TABLE A163 BRICK & TILE MAKERS: HOUSEHOLD MEMBERS ..............................................................................................111 TABLE 164 BRICK & TILE MAKERS: ROLES IN THE VALUE CHAIN.........................................................................................111

USAID-Funded Cambodia MSME Strengthening Project Final Monitoring And Evaluation Survey 2008 9
TABLE 165 BRICK & TILE MAKERS: SPECIFIC GOODS & SERVICES PROVIDED ......................................................................111 TABLE A166 BRICK & TILE MAKERS: MSME PROJECT FACILITATED TRAININGS ................................................................112 TABLE A167 BRICK & TILE MAKERS: FIXED CAPITAL INVESTMENTS SINCE JOINING THE PROJECT (QUANTITIES)...............112 TABLE A168 BRICK & TILE MAKERS: CREDIT- INVESTMENT CAPITAL BY SOURCE (USD)....................................................112 TABLE A169 BRICK & TILE MAKERS: CREDIT TYPE (USD) ..................................................................................................112 TABLE A170 BRICK & TILE MAKERS: CREDIT AMOUNT BY TYPE (USD)..............................................................................113 TABLE A171 BRICK & TILE MAKERS: PROPORTION WITH SALE OF GOODS & SERVICES ON CREDIT 2008. ...........................113 TABLE A172 BRICK & TILE MAKERS: TYPES OF CLIENTS WITH GOOD & SERVICES ON CREDIT 2008. ..................................113 TABLE A173 BRICK & TILE MAKERS: CREDIT AMOUNTS FOR GOOD & SERVICES BY CLIENT TYPE 2008 (USD). ................113 TABLE A174 BRICK & TILE MAKERS: COST OF PRODUCTION PRE-PROJECT (USD)...............................................................113 TABLE A175 BRICK & TILE MAKERS: MEAN UNIT PRICES FOR BRICKS & TILES PRE-PROJECT (USD).................................114 TABLE A176 BRICK & TILE MAKERS: MEAN UNIT PRICES FOR BRICKS & TILES 2008 (USD) ..............................................114 TABLE 177 BRICK & TILE MAKERS: VOLUME OF SALES PRE-PROJECT (USD) ......................................................................114 TABLE 178 BRICK & TILE MAKERS: NUMBER OF CUSTOMERS PRE-PROJECT (PERSONS) ......................................................114 TABLE 179 BRICK & TILE MAKERS: NUMBER OF CUSTOMERS 2008 (PERSONS)....................................................................114 TABLE 180 BRICK & TILE MAKERS: GROSS SALES REVENUE PRE-PROJECT (USD) ..............................................................114 TABLE 181 BRICK & TILE MAKERS: COSTS OF BUSINESS PRE-PROJECT (USD).....................................................................115 TABLE A182 BRICK & TILE MAKERS: HOUSEHOLD LABOR EMPLOYMENT PRE-PROJECT (PERSONS) ....................................115 TABLE A183 BRICK & TILE MAKERS: HIRED LABOR EMPLOYMENT PRE-PROJECT 2008 (PERSONS) .....................................115 TABLE A184 BRICK & TILE MAKERS: HIRED LABOR DAILY PAY RATES PRE-PROJECT (RIEL)..............................................115 TABLE A185 BRICK & TILE MAKERS: HIRED LABOR DAILY PAY RATES 2008 (RIEL) ...........................................................116 TABLE A186 BRICK & TILE MAKERS: PRODUCTIVITY INDICATORS PRE-PROJECT.................................................................116 TABLE A187 BRICK & TILE MAKERS: PRODUCTIVITY INDICATORS 2008 ..............................................................................116

USAID-Funded Cambodia MSME Strengthening Project Final Monitoring And Evaluation Survey 2008 10
Figures
FIGURE 1 INDICATOR COMPONENT 1.1A- PERCENT INCREASE IN VOLUME OF SALES 2008 ACTUAL AS % OF 2008 TARGET ...13 FIGURE 2 INDICATOR COMPONENT 1.1B- PERCENT INCREASE IN VALUE OF SALES 2008 ACTUAL AS % OF 2008 TARGET ......13 FIGURE 3 COMPONENT 2.3- PERCENT INCREASE IN VALUE OF NEW INVESTMENTS 2008 ACTUAL AS % OF 2008 TARGET ......14 FIGURE 4 COMPONENT 3.0- ENTERPRISES ACCESSING NEW LOANS 2008 ACTUAL AS % OF 2008 TARGET .............................14 FIGURE 5 INDICATOR COMPONENT 1.1A- PERCENT INCREASE IN VOLUME OF SALES 2008 ACTUAL AS % OF BASELINE .........16 FIGURE 6 INDICATOR COMPONENT 1.1B- PERCENT INCREASE IN VALUE OF SALES 2008 ACTUAL AS % OF BASELINE ............17 FIGURE 7 COMPONENT 2.3- PERCENT INCREASE IN VALUE OF NEW INVESTMENTS 2008 ACTUAL AS % OF BASELINE ............18 FIGURE 8 INDICATOR COMPONENT 3.0- PERCENT OF MSME THAT HAVE ACCESSED LOANS 2008 AS % OF BASELINE ............20 FIGURE 9 SUMMARY RESULTS: AGGREGATE MSME PROJECT ECONOMIC IMPACTS ON NEW CAPITAL INVESTMENTS............22 FIGURE 10 SUMMARY RESULTS: AGGREGATE MSME PROJECT ECONOMIC IMPACTS BY INCREASED VALUE OF SALES..........23 FIGURE 11 PIG PRODUCERS: MSME PROJECT FACILITATED TRAININGS..................................................................................29 FIGURE 12 PIG PRODUCERS: COST OF BUSINESS & REVENUES PRE-PROJECT & DURING PROJECT 2008 .................................33 FIGURE 13 PIG PRODUCER PRODUCTIVITY INDICATORS: PIG MORTALITY RATES 2008 ...........................................................36 FIGURE 14 PIG PRODUCER PRODUCTIVITY INDICATORS: MEAN KG. LIVE-WEIGHT OF FEEDER PIGS AT SALE ..........................37 FIGURE 15 PIG PRODUCER PRODUCTIVITY INDICATORS: MEAN NUMBER OF MONTHS TO GROW A PIG TO 80-90 KG. .............38 FIGURE 16 VETERINARIANS: MSME PIG PRODUCER CLIENT CAPACITY BUILDING ACTIVITIES DURING THE LAST ONE YEAR
(NO. OF TRAINEES). ........................................................................................................................................................41 FIGURE 17 VETERINARIANS: NON- PROJECT PIG PRODUCER CAPACITY BUILDING ACTIVITIES DURING THE LAST ONE YEAR
(NO. OF TRAINEES). ........................................................................................................................................................42 FIGURE 18 VETERINARIANS: COST OF BUSINESS & GROSS SALES REVENUE PRE-PROJECT & DURING PROJECT 2008 ............45 FIGURE 19 INPUT SUPPLIERS: MSME PIG PRODUCER CLIENT CAPACITY BUILDING ACTIVITIES DURING THE LAST ONE YEAR
.......................................................................................................................................................................................49 FIGURE 20 INPUT SUPPLIERS: NON- PROJECT PIG PRODUCER CAPACITY BUILDING ACTIVITIES DURING THE LAST ONE YEAR
.......................................................................................................................................................................................50 FIGURE 21 INPUT SUPPLIERS: COST OF BUSINESS & GROSS SALES REVENUE PRE-PROJECT & 2008 .......................................54 FIGURE 22 COMPARATIVE ENTERPRISE CHARACTERISTICS NON-PROJECT PIG PRODUCERS VS MSME PIG PRODUCERS ........59 FIGURE 23 FISH PRODUCERS: MSME PROJECT FACILITATED TRAININGS................................................................................61 FIGURE 24 FISH PRODUCERS: SALES VOLUMES PRE-PROJECT & DURING PROJECT 2008 ........................................................65 FIGURE 25 FISH PRODUCERS: COST OF BUSINESS & REVENUES PRE-PROJECT & DURING PROJECT 2008................................66 FIGURE 26 COMPARATIVE ENTERPRISE CHARACTERISTICS NON- PROJECT FISH PRODUCERS VS MSME FISH PRODUCERS ....73 FIGURE 27 BRICK & TILE MAKERS: MSME PROJECT FACILITATED TRAININGS ......................................................................75 FIGURE 28 BRICK & TILE MAKERS: UNIT VALUES OF TILES & BRICKS PRE-PROJECT & 2008 ................................................78 FIGURE 29 BRICK & TILE MAKERS: COSTS OF BUSINESS AND GROSS SALES REVENUES PRE-PROJECT & 2008 ......................80

USAID-Funded Cambodia MSME Strengthening Project Final Monitoring And Evaluation Survey 2008 11
1. SUMMARY RESULTS This section provides a summary of MSME project impacts. Section 1.1 provides a summary of 2008 results comparing targets to actual impacts in the final year of the project. Section 1.2 provides a more detailed summary by Component and for the time period from Baseline 2005 to Final Evaluation 2008. Section 1.3 presents an analysis of the aggregate MSME Project economic impacts on enterprises and the economy in 2008. The MSME project monitoring and evaluation (PMP) framework, in its entirety, includes indicators from a number of different sources. Here the key impact indicators covered in this Evaluation are presented. Results for other indicators will be provided by the MSME project in separate project finalization reports.
1.1. MSME Indicator Framework Targets and Actual Results in 2008 This section provides a short summary of MSME project impacts in its final year 2008 by comparing FY 2008 targets to actual results. Results by Component are discussed further in Section 1.2 and in the main body of this report. As shown in Table 1, 2008 was a very successful year for the project overall. Many final year targets were exceeded, often by large margins. The key impact Indicator 1.1(a), change in value of sales, exceeded targets by 169% to 293% across value chains. Indicator 1.1(b) volume of sales also more than doubled the target for the pig value chain, while Fish and Brick and Tile value chains did not meet volume of sales targets. However, Fish and Brick and Tile enterprises were still able to exceed targets in value of sales. This is due to a focus on increasing product quality and unit values in these value chains, rather than a growth strategy based mainly on increasing volume of sales. These issues are explored in this report. Overall these results for Component 1 show large improvements in performance among assisted enterprises over the last year in all value chains. Indicator 2.3 results for Pigs and Brick and Tile makers show targets for new investments exceeded by over 400%. This indicates that these enterprises are confident enough in value chain competitiveness to invest in further growth at levels well beyond expectations. New investments in fish enterprises did not meet target, largely due to the project including a higher proportion of new/small scale fish producers among their fish value chain clients. These new/small scale fish producers, while experiencing growth in value of sales, have not yet reached a stage for larger scale investments. For the Component 3.0 indicator, improved MSME access to finance, targets have been exceeded for accessing loans from any source at any time in 2008 for most client MSMEs. The exception is Brick and Tile makers. where the target was that all enterprises of this type that were a client of the project (15) would access credit, but the outcome was that 40% of these enterprises actually used loans.

USAID-Funded Cambodia MSME Strengthening Project Final Monitoring And Evaluation Survey 2008 12
Table 1 Summary Results: Project Indicator Framework Target and Actual Results 2008
Indicator Value Chain Unit Target
FY2008 Actual FY2008
% of FY Target
OBJECTIVE: Component 1: Improved Performance of USAID-Assisted Enterprises in Targeted Value Chains 1.1 (a) Percent change in volume of sales of program-assisted enterprises Pigs Mean
Head/MSME 16.4 38 232%
Fish Mean Kg./MSME 2,890 1,863 64%
Brick & Tile Mean No. Bricks & Tiles/MSME 540,334 338,701 63%
1.1 (b) Change in value of sales of program-assisted enterprises Pigs Mean $/MSME $1,290 $3,786 293%
Fish Mean $/MSME $2,154 $3,637 169%
Brick & Tile Mean $/MSME $21,156 $39,967 189%
OBJECTIVE: Component 2: Enhanced Capacity to Support Competitive Value Chains 2.3. Percent increase in value of new investments by MSME Pigs Mean $/MSME $1,200 $5,256 438%
Fish Mean $/MSME $6,886 $4,830 70%
Brick & Tile Mean $/MSME $18,000 $115,160 640%
OBJECTIVE: Component 3: Ongoing Improved MSME Access to Finance 3.0. Percent of MSME in target value chains that have accessed loans from any source at any time. Pig No. of MSME 150 169 113%
Fish No of MSME 50 66 132%
Brick & Tile No. of MSME 15 6 40%
3.1. Number of MSME trained in basic accounting. Pig No. of MSME 100 119 119%
Fish No. of MSME 50 55 110%
Brick & Tile No. of MSME 15 3 20%

USAID-Funded Cambodia MSME Strengthening Project Final Monitoring And Evaluation Survey 2008 13
Figure 1 Indicator Component 1.1a- Percent Increase in Volume of Sales 2008 Actual as % of 2008 Target
232%
64% 63%
0%
50%
100%
150%
200%
250%
Pigs Fish Brick & Tile
Indicator Component 1.1a- Percent Increase in Volume of Sales 2008 Actual as Percentage of 2008 Target
Figure 2 Indicator Component 1.1b- Percent Increase in Value of Sales 2008 Actual as % of 2008 Target
293%
169%189%
0%
50%
100%
150%
200%
250%
300%
Pigs Fish Brick & Tile
Indicator Component 1.1b- Percent Increase in Value of Sales 2008 Actual as Percentage of 2008 Target

USAID-Funded Cambodia MSME Strengthening Project Final Monitoring And Evaluation Survey 2008 14
Figure 3 Component 2.3- Percent Increase in Value of New Investments 2008 Actual as % of 2008 Target
438%
70%
640%
0%
100%
200%
300%
400%
500%
600%
700%
Pigs Fish Brick & Tile
Indicator Component 2.3- Percent Increase in Value of New Investments 2008 Actual as Percentage of 2008 Target
Figure 4 Component 3.0- Enterprises Accessing New Loans 2008 Actual as % of 2008 Target
113%
165%
100%
0%
20%40%
60%80%
100%
120%140%
160%
180%
Pigs Fish Brick & Tile
Indicator Component 3.0- Percent Increase in Enterprises Accessing New Loans from Any Source
2008 Actual as Percentage of 2008 Target

USAID-Funded Cambodia MSME Strengthening Project Final Monitoring And Evaluation Survey 2008 15
1.2. MSME Indicator Framework Results by Component, Baseline to Final Evaluation 2008
This section provides a summary of MSME project impacts by looking at changes in Component Indicators from the CIDS Baseline Study in 2005 through FY 1 in 2006, to FY 2 and the project Mid-Point Evaluation in 2007 and then to the Final Evaluation results from 2008. The following tables set out the results for each Component and Component Indicator. For each Indicator the Target and Actual results are shown. Below, these results are shown as the percentage of the FY target and then as the percentage of Baseline results. For Project Component 3 some Indicator definitions and targets were revised in Year 2 so there is no Baseline or Y1 Data. Further revisions were also made after the 2007 Mid-point Evaluation survey, leading to gaps in data for year 2. While FY Target and Actual results were reported for each year in previous studies, and are also reported for 2008 in later sections of this report, Component 3.1 and 3.2 indicators do not provide a consistent basis for comparisons over the time frame of the project cycle and so they are not included here in this section. Results for Component 1: Improved Performance of USAID-Assisted Enterprises in Targeted Value Chains are shown in the following two tables. The first table looks at changes in sales volumes over the project cycle. Compared to the Baseline study, the most dramatic impacts of the MSME project have been on increasing pig sales volumes, which are up 463% by 2008. The mean results have been increased by one large scale producer sampled who was an MSME client who accounted for about 5% of total sales volumes among the 406 producers. Growth in fish and tile sales volumes have been relatively less dramatic but still solid, with fish volumes up 128% and tile volumes up 125% in the three years after the baseline. Results for growth in sales volumes have mostly fallen below annual targets to some extent with the exception of pigs in 2008. However, emphasis for fish and brick and tile productivity increases have focused more on quality improvement and higher unit prices as discussed later in this report. Table 2 Summary Results: Project Indicator Framework Component 1a
OBJECTIVE: Component 1a: Improved Performance of USAID-Assisted Enterprises in Targeted Value Chains
Indicator Value Chain Unit
Base-line CIDS
2
FY2006 FY2007 FY2008
1.1 (a) Percent change in volume of sales of program-assisted enterprises Pigs Mean
Head/MSME
Target 10 12 16 Actual 8.2 9 10 38 % of FY Target 88% 81% 232% Actual as % of Baseline 110% 122% 463% 1.1 (a) Percent change in volume of sales of program-assisted enterprises Fish Mean
Kg./MSME
Target 1,825 2,190 2,890 Actual 1,460 1,573 1,686 1,863 % of FY Target 86% 77% 64% Actual as % of Baseline 108% 115% 128%
1.1 (a) Percent change in volume of sales of program-assisted enterprises
Brick & Tile
Mean No. Bricks,Tiles /MSME
Target 337,709 405,251 540,334 Actual 270,167 280,000 325,000 338,701 % of FY Target 83% 80% 63% Actual as % of Baseline 104% 120% 125%

USAID-Funded Cambodia MSME Strengthening Project Final Monitoring And Evaluation Survey 2008 16
Figure 5 Indicator Component 1.1a- Percent Increase in Volume of Sales 2008 Actual as % of Baseline
463%
128% 125%
0%50%
100%150%200%250%300%350%400%450%500%
Pigs Fish Brick & Tile
Indicator Component 1.1a- Percent Increase in Volume of Sales 2008 Actual as Percentage of Pre-Project Baseline 2005
This second table on Component 1 looks at changes in sales values over the project cycle. Project impacts have been particularly striking on sales values with increases over Baseline by 2008 of 587% for pig enterprises, 353% for fish and 378% for tile enterprises. The rise has been particularly steep during 2008, a likely result of better quality products combined with the impacts of inflation over the last year. Notably, fish and tile results far exceed targets on sales values while growth in production volumes have been much less, pointing to rising quality and unit prices for their products. Table 3 Summary Results: Project Indicator Framework Component 1b
OBJECTIVE: Component 1b: Improved Performance of USAID-Assisted Enterprises in Target Value Chains
Indicator Value Chain Unit Base-line
CIDS 2 FY2006 FY2007 FY2008
1.1 (b) Change in value of sales of program-assisted enterprises Pigs Mean
$/MSME
Target $806 $968 $1,290
Actual $645 $700 $796 $3,786
% of FY Target 87% 82% 293%
Actual as % of Baseline 109% 123% 587%
1.1 (b) Change in value of sales of program-assisted enterprises Fish Mean
$/MSME
Target $1,363 $1,635 $2,154
Actual $1,090 $1,285 $3,851 % of FY Target 0% 79% 179%
Actual as % of Baseline 0% 118% 353%
1.1 (b) Change in value of sales of program-assisted enterprises
Brick & Tile
Mean $/MSME
Target $13,224 $15,869 $21,156
Actual $10,579 $15,180 $18,506 $39,967
% of FY Target 115% 117% 189%
Actual as % of Baseline 143% 175% 378%

USAID-Funded Cambodia MSME Strengthening Project Final Monitoring And Evaluation Survey 2008 17
Figure 6 Indicator Component 1.1b- Percent Increase in Value of Sales 2008 Actual as % of Baseline
587%
353% 378%
0%
100%
200%
300%
400%
500%
600%
Pigs Fish Brick & Tile
Indicator Component 1.1b- Percent Increase in Value of Sales 2008 Actual as Percentage of Pre-Project Baseline 2005
Results for Component 2: Enhanced Capacity of Value Chain Firms and/or Stand-Alone Providers to Support Competitive Value Chains, are shown in the following table. The project indicator for this component is the mean increase in new investments in the enterprise since joining the MSME project. The value of “new investments” in the case of Pig Producers is defined as the sum of three investment components: fixed capital investments during the project, the value of pig stock at the start of the production cycle in May 2007 and the value of total costs of pig production May 2007 - April 2008. For Fish and Tile enterprises, the value of “new investments” is defined as the sum of two investment components: fixed capital investments during the project and the value of total costs of production May 2007 - April 2008. This is a conservative estimate of project impacts on new investments, as costs of production investments are annual costs, but only the most recent year’s costs are included in the estimate. There has been a spectacular growth in new investments in both Tile and Pig enterprises compared to baseline. In the case of pig producers, most of this investment growth has been in terms of rising costs of production for larger numbers of pigs. In the case of Tile producers, investment growth results from both large increases in investments in fixed capital items and large increases in costs of production, especially for the larger numbers of bricks also produced by these enterprises. Both these enterprises have also met or exceeded annual FY targets through the project cycle, showing strong growth in both 2007 & 2008. The exception to these trends has been the fish enterprises. Investment growth since Baseline has occurred, but at a much lower rate and new investments have consistently fallen below annual FY targets. As discussed in the earlier Fish Producer section of this report, this is likely due to the combination of large scale fish enterprises, mostly in Kampong Cham, with mostly small scale enterprises in the process of commercialization in Prey Veng, and the lag time of perhaps two years until large increases in productivity, returns and investments occur.

USAID-Funded Cambodia MSME Strengthening Project Final Monitoring And Evaluation Survey 2008 18
Table 4 Summary Results: Project Indicator Framework Component 2
OBJECTIVE: Component 2: Enhanced Capacity of Value Chain Firms &/or Stand-Alone Providers to Support Competitive Value Chains
Indicator Value Chain Unit
Base-line
CIDS 2
FY2006 FY2007 FY2008
2.3. Percent increase in value of new investments by MSME Pig Mean
$/MSME
Target 750 900 $1,200 Actual $600 $953 $2,860 $5,256 % of FY Target 127% 318% 438% Actual as % of Baseline 159% 477% 876% 2.3. Percent increase in value of new investments by MSME Fish Mean
$/MSME
Target 4,291 5,150 $6,886 Actual $3,433 $3,689 $3,934 $4,830 % of FY Target 86% 76% 70% Actual as % of Baseline 107% 115% 141% 2.3. Percent increase in value of new investments by MSME
Brick & Tile
Mean $/MSME
Target 11,250 13,500 $18,000 Actual $9,000 $10,990 $32,972 $115,160 % of FY Target 98% 244% 640% Actual as % of Baseline 122% 366% 1280%
Figure 7 Component 2.3- Percent Increase in Value of New Investments 2008 Actual as % of Baseline
876%
141%
1280%
0%
200%
400%
600%
800%
1000%
1200%
1400%
Pigs Fish Brick & Tile
Indicator Component 2.3- Percent Increase in Value of New Investments 2008 Actual as Percentage of Pre-Project Baseline 2005
One further Indicator of importance is found under Component 2 and needs to be reported separately. This is Component 2.2: Total number of enterprises trained in private sector growth. The target for this Indicator in 2008 is 1,500 MSME enterprises of all types, the results are not split by type of enterprise. Result from this Evaluation indicate that over 95% of sampled individual DAI client enterprises had participated in the most common types of

USAID-Funded Cambodia MSME Strengthening Project Final Monitoring And Evaluation Survey 2008 19
training sessions by May 2008, when total producer enterprises numbered 1,488. With a further increase in number of DAI enterprises, to 1,800 after May, consisting mostly of producers, this target would have been met. The evaluation also includes more detailed information on training participation rates which serve to more fully highlight the impact of capacity building activities the MSME project undertakes with producers, which have contributed fundamentally to the achieved large increases in volumes and value of sales in all value chains. The results in terms of number of training session per individual are important. In the later sections of this report, we present the numbers of person/training sessions by type for both pig and fish producers. The results from our sample are that 406 Pig Producers reported attending a total of 3,532 person/training sessions or an average of 8.7 person/training sessions per enterprise. The sample of 56 Fish Producers reported a further attendance at 606 person/training sessions by type or an average of 10.8 person/training sessions per enterprise. Extrapolating from the sample to all MSME project producers, this gives an estimate that individuals from all 1,209 MSME Pig producer enterprises would have attended a total of 10,518 person/training sessions by type and individuals from all 264 Fish producers enterprises an additional 2,851 person/training sessions by type since joining the MSME project. So an important dimension of project impact in capacity building for private sector growth has been the multiple training of individuals from within client enterprises. To add to these impacts, the results from both the Pig and Fish Spread Surveys indicate that MSME project producers directly conduct about 20% of total training in improved technologies for non-project producers within their villages. Results for Component 3.0: Ongoing Improved MSME Access to Finance, are shown in the following table. The results for 2008 are conservative as they likely only examine access to cash finance to fund enterprise investments. While respondents were asked about credit for production inputs, the response rate was very low and much lower than that found in 2007. Respondents seem to have replied only in terms of cash loans in 2008. As discussed in the introduction to this section, Component 3.1. and 3.2 Indicators are not included here due to changes in Indicator definitions and targets over the project cycle. Table 5 Summary Results: Project Indicator Framework Component 3
Component 3.0: Ongoing Improved MSME Access to Finance
Indicator Value Chain Unit
Base-line CIDS 2
FY2006 FY2007 FY2008
3.0. Percent of MSME that have accessed loans from any source at any time. Pig No. of
MSME
Target 122 140 150 Actual 124 25 176 169 % of FY Target 20% 126% 113% Actual as % of Baseline 20% 142% 136% 3.0. Percent of MSME that have accessed loans from any source at any time. Fish No. of
MSME
Target NA 19 50 Actual 12 NA 8 66 % of FY Target 42% 132%
Actual as % of Baseline 0% 67% 550%
3.0. Percent of MSME that have accessed loans from any source at any time.
Brick & Tile
No. of MSME
Target 5 6 15 Actual 6 4 4 6 % of FY Target 80% 67% 40% Actual as % of Baseline 67% 67% 100%

USAID-Funded Cambodia MSME Strengthening Project Final Monitoring And Evaluation Survey 2008 20
Concerning Component 3.0, the number of enterprises accessing loans from any source at any time for investments growth has been variable by type of enterprise. Compared to the Baseline, Fish Producers have shown a very large increase in the percentage of enterprises accessing loans in 2008. Pig Producers show a more modest but steady growth in enterprises accessing loans after an initial rapid increase in 2007. Brick and Tile enterprises have not experienced growth in the proportion utilizing loans for investment. All types of enterprise met or exceeded the annual targets for numbers of enterprises accessing credit for the first time in FY 2008. Figure 8 Indicator Component 3.0- Percent of MSME that have accessed loans 2008 as % of Baseline
136%
550%
100%
0%
100%
200%
300%
400%
500%
600%
Pigs Fish Brick & Tile
Indicator Component 3.0. Percent of MSME that have accessed loans from any source at any time.
2008 Actual as Percentage of Pre-Project Baseline 2005
Results for Component 4.0: Improved Business Environment, are shown in the following table. The Indicator is the number of enterprises who have joined business associations since joining the MSME project as a means to participate in policy advocacy and public-private sector dialogues. MSME project staff will be providing additional information in this area of project impacts in separate reports. The Baseline for this indicator was zero. Since FY1 of the project, the number of enterprises of all types joining business associations has approximately doubled each year through 2007 and 2008. While increasing business association policy advocacy and public-private sector dialogues requires time to develop, a good foundation has been laid through this ongoing and quite rapid increase in business association membership among enterprises.

USAID-Funded Cambodia MSME Strengthening Project Final Monitoring And Evaluation Survey 2008 21
Table 6 Summary Results: Project Indicator Framework Component 4
Component 4: Improved Business Environment
Indicator Value Chain Unit Base-line
CIDS 2
FY2006 FY2007 FY2008
4.0. Number of MSME participating in policy advocacy meetings and public-private dialogues.
ALL No of MSME
Target 20 200 400 Actual 0 100 228 562 % of FY Target 500% 114% 141% Actual as % of Baseline NA NA NA
1.3. Aggregate MSME Project Economic Impacts on Enterprises and the Economy in 2008 In this section we examine the aggregate impacts of the MSME project on the enterprises working with the project and therefore on the economy as a whole. Two simple methods are used to enumerate these aggregate project impacts. These methods have been used previously in DAI MSME Project Portfolio Reviews submitted as a reporting requirement to USAID.
1. The sum of the Average New Capital Investments by number of enterprises by type in 2008. 2. The sum of the Average Increase in Value of Sales by number of enterprises by type in 2008.
The Total DAI MSME Project Budget was $5,007,688 for the entire project cycle of three years. The aggregate impact of the MSME on the enterprises and therefore on the economy as a whole in terms of the sum of new Capital Investments since joining the project is estimated to be $12,261,270. So the 1,654 MSME enterprises have invested over $12 Million in their enterprises, adding value, and through purchasing these goods and services in the wider Cambodian economy. This is a major economic benefit for the enterprises themselves and the wider economy within which these enterprises operate. The simple return on investment for the MSME project by this measure is 244% of total project cost. Table 7 Summary Results: Aggregate MSME Project Economic Impacts on Capital Investments
Value Chain Role
Average New Capital Investment
Number of Enterprises Total Value
Pig Value Chain Pig Raiser $5,256 1209 $6,354,504 Pig Value Chain Veterinarian $2,577 142 $365,934 Pig Value Chain Input Supplier $105,763 24 $2,538,312 Fish Value Chain Fish Raiser $4,830 264 $1,275,120 Brick /Tile Value Chain Brick & Tile Maker $115,160 15 $1,727,400
Total Estimated Value/Return 1654 $12,261,270

USAID-Funded Cambodia MSME Strengthening Project Final Monitoring And Evaluation Survey 2008 22
Figure 9 Summary Results: Aggregate MSME Project Economic Impacts on New Capital Investments
$6,354,504
$365,934
$2,538,312
$1,275,120
$1,727,400
$0
$1,000,000
$2,000,000
$3,000,000
$4,000,000
$5,000,000
$6,000,000
$7,000,000
Pig Raiser Veterinarian Input Supplier Fish Raiser Brick & TileMaker
Summary Results: Aggregate MSME Project Economic Impacts on New Capital Investments by Value Chain (USD)
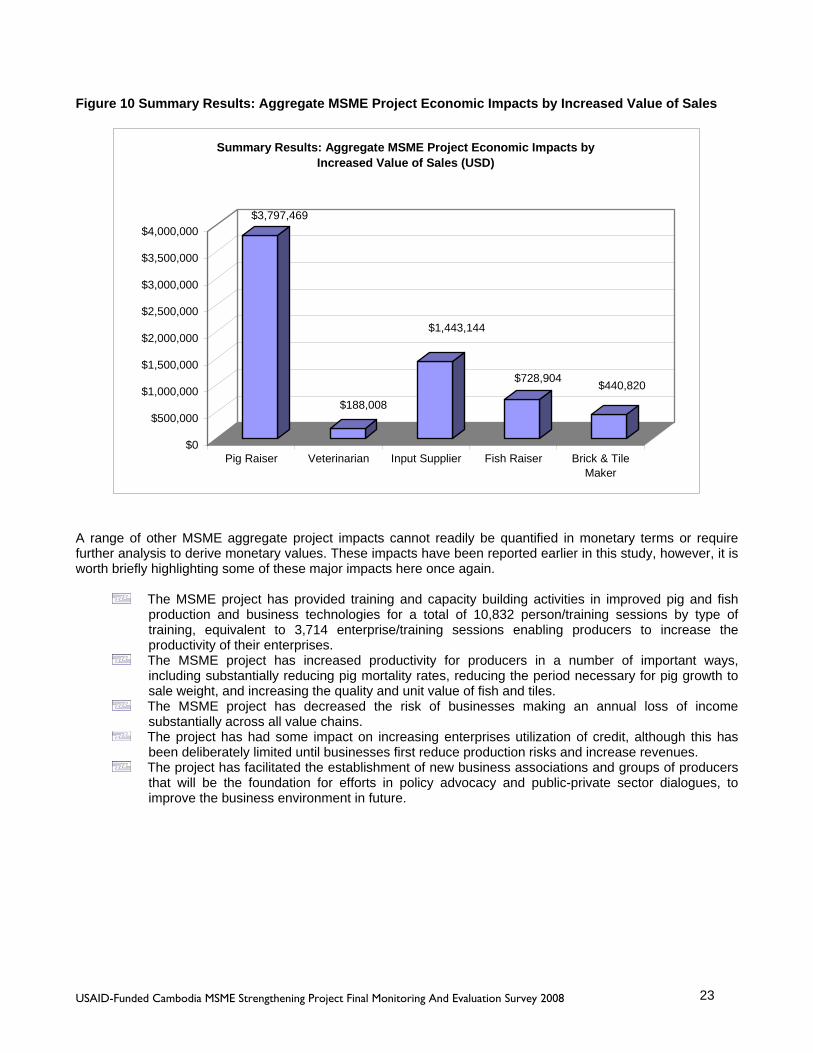
The aggregate impact of the MSME on the enterprises and therefore on the economy as a whole in terms of increased value of sales from baseline is estimated to be $6,598,345. So the 1,654 MSME enterprises have increased the value of sales by $6.6 Million for their enterprises, and have increased the value of the goods and services they provide to the wider Cambodian economy. This is a further major economic benefit for the enterprises themselves and the wider economy within which these enterprises operate. The simple return on investment for the MSME project by this measure is 132% of total project cost. Table 8 Summary Results: Aggregate MSME Project Economic Impacts by Increased Value of Sales
Value Chain Role Average Increase in Value of Sales from Baseline
Number of Enterprises Total Value
Pig Value Chain Pig Raiser $3,141 1209 $3,797,469 Pig Value Chain Veterinarian $1,324 142 $188,008 Pig Value Chain Input Supplier $60,131 24 $1,443,144
Fish Value Chain Fish Raiser $2,761 264 $728,904 Brick/Tile Value Chain Brick/Tile Maker $29,388 15 $440,820
Total Estimated Value/Return 1654 $6,598,345
USAID-Funded Cambodia MSME Strengthening Project Final Monitoring And Evaluation Survey 2008 23
Figure 10 Summary Results: Aggregate MSME Project Economic Impacts by Increased Value of Sales
$3,797,469
$188,008
$1,443,144
$728,904 $440,820
$0
$500,000
$1,000,000
$1,500,000
$2,000,000
$2,500,000
$3,000,000
$3,500,000
$4,000,000
Pig Raiser Veterinarian Input Supplier Fish Raiser Brick & TileMaker
Summary Results: Aggregate MSME Project Economic Impacts by Increased Value of Sales (USD)
A range of other MSME aggregate project impacts cannot readily be quantified in monetary terms or require further analysis to derive monetary values. These impacts have been reported earlier in this study, however, it is worth briefly highlighting some of these major impacts here once again.
The MSME project has provided training and capacity building activities in improved pig and fish production and business technologies for a total of 10,832 person/training sessions by type of training, equivalent to 3,714 enterprise/training sessions enabling producers to increase the productivity of their enterprises.
The MSME project has increased productivity for producers in a number of important ways, including substantially reducing pig mortality rates, reducing the period necessary for pig growth to sale weight, and increasing the quality and unit value of fish and tiles.
The MSME project has decreased the risk of businesses making an annual loss of income substantially across all value chains.
The project has had some impact on increasing enterprises utilization of credit, although this has been deliberately limited until businesses first reduce production risks and increase revenues.
The project has facilitated the establishment of new business associations and groups of producers that will be the foundation for efforts in policy advocacy and public-private sector dialogues, to improve the business environment in future.

USAID-Funded Cambodia MSME Strengthening Project Final Monitoring And Evaluation Survey 2008 24
2. BACKGROUND, OBJECTIVES AND METHODOLOGY
1.4. Background and Objectives of Research The Cambodia Micro, Small and Medium Enterprises (MSME) Strengthening Project is implemented by Development Alternatives, Inc (DAI) and funded by the United States Agency for International Development (USAID) over the period October 2005 to September 2008. The vision of the project is to improve entrepreneurship and competitiveness for micro, small and medium enterprises (MSME) in selected value chains and target provinces by enabling improvements to businesses and the business environment. In the past, many of these targeted MSME, were operating in a difficult environment. Value chain linkages were under-developed, business margins thin, and business risks were high, constraining local economic development and efforts in rural poverty alleviation. The Project assists rural MSME entrepreneurs in improving opportunities and incomes by partnering directly with value chain stakeholders to promote new ways of thinking and acting among local business people. The emphasis is on increased trust and cooperation, networking, sharing information and pooling resources in ways that can benefit all MSME in the value chain. DAI facilitates training of MSME by working directly with Input Suppliers, who then train enterprises within their sectors. Practical tools are utilized to improve products, services, business relationships and access to affordable credit. The DAI MSME project has five enabling Components:
Component 1: Improved Performance of Enterprises in Targeted Value Chains - DAI will work to strengthen MSME by taking advantage of opportunities and addressing primary constraints identified by the project.
Component 2: Enhanced Capacity of Value Chain Firms or Business Services to Support Value
Chains - DAI seeks to improve MSME access to market information, know-how, technology and working capital within selected value chains.
Component 3: Improved MSME Access to Finance - By linking MSME with financial institutions,
creating incentives for financial institutions to extend credit to MSME, facilitating the development of new financial products, and helping MSME meet the demands of lenders for proper business plans and financial records.
Component 4: Improved Business Environment - DAI seeks to strengthen linkages and trust among
MSME in targeted value chains and work with networks and groups of firms to more effectively represent their interests to the government, pool resources, and lobby for regulatory changes to improve the business enabling environment in those value chains.
Component 5: Vocational training and employment for Vulnerable Persons.
DAI uses a six-step approach to strengthening MSME:
Identify value chains with potential for positive impact in market demand, job creation, and revenue generation;
Build the knowledge, capacity and skills of firms within those value chains; Strengthen vertical linkages within the chains; Strengthen horizontal linkages between companies and business service providers at multiple levels
of the chain; Improve access to finance to upgrade inputs, productivity and quality; and Improve the enabling environment by engaging the private sector and strengthening institutions.

USAID-Funded Cambodia MSME Strengthening Project Final Monitoring And Evaluation Survey 2008 25
The project engages MSME in three primary value chains: pigs, aquaculture, and brick and tile making. It is currently active in six provinces: Kratie, Kampong Cham, Prey Veng, Svey Rieng, Kandal and Kampong Speu, working with more than 1,800 MSME.
Nearing the end of the three-year project, and following a Project Monitoring and Evaluation Report in partnership with Indochina Research Ltd (IRL) in 2007, the Project has now carried out this follow-up Final Project Monitoring and Evaluation survey in 2008. In 2008, project assistance expanded to 1,800 firms and the number of target provinces expanded from four to six.
The aim of the Final Project Monitoring and Evaluation Survey 2008 is to follow-up and document the benefits to value chain primary producer clients assisted by the Project up to this year. Furthermore, this study will examine in greater depth the impacts of the Cambodia MSME Project on goods and service providers to primary producers, including Pig Input suppliers and Veterinarians, who also work with and benefit from the Project. Finally, The spread of Project benefits to non-beneficiary producers located in the same villages as MSME producer clients will be explored. A comparison of MSME Project beneficiaries to a relative control group from the initial CIDS baseline study who did not receive any benefits will also be conducted.
1.5. Methodology
The Final Project Monitoring and Evaluation Survey 2008 aims to provide results according to the Performance Monitoring Plan Indicators and targets and evaluate results on a broader range of project impact issues for enterprises in Cambodia.
The enumeration of benefits of the Cambodia MSME Project to stakeholders has been undertaken using quantitative sample surveys in face to face interviews by IRL field research interviewers. DAI and IRL worked in collaboration to improve and modify research tools based on experience gained in 2007 to improve enumeration and to cover a broader and up to date range of M&E issues.
The sample frame and sampling procedure was developed in consultation with DAI. The sample frame for randomized selection had the following parameters defining the population of DAI MSME:
MSME that were clients of DAI in the four provinces of Kratie, Kampong Cham, Prey Veng, and Svay Rieng.
MSME that were clients of DAI for at least one full production cycle; MSME in the two new newly added provinces of Kandal and Kampong Speu were excluded as most
had not yet completed a full production cycle with the project.
DAI provided the sample frame consisting of a list of 889 MSME clients to IRL on this basis. Sub-samples were then drawn for each value chain (Pigs, Fish, Brick and Tile Makers). Due to the large variation in number of enterprises by value chain and role, a mixed approach was used for the sampling different value chain actors.
The Pig value chain accounted for 92% of all DAI clients in the population at 825 enterprises. Within this value chain, Pig Producers and Veterinarians were randomly sampled. The far less numerous Pig Input Suppliers and one Slaughter-house were purposively selected for a 100% sub-population sample. Due to the small population of Fish and Brick and Tile Maker firms in these value chains, they were also purposively selected for a 100% sub-population sample. Using this method, we aimed to considerably increase the sub-samples of these not so numerous but important DAI value chain clients in the 2008 study.
USAID-Funded Cambodia MSME Strengthening Project Final Monitoring And Evaluation Survey 2008 26
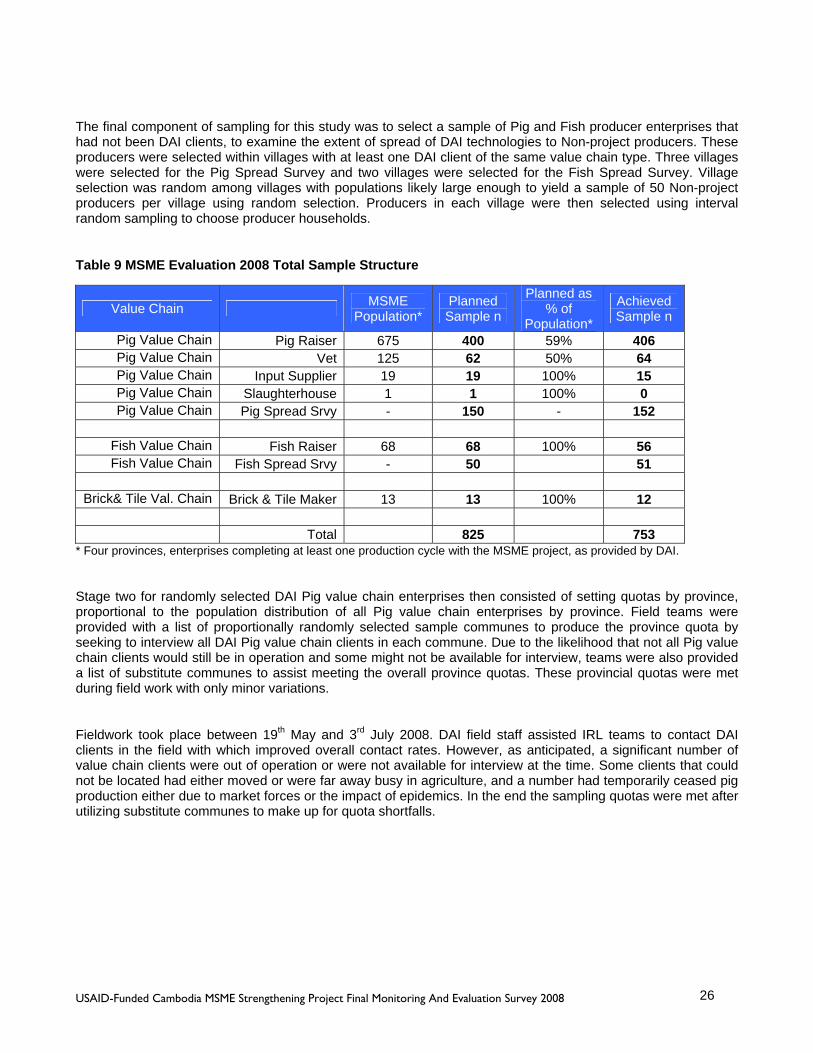
The final component of sampling for this study was to select a sample of Pig and Fish producer enterprises that had not been DAI clients, to examine the extent of spread of DAI technologies to Non-project producers. These producers were selected within villages with at least one DAI client of the same value chain type. Three villages were selected for the Pig Spread Survey and two villages were selected for the Fish Spread Survey. Village selection was random among villages with populations likely large enough to yield a sample of 50 Non-project producers per village using random selection. Producers in each village were then selected using interval random sampling to choose producer households.
Table 9 MSME Evaluation 2008 Total Sample Structure
Value Chain MSME Population*
Planned Sample n
Planned as % of
Population*
Achieved Sample n
Pig Value Chain Pig Raiser 675 400 59% 406 Pig Value Chain Vet 125 62 50% 64 Pig Value Chain Input Supplier 19 19 100% 15 Pig Value Chain Slaughterhouse 1 1 100% 0 Pig Value Chain Pig Spread Srvy - 150 - 152
Fish Value Chain Fish Raiser 68 68 100% 56 Fish Value Chain Fish Spread Srvy - 50 51
Brick& Tile Val. Chain Brick & Tile Maker 13 13 100% 12
Total 825 753
* Four provinces, enterprises completing at least one production cycle with the MSME project, as provided by DAI.
Stage two for randomly selected DAI Pig value chain enterprises then consisted of setting quotas by province, proportional to the population distribution of all Pig value chain enterprises by province. Field teams were provided with a list of proportionally randomly selected sample communes to produce the province quota by seeking to interview all DAI Pig value chain clients in each commune. Due to the likelihood that not all Pig value chain clients would still be in operation and some might not be available for interview, teams were also provided a list of substitute communes to assist meeting the overall province quotas. These provincial quotas were met during field work with only minor variations.
Fieldwork took place between 19th May and 3rd July 2008. DAI field staff assisted IRL teams to contact DAI clients in the field with which improved overall contact rates. However, as anticipated, a significant number of value chain clients were out of operation or were not available for interview at the time. Some clients that could not be located had either moved or were far away busy in agriculture, and a number had temporarily ceased pig production either due to market forces or the impact of epidemics. In the end the sampling quotas were met after utilizing substitute communes to make up for quota shortfalls.
USAID-Funded Cambodia MSME Strengthening Project Final Monitoring And Evaluation Survey 2008 27
Analysis and Data Limitations The design of the Final Project Monitoring and Evaluation Survey 2008 benefited from experience of undertaking the 2007 Midpoint Evaluation and the earlier Baseline study. DAI and IRL worked on improving the sampling methodology for a broader range of DAI value chain clients as described above to give more representative results. The desired sample has been achieved during field research. Research tools were redesigned in an attempt to improve enumeration and to cover new or other areas of importance to the final evaluation of DAI MSME impacts that were not covered in the Baseline or Midpoint Evaluation. For these reasons, the 2008 Monitoring and Evaluation Survey was structured to include its own measures of baseline indicators. To do this, the survey sections asked questions in relation to both the most recent year, May 2007 to April 2008, and for the last year of operations for the enterprise before commencing with the DAI MSME project. For example, questions on volumes and value of sales followed this format. Thus the study in 2008 has an internal baseline. Limitations to this baseline are therefore matters of limitations to accurate recall by respondents, where few enterprises keep formal business records. The better seasonal timing of the field research for the 2008 study meant that producers had just recently completed their average annual production cycles, making the before/after project intervention comparisons more robust. Notably this was also the case for Fish Producers, who had not completed their production cycle at the time of the 2007 Midpoint Evaluation. 3. STUDY RESULTS The results of this study are divided into sections, according to the three value chains supported by the DAI MSME project: the pig value chain, fish value chain and the brick and tile value chain. Within the pig value chain section, separate sub-sections provide results for Pig Producers, Veterinarians and Input Suppliers within the value chain. Throughout these sections of the report, results are compared with project targets for 2008 which emanate from the 2008, Year 3 Project Work Plan submitted by DAI and approved by USAID. The final section provides a summary overview of findings in relation to the DAI MSME Performance Monitoring Plan Indicators and targets for 2006, 2007 and 2008. Each section starts with a general profile of enterprises. For the first time, a demographic profile of business owners and their households including age, sex, education, value chain experience and household composition is included. The next section then provides results on the duration of involvement with the project and specific results on types of DAI MSME training and activities they have attended by gender. The following sections provide an analysis of project impacts on business performance including new capital investments, volume and value of sales, and access to credit. New in 2008, the surveys also incorporates new sections for the analysis of project impacts on labor employment and business service utilization, a more detailed section on business productivity impacts, and further new sections analyzing perceived impacts on poverty alleviation and impacts on business policy advocacy.

USAID-Funded Cambodia MSME Strengthening Project Final Monitoring And Evaluation Survey 2008 28
2. PIG VALUE CHAIN -PIG PRODUCERS Of a total of 1,655 enterprises of all types working with the DAI MSME project in 2008, 83% or 1,376 businesses are enterprises in the pig value chain. Within this value chain 88% of pig enterprises are Pig Producers, 10% are Veterinarians and 2% are Input Suppliers. Results are presented for each of these different actors in the pig value chain in turn. While DAI Project Monitoring Indicators relate only to Pig Producers, we have included Veterinarians and Input Suppliers to provide a broader indication of DAI MSME project impacts on the value chain as a whole.
2.1. Demographic Profile This survey interviewed a proportionately and randomly selected sample of 406 DAI MSME Pig Producers (33% of the total), engaged with the project for at least one production cycle and within the four of six provinces in which DAI has operated. The four provinces sampled account for 86% of the total of project Pig Producers and the vast majority of producers that have completed at least one production cycle with the project, The geographical distribution of DAI MSME Pig Producers by province is uneven, with 44% located in Kampong Cham province, 29% in Kratie, 12% in Prey Veng and 16% in Svay Rieng. DAI MSME Pig Producers are 22% female and 78% male. A higher proportion of female producers are found in Kampong Cham (30%) and in Kratie (27%) and a much lower proportion in Prey Veng (8%) and in Svay Rieng (0%). Project staff need to recruit more women producers in the two south-eastern provinces to match the better gender balance achieved in Kampong Cham. DAI MSME Pig Producers are typically aged around 38 years and have had an average of 6.4 years experience raising pigs before joining the project. Their households are composed of an average of 1.8 female and 1.9 males aged over 15 years and 1.2 boys and 1.2 girls aged less than 15 years. They are more educated that average in a rural Cambodian context. Overall 66% have at least some level of secondary level education, with only limited variations by province.
2.2. Project Collaboration & Training Benefits Most Pig Producers had been engaged with the DAI MSME project for a period of at least 12-24 months and 100% confirmed that their primary position in the pig value chain was as a Pig Producer. Table 10 Pig Enterprises: Months since joining the MSME project
Month category Count % <12 months 96 24
12 - 24 months 266 66 > 24 months 44 11
Total 406 100 A core activity in support of Pig Producers for the DAI MSME has been to organize technical training and related capacity building activities in pig production and business practices. The 406 sampled enterprises reported attending a total of a 3,532 person/training activities since joining the project, an average of 8.7 training attendances per enterprise. 100% of training was undertaken by business owners rather than employees. The breakdown of types of courses attended and by province is shown in the following chart. Participation rates are particularly high for pig production technical courses, usually in the range of about 60-90% of enterprises.

USAID-Funded Cambodia MSME Strengthening Project Final Monitoring And Evaluation Survey 2008 29
For core technical training in areas including Pig Raising Technique, Vaccinations/Medicine and Pig Disease Diagnosis participation rates are over 80%. For business skills development courses, participation rates are lower, in the range of 25-50%. Business Accounting training has been provided to 50% of enterprises and Business Advocacy training has been provided to 30% of enterprises. About one third of enterprises have also participated in Exposure Trips to other provinces or to other countries. Figure 11 Pig Producers: MSME Project Facilitated Trainings
30113
10390
122110
202318
338
272196
393251
400
258
336
0 50 100 150 200 250 300 350 400
No. of Pig Enterprise Trainees
Group Mee ings with MSME StaffFeed making technique
Vaccinations/MedicinePig Breeding Techniques
Pig raising techniquePig Waste Management/Biogas
Pig Farm ManagementPig Disease Diagnosis
Pig stye/Pigpen improvementBasic business Accounting
Business Training OtherBusiness advocacy
Intro. to Finance InstitutionsIntroduc ion toTraders
Cross provincial Exposure tripInterna ional Exposure Trip
Pig Producers: MSME Project Facilitated Trainings n=3532
DAI MSME training and related capacity building activities are gender balanced in relation to the 22% proportion of women owned enterprises already participating with the project. Women Pig Producers are proportionally represented in pig technical training courses and are over-represented in business training and Exposure Trips. Project staff are enabling women to participate equitably in training opportunities once they have joined the project. Core potential impacts of these capacity building activities are improvements in enterprise productivity and profitability. These results are presented in a later section. However, another potential impact is to facilitate diversification of enterprises from sole pig production to incorporating other pig value chain business activities. This Final Evaluation explored the extent of diversification among pig production enterprises as a result of DAI organized capacity building for the first time. The results are interesting. Following DAI organized capacity building activities, 58% of Pig Producer enterprises diversified into pig trading, 30% diversified into pig production input providers and 13% diversified into Veterinarian or other pig production service provider roles. So, increasing value chain diversification has quite often been an additional impact of DAI MSME-organized capacity building activities.

USAID-Funded Cambodia MSME Strengthening Project Final Monitoring And Evaluation Survey 2008 30
2.3. Impacts on New Capital Investments & Credit, Gross Sales Volume & Revenue, Cost
of Production & Gross Profit
OBJECTIVE: Component 2: Enhanced Capacity of Value Chain Firms &/or Stand-Alone Providers to Support Competitive Value Chains
Indicator Value Chain Unit Target
FY2008 Actual FY2008
% of FY Target
2.3. Percent increase in value of new investments by MSME Pig Mean
$/MSME $1,200 $5,256 438%
An important indicator of project performance is the increase in the average value of new investments in pig production enterprises. This is also an indicator for future projected earnings. The value of “new investments” is defined as the sum of three investment components: fixed capital investments during the project, the value of pig stock at the start of the production cycle in May 2007 and the value of total costs of pig production May 2007 - April 2008. The 2008 target for average new investments per enterprise was $1,200. The result was an average of new investments of $5,256 or 438% of target. The tables below show the composition of new investments by component as well as the total. In 2008, the major investment is in pig stock at the start of year, followed by investments in cost of production. Table 11 Pig Producers: Mean Value of New Investments since joining the MSME project (USD)
New Investment Components N=406 Mean/Enterprise
Fixed Capital investments $688.43 Pig Stock $2,532.30
Total cost of Pig Production $2,035.56
Total $5,256.28 The most common pattern of Fixed Capital Investments, accounting for about half these enterprises, was to invest in pig pens (1 unit), troughs (2 units) and sows (1.4 head). Land was an additional investment by 38% of enterprises but the land areas bought were typically very small (40 m2). The average enterprise pig stock investments at the start of the production cycle in May 2007 consisted of 16 piglets (value $609), 8 feeder pigs (value $1,302), 3 sows (value $588), and 0 boars. The total average number of head of stock has grown from 24 head before joining the project to 27 head during the last year. This overall growth in average pig stock investments for all enterprises in the sample since pre-project is reduced by the different investment patterns of a small number of very large scale Pig Producers. These large scale producers had a maximum of up to 500 piglets and 400 feeder pigs/enterprise before joining the project decreasing their stock to a maximum of 200 piglets and 400 feeder pigs in 2008. These results reduce average growth in enterprise pig stock investments for all other enterprises. The following table shows the composition and average enterprise investment in pig costs of production for the period May 2007-April 2008. The average total enterprise investment in pig costs of production was $2,036. By far the largest investment was made in pig supplementary feed, accounting for 78% of total costs, followed buying piglets accounting for 12% of total costs.

USAID-Funded Cambodia MSME Strengthening Project Final Monitoring And Evaluation Survey 2008 31
Table 12 Pig Producers: Cost of Pig Production for the year 2007-2008 (USD)
Cost Item N=406 Mean Median Std. D Max Sum Piglets 235 0 645 7,500 95,405
Supplementary Feed 1,593 900 2,609 35,000 646,833 Vaccine 80 21 501 10,000 32,437
Medicine 29 9 58 500 11,838 Veterinary Service 10 0 36 350 4,141
Machinery Fuel & Oil 54 20 91 540 21,954 Machinery Repair/Maintenance 8 0 22 225 3,051
Hired Labor Part-time 2 0 27 480 730 Hired Labor Fulltime 8 0 90 1,600 3,072
Transport Costs 17 0 38 360 6,961 Trader license fees 0 0 1 10 15
Slaughterhouse fees 0 0 0 0 0 Inspection Fees 0 0 0 0 0
Overall Cost $2,036 $826,436 The average total enterprise cost of pig production has increased by 150% from $1,360 in the last year before joining the project. The shares of different cost items in the total cost, however, have remained fairly consistent comparing pre-project and during project expenditures.
OBJECTIVE: Component 3: Ongoing Improved MSME Access to Finance
Indicator Value Chain Unit Target
FY2008 Actual FY2008
% of FY Target
3.0. Percent of MSME in target value chains that have accessed loans from any source at any time. Pig No. of
MSME 150 169 113%
An important issue for enterprises is how the Fixed Capital investments described above have been financed. Investments were financed using only their own capital in a reported 86% of enterprises. Only 14% of enterprises reported borrowing some or all of their investment capital from any kind of lender. Loans with institutional MFIs were taken by 8% of enterprises with a mean value of $648. Loans from informal credit sources were reported by 5% of enterprises with average loans amounts of $761 in loans from family or friends and $392 from private money lenders. Extrapolating the 14% rate of borrowing from the sample to all 1,209 MSME Pig Producers would mean that 169 enterprises would have borrowed from any source, being 113% of the 2008 target. These results on rates and numbers of Pig Producers accessing credit seem to relate only to credit in the form of cash loans for Fixed Capital investments. The results do not seem to include the rates and numbers of Pig Producers accessing credit for other purposes, in particular the purchase of goods and services on credit. While producers were asked about these other forms of credit, they seemed to have interpreted credit only as cash credit and responded accordingly. Results concerning rates of credit provision for goods and services to Pig Producers by Veterinarians and Input Suppliers in later sections of this report indicate that producers often access these forms of credit and that they have not been enumerated in the reported rates here. Having examined patterns of investment and expenditure, we now turn to examining key DAI MSME impacts on pig enterprise Volumes of Sales and Gross Sales Revenues. Here we provide the most recent results from the year to April 2008 and assess impacts by comparison with results from the last year before each enterprise joined the project as reported in this survey.

USAID-Funded Cambodia MSME Strengthening Project Final Monitoring And Evaluation Survey 2008 32
OBJECTIVE: Component 1: Improved Performance of USAID-Assisted Enterprises in Targeted Value Chains
Indicator Value Chain Unit Target
FY2008 Actual FY2008
% of FY Target
1.1 (a) Percent change in volume of sales of program-assisted enterprises Pigs Mean
Head/MSME 16.4 38 232
First we examine MSME project impacts on enterprise volumes of pig sales. The mean number of pigs of all types sold in the year to April 2008 was 38 head/enterprise. This exceeds the 2008 MSME target of 16.4 head by 232%, a very good result. The average composition of sales volumes in enterprises is shown in the following table. Table 13 Pig Producers: Number of Head Sold in the year 2007-2008
N=406 Mean Median Std. D Max Sum Piglets 18 0 41 500 7409 Feeder 19 12 24 280 7674
Pigs Boars 0 0 1 15 33 Sows 1 0 1 10 224
Total Head Sold 38 15340 Among all enterprises, 89% sold feeder pigs, 49% sold piglets, 20% sold sows and 3% sold boars. These volumes compare to a reported pre-project average volume of sales of 34 head/enterprise, an increase of 4 head/enterprise. This pre-project average volume of sales is higher than reported by previous baseline and evaluation studies. One reason is that the 2008 Evaluation random sample included one very large scale Pig Producer in Kampong Cham. This producer sold 500 piglets and 280 feeder pigs in 2008. In the last year before joining the project he had sold 300 boars and 600 sows. He stopped selling sows and boars in 2008 as he is changing production to feeder pigs & piglets only in collaboration with an agri-business company. These production figures have been back checked with this producer.
OBJECTIVE: Component 1: Improved Performance of USAID-Assisted Enterprises in Targeted Value Chains
Indicator Value Chain Unit Target
FY2008 Actual FY2008
% of FY Target
1.1 (b) Change in value of sales of program-assisted enterprises Pigs Mean
$/MSME $1,290 $3,786 293%
MSME project impacts on enterprise Gross Sales Revenue in the year to April 2008 also show very good results. The mean Gross Sales Revenue was $3,786/enterprise. This is 293% of the 2008 MSME target of $1,290. The average composition of Gross Sales Revenue in enterprises is shown in the following table.

USAID-Funded Cambodia MSME Strengthening Project Final Monitoring And Evaluation Survey 2008 33
Table 14 Pig Producers: Gross Sales Revenue 2007-2008 (USD)
N=406 Mean Median Std. D Max Sum Piglets $715 0 $1,936 $24,975 $290,135 Feeder $2,925 $1,721 $4,173 $53,200 $1,187,455
Pigs Boars $15 0 $130 $2,250 $6,159 Sows $132 0 $375 $3,626 $53,512
Total Sale Revenue $3,786 $2,408 $1,537,261 With the re-designed enterprise interview forms in 2008, we are also able to calculate Gross Profit of pig enterprises. The mean Gross Profit/enterprise in 2008 was $1,751, an increase of 141% over Gross Profits during the last year before joining the project. Results are shown in the following table. Table 15 Pig Producers: Gross Profit During Project 2007-2008 & Pre-Project (USD)
N=406 During Project Before Project Mean $1,751 $1,241
Median $1,043 $442 Std. Deviation $2,588 $7,619
Minimum $-2,718 $-2,250 Maximum $31,098 $149,400
Sum $710,825 $503,701 Gross Revenue was 186% of Costs of Production in 2008, down slightly from 191% pre-project. The proportion of enterprises making a loss in 2008 was 10%, well down from 18% of enterprises making a loss pre-project. Figure 12 Pig Producers: Cost of Business & Revenues Pre-Project & During Project 2008
$1,360
$2,601
$2,036
$3,786
$0
$500
$1,000
$1,500
$2,000
$2,500
$3,000
$3,500
$4,000
Last Year Before Project During Project 2008
Pig Producers-Cost of Business & Revenues- Last Year Pre-Project & During Project 2008
Cost of Business Total Revenue

USAID-Funded Cambodia MSME Strengthening Project Final Monitoring And Evaluation Survey 2008 34
Overall MSME project impact on both volume of sales and value of sales has been very positive, exceeding project targets by large margins and showing improvements in comparison to pre-project enterprise productivity. Given that Pig Producers are 73% of the DAI MSME client base, these results are very important for evaluating overall project impacts on business productivity.
2.4. Impact on Labor Employment & Business Service Utilization DAI MSME impacts on labor employment are potentially important in a number of ways. Improved enterprises can provide increased employment opportunities for Pig Producer family members and hired labor, either casual or full-time. Rural employment generation allows more people to make a living in their communities and cuts down the need for migration, a risky strategy, especially for more vulnerable groups such as youth and young adults aged 15-24 years. Increasing employment also contributes directly to reducing rural poverty. This 2008 Evaluation explored in more detail project impact on labor employment. First, we have results on the employment of Pig Producer household members in the enterprise, either full time or part time. On average 3.27 household members were employed per enterprise representing most of the household labor force aged 15 years and over. Typically, employed labor included both one male and one female aged 25 years or older. In about 50% of enterprise cases, a female and male aged 15-24 years were also employed. The gender distribution of household labor is quite even. In total 1,326 household members were employed in these 406 enterprises. Table 16 Pig Producers: Household Labor Employment During Project 2008 (persons)
N=406 Mean Median Std. D Max Sum Females-Aged 15-24 years 0.56 0.00 0.84 4.00 228 Females-Aged >=25 years 1.02 1.00 0.51 3.00 416
Males-Aged 15-24 years 0.57 0.00 0.87 4.00 230 Males-Aged >=25 years 1.11 1.00 0.77 6.00 452
Total 3.27 3.00 1326 Enterprises also reported family labor employed during the last year before the project which averaged 3.16 household members per enterprise. Therefore, on average household member employment has increased slightly, by 0.11 persons/enterprise, since joining the project. This translates into 43 more members employed among all enterprises and an employment growth of 3.5% since joining the project. It should also be noted that all household members will likely derive extra income or benefits from the increasing profitability of the enterprise itself as discussed previously. It is found that the employment of hired labor, either full-time or casual, is very rare among these 406 pig production enterprises. In total, only 28 males and 1 female were hired for full-time labor and only 4 males and no females were hired as casual labor. Thus it appears that the DAI MSME is having only limited impacts on increasing labor employment in pig production enterprises. It is possible that labor employment is under-enumerated where labor is hired for other non-pig tasks to enable household members to have more time for pig production labor, or where labor is hired for general work that might include some work related to pig production in addition to other tasks. A further likely employment impact among household members is that pig enterprise development provides more productive work hours for family members, which is contributing to increased business income generation. This dimension of employment benefits would require further study to verify. There may be possibilities to increase employment generation in these pig enterprises by adding DAI MSME organized training courses for producers on the potential benefits and costs of using hired labor for further business development.

USAID-Funded Cambodia MSME Strengthening Project Final Monitoring And Evaluation Survey 2008 35
A related area of project impacts is in the area of utilization of pig production service providers. These are business service enterprises and they also provide employment to rural people. The level of utilization of service providers was enumerated in terms of the number of times per year that producers would engage their services and the average cost of services on each contact. The results are shown in the following table, including changes in service provider utilization before the project to during the project. Pig Input providers selling pig feed are now utilized by 99% of producers an average of once every two weeks per year and most expenditure is on pig feed. Other service providers including veterinarians, piglet sellers and transport services are used by 29% to 49% of producers each year. Comparing pre-project to during project patterns, estimated average expenditure by producers on service providers has almost doubled, by 181%, to $1,135,015. While inflation is playing some role in the increased expenditure, it is clear that clients joining the DAI MSME project are spending more on pig business services and that this is an important value added input to the pig value chain and to profitability and employment in pig business service enterprises. After joining the MSME project, the pattern is generally to slightly decrease the frequency of use of most service providers, but to spend more on average each time their services are utilized. The exceptions are a slight increase in frequency of use of Input Suppliers for pig feed and transport services. Table 17 Pig Producers: Service Provider Utilization Rates Pre-Project & During Project 2008.
Before Project During Project % Mean Mean Est. % Mean Mean Est.
Services Clients Times Cost Total Clients Times Cost Total
N=406 Times >0 % /yr /Time Cost/yr Times
>0 % /yr /Time Cost/yr
Veterinarian 34 1.7 $4.60 $3,210 29 1.2 $7.60 $3,756Piglet Sellers 35 0.8 $77.50 $24,874 31 0.6 $131.90 $34,564
Pig Feed Sellers 94 21.9 $62.20 $552,471 99 26.1 $93.20 $987,472
Pig Pen Makers 39 0.5 $52.00 $10,512 32 0.4 $107.80 $18,216
Transport Serv. 40 8.3 $10.20 $34,291 49 13.1 $17.10 $91,007
Total $625,358 $1,135,015 We can conclude that the DAI MSME project has had some impacts on employment mainly in terms of increasing household incomes from pig production from which all members benefit rather than increased numbers employed as household or hired labor, and a large increase in spending on pig service businesses, enabling growth and employment in these pig value chain service enterprises.
2.5. Business Productivity Impacts A set of questions were included to enumerate MSME impacts on pig enterprise productivity. Indicators included changes to pig morality rate by type of pig, changes in live-weight at sale and changes in the period required to grow a pig to saleable size and weight. These indicators were asked for the most recent year to April 2008 and for the last year before the enterprise joined the project. Mortality rates were asked separately for piglets, feeder pigs and boars/sows. The MSME has had a major beneficial impact in reducing average mortality rates for all types of pigs compared to pre-project rates. The piglet mortality rate has fallen from 15.5% to 9.7%, feeder pig mortality from 4% to 2.7% and boar/sow mortality from 1.5% to 1.1% as shown in the following chart.
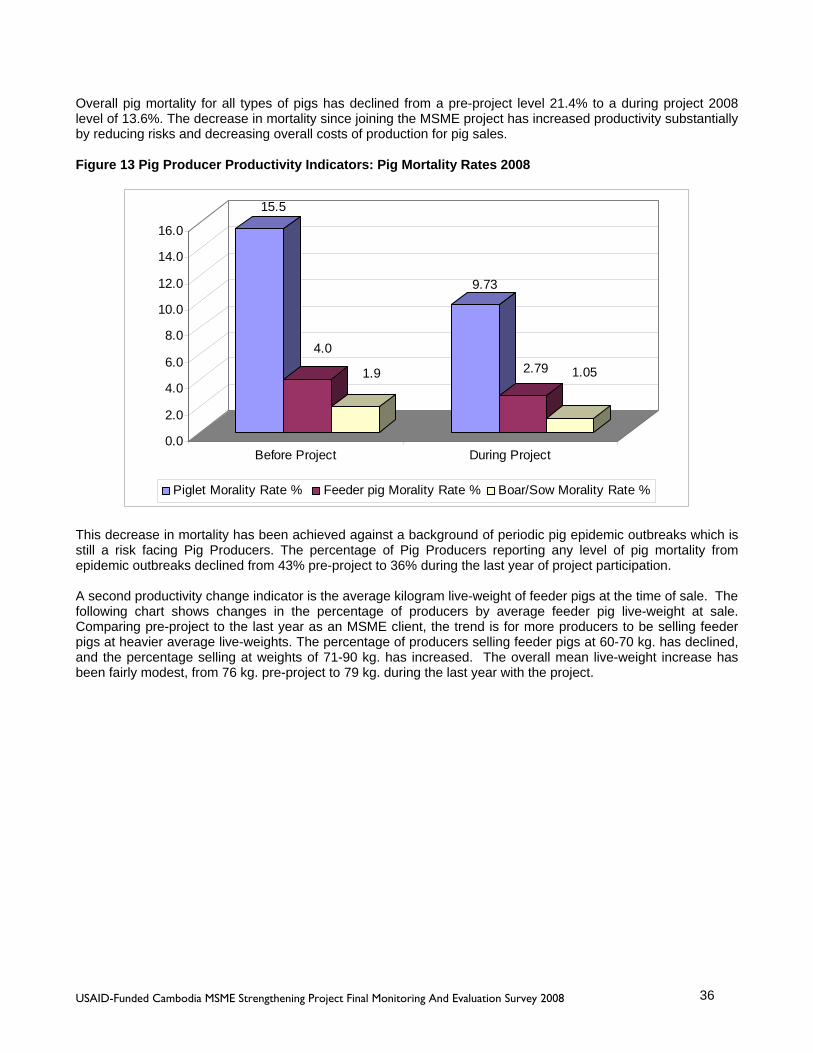
USAID-Funded Cambodia MSME Strengthening Project Final Monitoring And Evaluation Survey 2008 36
Overall pig mortality for all types of pigs has declined from a pre-project level 21.4% to a during project 2008 level of 13.6%. The decrease in mortality since joining the MSME project has increased productivity substantially by reducing risks and decreasing overall costs of production for pig sales. Figure 13 Pig Producer Productivity Indicators: Pig Mortality Rates 2008
15.5
4.0
1.9
9.73
2.79 1.05
0.0
2.0
4.0
6.0
8.0
10.0
12.0
14.0
16.0
Before Project During Project
Piglet Morality Rate % Feeder pig Morality Rate % Boar/Sow Morality Rate %
This decrease in mortality has been achieved against a background of periodic pig epidemic outbreaks which is still a risk facing Pig Producers. The percentage of Pig Producers reporting any level of pig mortality from epidemic outbreaks declined from 43% pre-project to 36% during the last year of project participation. A second productivity change indicator is the average kilogram live-weight of feeder pigs at the time of sale. The following chart shows changes in the percentage of producers by average feeder pig live-weight at sale. Comparing pre-project to the last year as an MSME client, the trend is for more producers to be selling feeder pigs at heavier average live-weights. The percentage of producers selling feeder pigs at 60-70 kg. has declined, and the percentage selling at weights of 71-90 kg. has increased. The overall mean live-weight increase has been fairly modest, from 76 kg. pre-project to 79 kg. during the last year with the project.
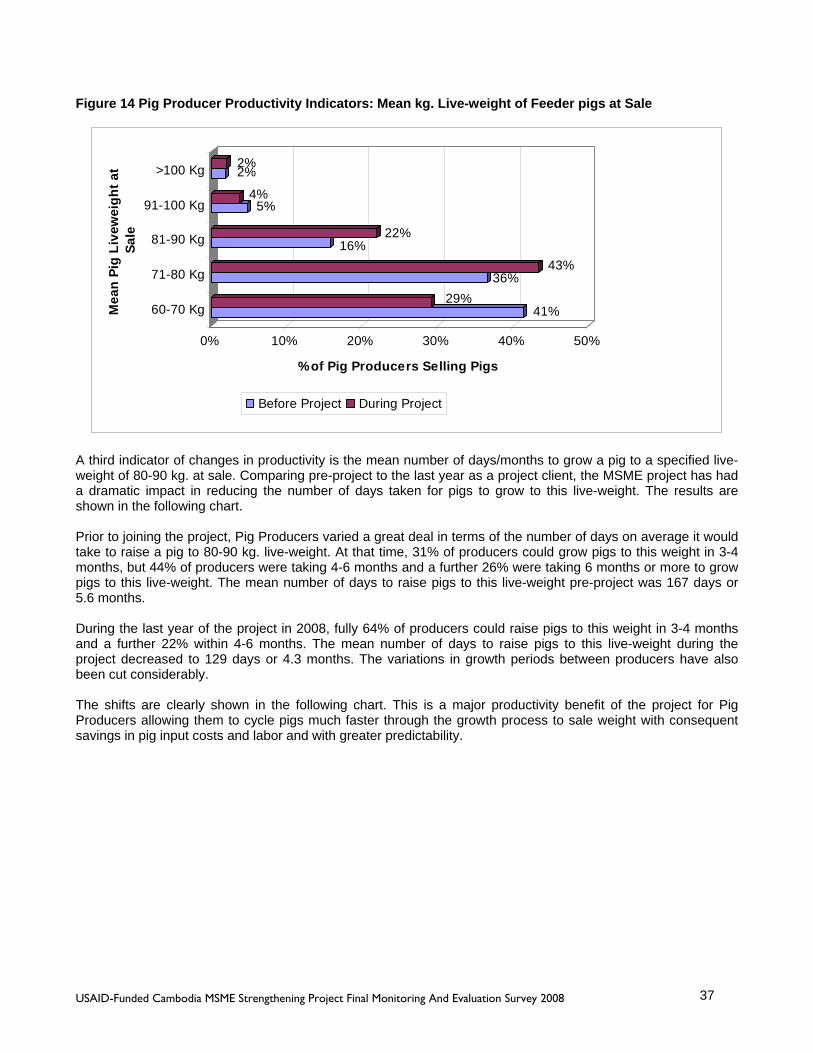
USAID-Funded Cambodia MSME Strengthening Project Final Monitoring And Evaluation Survey 2008 37
Figure 14 Pig Producer Productivity Indicators: Mean kg. Live-weight of Feeder pigs at Sale
41%29%
36%43%
16%22%
5%4%
2%2%
0% 10% 20% 30% 40% 50%
% of Pig Producers Selling Pigs
60-70 Kg
71-80 Kg
81-90 Kg
91-100 Kg
>100 Kg
Mea
n Pi
g Li
vew
eigh
t at
Sale
Before Project During Project
A third indicator of changes in productivity is the mean number of days/months to grow a pig to a specified live-weight of 80-90 kg. at sale. Comparing pre-project to the last year as a project client, the MSME project has had a dramatic impact in reducing the number of days taken for pigs to grow to this live-weight. The results are shown in the following chart. Prior to joining the project, Pig Producers varied a great deal in terms of the number of days on average it would take to raise a pig to 80-90 kg. live-weight. At that time, 31% of producers could grow pigs to this weight in 3-4 months, but 44% of producers were taking 4-6 months and a further 26% were taking 6 months or more to grow pigs to this live-weight. The mean number of days to raise pigs to this live-weight pre-project was 167 days or 5.6 months. During the last year of the project in 2008, fully 64% of producers could raise pigs to this weight in 3-4 months and a further 22% within 4-6 months. The mean number of days to raise pigs to this live-weight during the project decreased to 129 days or 4.3 months. The variations in growth periods between producers have also been cut considerably. The shifts are clearly shown in the following chart. This is a major productivity benefit of the project for Pig Producers allowing them to cycle pigs much faster through the growth process to sale weight with consequent savings in pig input costs and labor and with greater predictability.

USAID-Funded Cambodia MSME Strengthening Project Final Monitoring And Evaluation Survey 2008 38
Figure 15 Pig Producer Productivity Indicators: Mean Number of Months to Grow a Pig to 80-90 kg.
0%
31%20% 24%
13% 13%1%
64%
22% 10%
2% 1%
0%10%20%30%40%50%60%70%80%90%
100%
< 3 months 3-4 months 4-5 months 5-6 months 6-7 months > 7 months
Mean months to sale weight 80-90 kg.
% o
f Pig
Pro
duce
rs
Before Project During Project
The MSME project has had substantial impacts on increasing business productivity of client pig raisers. The main impacts have included across the board reductions in pig mortality rates and a large reduction in time required to grow pigs to weight for sale. There are also modest positive impacts found in terms of increasing average pig live-weights at sale.
2.6. Perceived Links to Poverty Alleviation This Final Evaluation, for the first time, included some indicators to explore the broader linkages between MSME project impacts and the issue of poverty alleviation in rural Cambodia. The indicators included client producer’s estimates of the shift in proportion of total household income generated by project participation, perceptions of the importance of MSME assistance to non-project producers to contribute to poverty alleviation and the impact on client households in terms of extending education for their children. The first indicator was Pig Producers estimates of the shift in proportion of total household income generated from all sources arising from project benefits to pig production, comparing pre-project with during project 2008. This was a difficult question to answer as very few producers keep any records of income from different activities they engage in (typically a combination of rice and other crop production, livestock production including poultry and cattle, harvesting natural resources and casual wage labor and household micro-enterprise activities). Results indicated a moderate shift since pre-project towards pig production accounting for a larger percentage of household income from all sources. Pre-project, most producers estimated that pig production accounted for perhaps 10%-< 50% of total household income, with 33% reporting pig production as 40% more of their total income. In 2008 after joining the project, most producers estimated that pig production now accounted for perhaps 20%-< 60% of total household income with 54% reporting pig production as 40% or more of their total income. While enumeration of total income share benefit are difficult and reported gains appear limited, these results are still of interest. They indicate that while general economic growth is occurring and while inflation and market shifts are having an impact, MSME client Pig Producers still recognize that pig production is playing a larger role in their total household incomes.

USAID-Funded Cambodia MSME Strengthening Project Final Monitoring And Evaluation Survey 2008 39
A second indicator simply asked the following question: “Many rural families in Cambodia are still poor. In your opinion, how important can the kind of support for pig businesses provided by the DAI MSME project be to reducing poverty among other rural families in Cambodia?” Client Pig Producers expressed a clear opinion, with 45% of respondents perceiving that the extension of the assistance provided MSME to other poorer Pig Producers would be a “Very Important” contribution to rural poverty alleviation in Cambodia and a further 41% of respondents felt that it would be “Quite Important”. The third indicator of impacts on poverty alleviation was more direct, asking client producers about potential project impacts on education retention rates and further education within their own households. Respondents were asked: “Have your benefits from joining the DAI MSME project helped you fund more years of education for your children than you originally planned for them before joining the project?” Fully 78% of all Pig Producers answered that the project had indeed helped fund more years of education their own children. They further specified that this had benefited an average of 1.2 boys and 1.2 girls per household and had supported the extra education of a total of 370 boys and 372 girls among the 406 sample households. These responses are from client Pig Producer entrepreneurs who are typically among the wealthier and more educated segment of the rural population. They draw linkages between MSME project assistance, increasing total household income and increasing children’s education in their own households. Furthermore they perceive very commonly that MSME assistance could lead to similar benefits among poorer rural Pig Producers, and could therefore make an important contribution to poverty alleviation in Cambodia.
2.7. Impact On Business Accounting & Business Policy Advocacy
OBJECTIVE: Component 3: Ongoing Improved MSME Access to Finance
Indicator Value Chain Unit Target
FY2008 Actual FY2008
% of FY Target
3.1. Number of MSME trained in basic accounting. Pig No. of MSME 100 119 119%
An important component of MSME activities has been to foster improved business accounting practices. Clients are sent for training in accounting skills as a component of capacity building activities. The 2008 target was for 100 Pig Producers to adopt improved accounting as a result of project assistance. The result was that 9.8% of the 406 producers sampled had adopted. A simple extrapolation of this rate to all 1,209 MSME pig client enterprises gives a total of 119 enterprises, or 119% of target. Another important component of MSME activities has been to foster increased participation of Pig Producers in business policy advocacy to improve the business environment for these enterprises. During the enterprise survey, we asked questions concerning participation of producers in business associations, the first step to increasing participation in advocacy. The result is that 39% of enterprises reported that they had joined a new pig business association since joining the project. A simple extrapolation to all MSME pig clients would mean that 471 pig enterprises joined associations representing 119% of the 2008 target. 3. PIG VALUE CHAIN -VETERINARIANS
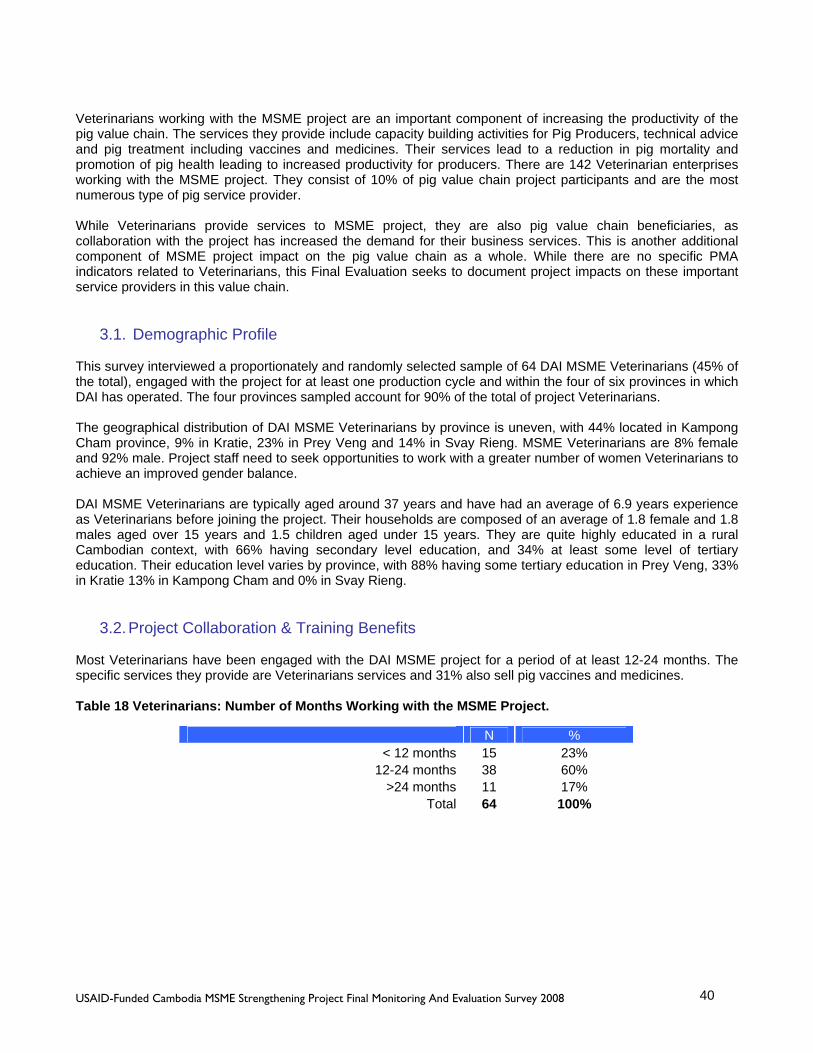
USAID-Funded Cambodia MSME Strengthening Project Final Monitoring And Evaluation Survey 2008 40
Veterinarians working with the MSME project are an important component of increasing the productivity of the pig value chain. The services they provide include capacity building activities for Pig Producers, technical advice and pig treatment including vaccines and medicines. Their services lead to a reduction in pig mortality and promotion of pig health leading to increased productivity for producers. There are 142 Veterinarian enterprises working with the MSME project. They consist of 10% of pig value chain project participants and are the most numerous type of pig service provider. While Veterinarians provide services to MSME project, they are also pig value chain beneficiaries, as collaboration with the project has increased the demand for their business services. This is another additional component of MSME project impact on the pig value chain as a whole. While there are no specific PMA indicators related to Veterinarians, this Final Evaluation seeks to document project impacts on these important service providers in this value chain.
3.1. Demographic Profile This survey interviewed a proportionately and randomly selected sample of 64 DAI MSME Veterinarians (45% of the total), engaged with the project for at least one production cycle and within the four of six provinces in which DAI has operated. The four provinces sampled account for 90% of the total of project Veterinarians. The geographical distribution of DAI MSME Veterinarians by province is uneven, with 44% located in Kampong Cham province, 9% in Kratie, 23% in Prey Veng and 14% in Svay Rieng. MSME Veterinarians are 8% female and 92% male. Project staff need to seek opportunities to work with a greater number of women Veterinarians to achieve an improved gender balance. DAI MSME Veterinarians are typically aged around 37 years and have had an average of 6.9 years experience as Veterinarians before joining the project. Their households are composed of an average of 1.8 female and 1.8 males aged over 15 years and 1.5 children aged under 15 years. They are quite highly educated in a rural Cambodian context, with 66% having secondary level education, and 34% at least some level of tertiary education. Their education level varies by province, with 88% having some tertiary education in Prey Veng, 33% in Kratie 13% in Kampong Cham and 0% in Svay Rieng.
3.2. Project Collaboration & Training Benefits Most Veterinarians have been engaged with the DAI MSME project for a period of at least 12-24 months. The specific services they provide are Veterinarians services and 31% also sell pig vaccines and medicines. Table 18 Veterinarians: Number of Months Working with the MSME Project.
N % < 12 months 15 23%
12-24 months 38 60% >24 months 11 17%
Total 64 100%
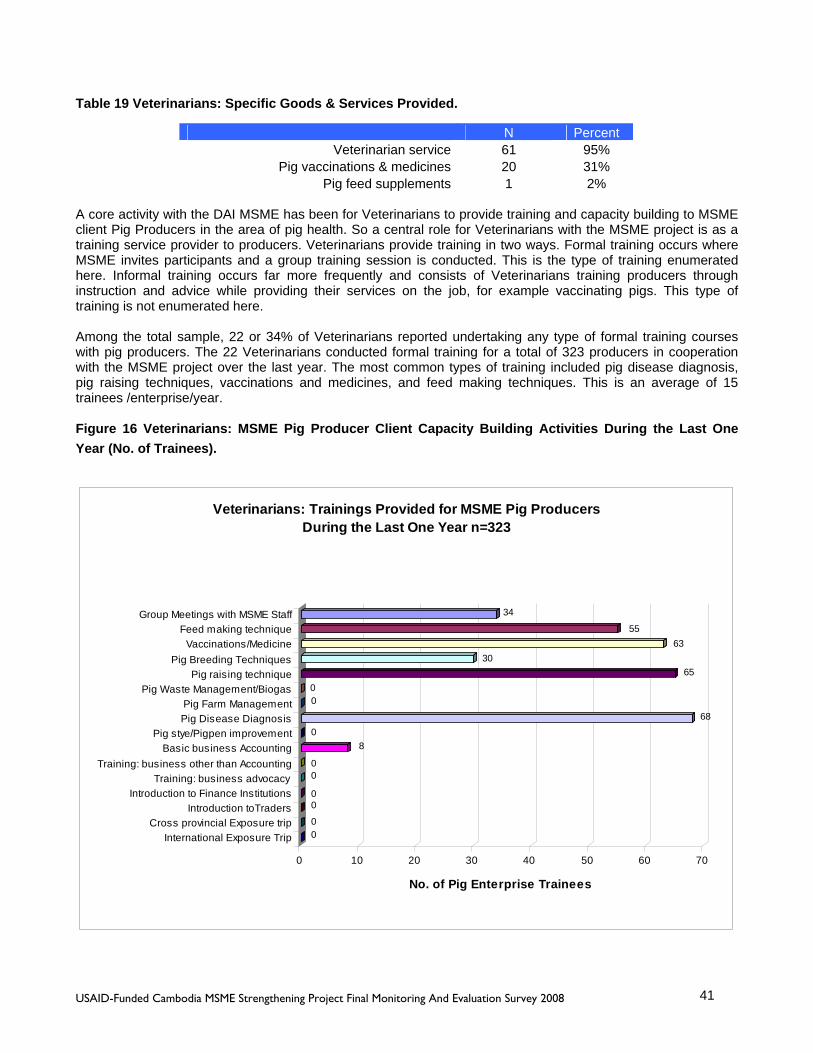
USAID-Funded Cambodia MSME Strengthening Project Final Monitoring And Evaluation Survey 2008 41
Table 19 Veterinarians: Specific Goods & Services Provided.
N Percent Veterinarian service 61 95%
Pig vaccinations & medicines 20 31% Pig feed supplements 1 2%
A core activity with the DAI MSME has been for Veterinarians to provide training and capacity building to MSME client Pig Producers in the area of pig health. So a central role for Veterinarians with the MSME project is as a training service provider to producers. Veterinarians provide training in two ways. Formal training occurs where MSME invites participants and a group training session is conducted. This is the type of training enumerated here. Informal training occurs far more frequently and consists of Veterinarians training producers through instruction and advice while providing their services on the job, for example vaccinating pigs. This type of training is not enumerated here. Among the total sample, 22 or 34% of Veterinarians reported undertaking any type of formal training courses with pig producers. The 22 Veterinarians conducted formal training for a total of 323 producers in cooperation with the MSME project over the last year. The most common types of training included pig disease diagnosis, pig raising techniques, vaccinations and medicines, and feed making techniques. This is an average of 15 trainees /enterprise/year. Figure 16 Veterinarians: MSME Pig Producer Client Capacity Building Activities During the Last One Year (No. of Trainees).
00
00
00
80
6800
6530
6355
34
0 10 20 30 40 50 60 70
No. of Pig Enterprise Trainees
Group Meetings with MSME StaffFeed making technique
Vaccinations/MedicinePig Breeding Techniques
Pig raising techniquePig Waste Management/Biogas
Pig Farm ManagementPig Disease Diagnosis
Pig stye/Pigpen improvementBasic business Accounting
Training: business other than AccountingTraining: business advocacy
Introduction to Finance InstitutionsIntroduction toTraders
Cross provincial Exposure tripInternational Exposure Trip
Veterinarians: Trainings Provided for MSME Pig Producers During the Last One Year n=323

USAID-Funded Cambodia MSME Strengthening Project Final Monitoring And Evaluation Survey 2008 42
An estimate of the total number of DAI pig producers trained by the sample veterinarian enterprises over the entire project cycle can also be made. If the number of trainings during the last year are assumed to be a reasonable indication of the number of trainings for each year, for each Veterinarian, then this total estimate would equal the number of trainees last year multiplied by the number of years the veterinarian has worked with the DAI project. Calculating on this basis, the sample Veterinarians would have trained an estimated total of 499 producer trainees over the project cycle. The sample of 64 Veterinarians is 45% of the total 142 Veterinarians working with the project. From the above sample estimation we can further estimate that all veterinarians working with the project would likely have provided training to around 1,100 DAI pig producer trainees (499 x 222%) over the project cycle, including multiple training of some individual producers. As service providers, Veterinarians also provide training and capacity building to Pig Producers who are not MSME project clients. By working with the MSME project, Veterinarians have developed their own skills and capacities to offer training services to producers, benefiting both their own businesses and non-project producers. This is an indirect impact of the MSME. For the first time this evaluation sought to quantify the amount of training that MSME Veterinarians are providing to non-project producers. The results from this sample of Veterinarians were that 22 enterprises reported formal training of 634 non-project Pig Producer participants independent of the MSME project over the last one year, an average of 28 training sessions/enterprise. This means that 34% of formal training undertaken by these Veterinarians is with MSME project producers and 66% is undertaken with non-project Pig Producers. This indicates that cooperation with the MSME project and its client producers has had a role in generating about twice the volume of training service business independent of the project, and that additionally, twice the number of non-project Pig Producers have benefited from trainings by these Veterinarians over the last year. These external benefits can further be multiplied by the number of years the Veterinarian has been engaged with the project, although we lack sufficient information to make a likely estimate of the numbers of external trainees. These are interesting results in terms of indirect impacts of the MSME project on the pig value chain in general. Figure 17 Veterinarians: Non- Project Pig Producer Capacity Building Activities During the Last One Year (No. of Trainees).
0000000
52168
00
20717
1855
0
0 50 100 150 200 250
No. of Pig Enterprise Trainees
Group Meetings wi h MSME StaffFeed making technique
Vaccinations/MedicinePig Breeding Techniques
Pig raising techniquePig Waste Management/Biogas
Pig Farm ManagementPig Disease Diagnosis
Pig stye/Pigpen improvementBasic business Accounting
Training: business other than AccountingTraining: business advocacy
Introduction to Finance Ins itutionsIntroduction toTraders
Cross provincial Exposure tripInternational Exposure Trip
Veterinarians: Trainings Provided for Non-Project Pig Producers During the Last One Year n=634

USAID-Funded Cambodia MSME Strengthening Project Final Monitoring And Evaluation Survey 2008 43
While these results are interesting it should be noted that this first enumeration of the number of pig producer participants trained by Veterinarian enterprises seems likely to have under-estimated the actual numbers of trainees. This can be seen by comparing the above results with earlier results, where MSME Pig Producers are directly asked the number of participants from their enterprises that had received training since joining the project. There are three possible reasons for this difference. One possible reason is that the number of Veterinarian enterprises engaged in training may have been under-enumerated. This may be due to uncertainty as to what represents formal (enumerated) versus informal (not enumerated) training activities. The fact that only 34% of project Veterinarian enterprises report under-taking any formal training at all seems likely to be low. A second reason is that pig producers may have included some informal on the job training sessions along with formal training sessions arranged and implemented by Veterinarians for the project, increasing the producer-reported number of trainees A third reason is that Veterinarians may have under-enumerated the number of trainees, in some cases reporting the number of group training sessions rather than the number of individuals trained.
3.3. Impacts on New Capital Investments & Credit, Gross Sales Volume & Revenue, Cost of Production & Gross Profit,
Impacts of the MSME project directly on Veterinarian service providers are not measured in the PMA Indicators for project performance. Nevertheless, here we examine the major characteristics of Veterinarian businesses and examine indirect MSME project impacts through a comparison of pre-project and during project indicators. New investments in Veterinarian enterprises since joining the project are calculated as the sum of Fixed Capital Investments and Costs of Business May 2007 - April 2008. Table 20 Veterinarians: Mean Enterprise New Investments Since Joining the MSME Project (USD).
Veterinarian
N=64 Mean Fixed Capital investments $428
Cost of Business Operations 2008 $2,149
Total $2,577 Most common Fixed Capital Investments were in Veterinarian equipment and storage equipment. The mean value of these investments in this sample was increased greatly (sample mean +$312) by an investment of $20,000 in storage facilities by one Veterinarian. A more typical average investment would be $125 per enterprise. Investments in cost of business in the last year to April 2008 were a mean of $2,149/enterprise. The majority of expenditures were on vaccines, medicines and feed supplements. Results include the costs for one very large scale Veterinarian business as indicated in the Maximum value column of the following table.
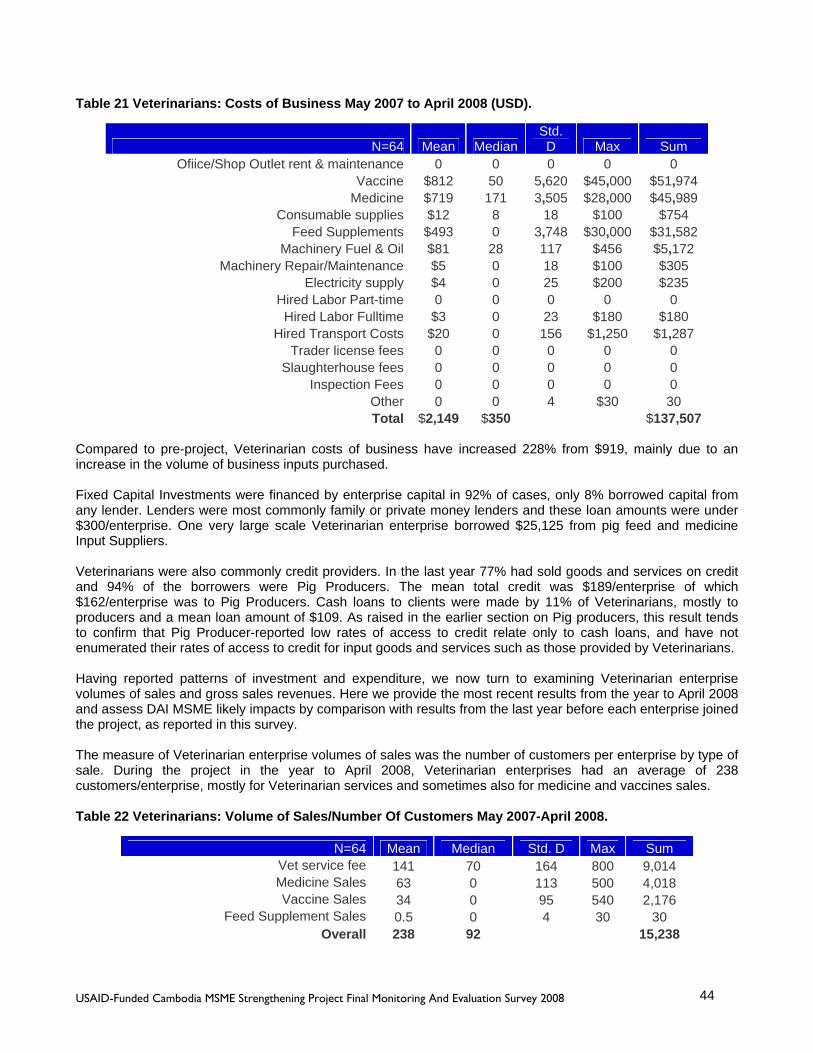
USAID-Funded Cambodia MSME Strengthening Project Final Monitoring And Evaluation Survey 2008 44
Table 21 Veterinarians: Costs of Business May 2007 to April 2008 (USD).
N=64 Mean Median Std. D Max Sum
Ofiice/Shop Outlet rent & maintenance 0 0 0 0 0 Vaccine $812 50 5,620 $45,000 $51,974
Medicine $719 171 3,505 $28,000 $45,989 Consumable supplies $12 8 18 $100 $754
Feed Supplements $493 0 3,748 $30,000 $31,582 Machinery Fuel & Oil $81 28 117 $456 $5,172
Machinery Repair/Maintenance $5 0 18 $100 $305 Electricity supply $4 0 25 $200 $235
Hired Labor Part-time 0 0 0 0 0 Hired Labor Fulltime $3 0 23 $180 $180
Hired Transport Costs $20 0 156 $1,250 $1,287 Trader license fees 0 0 0 0 0
Slaughterhouse fees 0 0 0 0 0 Inspection Fees 0 0 0 0 0
Other 0 0 4 $30 30 Total $2,149 $350 $137,507
Compared to pre-project, Veterinarian costs of business have increased 228% from $919, mainly due to an increase in the volume of business inputs purchased. Fixed Capital Investments were financed by enterprise capital in 92% of cases, only 8% borrowed capital from any lender. Lenders were most commonly family or private money lenders and these loan amounts were under $300/enterprise. One very large scale Veterinarian enterprise borrowed $25,125 from pig feed and medicine Input Suppliers. Veterinarians were also commonly credit providers. In the last year 77% had sold goods and services on credit and 94% of the borrowers were Pig Producers. The mean total credit was $189/enterprise of which $162/enterprise was to Pig Producers. Cash loans to clients were made by 11% of Veterinarians, mostly to producers and a mean loan amount of $109. As raised in the earlier section on Pig producers, this result tends to confirm that Pig Producer-reported low rates of access to credit relate only to cash loans, and have not enumerated their rates of access to credit for input goods and services such as those provided by Veterinarians. Having reported patterns of investment and expenditure, we now turn to examining Veterinarian enterprise volumes of sales and gross sales revenues. Here we provide the most recent results from the year to April 2008 and assess DAI MSME likely impacts by comparison with results from the last year before each enterprise joined the project, as reported in this survey. The measure of Veterinarian enterprise volumes of sales was the number of customers per enterprise by type of sale. During the project in the year to April 2008, Veterinarian enterprises had an average of 238 customers/enterprise, mostly for Veterinarian services and sometimes also for medicine and vaccines sales. Table 22 Veterinarians: Volume of Sales/Number Of Customers May 2007-April 2008.
N=64 Mean Median Std. D Max Sum Vet service fee 141 70 164 800 9,014 Medicine Sales 63 0 113 500 4,018 Vaccine Sales 34 0 95 540 2,176
Feed Supplement Sales 0.5 0 4 30 30 Overall 238 92 15,238
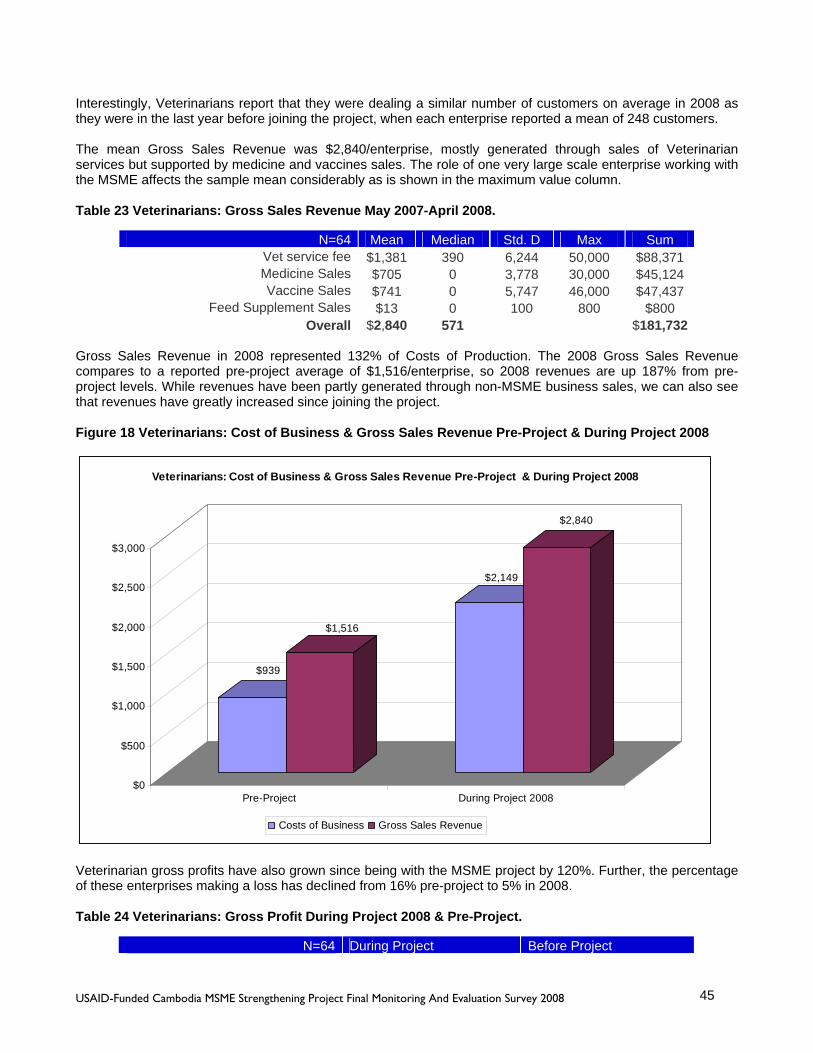
USAID-Funded Cambodia MSME Strengthening Project Final Monitoring And Evaluation Survey 2008 45
Interestingly, Veterinarians report that they were dealing a similar number of customers on average in 2008 as they were in the last year before joining the project, when each enterprise reported a mean of 248 customers. The mean Gross Sales Revenue was $2,840/enterprise, mostly generated through sales of Veterinarian services but supported by medicine and vaccines sales. The role of one very large scale enterprise working with the MSME affects the sample mean considerably as is shown in the maximum value column. Table 23 Veterinarians: Gross Sales Revenue May 2007-April 2008.
N=64 Mean Median Std. D Max Sum Vet service fee $1,381 390 6,244 50,000 $88,371 Medicine Sales $705 0 3,778 30,000 $45,124 Vaccine Sales $741 0 5,747 46,000 $47,437
Feed Supplement Sales $13 0 100 800 $800 Overall $2,840 571 $181,732
Gross Sales Revenue in 2008 represented 132% of Costs of Production. The 2008 Gross Sales Revenue compares to a reported pre-project average of $1,516/enterprise, so 2008 revenues are up 187% from pre-project levels. While revenues have been partly generated through non-MSME business sales, we can also see that revenues have greatly increased since joining the project. Figure 18 Veterinarians: Cost of Business & Gross Sales Revenue Pre-Project & During Project 2008
$939
$1,516
$2,149
$2,840
$0
$500
$1,000
$1,500
$2,000
$2,500
$3,000
Pre-Project During Project 2008
Veterinarians: Cost of Business & Gross Sales Revenue Pre-Project & During Project 2008
Costs of Business Gross Sales Revenue
Veterinarian gross profits have also grown since being with the MSME project by 120%. Further, the percentage of these enterprises making a loss has declined from 16% pre-project to 5% in 2008. Table 24 Veterinarians: Gross Profit During Project 2008 & Pre-Project.
N=64 During Project Before Project
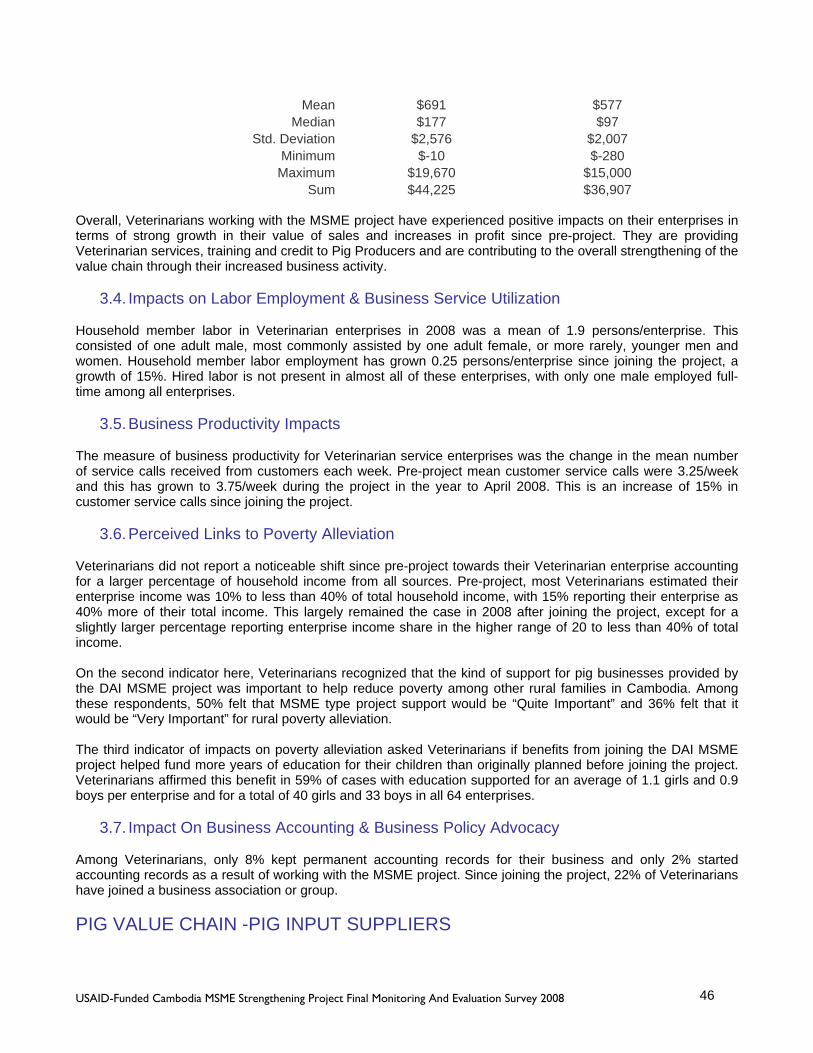
USAID-Funded Cambodia MSME Strengthening Project Final Monitoring And Evaluation Survey 2008 46
Mean $691 $577 Median $177 $97
Std. Deviation $2,576 $2,007 Minimum $-10 $-280 Maximum $19,670 $15,000
Sum $44,225 $36,907 Overall, Veterinarians working with the MSME project have experienced positive impacts on their enterprises in terms of strong growth in their value of sales and increases in profit since pre-project. They are providing Veterinarian services, training and credit to Pig Producers and are contributing to the overall strengthening of the value chain through their increased business activity.
3.4. Impacts on Labor Employment & Business Service Utilization Household member labor in Veterinarian enterprises in 2008 was a mean of 1.9 persons/enterprise. This consisted of one adult male, most commonly assisted by one adult female, or more rarely, younger men and women. Household member labor employment has grown 0.25 persons/enterprise since joining the project, a growth of 15%. Hired labor is not present in almost all of these enterprises, with only one male employed full-time among all enterprises.
3.5. Business Productivity Impacts The measure of business productivity for Veterinarian service enterprises was the change in the mean number of service calls received from customers each week. Pre-project mean customer service calls were 3.25/week and this has grown to 3.75/week during the project in the year to April 2008. This is an increase of 15% in customer service calls since joining the project.
3.6. Perceived Links to Poverty Alleviation Veterinarians did not report a noticeable shift since pre-project towards their Veterinarian enterprise accounting for a larger percentage of household income from all sources. Pre-project, most Veterinarians estimated their enterprise income was 10% to less than 40% of total household income, with 15% reporting their enterprise as 40% more of their total income. This largely remained the case in 2008 after joining the project, except for a slightly larger percentage reporting enterprise income share in the higher range of 20 to less than 40% of total income. On the second indicator here, Veterinarians recognized that the kind of support for pig businesses provided by the DAI MSME project was important to help reduce poverty among other rural families in Cambodia. Among these respondents, 50% felt that MSME type project support would be “Quite Important” and 36% felt that it would be “Very Important” for rural poverty alleviation. The third indicator of impacts on poverty alleviation asked Veterinarians if benefits from joining the DAI MSME project helped fund more years of education for their children than originally planned before joining the project. Veterinarians affirmed this benefit in 59% of cases with education supported for an average of 1.1 girls and 0.9 boys per enterprise and for a total of 40 girls and 33 boys in all 64 enterprises.
3.7. Impact On Business Accounting & Business Policy Advocacy Among Veterinarians, only 8% kept permanent accounting records for their business and only 2% started accounting records as a result of working with the MSME project. Since joining the project, 22% of Veterinarians have joined a business association or group. PIG VALUE CHAIN -PIG INPUT SUPPLIERS

USAID-Funded Cambodia MSME Strengthening Project Final Monitoring And Evaluation Survey 2008 47
Pig Input Suppliers working with the MSME project are an important component of increasing the productivity of the pig value chain. The services they provide include capacity building activities for Pig Producers, technical advice and pig production inputs including pig feed, and sometimes vaccines and medicines. Their services lead to an increase in live-weight gain and more rapid pig growth, leading to increased productivity for producers. There are 24 Input Suppliers working with the MSME project. They are 1% of pig value chain project participants. While small in number, as larger scale enterprises, they make an important contribution to pig value chain development. While Input Suppliers provide services to MSME, they are also pig value chain beneficiaries as collaboration with the project has increased the demand for their business goods and services. This is another additional component of the MSME project impact on the pig value chain as a whole. While there are no specific PMA indicators related to Input Suppliers, this Final Evaluation seeks to document project impacts on these important service providers in this value chain.
3.8. Demographic Profile This survey interviewed all 15 DAI MSME pig Input Suppliers that were engaged with the project for at least one production cycle and were available for interview within the four of six provinces in which DAI has operated. The four provinces sampled account for 83% of the total of project Input Suppliers, and the 15 enterprises interviewed represented 75% of these enterprises within these four provinces. The geographical distribution of DAI MSME Input Suppliers by province is uneven, with 54% located in Kampong Cham province, 13% in Kratie, 13% in Prey Veng and 20% in Svay Rieng. MSME Input Suppliers are 100% male owned. DAI MSME Input Suppliers are typically aged around 38 years and have had an average of 5.7 years experience as Input Suppliers before joining the project. Their households are composed of an average of 1.7 female and 2.0 males aged over 15 years and 1.3 children aged under 15 years. They are quite highly educated in a rural Cambodian context, with 40% having secondary level education, and 60% at least some level of tertiary education.
3.9. Project Collaboration & Training Benefits Most Input Suppliers have been engaged with the DAI MSME project for a long period, 53% 12-24 months and 40% for >24 months. The specific goods and services that Input Suppliers provide vary by enterprise. Most enterprises supply pig feed supplements, sometimes in combination with pig vaccines and medicines. A minority specialize in pig vaccinations and medicines and related veterinary services. Table 25 Input Suppliers: Duration of collaboration with the MSME Project
Months Count % <12 months 1 7%
12 - 24 months 8 53% > 24 months 6 40%
Total 15 100%

USAID-Funded Cambodia MSME Strengthening Project Final Monitoring And Evaluation Survey 2008 48
Table 26 Input Suppliers: Specific Goods & Services Provided.
Frequency Percent Pig Feed Supplements Only 9 60% Pig Feed Supplements, Vaccinations & Medicines 2 13% Pig Feed Supplements, Vaccinations, Medicines & Veterinary 1 7% Pig Vaccinations & Medicines & Veterinary Services 3 20% Total 15 100%
A core activity with the DAI MSME has been for Input Suppliers to provide training and capacity building to MSME client Pig Producers. Input Suppliers, like Veterinarians, can provide training in two ways. Formal training occurs where MSME invites participants and a group training session is conducted. This is the type of training enumerated here. Informal training occurs far more frequently and consists of Input Suppliers training producers through instruction and advice while on the job providing their services, for example, on using pig feed supplements. This type of training is not enumerated here. Of the 15 Input Suppliers sampled, 7 enterprises reported undertaking formal training sessions of any type within the last one year. These 7 enterprises reported training a total of 938 producers in formal training sessions in cooperation with the MSME during the last one year, averaging 134 trainees/enterprise/year. Most training sessions have been on pig raising, disease diagnosis and feed making techniques and basic business accounting. Input Suppliers have also engaged in quite a number of Exposure Trips with the MSME Project. An estimate of the total number of DAI pig producers trained by the sample Input Supplier enterprises over the entire project cycle can also be made. If the number of trainings during the last year are assumed to be a reasonable indication of the number of trainings for each year, for each Input Supplier, then this total estimate would equal the number of trainees last year multiplied by the number of years the Input Supplier has worked with the DAI project. Calculating on this basis, the sample Input Suppliers would have trained an estimated total of 1,363 producer trainees over the project cycle. The sample of 15 Input Suppliers is 75% of the total 20 Input Suppliers working with the project. From the above sample estimation we can further estimate that all Input Suppliers working with the project would likely have provided training to around 1,800 DAI pig producer trainees (1,363 x 133%) over the project cycle, including multiple training of some individual producers.

USAID-Funded Cambodia MSME Strengthening Project Final Monitoring And Evaluation Survey 2008 49
Figure 19 Input Suppliers: MSME Pig Producer Client Capacity Building Activities During the Last One Year
52
20
0
0
0
0
125
50
138
25
40
138
55
70
120
105
0 20 40 60 80 100 120 140
No. of Trainees
Group Meetings with MSME Staff
Feed making technique
Vaccinations/Medicine
Pig Breeding Techniques
Pig raising technique
Pig Waste Management/Biogas
Pig Farm Management
Pig Disease Diagnosis
Pig stye/Pigpen improvement
Basic business Accounting
Training: business other than Accounting
Training: business advocacy
Introduction to Finance Institutions
Introduction toTraders
Cross provincial Exposure trip
International Exposure Trip
Input Suppliers: Trainings with MSME Producers During the Last One Year n=938
By working with the MSME project, Input Suppliers have developed their own skills and capacities to also offer training services to non-project Pig Producers, benefiting both their own businesses and Pig Producers in general. This is an indirect impact of the MSME and here we quantify the amount of training that MSME Input Suppliers are providing to non-project producers. The 7 Input Suppliers engaged in training provided 365 formal training sessions independent of the MSME project to non-project Pig Producers over the last year. This is an average of 52 training sessions/enterprise. Most training sessions have been on pig feed making techniques and vaccinations. These external benefits can further be multiplied by the number of years the Input Supplier has been engaged with the project, although we lack sufficient information to make a likely estimate of the numbers of external trainees. These are interesting results in terms of indirect impacts of the MSME project on the pig value chain in general.

USAID-Funded Cambodia MSME Strengthening Project Final Monitoring And Evaluation Survey 2008 50
Figure 20 Input Suppliers: Non- Project Pig Producer Capacity Building Activities During the Last One Year
0
0
0
0
0
0
30
40
30
0
0
0
25
100
140
0
0 20 40 60 80 100 120 140
No. of Trainees
Group Meetings with MSME Staff
Feed making technique
Vaccinations/Medicine
Pig Breeding Techniques
Pig raising technique
Pig Waste Management/Biogas
Pig Farm Management
Pig Disease Diagnosis
Pig stye/Pigpen improvement
Basic business Accounting
Training: business other than Accounting
Training: business advocacy
Introduction to Finance Institutions
Introduction toTraders
Cross provincial Exposure trip
International Exposure Trip
Input Suppliers: Number of Training Sessions with Non-MSME ProducersDuring the Last One Year n N=365
Input Suppliers have conducted 72% of training with MSME project producers and 28% with non-project Pig Producers. This indicates that cooperation with the MSME project and its client producers has had a role in generating training services for non-project pig businesses. This is an interesting result in terms of indirect impacts of the MSME on the pig value chain in general. A comparison of the different training courses and their frequency for MSME project producers and non-project producers is of interest. Trainings for non-project Pig Producers are narrower in range and are heavily concentrated on trainings directly related to the products and services they sell. Trainings with MSME Pig Producers are broader in the range of types and are likely to result in more well-rounded capacity building of project producer enterprises, equipping them with a broader and likely more in-depth range of skills to enhance their businesses. While these results are interesting it should be noted that, as for Veterinarians, this first enumeration of the number of pig producer participants trained by Input Suppliers seems likely to have under-estimated the actual numbers of trainees. This can be seen by comparing the above results with earlier results, where MSME Pig Producers are directly asked the number of participants from their enterprises that had received training since joining the project. There are three possible reasons for this difference. One possible reason is that the number of Input Supplier enterprises engaged in training may have been under-enumerated. This may be due to uncertainty as to what represents formal (enumerated) versus informal (not enumerated) training activities. The fact that only 47% of project Input Suppliers enterprises report under-taking any formal training at all seems likely to be low.

USAID-Funded Cambodia MSME Strengthening Project Final Monitoring And Evaluation Survey 2008 51
A second reason is that pig producers may have included some informal on the job training sessions along with formal training sessions arranged and implemented by Input Suppliers for the project, increasing the producer-reported number of trainees A third reason is that Input Suppliers may have under-enumerated the number of trainees, in some cases reporting the number of group training sessions rather than the number of individuals trained.
3.10. Impacts on New Capital Investments & Credit, Gross Sales Volumes & Revenue, Costs of Production & Gross Profits,
Impacts of the MSME project directly on Input Suppliers are not measured in the PMA Indicators for project performance. Nevertheless, here we examine the major characteristics of Input Suppliers businesses and examine indirect project impacts on these enterprises through a comparison of pre-project and during project indicators. Three of the Input Suppliers working with MSME project were much larger scale businesses than the remainder, one located in Prey Veng with Gross Sales Revenue of over $1.5 million and two enterprises located in Kampong Cham with Gross Sales Revenues over $400,000 in 2008. The results from these large enterprises are included in the mean results calculations for all Input Suppliers, as they too are partners and beneficiaries of the MSME. Naturally, they have a large effect on overall results. These effects can be observed in the Tables in this section and in the Annex which include indicator maximum values and differences between mean and median values. New investments in Input Supplier enterprises since joining the project are calculated as the sum of Fixed Capital Investments and Costs of Business May 2007 - April 2008. Costs of Business accounted for about 95% of total new investments by this calculation. Table 27 Input Suppliers: Mean Enterprise New Investments Since Joining the MSME Project (USD).
N=15 Mean Fixed Capital investments $4,232
Cost of Business Operations 2008 $101,531
Total $105,763 Most common Fixed Capital Investments were in storage facilities and storage equipment, shops/offices, and general business equipment. Investments were generally made in small amounts less than $200/Item. The mean value of these investments in this sample was increased greatly by an investment of $40,000 in storage facilities by one enterprise. Investments in Costs of Business in the last year to April 2008 were a mean of $105,763, a very large investment compared to other pig value chain actors. Costs for the three large scale Input Suppliers mentioned above increase the mean value for all enterprises, but their pattern of expenditure by item is similar to the smaller scale input providers. The largest costs of business were purchasing pig production inputs particularly feed supplements, but also vaccines and medicines. The mean values are increased greatly by an investment of $400,000 in pig feed supplements by one of the largest enterprises.

USAID-Funded Cambodia MSME Strengthening Project Final Monitoring And Evaluation Survey 2008 52
Table 28 Input Suppliers: Costs of Business May 2007 to April 2008 (USD).
N=15 Mean Median Std. D Max Sum Office/Shop Outlet rent & maintenance $7 $0 $26 $100 $100
Vaccine $2,851 $700 $5,435 $21,200 $42,770 Medicine $8,773 $2,800 $21,499 $85,000 $131,600
Consumable supplies $718 $150 $1,315 $5,000 $10,768 Feed Supplements $86,537 $29,000 $131,432 $400,000 $1,298,050
Machinery Fuel & Oil $1,036 $0 $3,864 $15,000 $15,535 Machinery Repair/Maintenance $10 $0 $39 $150 $153
Electricity supply $252 $90 $303 $900 $3,773 Hired Labor Part-time $431 $0 $945 $3,600 $6,465
Hired Labor Fulltime $230 $0 $430 $1,500 $3,445 Hired Transport Costs $687 $0 $2,281 $8,900 $10,300
Trader license fees $0 $0 $0 $0 $0 Slaughterhouse fees $0 $0 $0 $0 $0
Inspection Fees $0 $0 $0 $0 $0 Other $0 $0 $0 $0 $0 Total $101,531 $38,525 $1,522,958
Compared to pre-project, Input Suppliers costs of business have increased 144% from $70,497, mainly due to an increase in the costs and volumes of pig production inputs purchased. Fixed Capital Investments were financed by enterprise capital in 93% of cases, only 7%, or one enterprise, borrowed capital from any lender. This loan was from other Input Supplier wholesalers for a value of $50,000. While few Input Suppliers had borrowed funds, they acted often as credit providers. Fully 93% of input providers had sold goods and services on credit. While 86% of Input Suppliers had sold goods and services on credit to Pig Producers, 43% also reported extending this type of credit to other Input Suppliers and 14% to other pig service providers. The mean total credit for input providers/enterprise to producers was $1,586, to other Input Suppliers $974 and to service providers $217. Cash loans to clients were made by only 7%, or one, Input Supplier. Having reported patterns of investment and expenditure, we now turn to examining Input Suppliers enterprise volumes of sales and gross sales revenues. Here we provide the most recent results from the year to April 2008 and assess DAI MSME likely impacts by comparison with results from the last year before each enterprise joined the project as reported in this survey. The measure of Input Supplier’s enterprise volumes of sales was the number of customers per enterprise by type of sale. During the project in the year to April 2008, Input Suppliers had an average of 1,863 customers/enterprise. Over half of these customers were for feed supplement sales and smaller proportions for vaccine and medicine sales. Table 29 Input Suppliers: Volume of Sales/Number Of Customers May 2007-April 2008.
Number of customers N=15 Mean Median Std. D Max Sum
Medicine Sales 334 195 517 2,100 5,015 Vaccine Sales 509 180 1,252 5,000 7,640
Feed Supplement Sales 1,020 300 1,602 5,400 15,295 Other Specify 0 0 0 0 0
Overall 1,863 865 27,950
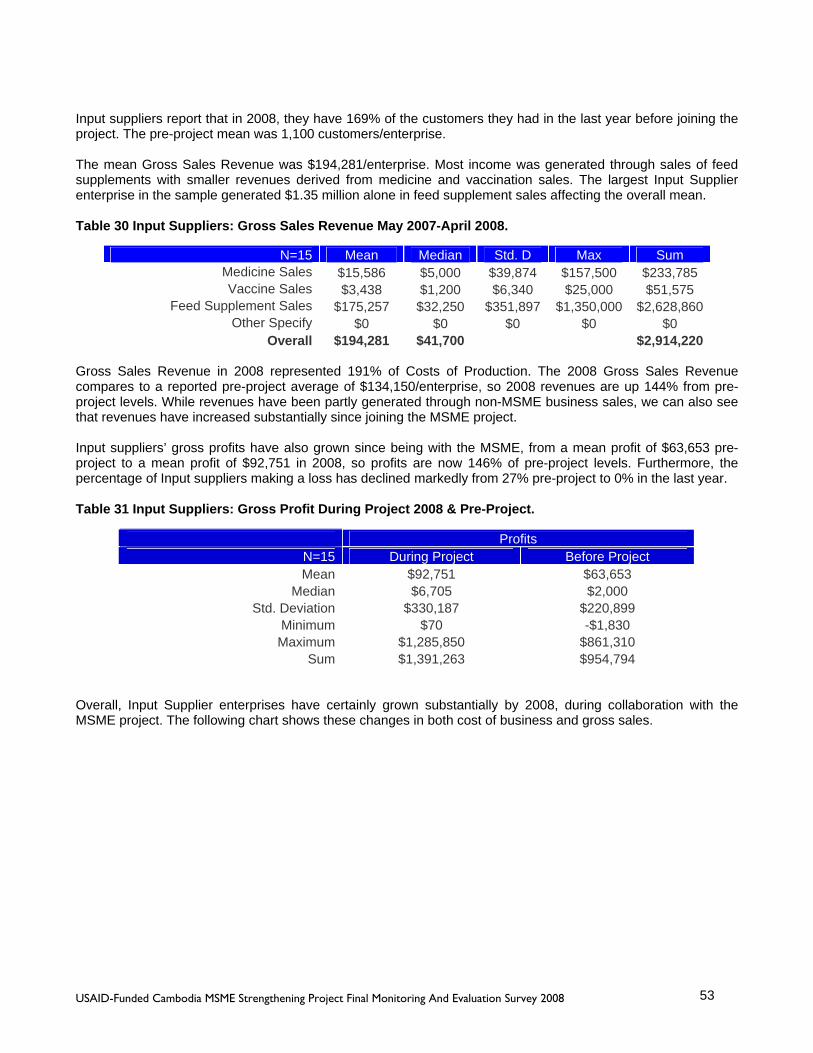
USAID-Funded Cambodia MSME Strengthening Project Final Monitoring And Evaluation Survey 2008 53
Input suppliers report that in 2008, they have 169% of the customers they had in the last year before joining the project. The pre-project mean was 1,100 customers/enterprise. The mean Gross Sales Revenue was $194,281/enterprise. Most income was generated through sales of feed supplements with smaller revenues derived from medicine and vaccination sales. The largest Input Supplier enterprise in the sample generated $1.35 million alone in feed supplement sales affecting the overall mean. Table 30 Input Suppliers: Gross Sales Revenue May 2007-April 2008.
N=15 Mean Median Std. D Max Sum Medicine Sales $15,586 $5,000 $39,874 $157,500 $233,785 Vaccine Sales $3,438 $1,200 $6,340 $25,000 $51,575
Feed Supplement Sales $175,257 $32,250 $351,897 $1,350,000 $2,628,860Other Specify $0 $0 $0 $0 $0
Overall $194,281 $41,700 $2,914,220 Gross Sales Revenue in 2008 represented 191% of Costs of Production. The 2008 Gross Sales Revenue compares to a reported pre-project average of $134,150/enterprise, so 2008 revenues are up 144% from pre-project levels. While revenues have been partly generated through non-MSME business sales, we can also see that revenues have increased substantially since joining the MSME project. Input suppliers’ gross profits have also grown since being with the MSME, from a mean profit of $63,653 pre-project to a mean profit of $92,751 in 2008, so profits are now 146% of pre-project levels. Furthermore, the percentage of Input suppliers making a loss has declined markedly from 27% pre-project to 0% in the last year. Table 31 Input Suppliers: Gross Profit During Project 2008 & Pre-Project.
Profits N=15 During Project Before Project Mean $92,751 $63,653
Median $6,705 $2,000 Std. Deviation $330,187 $220,899
Minimum $70 -$1,830 Maximum $1,285,850 $861,310
Sum $1,391,263 $954,794 Overall, Input Supplier enterprises have certainly grown substantially by 2008, during collaboration with the MSME project. The following chart shows these changes in both cost of business and gross sales.
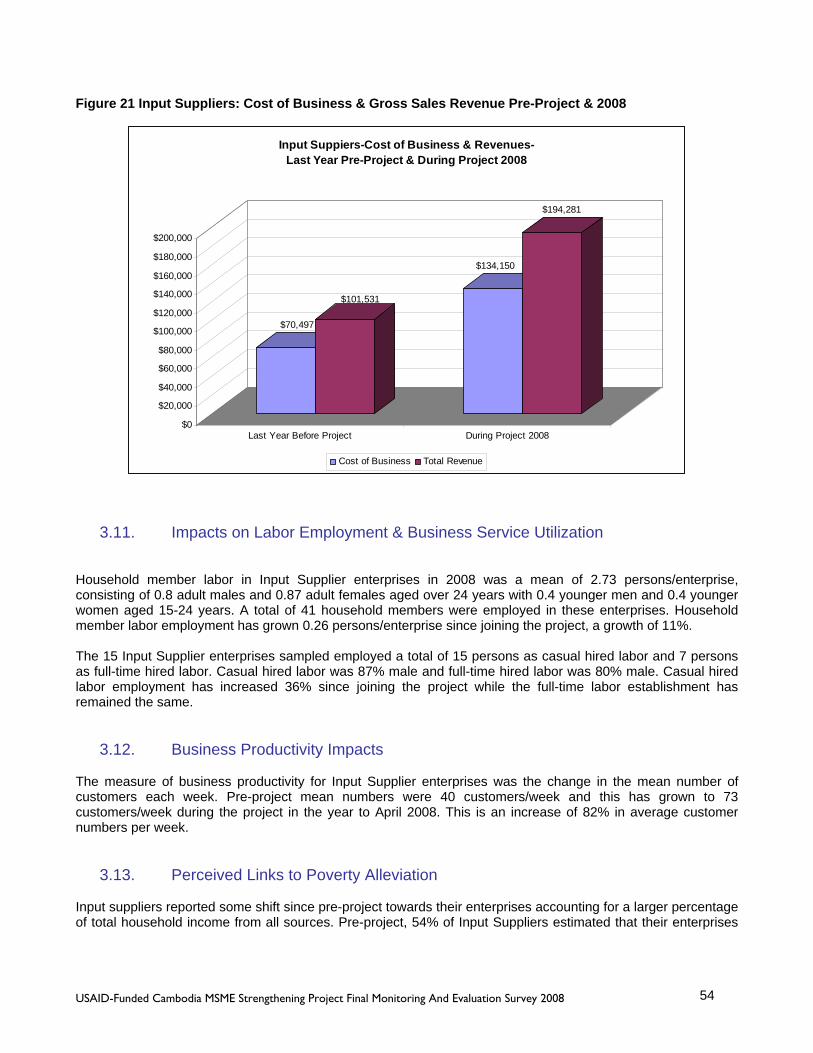
USAID-Funded Cambodia MSME Strengthening Project Final Monitoring And Evaluation Survey 2008 54
Figure 21 Input Suppliers: Cost of Business & Gross Sales Revenue Pre-Project & 2008
$70,497
$101,531
$134,150
$194,281
$0
$20,000
$40,000
$60,000
$80,000
$100,000
$120,000
$140,000
$160,000
$180,000
$200,000
Last Year Before Project During Project 2008
Input Suppiers-Cost of Business & Revenues- Last Year Pre-Project & During Project 2008
Cost of Business Total Revenue
3.11. Impacts on Labor Employment & Business Service Utilization Household member labor in Input Supplier enterprises in 2008 was a mean of 2.73 persons/enterprise, consisting of 0.8 adult males and 0.87 adult females aged over 24 years with 0.4 younger men and 0.4 younger women aged 15-24 years. A total of 41 household members were employed in these enterprises. Household member labor employment has grown 0.26 persons/enterprise since joining the project, a growth of 11%. The 15 Input Supplier enterprises sampled employed a total of 15 persons as casual hired labor and 7 persons as full-time hired labor. Casual hired labor was 87% male and full-time hired labor was 80% male. Casual hired labor employment has increased 36% since joining the project while the full-time labor establishment has remained the same.
3.12. Business Productivity Impacts The measure of business productivity for Input Supplier enterprises was the change in the mean number of customers each week. Pre-project mean numbers were 40 customers/week and this has grown to 73 customers/week during the project in the year to April 2008. This is an increase of 82% in average customer numbers per week.
3.13. Perceived Links to Poverty Alleviation Input suppliers reported some shift since pre-project towards their enterprises accounting for a larger percentage of total household income from all sources. Pre-project, 54% of Input Suppliers estimated that their enterprises

USAID-Funded Cambodia MSME Strengthening Project Final Monitoring And Evaluation Survey 2008 55
accounted for 50% or more of their total income. In 2008, the percentage increased to 67% estimating that their enterprises accounted for 50% or more of their total income. Input suppliers recognized that the kind of support for pig businesses provided by the DAI MSME project was important to help reduce poverty among other rural families in Cambodia. Among these respondents, 60% felt that MSME-type project support would be “Quite Important” and 40% felt that it would be “Very Important” for rural poverty alleviation. The third indicator asked Input Suppliers if benefits from joining the DAI MSME project helped fund more years of education for their children than originally planned before joining the project. Fully 93% of Input Suppliers affirmed this benefit, with education supported for an average of 1.1 girls and 0.9 boys per enterprise, for a total of 15 girls and 12 boys, in all 15 enterprises.
3.14. Impacts On Business Accounting & Business Policy Advocacy Among Input Suppliers, only 13% kept permanent accounting records for their business as a result of working with the MSME Project. Given the relatively large scale of some Input Supplier businesses, wider adoption of more systematic and permanent accounts recording would be an important step forward for further business development in the future. 4. PIG VALUE CHAIN - MSME TECHNOLOGY/BENEFITS SPREAD TO NON-
PROJECT PIG PRODUCERS An additional component of this Final Evaluation was to report the extent to which DAI-MSME technologies and benefits had spread to non-project Pig Producers. As this was the first time such a “spread survey” was undertaken, it was decided with the MSME team that we survey non-project Pig Producers in three villages where MSME Pig Producers were present. One village was randomly selected in Kampong Cham, Kratie and Svay Rieng provinces. In each village, 50 Pig Producers who had not worked with the MSME project for at least one full production cycle were randomly selected using non-project status screening and random household interval skip sampling. To enable such random selection, these villages had to be of at least medium size of 200 households or more to have a household population sufficient for this sampling method. This pig value chain spread survey measured MSME technology and benefits spread at the local level, to non-project Pig Producers within the same villages as existing MSME clients. Of particular interest was the extent of the spread of MSME capacity building activities to non-project Pig Producers. Also, basic measures of pig production enterprise characteristics and volumes of production were recorded for comparison with MSME client Pig Producers. When interpreting comparative results between these non-project Pig Producers and MSME producers, it should be recalled that the non-project producer results are from a small sample of four villages.
4.1. Demographic Profile Non-project Pig Producers had similar mean ages (37 years), household composition (2.0 female and 1.5 males aged over 15 years and 1.6 children aged under 15 years.) and years of experience raising pigs (7.2 years) as DAI MSME project clients. The mean level of education was less on average with 47% having at least some secondary education compared to 66% of MSME Pig Producer clients. Another notable difference was in terms of gender

USAID-Funded Cambodia MSME Strengthening Project Final Monitoring And Evaluation Survey 2008 56
composition, with female Non-project Pig Producers accounting for 67% of all enterprises compared to females representing 22% of MSME Pig Producer clients. There was little variation in the proportion of female Pig Producers across the three villages surveyed. This may well reflect a greater pre-dominance of women among smaller-scale and less educated Pig Producers in the villages, who would be less likely to be MSME clients.
4.2. Improved Pig Technology Awareness & Training Among Non-Project Producers Among this sample of Non-project Pig Producers, 100% confirmed that their primary position in the pig value chain was as a producer. A central area of interest for this spread survey was to gain insight into the extent of training and related capacity building activities in pig production and business practices that was being undertaken by Non-project Pig Producers, and to what extent this capacity building might have spread from MSME pig production clients. The 151 sampled enterprises reported that they were aware of improved pig production technologies/capacity building activities in total of 601 cases for all 16 types of technologies specified to them, or about 4 technologies per enterprise. The breakdown in types of technologies they reported being aware of is shown in the following table. These producers were most commonly aware of some specific improved pig production technologies. Over 60% were aware of improved techniques in Vaccinations/Medicine, Pig raising technique and Pig Disease Diagnosis. However they were not so commonly aware of other important pig production techniques with only 42% aware of Pig sty/Pigpen improvements, and less than 30% aware of improved Feed Making techniques, Pig Breeding Techniques and improved Pig Farm Management. Awareness or recognition of the importance of improvements in non-technical business skills and exposure was far less widespread, with a maximum of 14% aware of improved business accounting practices. Concerning adoption rates of these improved technologies, among those aware of the each technology, the most common pattern was to “partially adopt” these technologies. Overall 19% of respondents did not adopt, 65% “partially adopted” and 16% “fully adopted” the improved technologies that they were aware of with some variations by type of technology. We are not able to determine the specifics of actual components of technologies adopted, the extent to which they were adopted, or whether they were adopted correctly. However, these results do indicate that non-project producers tend mostly to at least partially adopt improved technologies that they become aware of to improve their enterprises. The MSME project has been a local level actor in increasing awareness of new technologies in the local community.

USAID-Funded Cambodia MSME Strengthening Project Final Monitoring And Evaluation Survey 2008 57
Table 32 Non-Project Pig Producer Benefits Spread Survey: Knowledge & Adoption Rates of Improved Pig Enterprise Technologies
AwarenessAdoption Rates Among Those Aware
Non-Project Pig Producers Total Rates Fully Partly Not Adopted Adopted Adopted
Types of Training N % % % % Group Meetings with MSME Staff 11 7% 0% 36% 64%
Feed making technique 44 29% 16% 57% 27% Vaccinations/Medicine 128 85% 23% 69% 9%
Pig Breeding Techniques 32 21% 19% 31% 50% Pig raising technique 116 77% 16% 74% 10%
Pig Waste Management/Biogas 23 15% 0% 35% 65% Pig Farm Management 41 27% 22% 68% 10% Pig Disease Diagnosis 93 62% 17% 77% 5%
Pig sty/Pigpen improvement 64 42% 9% 75% 16% Basic business Accounting 21 14% 10% 43% 48%
Other Business Training 3 2% 0% 0% 100% Training: business advocacy 5 3% 0% 20% 80%
Introduction to Finance Institutions 12 8% 0% 42% 58% Introduction to Traders 7 5% 29% 57% 14%
Cross provincial Exposure trip 1 1% 0% 100% 0% International Exposure Trip 0 0% 0 0 0
Totals 601 25% 16% 65% 19% We then proceeded to ask these Pig Producers how they became aware of the new technologies they had learned and often had chosen to adopt. Three different methods of learning were specified: self-training through observation and copying (copy cat), training from MSME producers or training from Input Suppliers or other Pig Experts. Overall, results were that these Pig Producers learned about new technologies by all three methods to some extent, with 42% learning through copy-cat methods, 18% from training by MSME client Pig Producers and 42% from Input suppliers or other pig experts. It is interesting to find that MSME client Pig Producers are making a meaningful and direct contribution to the training of non-project Pig Producers. This is not a specified role for client producers with the MSME project and yet the project is making a wider impact on skill-building among all Pig Producers through the efforts of their Pig Producer clients. There are also likely gains in training quality when training is undertaken by MSME producers who have themselves been formally trained in these technologies rather than using the copy-cat method. MSME producers are also likely to be the source, in many cases, for the common copy-cat learning by a large proportion of non-project producers in these villages. Finally, it is likely that trainings with non-project Pig Producers by Input Suppliers and other pig experts such as Veterinarians have been facilitated by the need for initial local visits to train MSME producers. There are some interesting variations in most common methods of learning by each type of technology. If we examine the most common types of technologies learned we can see that technologies related to pig health are most commonly learned from Input Suppliers/pig experts. In other cases where technologies relate more to pig production management (Pig raising technique, Pig Farm Management and Pig sty/Pigpen improvement) these are most commonly learned through the copy-cat method. In the case of pig Feed Making techniques, MSME producers are the ones most commonly providing training to non-project producers.

USAID-Funded Cambodia MSME Strengthening Project Final Monitoring And Evaluation Survey 2008 58
Table 33 Non-Project Pig Producer Benefits Spread Survey: How They Learned About Improved Pig Enterprise Technologies
Non-Project Pig Producers Total
Self-trained observation and copy
only
Training from
MSME project
producer
Training from Input
Suppliers/ Pig
Expert Types of Training N % % %
Feed making technique 44 27 43 30 Vaccinations/Medicine 128 11 5 84
Pig Breeding Techniques 32 47 25 28 Pig raising technique 116 56 22 22
Pig Waste Management/Biogas 23 39 26 35 Pig Farm Management 41 63 20 17 Pig Disease Diagnosis 93 37 8 56
Pig sty/Pigpen improvement 64 70 17 13 Basic business Accounting 21 62 33 5
Other Business Training 3 100 0 0 Training: business advocacy 5 20 60 20
Introduction to Finance Institutions 12 67 33 0 Introduction to Traders 7 57 14 29
Cross provincial Exposure trip 1 100 0 0 International Exposure Trip 0 0 0 0
Totals 590 42% 18% 40%
4.3. Comparative Pig Production Enterprise Characteristics: Non-Project Pig Producers Versus MSME Pig Producers
In the summary table below, some main indicators of characteristics of Non-Project pig enterprises are presented along with results for the same indicators for MSME Pig Enterprises for the last year to April 2008. This serves to provide a number of comparisons of interest and to provide another measure of project impact relative to this sample of non-project producers. These comparisons illustrate that MSME pig producers are on average larger scale enterprises than the Non-Project Pig enterprises. Indicators for stock, costs of production, volume and value of sales, all show that MSME enterprises are about three times the size of the non-producer enterprises on average. They also employ 30% more household labor on average. In terms of productivity indicators, Non-Project producers suffer much higher rates of piglet mortality on average, with one in four piglets dying, compared to only one in ten piglet deaths among MSME producers. Non-Project producers also sell feeder pigs at 9% lower mean live-weight and take 14% more mean days to grow pigs to 80-90 kg, in comparison to MSME producers.
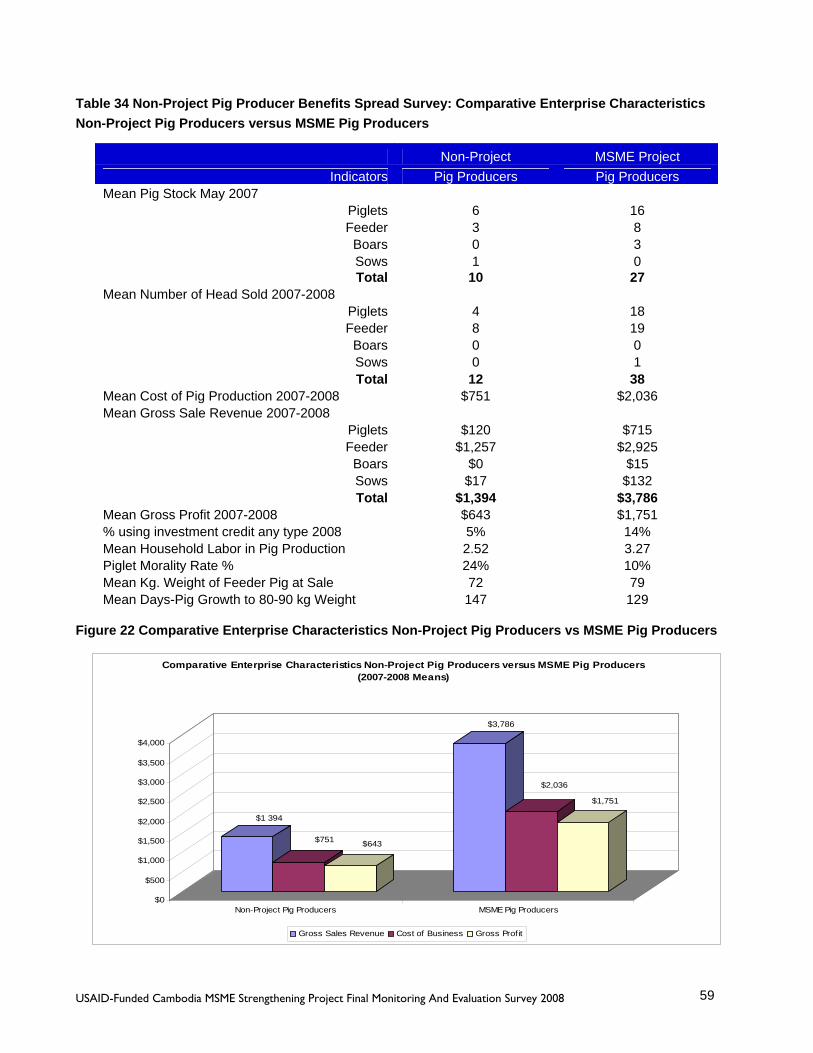
USAID-Funded Cambodia MSME Strengthening Project Final Monitoring And Evaluation Survey 2008 59
Table 34 Non-Project Pig Producer Benefits Spread Survey: Comparative Enterprise Characteristics Non-Project Pig Producers versus MSME Pig Producers
Non-Project MSME Project Indicators Pig Producers Pig Producers
Mean Pig Stock May 2007 Piglets 6 16 Feeder 3 8
Boars 0 3 Sows 1 0 Total 10 27
Mean Number of Head Sold 2007-2008 Piglets 4 18 Feeder 8 19
Boars 0 0 Sows 0 1 Total 12 38
Mean Cost of Pig Production 2007-2008 $751 $2,036 Mean Gross Sale Revenue 2007-2008
Piglets $120 $715 Feeder $1,257 $2,925
Boars $0 $15 Sows $17 $132 Total $1,394 $3,786
Mean Gross Profit 2007-2008 $643 $1,751 % using investment credit any type 2008 5% 14% Mean Household Labor in Pig Production 2.52 3.27 Piglet Morality Rate % 24% 10% Mean Kg. Weight of Feeder Pig at Sale 72 79 Mean Days-Pig Growth to 80-90 kg Weight 147 129
Figure 22 Comparative Enterprise Characteristics Non-Project Pig Producers vs MSME Pig Producers
$1 394
$751 $643
$3,786
$2,036
$1,751
$0
$500
$1,000
$1,500
$2,000
$2,500
$3,000
$3,500
$4,000
Non-Project Pig Producers MSME Pig Producers
Comparative Enterprise Characteristics Non-Project Pig Producers versus MSME Pig Producers (2007-2008 Means)
Gross Sales Revenue Cost of Business Gross Profit

USAID-Funded Cambodia MSME Strengthening Project Final Monitoring And Evaluation Survey 2008 60
5. FISH VALUE CHAIN - FISH PRODUCERS Of a total of 1,655 enterprises of all types working with the DAI MSME project in 2008, 15% or 264 businesses are enterprises in the fish value chain. Within the fish value chain, the project is so far working only with Fish Producers. Evaluating project impacts on Fish Producers presents a number of challenges. The large number of fish and fingerlings involved make recall more difficult as does the practice of enumerating some fish types and species by kilogram and others by number of head. Further, fish production varies among the provinces assisted by DAI in that Fish Producers in Kampong Cham are generally larger scale and more commercially oriented, and Fish Producers in Prey Veng and Svay Rieng are often smaller scale and oriented to producing both fish for sale and fish for family consumption. The Fish Producers in Prey Veng and Svay Rieng are in transition to commercial production, a process that takes at least two production cycles (years) to get established and to begin seeing large increases in production levels and fish quality. Project target criteria do not discriminate between these larger and smaller scale producers. Instead the fish project indicators use overall numerical targets for project performance. Further, baseline and midpoint evaluations lacked a strong basis for determining characteristics of MSME fish enterprises. The mid-point evaluation had a sample of only 30 Fish Producers some of who had not yet completed a full production cycle. This sample also included a few very large scale Fish Producers in Kampong Cham province which had affected mean enterprise results. By comparison the final evaluation sample is composed of 56 Fish Producers all of whom have completed a full production cycle and 57% are located in Prey Veng province. This sample too includes a few very large scale producers which affected mean enterprise results.
5.1. Demographic Profile This survey interviewed a proportionately and randomly selected sample of 56 DAI MSME Fish Producers (21% of the total), engaged with the project for at least one production cycle and within the four of six provinces in which DAI has operated. The two provinces sampled (Kampong Cham and Prey Veng) account for 66% of the total of project Fish Producers and the majority are producers that have completed at least one production cycle with the project. The geographical distribution of DAI MSME Fish Producers by province is uneven, with 33% located in Kampong Cham province, 14% in Kratie, 36% in Prey Veng and 17% in Svay Rieng. The final evaluation sample is drawn from the two largest MSME client Fish Producer provinces, with 57% of sample from Prey Veng and 43% from Kampong Cham. DAI MSME Fish Producers are 34% female and 66% male. A higher proportion of female producers are found in Prey Veng (41%) than in Kampong Cham (25%). DAI MSME Fish Producers are typically aged around 42 years and have an average of 5.2 years experience raising fish before joining the project. Their households are composed of an average of 1.9 females and 1.7 males aged over 15 years and 1.2 boys and 1.2 girls aged under 15 years. They are more educated than average in a rural Cambodian context. Overall 54% have at least some level of secondary level education, with only limited variations by province and most others have a primary level education.

USAID-Funded Cambodia MSME Strengthening Project Final Monitoring And Evaluation Survey 2008 61
5.2. Project Collaboration & Training Benefits
Most Fish Producers had been engaged with the DAI MSME project for a period of at least 12-24 months and up to 36 months, and 100% confirmed that their primary position in the fish value chain was as a Fish Producer. Table 35 Fish Producers: Months since joining the MSME project
Months Count % <12 months 10 18%
12 - 24 months 26 46% > 24 months 20 36%
Total 56 100% A core activity in support of Fish Producers for the DAI MSME has been to organize technical training and related capacity building activities in fish production and business practices. The 56 sampled enterprises reported attending a total of a 606 person/training activities since joining the project, an average of 10.8 training attendances per enterprise. The breakdown of types of courses attended and by province is shown in the following table. Participation rates are particularly high for fish production technical courses, usually in the range of about 60-90% of enterprises. For core technical training in areas, including Fish Raising Technique, Pond Construction and Pond Preparation, participation rates are over 80%. For business skills development courses, participation rates are lower, in the range of 10-50%. Business Accounting training has been provided to 43% of enterprises and Business Advocacy training has been provided to 32% of enterprises. Figure 23 Fish Producers: MSME Project Facilitated Trainings
115
299
187
2430
4038
3949
4540
5435
4036
47
0 10 20 30 40 50 60
No. of Fish Enterprise Trainees
Group Meetings with MSME StaffFish Feed making technique
Fish Heal h ManagementFish Medicine used
Fish raising techniquePond Selection
Pond ConstructionPond PreparationStocking Density
Pond Water QualityFish Feeding TechniquesFish Harvest Techniques
Basic business AccountingBusiness other han Accounting
Business advocacy Intro. to Finance Institutions
Introduc ion toTradersCross provincial Exposure trip
International Exposure Trip
Fish Producers: MSME Project Facilitated Trainings n=606
There are quite large variations by province in terms of the percentage of clients participating in different types of training [See Appendix Table A151]. This may reflect different locations and enterprise priorities. DAI MSME training and related capacity building activities appear to have a somewhat lower participation rate for women

USAID-Funded Cambodia MSME Strengthening Project Final Monitoring And Evaluation Survey 2008 62
(average 27%) in relation to the 34% proportion of women-owned enterprises already participating with the project. This applies to most of the fish technical training courses and also some business training courses. Project staff need to continue to monitor the rate of participation in capacity building activities for women to ensure they participate equitably in training opportunities once they have joined the project. It is possible that some males who attend the trainings are from women-owned enterprises, in which case those enterprises still gain the training benefits.
5.3. Impact on New Capital Investments & Credit, Gross Sales Volume & Revenue, Cost of Production & Gross Profit
OBJECTIVE: Component 2: Enhanced Capacity of Value Chain Firms &/or Stand-Alone Providers to Support Competitive Value Chains
Indicator Value Chain Unit Target
FY2008 Actual FY2008
% of FY Target
2.3. Percent increase in value of new investments by MSME Fish
Mean $/MSME
$6,886 $4,830 70%
The value of “new investments” is defined as the sum of three investment components: fixed capital investments during the project, the value of fish stock at the start of the production cycle in May 2007 and the value of total costs of fish production, May 2007 - April 2008. The 2008 target for average new investments per enterprise was $6,886. The result was an average of new investments of $4,830 or 70% of target. The tables below show the composition of new investments by component as well as the total. Table 36 Fish Producers: Mean Value of New Investments since joining the MSME project (USD)
N=56 Mean Fixed Capital investments $1,269
Fish Stock $1,990 Total cost of Fish Production $1,571
Total $4,830
Fixed Capital investments were generally not very common in the year to April 2008 with most investments by type made by less than 20% of enterprises, with mean investments less than $60 per item. Investment in pond excavation was more common, with 37% of enterprises making this investment which accounts for $434 of the total mean investment for all enterprises. Land was purchased by 14% of enterprises and the value of this investment accounts for a further $592 of the total $1,269 mean investment. Various “other” fixed capital investments were made by 56% of enterprises with item costs averaging $96. The following table shows the composition and average enterprise investment in fish costs of production for the period May 2007-April 2008. The average total enterprise investment in fish raising costs of production was $1,571. By far the largest investment, 69% of the total, was made for fish feeds, mostly rice bran, but also including pellet fish feed, and trash fish/fishmeal. Fingerlings were the next largest expense on average.
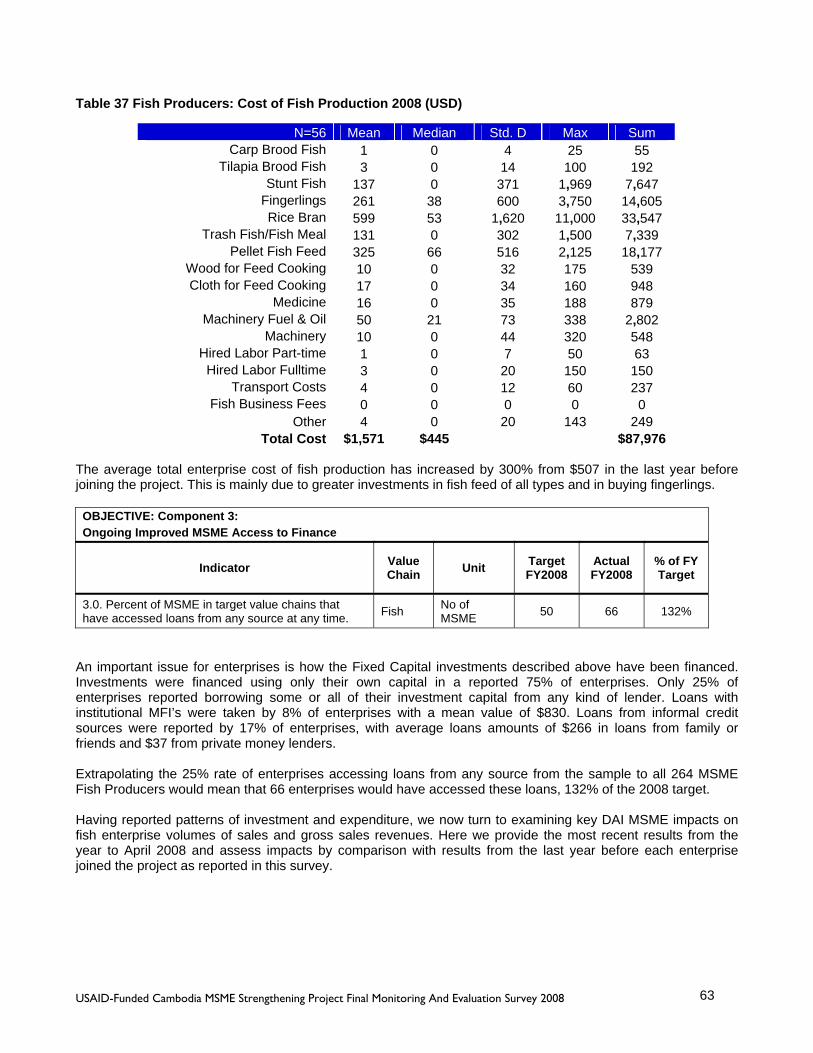
USAID-Funded Cambodia MSME Strengthening Project Final Monitoring And Evaluation Survey 2008 63
Table 37 Fish Producers: Cost of Fish Production 2008 (USD)
N=56 Mean Median Std. D Max Sum Carp Brood Fish 1 0 4 25 55
Tilapia Brood Fish 3 0 14 100 192 Stunt Fish 137 0 371 1,969 7,647
Fingerlings 261 38 600 3,750 14,605 Rice Bran 599 53 1,620 11,000 33,547
Trash Fish/Fish Meal 131 0 302 1,500 7,339 Pellet Fish Feed 325 66 516 2,125 18,177
Wood for Feed Cooking 10 0 32 175 539 Cloth for Feed Cooking 17 0 34 160 948
Medicine 16 0 35 188 879 Machinery Fuel & Oil 50 21 73 338 2,802
Machinery 10 0 44 320 548 Hired Labor Part-time 1 0 7 50 63
Hired Labor Fulltime 3 0 20 150 150 Transport Costs 4 0 12 60 237
Fish Business Fees 0 0 0 0 0 Other 4 0 20 143 249
Total Cost $1,571 $445 $87,976 The average total enterprise cost of fish production has increased by 300% from $507 in the last year before joining the project. This is mainly due to greater investments in fish feed of all types and in buying fingerlings.
OBJECTIVE: Component 3: Ongoing Improved MSME Access to Finance
Indicator Value Chain Unit Target
FY2008 Actual FY2008
% of FY Target
3.0. Percent of MSME in target value chains that have accessed loans from any source at any time. Fish No of
MSME 50 66 132%
An important issue for enterprises is how the Fixed Capital investments described above have been financed. Investments were financed using only their own capital in a reported 75% of enterprises. Only 25% of enterprises reported borrowing some or all of their investment capital from any kind of lender. Loans with institutional MFI’s were taken by 8% of enterprises with a mean value of $830. Loans from informal credit sources were reported by 17% of enterprises, with average loans amounts of $266 in loans from family or friends and $37 from private money lenders. Extrapolating the 25% rate of enterprises accessing loans from any source from the sample to all 264 MSME Fish Producers would mean that 66 enterprises would have accessed these loans, 132% of the 2008 target. Having reported patterns of investment and expenditure, we now turn to examining key DAI MSME impacts on fish enterprise volumes of sales and gross sales revenues. Here we provide the most recent results from the year to April 2008 and assess impacts by comparison with results from the last year before each enterprise joined the project as reported in this survey.

USAID-Funded Cambodia MSME Strengthening Project Final Monitoring And Evaluation Survey 2008 64
OBJECTIVE: Component 1: Improved Performance of USAID-Assisted Enterprises in Targeted Value Chains
Indicator Value Chain Unit Target
FY2008 Actual FY2008
% of FY Target
1.1 (a) Percent change in volume of sales of program-assisted enterprises Fish Mean
Kg./MSME 2,890 1,863 64%
1.1 (b) Change in value of sales of program-assisted enterprises Fish Mean
$/MSME $2,154 $3,637 169%
Firstly, we examine MSME project impacts on enterprise volumes of fish sales. The mean kilograms of mature fish sold in the year to April 2008 was 1,863 kg./enterprise. This is 64% of the 2008 MSME target of 2,890 kg./enterprise. Secondly, the mean Gross Sales Revenue in the year to April 2008 was $3,637/enterprise. This is 169% of the 2008 MSME target. The reason for the below target mean volume of sales, as well as the above-target mean value of sales, is the large differences that exist in these values between Fish Producers in Kampong Cham and Prey Veng. Essentially, results for these indicators far exceed targets in the Kampong Cham sub-sample and are far below target in the Prey Veng sub-sample. It is the combination of these two very different results that produce the total sample means shown above. The different results for each of these sub-samples are shown in the following tables. The average composition of sales volumes in enterprises in 2008 and the last year pre-project is shown in the following tables. While 2008 results are below target, a comparison of the current year and pre-project results do show a 153% increase in mature fish kg. sold/enterprise within the total sample. Thus within this total, sample MSME positive impacts are shown in terms of sales volume growth. The total sample mean volume of sales is computed from very different sub-sample results by province. The volume of sales in Kampong Cham enterprises is almost ten times greater than the volume of sales in Prey Veng enterprises. The Kampong Cham results are 132% of target while the Prey Veng results are 13% of target. Table 38 Fish Producers: Mature Fish Sales Volumes Total & By Province 2008
N=56 Mean Median Std. D Max Sum Mature Fish kg.-Total Sample 1,863 560 2,611 9,500 104,348
Mature Fish kg.-KCM Only n=24 3,828 2,350 2,990 9,500 91,860 Mature Fish kg.-PVG Only n=32 390 12,488
Table 39 Fish Producers: Mature Fish Sales Volumes Total & By Province Pre- Project
N=56 Mean Median Std. D Max Sum Mature Fish kg.-Total Sample 1,214 250 2,558 12,000 67,995
Mature Fish kg.-KCM Only n=24 2,554 1,500 3,503 12,000 61,300 Mature Fish kg.-PVG Only n=32 209 6,695

USAID-Funded Cambodia MSME Strengthening Project Final Monitoring And Evaluation Survey 2008 65
Figure 24 Fish Producers: Sales Volumes Pre-Project & During Project 2008
2,554
3,828
209
390
0
500
1,000
1,500
2,000
2,500
3,000
3,500
4,000
KCM Fish Producers PVG Fish Producers
Fish Producers: Sales Volumes Pre-project and During Project 2008 Kampong Cham (KCM) & Prey Veng Provinces (PVG)
(fish mean kg./enterprise)
Pre-Project Sales Volumes (Fish mean kg./enterprise) 2008 During Project Sales Volumes (Fish mean kg./enterprise)
Among all fish enterprises in 2008, 95% sold mature fish, 6% sold fingerlings and 77% consumed additional mature fish for family food (mean 98 kg./consuming household). Much larger quantities of fish were consumed for family food in Prey Veng province. The average composition of Gross Sales Revenue in enterprises is shown in the following table for the total sample and for the two province sub-samples. The mean total sample Gross Sales Revenue/enterprise is $3,851 which is 169% of target. Once again this total sample mean is calculated from very different sub-sample results by province. The value of sales in Kampong Cham enterprises is more than eight times greater than the volume of sales in Prey Veng enterprises. The Kampong Cham results are 359% of target, while the Prey Veng results are 43% of target. Table 40 Fish Producers: Gross Sales Revenue Total & By Province 2008 (USD)
N=56 Mean Median Std. D Max Sum Total Sample:
Mature Fish ( Sale to Market) 3,637 810 12,216 91,000 203,660 Fingerling (Sale to Market)* 116 0 558 3,500 6,500
Total Sales Revenue $3,851 $901 $215,675 Mature Fish (kg. consumed family) 98 39 165 866 5,515
KCM sub-sample only n=24: Mature Fish ( Sale to Market) 7,685 2,520 18,048 91,000 184,439 Fingerling (Sale to Market)* 31 0 153 750 750
Total Sales Revenue $7,742 $2,538 $185,809 Mature Fish (consumed family) 26 15 32 113 620
PVG sub-sample only n=32: Mature Fish ( Sale to Market) 601 291 945 5,000 19,222 Fingerling (Sale to Market)* 180 0 725 3,500 5,750
Total Sales Revenue $933 $438 $29,866 Mature Fish (consumed family) 153 59 4895
* Fingerlings were sold by only 3 large scale producers (6% of sample).

USAID-Funded Cambodia MSME Strengthening Project Final Monitoring And Evaluation Survey 2008 66
A further comparison of the current year and pre-project total sample results do show a 386% increase in Gross Sales Revenue/enterprise. Thus within this sample, very positive impacts are shown on fish producers over time in terms of Gross Sales Revenue/enterprise growth. The impact of the MSME project on fish enterprise gross sales revenue and cost of production are shown in the following chart. Results are split by province and clearly show the differences in enterprise size by province. Excellent rates of growth can be observed for fish enterprises in both provinces despite the differences in scale of the enterprises. Figure 25 Fish Producers: Cost of Business & Revenues Pre-Project & During Project 2008
$1,023
$3,256
$1,870
$7,742
$120 $307 $301
$933
$0
$1,000
$2,000
$3,000
$4,000
$5,000
$6,000
$7,000
$8,000
Cost of Production-KCM Gross Sales Revenue-KCM
Cost of Production- PVG Gross Sales Revenue-PVG
Fish Producers: Cost of Business & Gross Sales Revenues - Pre-Project & During Project 2008. Kampong Cham (KCM) & Prey Veng (PVG)
Pre-Project During Project
The mean Gross Profit/enterprise in 2008 was $2,280 an increase of 489% over Gross Profits during the last year before joining the project. Results are shown in the following table. Within this sample very positive impacts are shown in terms of Gross Profit/enterprise growth. Table 41 Fish Producers: Gross Profit 2008 & Pre-Project (USD)
Profits N=56 During Project 2008 Last Yr Before Project Mean $2,280 $466
Median $377 $142 Std. Deviation $9,688 $1,024
Minimum $-1791 $-416 Maximum $72,254 $5,038
Sum $127,699 $26,116

USAID-Funded Cambodia MSME Strengthening Project Final Monitoring And Evaluation Survey 2008 67
Gross Revenue was 238% of Costs of Production in 2008, up from 191% pre-project. The proportion of enterprises making a loss in 2008 was 7%, well down from the 18% of enterprises making a loss pre-project. Overall, the MSME Fish Producer sample and client base were found to consist of very different enterprises, with much larger scale and more commercially-oriented businesses in Kampong Cham and much smaller scale domestic fish producers just beginning to commercialize their enterprises in Prey Veng. These large differences have affected progress towards targets, so that the volume of sales target has not been reached for the total sample, although the Kampong Cham sub-sample exceeded this target by a large margin. Even with these large differences in sub-samples, the value of sales target has been exceeded for the total sample. In addition, when comparing 2008 with pre-project results within this sample of fish enterprises, MSME impacts are shown to be very positive in terms of volume and value of sales, and gross profit growth.
5.4. Impacts on Labor Employment Results on the employment of Fish Producer household members in 2008, either full time or part time, were an average of 3.43 household members employed per enterprise, representing most of the household labor force aged 15 years and over. Typically, employed labor included both 1.2 males and 1.2 females aged 25 years or older. An average of 0.57 females and 0.46 males aged 15-24 years were also employed. The gender distribution of household labor is quite even. In total, 192 household members were employed in these 56 enterprises. Table 42 Fish Producers: Household Labor Employment during Project 2008 (persons)
N=56 Mean Median Std. D Max Sum Females-Aged 15-24 years 0.57 0.00 0.91 4 32 Females-Aged >=25 years 1.23 1.00 0.50 3 69
Males-Aged 15-24 years 0.46 0.00 0.85 4 26 Males-Aged >=25 years 1.16 1.00 0.73 5 65
Total Labor employment 3.43 3.00 192 Compared to pre-project, household member employment has increased by 0.2 persons/enterprise, or a 6% growth in employment since joining the project. This translates into 11 more members employed among all enterprises. It should also be recalled that these household members will derive extra income or benefits from the increasing profitability of the enterprise itself, as discussed previously. It is found that the employment of hired labor, either full-time or casual, is very rare among these 56 fish production enterprises. In total, only 8 males were hired for full-time labor and no casual labor was hired.
5.5. Business Productivity Impacts A set of questions were included to enumerate MSME impacts on fish enterprise productivity, comparing 2008 results to pre-project. Indicators include estimated total kilograms of fish sold per year, fish pond productivity per m2, fish mortality rates, average fish live-weights at sale and days required to grow fish to sale weight. Results of project impacts on fish productivity are shown in the following table. The greatest productivity gain since pre-project has been the total kilograms of fish sold/enterprise, an increase of 163%. Related productivity improvements contributed to this gain, including increased fish pond size and productivity, a slight decrease in fish mortality rate, and a gain in average fish live- weight at sale. The results do not show a decrease in the average number of days required to grow fish to sale weight.

USAID-Funded Cambodia MSME Strengthening Project Final Monitoring And Evaluation Survey 2008 68
Table 43 Fish Producers: Productivity Indicators Pre-Project & During Project 2008
N=56 Before Project During ProjectMean estimated total kg of fish sold in one year 1,291 1,831
Mean Fish Pond Productivity/ m2 1.56 1.84 Mean Fish Morality Rate % 14.2 13.4
Mean Fish live-weight at sale-Kg. 0.81 0.84 Mean Number of days for fish growth to sale weight 193 197
Mean Fish Pond Area (m2) 680 997
5.6. Perceived Links to Poverty Alleviation Fish Producers reported some shift since pre-project towards their enterprises accounting for a larger percentage of total household income from all sources. Pre-project, most producers estimated that fish production accounted for perhaps 10%-< 40% of total household income, with 19% reporting fish production as 40% or more of their total income. In 2008, after joining the project, most producers estimated that fish production now accounted for perhaps 10%-< 60% of total household income with 34% reporting fish production as 40% or more of their total income. While enumeration of total income share benefits is difficult and reported gains appear limited, these results are still of interest. They indicate that while general economic growth is occurring, and while inflation and market shifts are having an impact, MSME clients still recognize that fish production is playing a larger role in their total household incomes. Fish Producers recognized that the kind of support for fish businesses provided by the DAI MSME project was important to help reduce poverty among other rural families in Cambodia. Among these respondents, 41% felt that MSME-type project support would be “Quite Important”, and 43% felt that it would be “Very Important” for rural poverty alleviation. The third indicator asked Fish Producers if benefits from joining the DAI MSME project helped fund more years of education for their children than originally planned before joining the project. Fully 77% of Fish Producers affirmed this benefit, with education supported for an average of 0.8 girls and 1.0 boys per enterprise, for a total of 45 boys and 34 girls among the 56 sample enterprises. These responses from client Fish Producers draw linkages between MSME project assistance, increasing total household income and increasing children’s education in their own households. Furthermore, they perceive very commonly that MSME assistance could lead to similar benefits among poorer rural Fish Producers, and could therefore make an important contribution to poverty alleviation in Cambodia. These results are very similar overall to those reported earlier for MSME Pig Producers.

USAID-Funded Cambodia MSME Strengthening Project Final Monitoring And Evaluation Survey 2008 69
5.7. Impacts On Business Accounting & Business Policy Advocacy
OBJECTIVE: Component 3: Ongoing Improved MSME Access to Finance
Indicator Value Chain Unit Target
FY2008 Actual FY2008
% of FY Target
3.1. Number of MSME trained in basic accounting. Fish No. of MSME 50 55 110%
An important component of MSME activities has been to foster improved accounting practices. Clients are sent for training in accounting skills as a component of capacity building activities. The 2008 target for adoption of improved business accounting practices as a result of project assistance was 50 Fish Producers. The result was that 21% of sample Fish Producers had indeed adopted improved accounting practices. A simple extrapolation of this rate to all 264 MSME fish client enterprises gives a total of 55 enterprises, or 110% of target. Twenty-one percent of enterprises reported participation in business associations and their activities. They had joined a new fish business association and were therefore participating in policy advocacy and dialogues since joining the project. A simple extrapolation to all MSME fish clients would mean 55 enterprises joined associations, representing 9% of the 2008 target for all types of MSME enterprises. 6. FISH VALUE CHAIN - MSME TECHNOLOGY/BENEFITS SPREAD TO
NON-PROJECT FISH PRODUCERS As for the pig value chain, this Final Evaluation was to report the extent to which DAI-MSME technologies and benefits had spread to non-project Fish Producers. As this was the first time such a “spread survey” was undertaken, it was decided with the MSME team that we would survey non-project Pig Producers in two villages where MSME Fish Producers were present. One village was randomly selected in Kampong Cham, and the others in Prey province. In each village, 25 Fish Producers who had not worked with the MSME project for at least one full production cycle were randomly selected using non-project status screening and random household interval skip sampling. To enable such random selection, these villages had to be of at least medium size of 200 households or more to have a household population sufficient for this sampling method. This fish value chain spread survey measured MSME technology and benefits spread at the local level, to non-project Fish Producers within the same villages as existing MSME producer clients. Of particular interest was the extent of the spread of MSME capacity building activities to non-project producers. Also, basic measures of fish production enterprise characteristics and volumes of production were recorded for comparison to MSME client Pig Producers. When interpreting comparative results between these non-project Fish Producers and MSME producers, it should be recalled that the non-project producer results are from a small sample of two villages.
6.1. Demographic Profile Non-project Fish Producers were slightly younger than MSME Fish Producers, by 4 years, with a mean age of 38 years. Mean household composition also differed with Non-project Fish Producer households having slightly fewer adult male and females (1.5 females and 1.5 males aged over 15 years) and slightly more children (1.6 aged under 15 years.). The mean years of experience raising fish (3.6 years) was 1.6 years fewer than the MSME project clients.

USAID-Funded Cambodia MSME Strengthening Project Final Monitoring And Evaluation Survey 2008 70
The mean level of education was similar on average, with 51% having at least some secondary education compared to 54% of MSME Fish Producer clients. Females accounted for 39% of Non-project Producers compared to 34% among MSME Fish Producer clients.
6.2. Improved Fish Technology Awareness & Training Among Non-Project Producers Among this sample of Non-project Fish Producers, 100% confirmed that their primary position in the fish value chain was as a producer. A central area of interest for this spread survey was to gain insight into the extent of training and related capacity building activities in fish production and business practices that was being undertaken by Non-project Fish Producers, and to what extent this capacity building might have spread from MSME Fish Production clients. The 51 sampled enterprises reported that they were aware of improved fish production technologies/capacity building activities in a total of 267 cases for all 12 types of technologies specified to them, or about 5 technologies per enterprise. The breakdown of types of technologies that they reported being aware of is shown in the following table. A majority of producers were aware of some specific improved fish production technologies including Fish raising techniques, Pond Construction and Pond Preparation. However, less than 50% were aware of other important improved fish production technologies including Fish Feed making techniques, Fish Health Management, Fish Medicine, Pond Selection, Stocking Density, Pond Water Quality, Fish Feeding Techniques and Fish Harvest Techniques. Awareness levels for improved business accounting practices were very low at 2% of respondents. Concerning adoption rates of these improved technologies, among those aware of the each technology, the most common pattern was to “partially adopt” these technologies. Overall 23% of respondents did not adopt, 68% “partially adopted” and 9% “fully adopted” the improved technologies that they were aware of, with some variations by type of technology. We were unable to determine the specifics of actual components of technologies adopted, the extent to which they were adopted, or whether they were adopted correctly. However, these results do indicate that most non-project producers tend to at least partially adopt improved technologies that they become aware of to improve their enterprises. The MSME project has been a local level actor in increasing awareness of new technologies in the local community.

USAID-Funded Cambodia MSME Strengthening Project Final Monitoring And Evaluation Survey 2008 71
Table 44 Non-Project Fish Producer Benefits Spread Survey: Knowledge & Adoption Rates of Improved Fish Enterprise Technologies
Awareness Adoption Rates Among Those Aware
Types of Training Total Rates Fully Partly Not Adopted N % % % %
Fish Feed making technique 15 29% 7% 67% 27% Fish Health Management 23 45% 0% 78% 22%
Fish Medicine used 20 39% 15% 80% 5% Fish raising technique 46 90% 4% 85% 11%
Pond Selection 23 45% 13% 74% 13% Pond Construction 37 73% 11% 73% 16% Pond Preparation 28 55% 14% 79% 7% Stocking Density 15 29% 7% 60% 33%
Pond Water Quality 17 33% 18% 65% 18% Fish Feeding Techniques 21 41% 5% 86% 10% Fish Harvest Techniques 21 41% 14% 76% 10%
Basic business Accounting 1 2% 0% 0% 100% Total 267 44% 9% 68% 23%
We then proceeded to ask these Fish Producers how they became aware of the new technologies that they often had chosen to adopt. Three different methods of learning were specified: self-training through observation and copying (copy cat), training from MSME producers or training from Input Suppliers or other Fish Experts. Overall, the results indicate that these Fish Producers learned about new technologies by all three methods to some extent, with 61% learning through copy-cat methods, 19% from training by MSME client Fish Producers and 20% from Input suppliers or other fish experts. It is interesting to find that MSME client Fish Producers are making a meaningful and direct contribution to the training of non-project Fish Producers. This is not a specified role for client producers with the MSME project, and yet, the project is making a wider impact on skill-building among all Fish Producers through the efforts of their Fish Producer clients. Gains in training quality are also likely when training is undertaken by MSME producers who have themselves been formally trained in these technologies, rather than using the copy-cat method. MSME producers are also likely to be the source, in many cases, for the common copy-cat method of learning by a large proportion of non-project producers in these villages. Finally, it is likely that trainings with non-project Fish Producers by Input Suppliers and other fish experts has been facilitated by the need for initial local visits to train MSME producers. There are some interesting variations in the most common methods of learning by each type of technology. If we examine the most common types of technologies learned, we can see most improved technologies of all types are learned through the copy-cat method. Fish Medicine technology is commonly learned from Input Suppliers/ fish experts, although this only accounts for 50% of those aware of these technologies. MSME producers are playing a relatively larger role than average in training non-project fish producers in Fish Raising Techniques and the less commonly recognized Stocking Density techniques. Table 45 Non-Project Fish Producer Benefits Spread Survey: How They Learned About Improved Fish Enterprise Technologies
Non-Project Fish Producers Total
Self-trained observation and copy
only
Training from
MSME project
producer
Training from Input
Supplies/Fish Expert
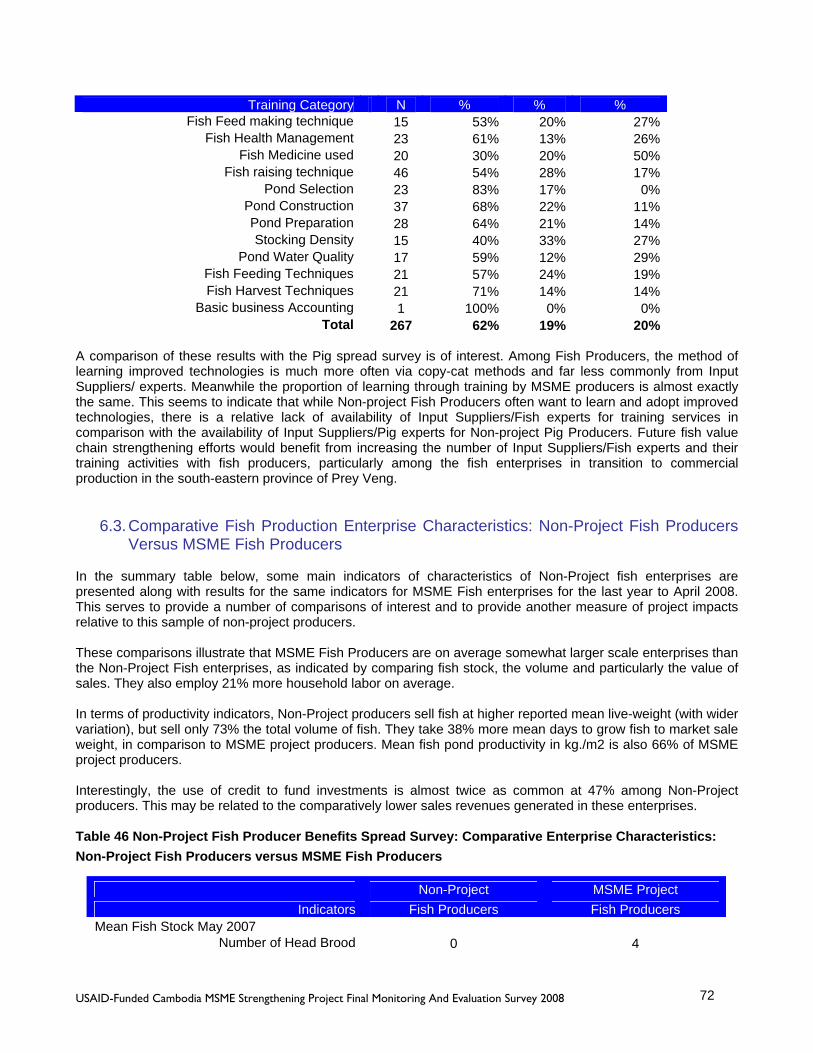
USAID-Funded Cambodia MSME Strengthening Project Final Monitoring And Evaluation Survey 2008 72
Training Category N % % % Fish Feed making technique 15 53% 20% 27%
Fish Health Management 23 61% 13% 26%Fish Medicine used 20 30% 20% 50%
Fish raising technique 46 54% 28% 17%Pond Selection 23 83% 17% 0%
Pond Construction 37 68% 22% 11%Pond Preparation 28 64% 21% 14%Stocking Density 15 40% 33% 27%
Pond Water Quality 17 59% 12% 29%Fish Feeding Techniques 21 57% 24% 19%Fish Harvest Techniques 21 71% 14% 14%
Basic business Accounting 1 100% 0% 0%Total 267 62% 19% 20%
A comparison of these results with the Pig spread survey is of interest. Among Fish Producers, the method of learning improved technologies is much more often via copy-cat methods and far less commonly from Input Suppliers/ experts. Meanwhile the proportion of learning through training by MSME producers is almost exactly the same. This seems to indicate that while Non-project Fish Producers often want to learn and adopt improved technologies, there is a relative lack of availability of Input Suppliers/Fish experts for training services in comparison with the availability of Input Suppliers/Pig experts for Non-project Pig Producers. Future fish value chain strengthening efforts would benefit from increasing the number of Input Suppliers/Fish experts and their training activities with fish producers, particularly among the fish enterprises in transition to commercial production in the south-eastern province of Prey Veng.
6.3. Comparative Fish Production Enterprise Characteristics: Non-Project Fish Producers Versus MSME Fish Producers
In the summary table below, some main indicators of characteristics of Non-Project fish enterprises are presented along with results for the same indicators for MSME Fish enterprises for the last year to April 2008. This serves to provide a number of comparisons of interest and to provide another measure of project impacts relative to this sample of non-project producers. These comparisons illustrate that MSME Fish Producers are on average somewhat larger scale enterprises than the Non-Project Fish enterprises, as indicated by comparing fish stock, the volume and particularly the value of sales. They also employ 21% more household labor on average. In terms of productivity indicators, Non-Project producers sell fish at higher reported mean live-weight (with wider variation), but sell only 73% the total volume of fish. They take 38% more mean days to grow fish to market sale weight, in comparison to MSME project producers. Mean fish pond productivity in kg./m2 is also 66% of MSME project producers. Interestingly, the use of credit to fund investments is almost twice as common at 47% among Non-Project producers. This may be related to the comparatively lower sales revenues generated in these enterprises. Table 46 Non-Project Fish Producer Benefits Spread Survey: Comparative Enterprise Characteristics: Non-Project Fish Producers versus MSME Fish Producers
Non-Project MSME Project Indicators Fish Producers Fish Producers
Mean Fish Stock May 2007 Number of Head Brood 0 4

USAID-Funded Cambodia MSME Strengthening Project Final Monitoring And Evaluation Survey 2008 73
Number of head Mature Fish 1,467 898 Number of Head Fingerling 6,119 9,923
Total 7,585 10,635 Mean Number of Kg. Sold 2007-2008
Number of Kg of Mature Fish Sold 1,351 1,863 Mean Gross Sale Revenue 2007-2008
Mature Fish ( Sale to Market) $1,502 $3,637 Mean Household Labor in Fish Production 2.67 3.23 % using credit of any type for investments 47% 25%
Fish Morality Rate % 16% 13% Average Fish live weight at sale-Kg. 1.2 0.8 No. of days for fish growth to sale weight 271 197 Fish Kg./Pond area m2 1.2 1.8
Figure 26 Comparative Enterprise Characteristics Non- Project Fish Producers vs MSME Fish Producers
1,351
$1,5021,863
$3,637
0
500
1,000
1,500
2,000
2,500
3,000
3,500
4,000
Non-Project Fish Producers MSME Fish Producers
Comparative Enterprise Characteristics Non-Project Fish Producers versus MSME Fish Producers (2007-2008 Means)
Mean Fish kg. Sold 2007-08 Mean Gross Sales Revenue USD 2007-08
USAID-Funded Cambodia MSME Strengthening Project Final Monitoring And Evaluation Survey 2008 74
7. BRICK AND TILE MAKERS Of a total of 1,655 enterprises of all types working with the DAI MSME project in 2008, 0.9% or 15 businesses are enterprises in the brick and tile value chain. Within this value chain, all are brick and tile makers. While numerically small, brick and tile makers are typically large scale enterprises and therefore are important to the overall assessment of MSME project impacts.
7.1. Demographic Profile This survey interviewed a proportionately and randomly selected sample of 12 DAI MSME project brick and tile makers (80% of the total), engaged with the project for at least one production cycle and within the four of six provinces in which DAI has operated. The four sampled provinces include all MSME brick and tile makers. The geographical distribution of brick and tile makers by province is uneven, with 60% located in Kampong Cham province, 20% in Kratie and 20% in Prey Veng. Brick and tile makers are 100% male, typically aged around 50 years and have had an average of 14.5 years experience making bricks and tiles. Their households are composed of an average of 2.7 females and 2.3 males aged over 15 years and 1.0 children aged under 15 years. They are much more educated than average in a rural Cambodian context, with 83% having at least some secondary level education.
7.2. Project Collaboration & Training Benefits Most brick and tile makers have been engaged with the DAI MSME project for a period of at least 12-24 months and 33% have been working with the project for over 24 months. Table 47 Brick & Tile Makers: Months since joining the MSME project
Months Count % <12 months 0 0%
12 - 24 months 8 67% > 24 months 4 33%
Total 12 100% Brick and tile maker enterprises are almost all engaged in making brick and tile products and 33% are also engaged in either brick and tile wholesale or retail. One hundred percent sell both roof tiles and bricks, and only 8% sell wall tiles or floor tiles. A core activity in support of brick and tile makers for the DAI MSME has been to organize technical training and related capacity building activities in brick and tile making and business practices. The 12 sampled enterprises reported attending a total of a 72 person/training activities since joining the project, an average of 6 training attendances per enterprise. The breakdown of types of courses attended and by province is shown in the following chart. Participation rates are variable by activity, reflecting individual enterprise needs.

USAID-Funded Cambodia MSME Strengthening Project Final Monitoring And Evaluation Survey 2008 75
Figure 27 Brick & Tile Makers: MSME Project Facilitated Trainings
11
6
5
11
4
3
6
3
6
7
10
0 2 4 6 8 10 12
No. of Brick & Tile Enterprise Trainees
Group Meetings wi h MSME Staff
Brick & Tile Raw Materials Manageement
Kiln Management
Glazing
Basic business Accounting
Training: business other than Accounting
Training: business advocacy
Introduction to Finance Ins itutions
Introduction toTraders
Cross provincial Exposure trip
International Exposure Trip
Brick & Tile Makers: MSME Project Facilitated Trainings n=72
7.3. Impacts on New Capital Investments & Credit, Gross Sales Volumes & Revenue, Costs of Production & Gross Profits,
OBJECTIVE: Component 2: Enhanced Capacity of Value Chain Firms &/or Stand-Alone Providers to Support Competitive Value Chains
Indicator Value Chain Unit Target
FY2008 Actual FY2008
% of FY Target
2.3. Percent increase in value of new investments by MSME
Brick & Tile
Mean $/MSME $18,000 $115,160 640%
An important indicator of project performance is the increase in the average value of new investments in brick and tile enterprises. The value of “new investments” is defined as the sum of three investment components: fixed capital investments during the project, the value of stock at the start of the production cycle in May 2007 and the value of total costs of brick and tile making during May 2007 - April 2008. The 2008 target for average new investments per enterprise was $40,000. The result was an average of new investments of $115,160 or 640% of target. This is a very great increase in investments since joining the project. The tables below show the composition of new investments by component as well as the total.
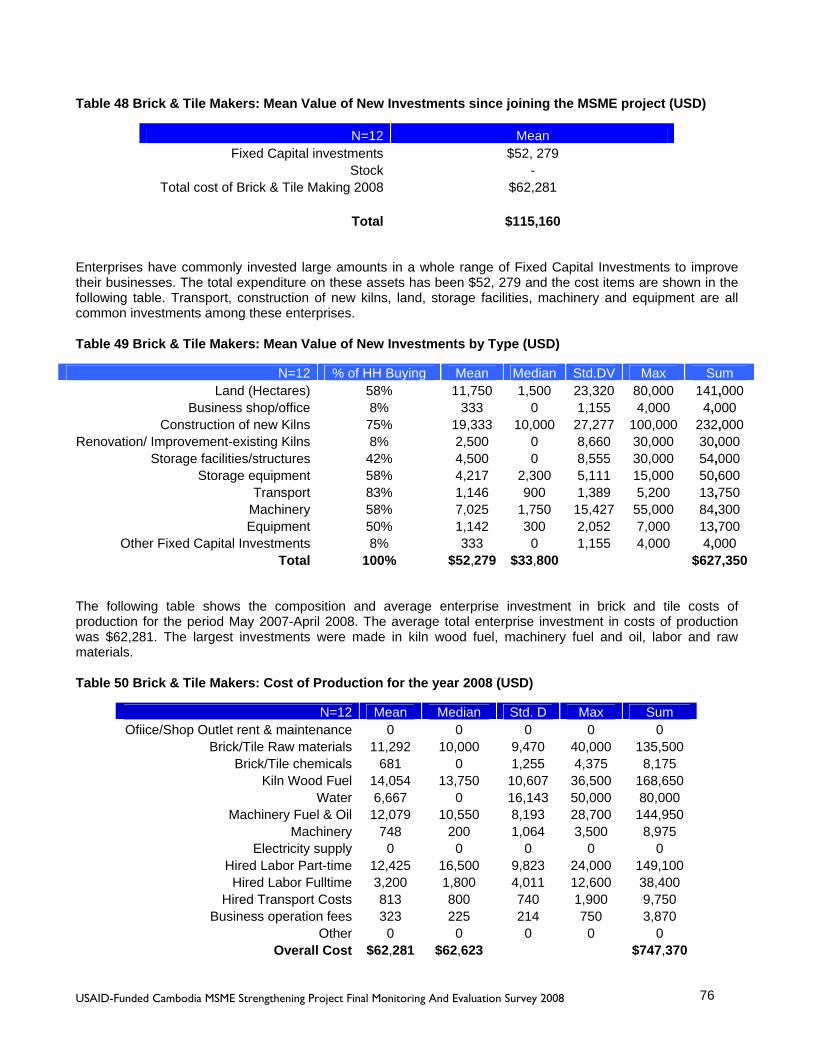
USAID-Funded Cambodia MSME Strengthening Project Final Monitoring And Evaluation Survey 2008 76
Table 48 Brick & Tile Makers: Mean Value of New Investments since joining the MSME project (USD)
N=12 Mean Fixed Capital investments $52, 279
Stock - Total cost of Brick & Tile Making 2008 $62,281
Total $115,160
Enterprises have commonly invested large amounts in a whole range of Fixed Capital Investments to improve their businesses. The total expenditure on these assets has been $52, 279 and the cost items are shown in the following table. Transport, construction of new kilns, land, storage facilities, machinery and equipment are all common investments among these enterprises. Table 49 Brick & Tile Makers: Mean Value of New Investments by Type (USD)
N=12 % of HH Buying Mean Median Std.DV Max Sum Land (Hectares) 58% 11,750 1,500 23,320 80,000 141,000
Business shop/office 8% 333 0 1,155 4,000 4,000 Construction of new Kilns 75% 19,333 10,000 27,277 100,000 232,000
Renovation/ Improvement-existing Kilns 8% 2,500 0 8,660 30,000 30,000 Storage facilities/structures 42% 4,500 0 8,555 30,000 54,000
Storage equipment 58% 4,217 2,300 5,111 15,000 50,600 Transport 83% 1,146 900 1,389 5,200 13,750
Machinery 58% 7,025 1,750 15,427 55,000 84,300 Equipment 50% 1,142 300 2,052 7,000 13,700
Other Fixed Capital Investments 8% 333 0 1,155 4,000 4,000 Total 100% $52,279 $33,800 $627,350
The following table shows the composition and average enterprise investment in brick and tile costs of production for the period May 2007-April 2008. The average total enterprise investment in costs of production was $62,281. The largest investments were made in kiln wood fuel, machinery fuel and oil, labor and raw materials. Table 50 Brick & Tile Makers: Cost of Production for the year 2008 (USD)
N=12 Mean Median Std. D Max Sum Ofiice/Shop Outlet rent & maintenance 0 0 0 0 0
Brick/Tile Raw materials 11,292 10,000 9,470 40,000 135,500 Brick/Tile chemicals 681 0 1,255 4,375 8,175
Kiln Wood Fuel 14,054 13,750 10,607 36,500 168,650 Water 6,667 0 16,143 50,000 80,000
Machinery Fuel & Oil 12,079 10,550 8,193 28,700 144,950 Machinery 748 200 1,064 3,500 8,975
Electricity supply 0 0 0 0 0 Hired Labor Part-time 12,425 16,500 9,823 24,000 149,100
Hired Labor Fulltime 3,200 1,800 4,011 12,600 38,400 Hired Transport Costs 813 800 740 1,900 9,750
Business operation fees 323 225 214 750 3,870 Other 0 0 0 0 0
Overall Cost $62,281 $62,623 $747,370

USAID-Funded Cambodia MSME Strengthening Project Final Monitoring And Evaluation Survey 2008 77
The average total enterprise cost of brick and tile production has increased by 160% from $38,849 in the last year before joining the project. Increased costs have been experienced for all major cost items described above.
OBJECTIVE: Component 3: Ongoing Improved MSME Access to Finance
Indicator Value Chain Unit Target
FY2008 Actual FY2008
% of FY Target
3.0. Percent of MSME in target value chains that have accessed loans from any source at any time.
Brick & Tile
No. of MSME 15 6 40%
Fixed Capital investments described above have been financed using only their own capital in a reported 67% of enterprises. Only 33% of enterprises reported borrowing some or all of their investment capital from any kind of lender. Loans with institutional MFI’s were taken by 17% of enterprises with a mean value of $16,250. Loans from informal credit sources were reported by 25% of enterprises, with average loans amounts of $1,250 in loans from family or friends and $4,000 from private money lenders. Extrapolating the 33% rate of borrowing from the sample to all 15 MSME brick and tile makers would mean that 6 enterprises would have borrowed from any source, 40% of the 2008 target. However, unlike the targets for this indicator in other value chains, the target of 15 enterprises here is the total number of these enterprises that are clients of the project. By comparison, for pig and fish producers the target numbers of firms accessing credit are a much smaller proportion of total client enterprises in those value chains. Having reported patterns of investment and expenditure, we now turn to examining key DAI MSME project impacts on brick and tile maker enterprise volumes of sales and gross sales revenues. Here we provide the most recent results from the year to April 2008 and assess impacts by comparison with results from the last year before each enterprise joined the project as reported in this survey.
OBJECTIVE: Component 1: Improved Performance of USAID-Assisted Enterprises in Targeted Value Chains
Indicator Value Chain Unit Target
FY2008 Actual FY2008
% of FY Target
1.1 (a) Percent change in volume of sales of program-assisted enterprises
Brick & Tile
Mean No. Bricks & Tiles/MSMS
540,334 338,701 63%
First we examine MSME project impacts on brick and tile maker volumes of sales. The mean number of tiles of all types sold in the year to April 2008 was 338,701 tiles/enterprise. This is 63% of the 2008 MSME project target of 540,000 tiles. Only tile volumes are measured for project targets, but as the following table shows the volume of tile production is only 32% of total volume with brick production accounting for the remaining 68% of total volume (715,942 bricks). Benefits of the MSME project have included technological improvements to kilns, and production methods, which have increased productivity, and support to find and develop new markets, for both tiles and bricks. Here, progress against baseline and project sales volume and value targets is examined for tiles only as done in earlier studies. At the same time, the contribution of bricks to overall enterprise performance will be described in the text. In the later summary section on overall project impacts, the full value of both tile and brick production will be considered.

USAID-Funded Cambodia MSME Strengthening Project Final Monitoring And Evaluation Survey 2008 78
Table 51 Brick & Tile Makers: Sales Volumes 2008
N=12 Mean Median Std. D Max Sum Roof Tiles 338,701 317,797 189,345 741,525 4,064,407
Bricks 715,942 644,022 472,134 1,565,217 8,591,304
Total 1,054,643 945,422 12,655,711
OBJECTIVE: Component 1: Improved Performance of USAID-Assisted Enterprises in Targeted Value Chains
Indicator Value Chain Unit Target
FY2008 Actual FY2008
% of FY Target
1.1 (b) Change in value of sales of program-assisted enterprises
Brick & Tile
Mean $/MSME $21,156 $39,967 189%
MSME project impacts on enterprise Gross Sales Revenue in the year to April 2008 also show very good results. The mean Gross Sales Revenue for tile production was $39,967/enterprise. This exceeds the 2008 MSME target of $21,156 by 189%. The quality of both tiles and bricks produced with MSME project assistance improved, resulting in increased unit values of both products, as shown in the figure below. Tiles have always been of higher value and this value has now improved to 12 cents per tile. This continues a trend noted in the 2007 Evaluation which noted an increase from a baseline value of 4 cents/tile, to a project mid-point value of 6 cents/ tile in 2007. Figure 28 Brick & Tile Makers: Unit Values of Tiles & Bricks Pre-Project & 2008
$56
$21
$118
$56
$0
$20
$40
$60
$80
$100
$120
Last Year Before Project During Project 2008
Brick & Tile Makers: Unit Values of Tiles & Bricks Last Year Pre-Project & During Project 2008
$ Value Tiles/1,000 $ Value Bricks/1,000

USAID-Funded Cambodia MSME Strengthening Project Final Monitoring And Evaluation Survey 2008 79
The average composition of Gross Sales Revenue in enterprises is shown in the following table. Here, in addition to tile income, brick production is shown to contribute 46% of total revenues, for a total of $73,400. Brick revenues are clearly important to these enterprises while not specified in the project indicators. Table 52 Brick & Tile Makers: Gross Sales Revenue 2008 (USD)
N=12 Mean Median Std. D Max Sum Roof Tiles 39,967 37,500 22,343 87,500 479,600
Bricks 33,433 30,000 21,770 72,000 401,200 Total $73,400 $76,425 $880,800
This 2008 total Gross Sales Revenue for both bricks and tiles compares to a reported pre-project average of $31,187/enterprise, an increase of 235%. This is a very large increase in revenues over the three years of project assistance. The mean Gross Profit/enterprise in 2008 for both bricks and tiles was $11,119. Gross Profits during the last year before joining the project were negative on average due to losses in some enterprises. Results are shown in the following table. Table 53 Brick & Tile Makers: Gross Profit 2008 & Pre-Project (USD)
N=12 During Project 2008 Before Project Mean 11,119 -7,662
Median 9,375 -12,569 Std. Deviation 30,353 26,949
Minimum -37,375 -45,860 Maximum 68,000 59,955
Sum $133,430 $-91,947 Gross Revenue for both bricks and tiles was 118% of Costs of Production in 2008 on average, compared to 80% of Costs of Production pre-project. The proportion of enterprises making a loss in 2008 was 33%, well down from the 67% of enterprises making a loss pre-project. Indeed, one other simple but major MSME project impact is that it has maintained the viability of these enterprises.
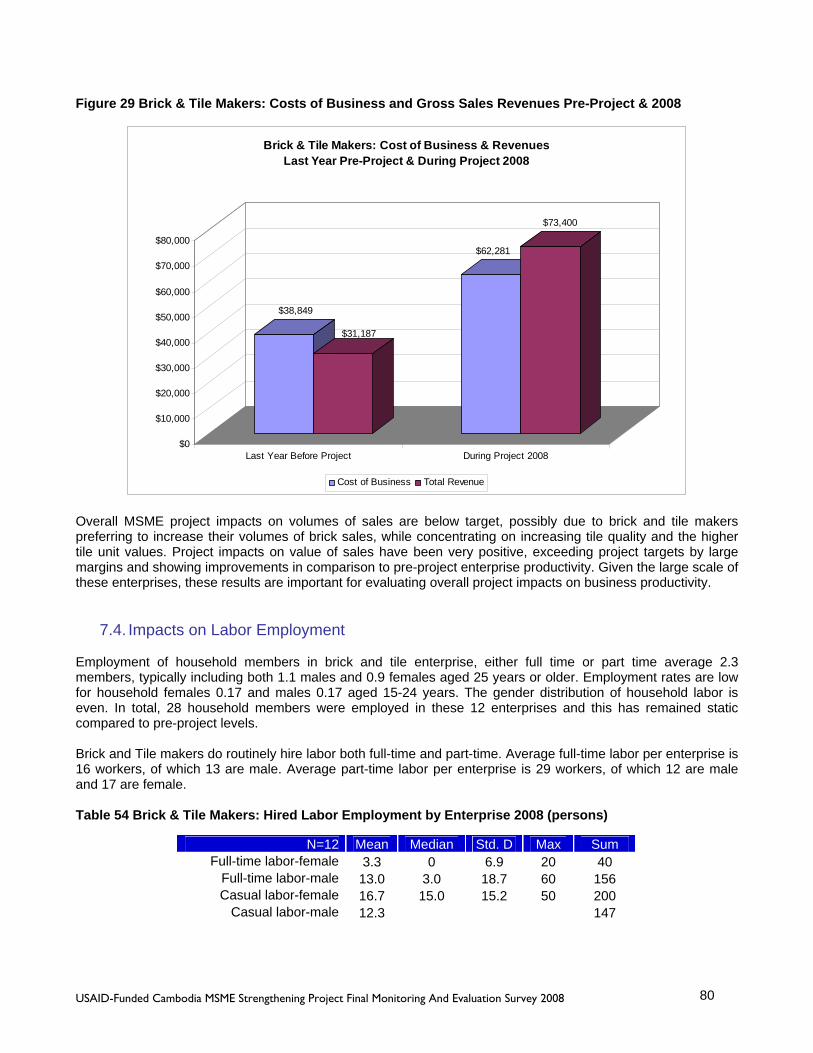
USAID-Funded Cambodia MSME Strengthening Project Final Monitoring And Evaluation Survey 2008 80
Figure 29 Brick & Tile Makers: Costs of Business and Gross Sales Revenues Pre-Project & 2008
$38,849
$31,187
$62,281
$73,400
$0
$10,000
$20,000
$30,000
$40,000
$50,000
$60,000
$70,000
$80,000
Last Year Before Project During Project 2008
Brick & Tile Makers: Cost of Business & Revenues Last Year Pre-Project & During Project 2008
Cost of Business Total Revenue
Overall MSME project impacts on volumes of sales are below target, possibly due to brick and tile makers preferring to increase their volumes of brick sales, while concentrating on increasing tile quality and the higher tile unit values. Project impacts on value of sales have been very positive, exceeding project targets by large margins and showing improvements in comparison to pre-project enterprise productivity. Given the large scale of these enterprises, these results are important for evaluating overall project impacts on business productivity.
7.4. Impacts on Labor Employment Employment of household members in brick and tile enterprise, either full time or part time average 2.3 members, typically including both 1.1 males and 0.9 females aged 25 years or older. Employment rates are low for household females 0.17 and males 0.17 aged 15-24 years. The gender distribution of household labor is even. In total, 28 household members were employed in these 12 enterprises and this has remained static compared to pre-project levels. Brick and Tile makers do routinely hire labor both full-time and part-time. Average full-time labor per enterprise is 16 workers, of which 13 are male. Average part-time labor per enterprise is 29 workers, of which 12 are male and 17 are female. Table 54 Brick & Tile Makers: Hired Labor Employment by Enterprise 2008 (persons)
N=12 Mean Median Std. D Max Sum Full-time labor-female 3.3 0 6.9 20 40
Full-time labor-male 13.0 3.0 18.7 60 156 Casual labor-female 16.7 15.0 15.2 50 200
Casual labor-male 12.3 147

USAID-Funded Cambodia MSME Strengthening Project Final Monitoring And Evaluation Survey 2008 81
Hired labor employment has increased since joining the project by 24% overall. This has generated 108 new jobs and these 12 enterprises are now employing a total hired labor force of 543 persons in 2008. Table 55 Brick & Tile Makers: Hired Labor Employment Totals Pre-Project & 2008 (persons)
Pre-Project During Project 2008 Hired Labor Employment N % N %
Full-time labor-female 30 7 40 7 Full-time labor-male 101 23 156 29 Casual labor-female 183 42 200 37
Casual labor-male 121 29 147 27 Total Labor 435 100 543 100
Brick and Tile makers, while limited in number, are major employers of hired labor. Since joining the project, there has been an employment growth of 24% in these enterprises.
7.5. Business Productivity Impacts A set of questions were included to enumerate MSME project impacts on brick and tile enterprise productivity comparing 2008 results to pre-project. Indicators include volume of sales, and unit prices of bricks and tiles. Results of project impacts on brick and tile enterprise productivity are shown in the following table. All indicators show gains in productivity since joining the MSME project. The greatest productivity gains, over 200%, are in the unit values of bricks and tiles sold, resulting from production changes instituted during the project, leading to higher quality and unit prices for these products. Productivity gains have also been made in terms of production volumes for bricks and tiles, but the gains here have been more modest. Table 56 Brick & Tile Makers: Productivity Indicators Pre-Project & During Project 2008
Before Project
During Project
% Change
N=12 Mean Mean Average number of tiles sold per month 47,477 56,389 119%
Average number of bricks sold per month 36,017 38,944 108%Average value of a sale of 1,000 tiles-riel 19 47 247%
Average value of a sale of 1,000 bricks-riel 55 118 214%
7.6. Perceived Links to Poverty Alleviation Brick and tile makers indicated a moderate shift since pre-project towards brick and tile making accounting for a larger percentage of household income from all sources. Pre-project producers estimated that brick and tile making accounted anywhere from 30%-< 100% of total household income, with 66% reporting brick and tile making as 50% or more of their total income. In 2008 after joining the project, most estimated that brick and tile making now accounted for perhaps 50%- 100% of total household income with 91% reporting brick and tile income as 50% or more of their total income. As brick and tile makers are large scale and capital intensive enterprises, improvements would not be expected to directly contribute to rural poverty alleviation. However, improving these enterprises has led to employment growth of 24% since joining the project, which can contribute to poverty alleviation. On average, each of these 12 enterprises employ 45 people and have employed 11 more people each since joining the project.
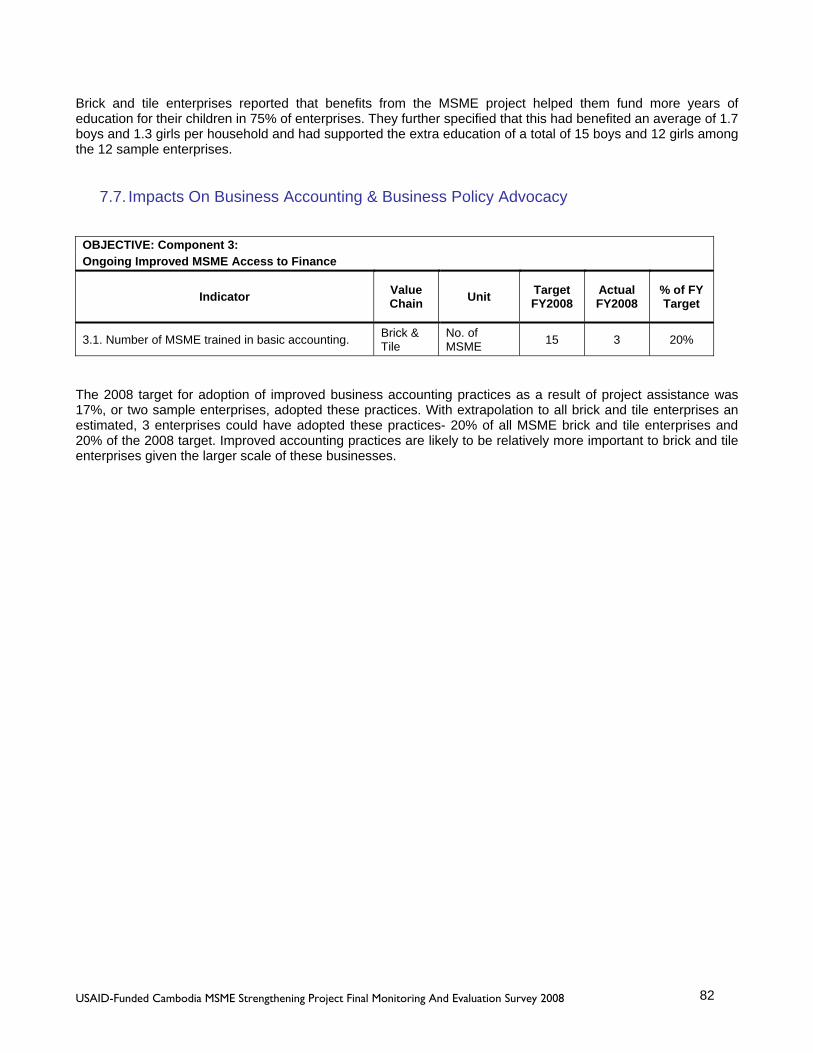
USAID-Funded Cambodia MSME Strengthening Project Final Monitoring And Evaluation Survey 2008 82
Brick and tile enterprises reported that benefits from the MSME project helped them fund more years of education for their children in 75% of enterprises. They further specified that this had benefited an average of 1.7 boys and 1.3 girls per household and had supported the extra education of a total of 15 boys and 12 girls among the 12 sample enterprises.
7.7. Impacts On Business Accounting & Business Policy Advocacy
OBJECTIVE: Component 3: Ongoing Improved MSME Access to Finance
Indicator Value Chain Unit Target
FY2008 Actual FY2008
% of FY Target
3.1. Number of MSME trained in basic accounting. Brick & Tile
No. of MSME 15 3 20%
The 2008 target for adoption of improved business accounting practices as a result of project assistance was 17%, or two sample enterprises, adopted these practices. With extrapolation to all brick and tile enterprises an estimated, 3 enterprises could have adopted these practices- 20% of all MSME brick and tile enterprises and 20% of the 2008 target. Improved accounting practices are likely to be relatively more important to brick and tile enterprises given the larger scale of these businesses.

USAID-Funded Cambodia MSME Strengthening Project Final Monitoring And Evaluation Survey 2008 83
8. Conclusions The USAID-funded Cambodia Micro, Small and Medium Enterprises (MSME) Strengthening Project implemented by Development Alternatives, Inc. (DAI) will conclude its implementation after three years of operations in September 2008. The vision of the project has been to improve entrepreneurship and competitiveness for micro, small and medium enterprises (MSME) in selected value chains and target provinces by enabling improvements to the business environment in a context where many of these targeted MSME were operating in a difficult environment. Value chain linkages were under-developed, business margins were thin, and business risks were high, constraining local economic development and efforts in rural poverty alleviation. The Project has assisted rural MSME entrepreneurs to improve opportunities and incomes by working in direct partnership with stakeholders in value chains to promote new ways of thinking and acting among local business people. The emphasis has been on increased trust and cooperation, networking, sharing information and pooling resources in ways that can benefit all MSME in the value chain. DAI has facilitated training of MSME by working directly with Input Suppliers and Veterinarians, who then train enterprises within their sectors. Practical tools have been utilized to improve products, services, business relationships and access to affordable credit. The final results of the DAI MSME Strengthening Project have been described in this Final Evaluation. The project has had major impacts on improving the productivity and business performance of these enterprises, with wider beneficial impacts at the value chain level. These impacts, in some cases, have been quite spectacular within a three year period. The project’s client enterprises and their value chains will be undoubtedly strengthened in many ways based on improved value chain synergies and improved enterprise productivity when the project ceases assistance in these provinces. In a short three year period, not all targets could be achieved and not all potential benefits of project assistance could be fully exploited. The results shown here could be built on to further add value to these enterprises and value chains in the future. Several issues would benefit from further project support. There is room for further improvements in technical business productivity improvements and for further training in business skills and advocacy among enterprises. There could be further efforts to boost the proportion of women’s enterprises involved in the project in some areas. Consideration could be given to how to further increase employment opportunities as a means of productivity growth as well as employment growth. A final area for future project support could be in the area of facilitating the spread of training and capacity building to Non-Project Producers to capitalize on a process that is already underway to some extent. These are some of the potentials for the future. Meanwhile, the DAI MSME Strengthening Project has achieved much within the three years of its operations and will leave producer enterprises and their value chains in much better condition to do business more efficiently and profitably in the developing Cambodia’s rural economy.

USAID-Funded Cambodia MSME Strengthening Project Final Monitoring And Evaluation Survey 2008 84
9. ANNEX
9.1. STUDY BACKGROUND TABLES Table A57 Total Number of DAI MSME Clients at April 2008
Client type Total Number of Businesses (4 Provs: KCM KTR PVG SVG)
Total Number of Businesses (2 Provs: KDL, KSP)
KCM KTR PVG SVR Total KD Kg.S Total
Total Number of Businesses (All Six Provs. )
Pig/ Producer 405 285 130 210 1030 113 66 179 1209 Pig/ Veterinarian 62 13 32 20 127 5 10 15 142
Pig/ Input Supplier 11 2 3 4 20 1 3 4 24
Pig/ Slaughterhouse 1 0 0 0 1 0 0 0 1
Total 479 300 165 234 1178 119 79 198 1376
Fish/ Raiser 84 36 90 42 252 12 0 12 264 Total 84 36 90 42 252 12 0 12 264
Brick & Tile/ Maker 9 3 3 0 15 0 0 0 15
Total 9 3 3 0 15 0 0 0 15
9.2. PIG VALUE CHAIN-PIG PRODUCERS TABLES Table A58 Pig Producers: Number & Gender by Province
Total Gender N % Female % Male %
Kampong Cham 178 44% 54 30% 124 70% Kratie 116 29% 31 27% 85 73%
Prey Veng 49 12% 4 8% 45 92% Svay Rieng 63 16% 0 0% 63 100%
406 100% 89 22% 317 78% Table A59 Pig Producers: Education Level by Province
N % None Primary Secondary TertiaryKampong Cham 178 44% 1% 28% 65% 6%
Kratie 116 29% 4% 28% 61% 6% Prey Veng 49 12% 0% 22% 69% 8%
Svay Rieng 63 16% 2% 24% 71% 3% Total 406 100% 2% 27% 66% 6%

USAID-Funded Cambodia MSME Strengthening Project Final Monitoring And Evaluation Survey 2008 85
Table A60 Pig Producers: Age & Pig Raising Experience
Table statistic of Age & Year Experience Mean Median Std.DV
Age-years 38.8 38 9.4 Experience in raising pigs-years 6.4 5 5.3
Table A61 Pig Producers: Household Members
F>=15 M>=15 Girls<15 Boys<15 Mean of Household member Mean Mean Mean Mean
Total 1.8 1.9 1.2 1.2 Kampong Cham 1.8 1.9 1.3 1.3
Kratie 1.9 1.7 1.1 0.9 Prey Veng 1.8 2.1 1.2 1.2
Svay Rieng 1.6 1.7 1.0 1.1 Table A62 Pig Producers: MSME Project Facilitated Trainings
Total % K.cham Kratie P.Veng S.Reing Prov. N=406 Total N=178 N=116 N=46 N=63 Total
Group Meetings with MSME Staff 336 83% 43% 32% 14% 11% 100%Feed making technique 258 64% 45% 26% 10% 19% 100%Vaccinations/Medicine 400 99% 44% 29% 12% 16% 100%
Pig Breeding Techniques 251 62% 44% 36% 6% 14% 100%Pig raising technique 393 97% 44% 29% 12% 15% 100%
Pig Waste Management/Biogas 196 48% 57% 23% 5% 15% 100%Pig Farm Management 272 67% 45% 37% 4% 14% 100%Pig Disease Diagnosis 338 83% 47% 31% 9% 13% 100%
Pig sty/Pigpen improvement 318 78% 43% 33% 8% 15% 100%Basic business Accounting 202 50% 32% 34% 18% 16% 100%
Training: business other than Accounting 110 27% 34% 46% 1% 19% 100%Training: business advocacy 122 30% 31% 48% 6% 15% 100%
Introduction to Finance Institutions 90 22% 29% 37% 3% 31% 100%Introduction to Traders 103 25% 31% 46% 4% 19% 100%
Cross provincial Exposure trip 113 28% 50% 27% 15% 9% 100%International Exposure Trip 30 7% 43% 37% 7% 13% 100%
Total/ % Pig Producer Clients x Prov. 3,532 44% 29% 12% 16% 100%
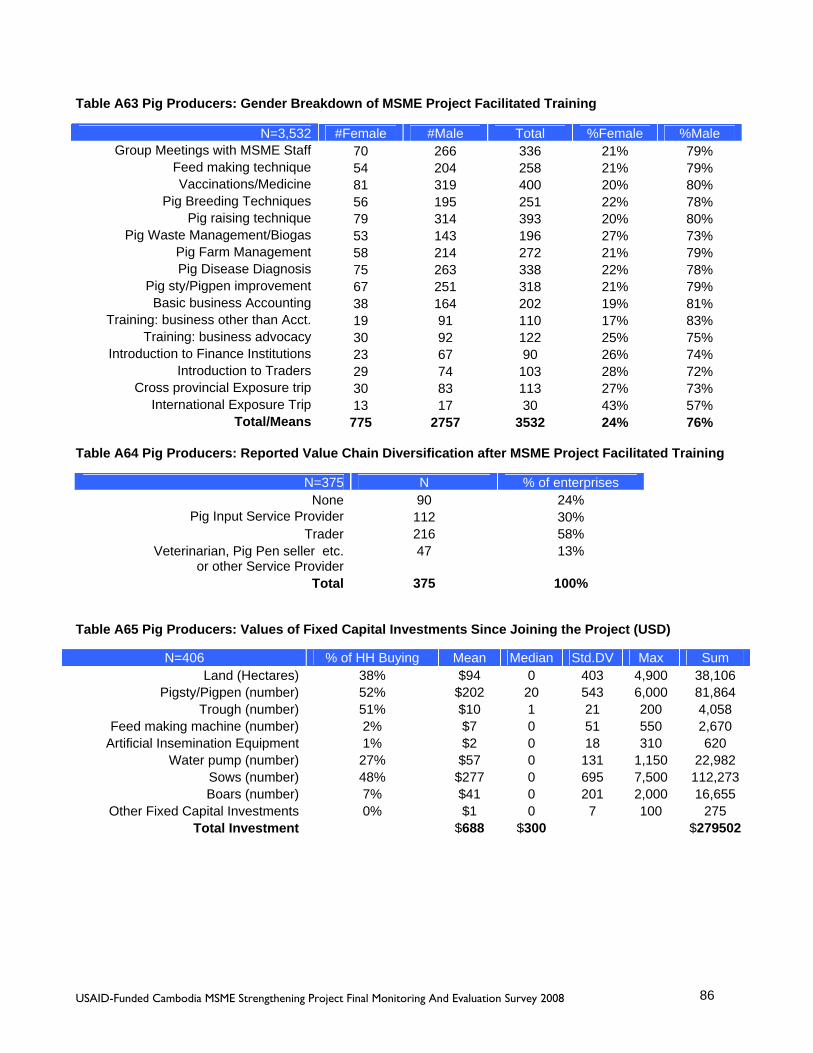
USAID-Funded Cambodia MSME Strengthening Project Final Monitoring And Evaluation Survey 2008 86
Table A63 Pig Producers: Gender Breakdown of MSME Project Facilitated Training
N=3,532 #Female #Male Total %Female %Male Group Meetings with MSME Staff 70 266 336 21% 79%
Feed making technique 54 204 258 21% 79% Vaccinations/Medicine 81 319 400 20% 80%
Pig Breeding Techniques 56 195 251 22% 78% Pig raising technique 79 314 393 20% 80%
Pig Waste Management/Biogas 53 143 196 27% 73% Pig Farm Management 58 214 272 21% 79% Pig Disease Diagnosis 75 263 338 22% 78%
Pig sty/Pigpen improvement 67 251 318 21% 79% Basic business Accounting 38 164 202 19% 81%
Training: business other than Acct. 19 91 110 17% 83% Training: business advocacy 30 92 122 25% 75%
Introduction to Finance Institutions 23 67 90 26% 74% Introduction to Traders 29 74 103 28% 72%
Cross provincial Exposure trip 30 83 113 27% 73% International Exposure Trip 13 17 30 43% 57%
Total/Means 775 2757 3532 24% 76% Table A64 Pig Producers: Reported Value Chain Diversification after MSME Project Facilitated Training
N=375 N % of enterprises None 90 24%
Pig Input Service Provider 112 30% Trader 216 58%
Veterinarian, Pig Pen seller etc. 47 13% or other Service Provider
Total 375 100% Table A65 Pig Producers: Values of Fixed Capital Investments Since Joining the Project (USD)
N=406 % of HH Buying Mean Median Std.DV Max Sum Land (Hectares) 38% $94 0 403 4,900 38,106
Pigsty/Pigpen (number) 52% $202 20 543 6,000 81,864 Trough (number) 51% $10 1 21 200 4,058
Feed making machine (number) 2% $7 0 51 550 2,670 Artificial Insemination Equipment 1% $2 0 18 310 620
Water pump (number) 27% $57 0 131 1,150 22,982 Sows (number) 48% $277 0 695 7,500 112,273 Boars (number) 7% $41 0 201 2,000 16,655
Other Fixed Capital Investments 0% $1 0 7 100 275 Total Investment $688 $300 $279502

USAID-Funded Cambodia MSME Strengthening Project Final Monitoring And Evaluation Survey 2008 87
Table A66 Pig Producers: Fixed Capital Investments Since Joining the Project (Quantities)
N=406 Mean Median Std.DV Max Sum Land (Hectares) 0.004 0.04 0 0.9 1.52
Pigsty/Pigpen (number) 1.0 1.80 0 20 421 Trough (number) 2.2 3.90 0 30 896
Feed making machine (number) 0.02 0.15 0 1 9 Artificial Insemination Equipment 0.02 0.12 0 1 6
Water pump (number 0.3 0.47 0 2 113 Sows (number) 1.4 2.90 0 551 Boars (number) 0.14 0.66 0 8 56
Table A67 Pig Producers: Pig Stock in May 2007 (Head)
N=406 Mean Median Std. D Max Sum Piglets 16 10 20 200 6,316 Feeder 8 3 23 400 3,415
Pigs Boars 0 0 1 5 55 Sows 3 2 6 80 1,193
Overall 27 18 10,979 Table A68 Pig Producers: Pig Stock Value in May 2007 (USD)
Pig Stock Average # of Head Mean Value per Head Total Value PigsPiglets 16 $39 $609 Feeder 8 $154 $1,301
Boars 0.1 $250 $34 Sows 6 $200 $588 Total $2,532
Table A69 MSME Pig Producers: Pig Stock Value One Year Before Joining the Project (USD)
N=406 Mean Median Std. D Max Sum Piglets $14 10 31 500 $5,784 Feeder $7 2 22 400 $2902
Pigs Boars 0 0 1 6 $42 Sows $2 1 5 80 $971
Overall $24 16 $9,699

USAID-Funded Cambodia MSME Strengthening Project Final Monitoring And Evaluation Survey 2008 88
Table A70 Pig Producers: Cost of pig production one year before joining the Project (USD)
N=406 Mean Median Std. D Max Sum Piglets 124 0 282 2,500 50,188
Supplementary Feed 1,084 500 5,036 100,000 439,993 Vaccine 55 10 498 10,000 22,218
Medicine 24 5 110 2,000 9,552 Veterinary Service 7 0 18 157 2710
Machinery Fuel & Oil 38 8 78 912 15,394 Machinery Repair/Maintenance 5 0 20 250 2,045
Hired Labor Part-time 1 0 10 200 223 Hired Labor Fulltime 14 0 249 5,000 5,880
Transport Costs 10 0 22 200 4,135 Trader license fees 0 0 0 10 10
Slaughterhouse fees 0 0 0 0 0 Inspection Fees 0 0 0 0 0
Overall Cost $1,360 $718 $552,348 Table A71 Pig Producers: Credit- Investment Capital by source (USD)
N=406 Count % Own money only 349 86%
Own money and borrow 52 13% Borrow Only 5 1%
Total 406 100% Table A72 Pig Producers: Credit Type (USD)
N=52 N % Financial Institution 30 58%
Family and/or friends 14 27% Private money lender 7 13%
Input suppliers (Feed & Medicine Credit) 1 2% Total 52 100%
Table A73 Pig Producers: Credit Amount by Type (USD)
N=57 Mean Median St.Dv Max Sum Financial Institution 648 150 1071 5,000 36,925
Family and/or friends 761 500 752 2,000 13,700 Private money lender 392 300 245 1,000 3,920
Input suppliers (Feed & Medicine Credit) 5 0 40 300 300

USAID-Funded Cambodia MSME Strengthening Project Final Monitoring And Evaluation Survey 2008 89
Table A74 Pig Producers: Number of head sold the last year before joining the project
N=406 Mean Median Std. D Max Sum Piglets 15 0 39 400 6,061 Feeder 16 10 22 300 6,637
Pigs Boars 1 0 15 300 313 Sows 2 0 30 600 737
Overall Head Sold 34 20 13,748 Table A75 Pig Producers: Gross Sales Revenue: the last year before joining the project (USD)
N=406 Mean Median Std. D Max Sum Piglets $359 0 1,092 $12,000 $145,817 Feeder $1,605 $871 2,745 $33,000 $651,627
Pigs Boars $190 0 3,722 $75,000 $77,104 Sows $447 0 7,452 $150,000 $181,501
Total Sale Revenue $2,601 $1200 $1,056,049 Table A76 Pig Producers: Gross Sale Revenue as a percentage of Total Cost During Project 2008 & the last year before joining the project (USD)
During_Project Before_Project 186% 191%
Table A77 Pig Producers: Percentage with Gross Profit > $0 USD
During Project Before Project N=406 Profit>0 Profits<=0 Profit>0 Profits<=0
% of Producer with Gross profit 90% 10% 82% 18%
Table A78 Pig Producers: Household Labor Employment Pre-project (persons)
N=406 Mean Median Std. D Max Sum Females-Aged 15-24 yrs. 0.53 0.00 0.81 3.00 217 Females-Aged >=25 yrs. 0.99 1.00 0.58 6.00 402
Males-Aged 15-24 yrs. 0.58 0.00 0.92 5.00 235 Males-Aged >=25 yrs. 1.06 1.00 0.72 6.00 429
Total Labor employment 3.16 3.00 1,283

USAID-Funded Cambodia MSME Strengthening Project Final Monitoring And Evaluation Survey 2008 90
Table A79 Pig Producers: Hired Labor Employment Pre-project & During Project (persons)
Before the Project
During the project
Hire Labor Employment N % N % Full-time labor-female 0.00 0.00 1.00 3.03
Full-time labor-male 10.00 66.67 28.00 84.85 Casual labor-female 0.00 0.00 0.00 0.00
Casual labor-male 5.00 33.33 4.00 12.12 Total Labor 15.00 100.00 33.00 100.00
Table A80 Productivity Indicators Pig Mortality Pre-Project
Changes in Productivity-Mortality: N=392 Mean Median Std. D Max
Piglet Morality Rate % 15.5 10.0 22.0 100Feeder pig Morality Rate % 4.0 0.0 12.9 100Boar/Sow Morality Rate % 1.9 0.0 10.2 100
Total 21.4 Table A81 Productivity Indicators: Pig Mortality During Project 2008
Changes in Productivity-Mortality: During Project N=392 Mean Median Std. D Max
Piglet Morality Rate % 9.7 1.0 17.7 100 Feeder pig Morality Rate % 2.8 0 10.4 100 Boar/Sow Morality Rate % 1.1 0 8.6 100
Total 13.6 Table A82 Productivity Indicators: Pig Epidemics Pre-Project & During Project 2008
Increased mortality rate from Before the project during the project Incidence of Pig Epidemic N % N %
Yes 175 43 148 36 No 217 53 258 64
Total 392 100 406 100 Table A83 Productivity Indicators: Mean Feeder Pig Sale Weight kg. Pre-Project 2008
Mean Kg of Feeder at Sale Valid N=337 N % For Valid N
N/A 69 17% Mean 76
60-70 Kg 139 41% Median 75 71-80 Kg 123 37% St.Dv 12 81-90 Kg 53 16% Min 60
91-100 Kg 16 5% Max 150 >100 Kg 6 2% Sum 25714
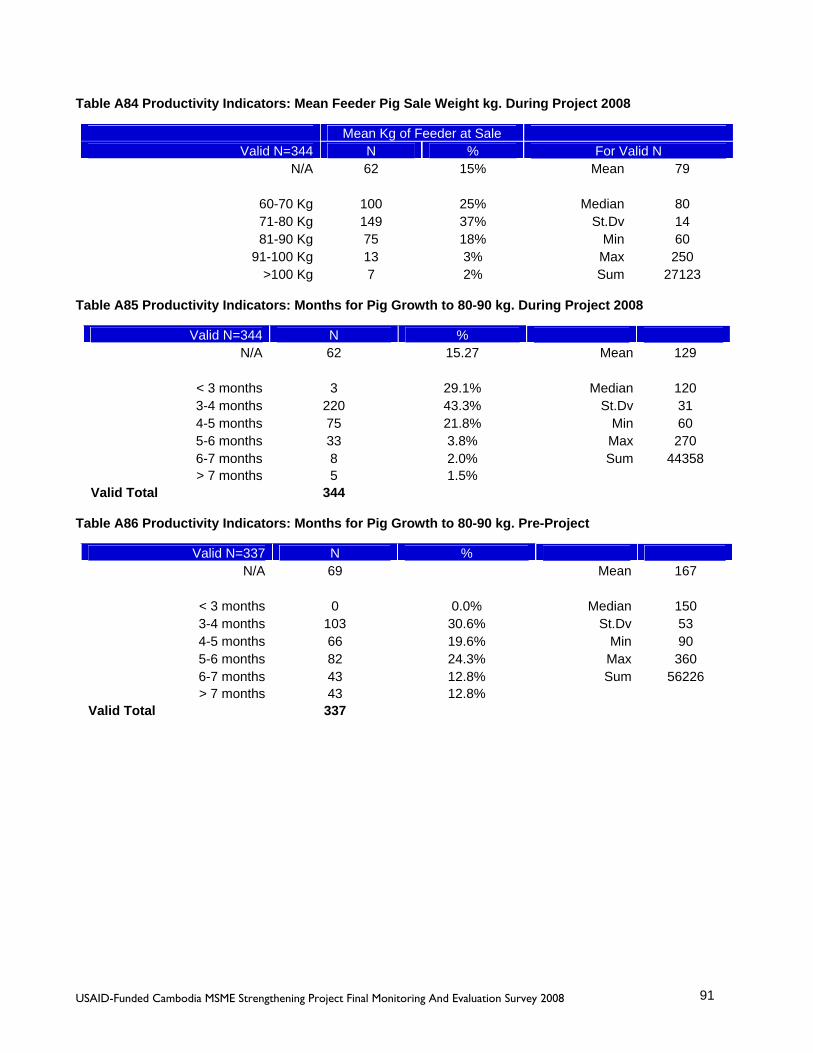
USAID-Funded Cambodia MSME Strengthening Project Final Monitoring And Evaluation Survey 2008 91
Table A84 Productivity Indicators: Mean Feeder Pig Sale Weight kg. During Project 2008
Mean Kg of Feeder at Sale Valid N=344 N % For Valid N
N/A 62 15% Mean 79
60-70 Kg 100 25% Median 80 71-80 Kg 149 37% St.Dv 14 81-90 Kg 75 18% Min 60
91-100 Kg 13 3% Max 250 >100 Kg 7 2% Sum 27123
Table A85 Productivity Indicators: Months for Pig Growth to 80-90 kg. During Project 2008
Valid N=344 N % N/A 62 15.27 Mean 129
< 3 months 3 29.1% Median 120 3-4 months 220 43.3% St.Dv 31 4-5 months 75 21.8% Min 60 5-6 months 33 3.8% Max 270 6-7 months 8 2.0% Sum 44358 > 7 months 5 1.5%
Valid Total 344 Table A86 Productivity Indicators: Months for Pig Growth to 80-90 kg. Pre-Project
Valid N=337 N % N/A 69 Mean 167
< 3 months 0 0.0% Median 150 3-4 months 103 30.6% St.Dv 53 4-5 months 66 19.6% Min 90 5-6 months 82 24.3% Max 360 6-7 months 43 12.8% Sum 56226 > 7 months 43 12.8%
Valid Total 337

USAID-Funded Cambodia MSME Strengthening Project Final Monitoring And Evaluation Survey 2008 92
Table A87 Pig Producers: Pig Enterprise as Percent of Total Household Income Pre-Project & 2008
Pig Production Enterprise as Pre-Project During Project % of Total HH Cash Income N=406 % %
N/A 2 0 <10% 6 5
10%-<20% 15 7 20%-<30% 22 16 30%-<40% 21 18 40%-<50% 18 23 50%-<60% 9 15 60%-<70% 4 9 70%-<80% 1 5 80%-<90% 1 1 90%-100% 0 1
Table A88 Pig Producers: Rated Importance of MSME Assistance for Broad Rural Poverty Alleviation
N=406 N % Not Important 0. 0
A little Important 11 3 Somewhat Important 45 11
Quite important 167 41 Very Important 183 45
Table A89 Pig Producers: MSME Impact on Extension of Years of Children’s Education
N=406 N % Yes 316 78 No 90 22
Total 406 100 Table A90 Pig Producers: MSME Impact Number of Children’s Education Years Extended
N=406 Girls Boys Mean 1.2 1.2
Median 1.0 1.0 St.Dv 0.9 1.0 Sum 372 370
Table A91 Pig Producers: Adoption Rates of Improved Accounting Practices
N=406 N % Yes 65 16 No 341 84
Total 406 100

USAID-Funded Cambodia MSME Strengthening Project Final Monitoring And Evaluation Survey 2008 93
Table A92 Pig Producers: Adoption Rates of Improved Accounting Practices due to MSME
N=65 N % Yes 40 62 No 25 38
Total 65 100 Table A93 Pig Producers: Percentage Joining Business Associations/groups since joining MSME
N=406 N % Yes 158 39 No 248 61
Total 406 100

USAID-Funded Cambodia MSME Strengthening Project Final Monitoring And Evaluation Survey 2008 94
PIG VALUE CHAIN- VETERINARIANS TABLES Table A94 Veterinarians: Number of Sample Enterprises and Owner Gender By Province
Total Gender N % Female % Male %
Kampong Cham 31 48% 4 13% 27 87% Kratie 6 9% 0 0% 6 100%
Prey Veng 17 27% 1 6% 16 94% Svay Rieng 10 16% 0 0% 10 100%
Total 64 100% 5 8% 59 92% Table A95 Veterinarians: Education Levels By Province
N % Primary Secondary TertiaryKampong Cham 31 48% 1 26 4
Kratie 6 9% 0 4 2 Prey Veng 17 27% 0 2 15
Svay Rieng 10 16% 0 10 0 Total 64 100% 1 42 21
Table A96 Veterinarians: Age & Enterprise Experience
Mean Median Std.DV Min Max
Age-Years 37.4 37.0 8.8 23.0 60.0 Veterinarian Experience-Years 6.9 6.0 6.0 0.0 30.0
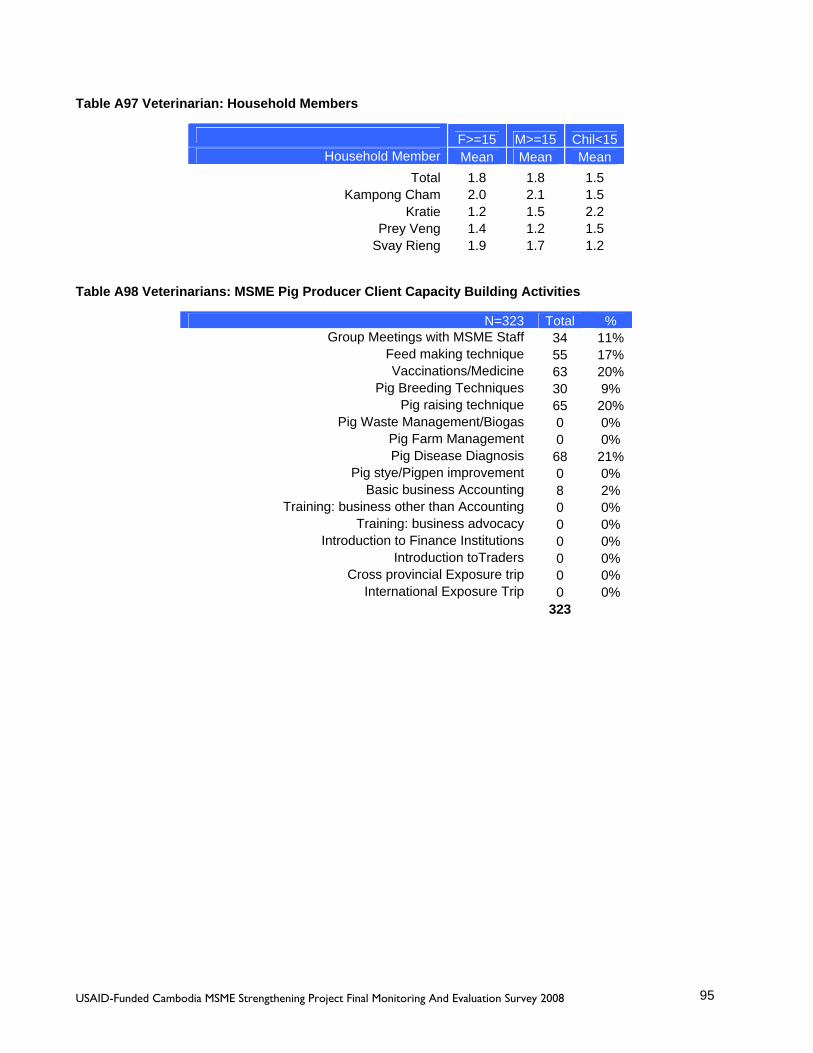
USAID-Funded Cambodia MSME Strengthening Project Final Monitoring And Evaluation Survey 2008 95
Table A97 Veterinarian: Household Members
F>=15 M>=15 Chil<15 Household Member Mean Mean Mean
Total 1.8 1.8 1.5 Kampong Cham 2.0 2.1 1.5
Kratie 1.2 1.5 2.2 Prey Veng 1.4 1.2 1.5
Svay Rieng 1.9 1.7 1.2 Table A98 Veterinarians: MSME Pig Producer Client Capacity Building Activities
N=323 Total % Group Meetings with MSME Staff 34 11%
Feed making technique 55 17% Vaccinations/Medicine 63 20%
Pig Breeding Techniques 30 9% Pig raising technique 65 20%
Pig Waste Management/Biogas 0 0% Pig Farm Management 0 0% Pig Disease Diagnosis 68 21%
Pig stye/Pigpen improvement 0 0% Basic business Accounting 8 2%
Training: business other than Accounting 0 0% Training: business advocacy 0 0%
Introduction to Finance Institutions 0 0% Introduction toTraders 0 0%
Cross provincial Exposure trip 0 0% International Exposure Trip 0 0%
323
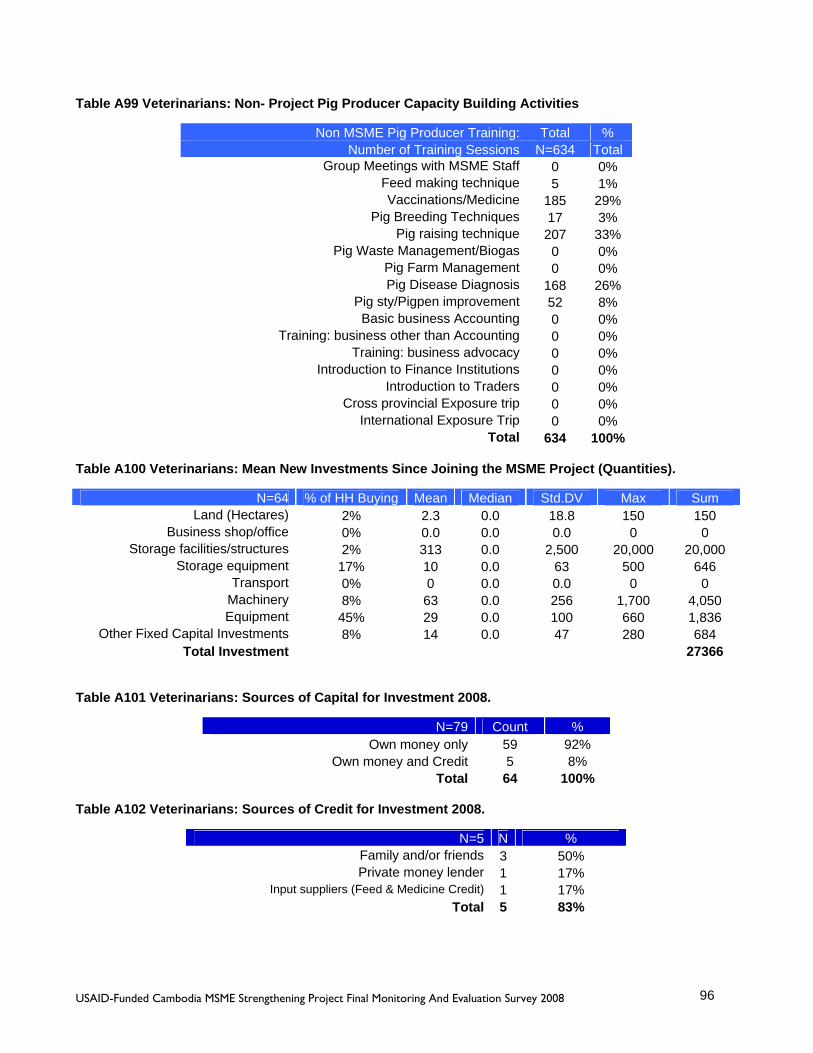
USAID-Funded Cambodia MSME Strengthening Project Final Monitoring And Evaluation Survey 2008 96
Table A99 Veterinarians: Non- Project Pig Producer Capacity Building Activities
Non MSME Pig Producer Training: Total % Number of Training Sessions N=634 Total
Group Meetings with MSME Staff 0 0% Feed making technique 5 1% Vaccinations/Medicine 185 29%
Pig Breeding Techniques 17 3% Pig raising technique 207 33%
Pig Waste Management/Biogas 0 0% Pig Farm Management 0 0% Pig Disease Diagnosis 168 26%
Pig sty/Pigpen improvement 52 8% Basic business Accounting 0 0%
Training: business other than Accounting 0 0% Training: business advocacy 0 0%
Introduction to Finance Institutions 0 0% Introduction to Traders 0 0%
Cross provincial Exposure trip 0 0% International Exposure Trip 0 0%
Total 634 100% Table A100 Veterinarians: Mean New Investments Since Joining the MSME Project (Quantities).
N=64 % of HH Buying Mean Median Std.DV Max Sum Land (Hectares) 2% 2.3 0.0 18.8 150 150
Business shop/office 0% 0.0 0.0 0.0 0 0 Storage facilities/structures 2% 313 0.0 2,500 20,000 20,000
Storage equipment 17% 10 0.0 63 500 646 Transport 0% 0 0.0 0.0 0 0
Machinery 8% 63 0.0 256 1,700 4,050 Equipment 45% 29 0.0 100 660 1,836
Other Fixed Capital Investments 8% 14 0.0 47 280 684 Total Investment 27366
Table A101 Veterinarians: Sources of Capital for Investment 2008.
N=79 Count % Own money only 59 92%
Own money and Credit 5 8% Total 64 100%
Table A102 Veterinarians: Sources of Credit for Investment 2008.
N=5 N % Family and/or friends 3 50% Private money lender 1 17%
Input suppliers (Feed & Medicine Credit) 1 17% Total 5 83%

USAID-Funded Cambodia MSME Strengthening Project Final Monitoring And Evaluation Survey 2008 97
Table A103 Veterinarians: Credit Loan Amounts 2008 (USD).
N=5 Mean Median St.Dv Min Max Sum Family and/or friends 237 200 220 30 520 950 Private money lender 300 300 300 300 300
Input suppliers (Feed & Medicine Credit) 25,125 25,125 35,179 250 50,000 50,250 Table A104 Veterinarians: Proportion with Sale of Goods & Services on Credit 2008.
N=64 N % Yes 49 77% No 15 23%
Total 64 100% Table A105 Veterinarians: Types of Clients with Good & Services on Credit 2008.
N=49 N % Input supplier 2 4%
Producer 46 94% Trader 1 2%
Service provider 2 4% Table A106 Veterinarians: Credit Amounts for Good & Services by Client Type 2008 (USD).
N=49 Mean Median St.Dv Max Sum Input supplier 21 0 143 1000 1015
Producer 162 75 430 3000 7934 Trader 1 0 7 50 50
Service provide 5 0 29 20 250 Overall Credit 189 80 9250
Table A107 Veterinarians: Proportion with Cash Loan Credit to Clients 2008.
N=64 N % Yes 7 11% No 57 89%
Total 64 100% Table A108 Veterinarians: Types of Clients with Cash Loan Credit 2008.
N=7 N % Producer 5 71%
Trader 1 14% Service provider 1 14%
Table A109 Veterinarians: Cash Loan Credit Amounts By Type of Client 2008 (USD).
N=63 Mean Median St.Dv Max Sum Producer 86 100.0 86 250 600
Trader 8.6 0.0 23 60 60 Service provider 14 0.0 38 100 100
Total 109 760
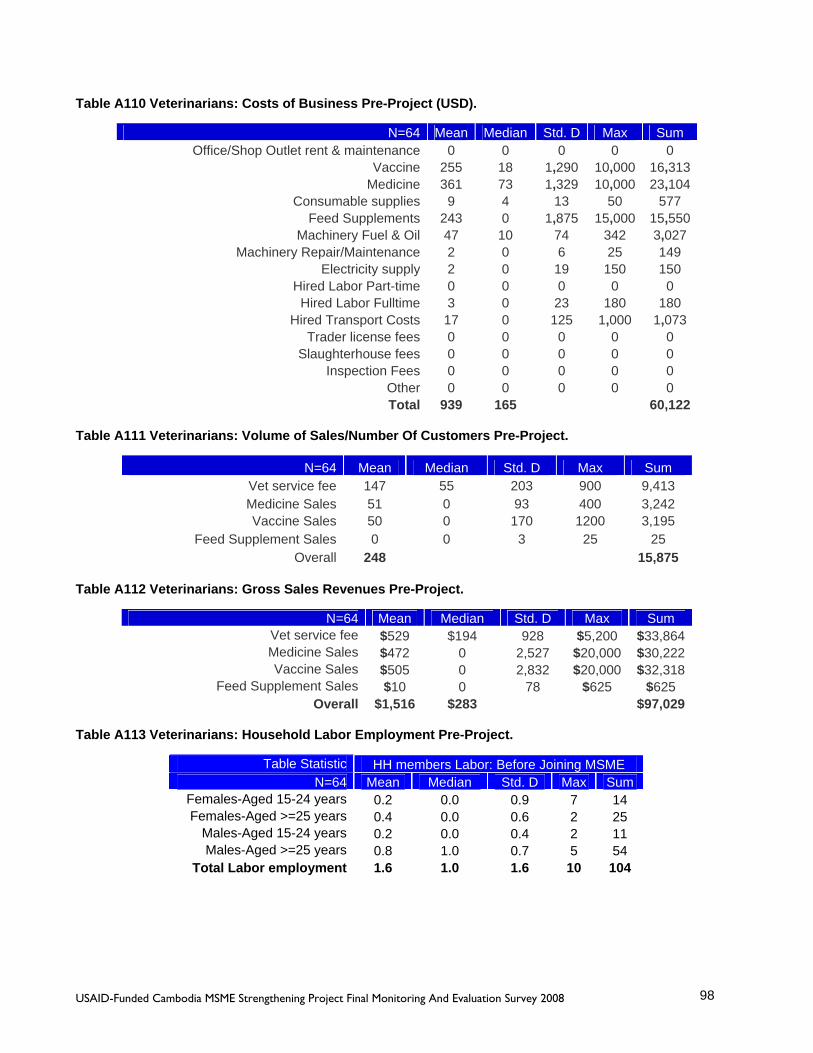
USAID-Funded Cambodia MSME Strengthening Project Final Monitoring And Evaluation Survey 2008 98
Table A110 Veterinarians: Costs of Business Pre-Project (USD).
N=64 Mean Median Std. D Max Sum Office/Shop Outlet rent & maintenance 0 0 0 0 0
Vaccine 255 18 1,290 10,000 16,313Medicine 361 73 1,329 10,000 23,104
Consumable supplies 9 4 13 50 577 Feed Supplements 243 0 1,875 15,000 15,550
Machinery Fuel & Oil 47 10 74 342 3,027 Machinery Repair/Maintenance 2 0 6 25 149
Electricity supply 2 0 19 150 150 Hired Labor Part-time 0 0 0 0 0
Hired Labor Fulltime 3 0 23 180 180 Hired Transport Costs 17 0 125 1,000 1,073
Trader license fees 0 0 0 0 0 Slaughterhouse fees 0 0 0 0 0
Inspection Fees 0 0 0 0 0 Other 0 0 0 0 0 Total 939 165 60,122
Table A111 Veterinarians: Volume of Sales/Number Of Customers Pre-Project.
N=64 Mean Median Std. D Max Sum Vet service fee 147 55 203 900 9,413 Medicine Sales 51 0 93 400 3,242 Vaccine Sales 50 0 170 1200 3,195
Feed Supplement Sales 0 0 3 25 25 Overall 248 15,875
Table A112 Veterinarians: Gross Sales Revenues Pre-Project.
N=64 Mean Median Std. D Max Sum Vet service fee $529 $194 928 $5,200 $33,864 Medicine Sales $472 0 2,527 $20,000 $30,222 Vaccine Sales $505 0 2,832 $20,000 $32,318
Feed Supplement Sales $10 0 78 $625 $625 Overall $1,516 $283 $97,029
Table A113 Veterinarians: Household Labor Employment Pre-Project.
Table Statistic HH members Labor: Before Joining MSME N=64 Mean Median Std. D Max Sum
Females-Aged 15-24 years 0.2 0.0 0.9 7 14 Females-Aged >=25 years 0.4 0.0 0.6 2 25
Males-Aged 15-24 years 0.2 0.0 0.4 2 11 Males-Aged >=25 years 0.8 1.0 0.7 5 54
Total Labor employment 1.6 1.0 1.6 10 104
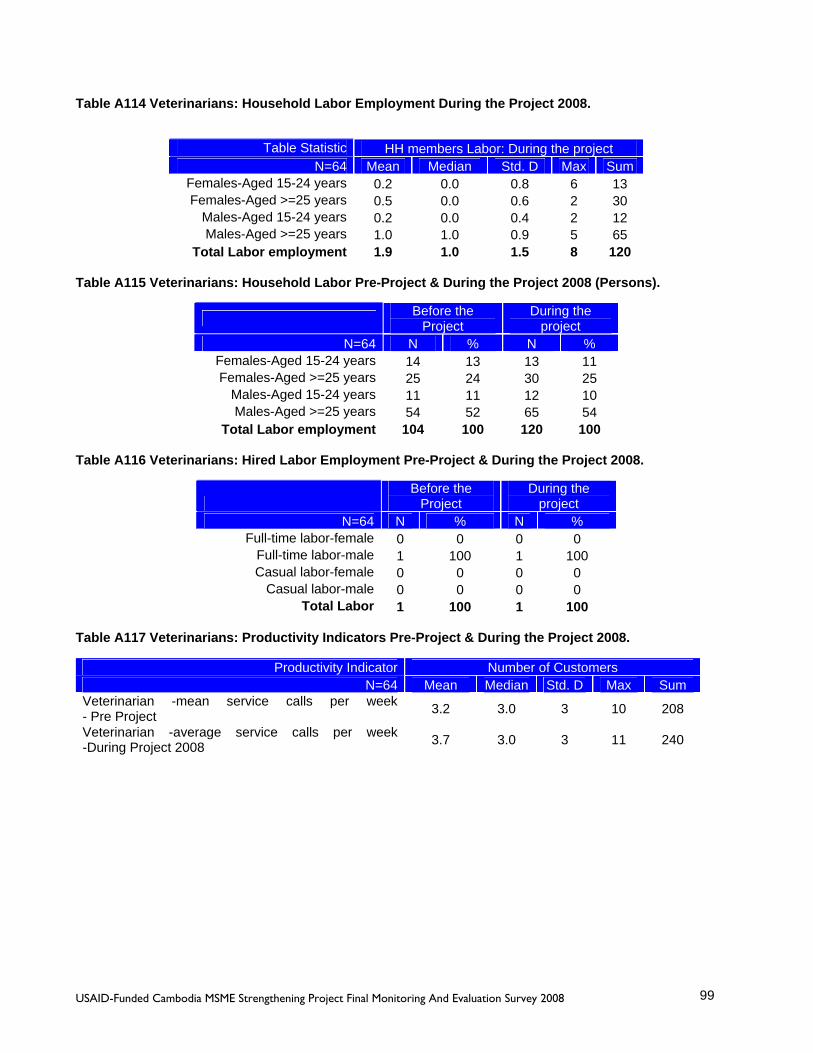
USAID-Funded Cambodia MSME Strengthening Project Final Monitoring And Evaluation Survey 2008 99
Table A114 Veterinarians: Household Labor Employment During the Project 2008.
Table Statistic HH members Labor: During the project
N=64 Mean Median Std. D Max Sum Females-Aged 15-24 years 0.2 0.0 0.8 6 13 Females-Aged >=25 years 0.5 0.0 0.6 2 30
Males-Aged 15-24 years 0.2 0.0 0.4 2 12 Males-Aged >=25 years 1.0 1.0 0.9 5 65
Total Labor employment 1.9 1.0 1.5 8 120 Table A115 Veterinarians: Household Labor Pre-Project & During the Project 2008 (Persons).
Before the Project
During the project
N=64 N % N % Females-Aged 15-24 years 14 13 13 11 Females-Aged >=25 years 25 24 30 25
Males-Aged 15-24 years 11 11 12 10 Males-Aged >=25 years 54 52 65 54
Total Labor employment 104 100 120 100 Table A116 Veterinarians: Hired Labor Employment Pre-Project & During the Project 2008.
Before the Project
During the project
N=64 N % N % Full-time labor-female 0 0 0 0
Full-time labor-male 1 100 1 100 Casual labor-female 0 0 0 0
Casual labor-male 0 0 0 0 Total Labor 1 100 1 100
Table A117 Veterinarians: Productivity Indicators Pre-Project & During the Project 2008.
Productivity Indicator Number of Customers N=64 Mean Median Std. D Max Sum
Veterinarian -mean service calls per week- Pre Project 3.2 3.0 3 10 208
Veterinarian -average service calls per week-During Project 2008 3.7 3.0 3 11 240

USAID-Funded Cambodia MSME Strengthening Project Final Monitoring And Evaluation Survey 2008 100
Table A118 Veterinarians: Vet. Enterprise as Percent of Total Household Income Pre-Project & 2008
Veterinarian Enterprise as Pre-Project During Project
% of Total HH Cash Income N=64 % %
N/A 9% 0 <10% 11% 15%
10%-<20% 24% 13% 20%-<30% 13% 20% 30%-<40% 9% 15% 40%-<50% 10% 9% 50%-<60% 3% 4% 60%-<70% 3% 4% 70%-<80% 0% 1% 80%-<90% 0% 0% 90%-100% 0% 0%
Table A119 Veterinarians: Rated Importance of MSME Assistance for Broad Rural Poverty Alleviation
Veterinarians: Importance of the
project Important of the
project To Poverty Alleviation N=64 N %
Not Important 0 0% A little Important 2 3%
Somewhat Important 7 11% Quite important 32 50% Very Important 23 36%
Table A120 Veterinarians: MSME Impact on Extension of Years of Children’s Education
N=64 N % Yes 38 59% No 26 41%
Total 64 100% Table A121 Veterinarians: MSME Impact Number of Children’s Education Years Extended
Years Ed. Extended N=64 Girls Boys Mean 1.1 0.9
Median 1.0 1.0 St.Dv 1.0 0.9 Sum 40 33

USAID-Funded Cambodia MSME Strengthening Project Final Monitoring And Evaluation Survey 2008 101
9.3. PIG VALUE CHAIN- PIG INPUT SUPPLIERS TABLES
Table A122 Input Suppliers: Number of Sample Enterprises & Owner Gender by Province
Total Gender N % Female % Male %
Kampong Cham 8 53% 0 0% 8 53% Kratie 2 13% 0 0% 2 13%
Prey Veng 2 13% 0 0% 2 13% Svay Rieng 3 20% 0 0% 3 20%
15 100% 0 0% 15 100% Table A123 Input Suppliers: Education Level by Province
Total Education Level N % Primary Secondary Tertiary
Kampong Cham 8 53% 0 2 6 Kratie 2 13% 0 1 1
Prey Veng 2 13% 0 0 2 Svay Rieng 3 20% 1 2 0
Total 15 100% 1 5 9 Table A124 Input Suppliers: Age & Enterprise Experience
Mean Median Std.DV Min Max
Age-Years 38.5 38.0 11.8 23.0 58.0Experience as an Input Provider-Years 5.7 5.0 4.4 0.0 15.0
Table A125 Input Suppliers: Household Members
F>=15 M>=15 Chil<15 Household members Mean Mean Mean
Total 1.7 2.0 1.3 Kampong Cham 1.6 2.0 1.0
Kratie 1.0 1.5 2.5 Prey Veng 2.5 2.5 1.5
Svay Rieng 1.7 2.0 1.0
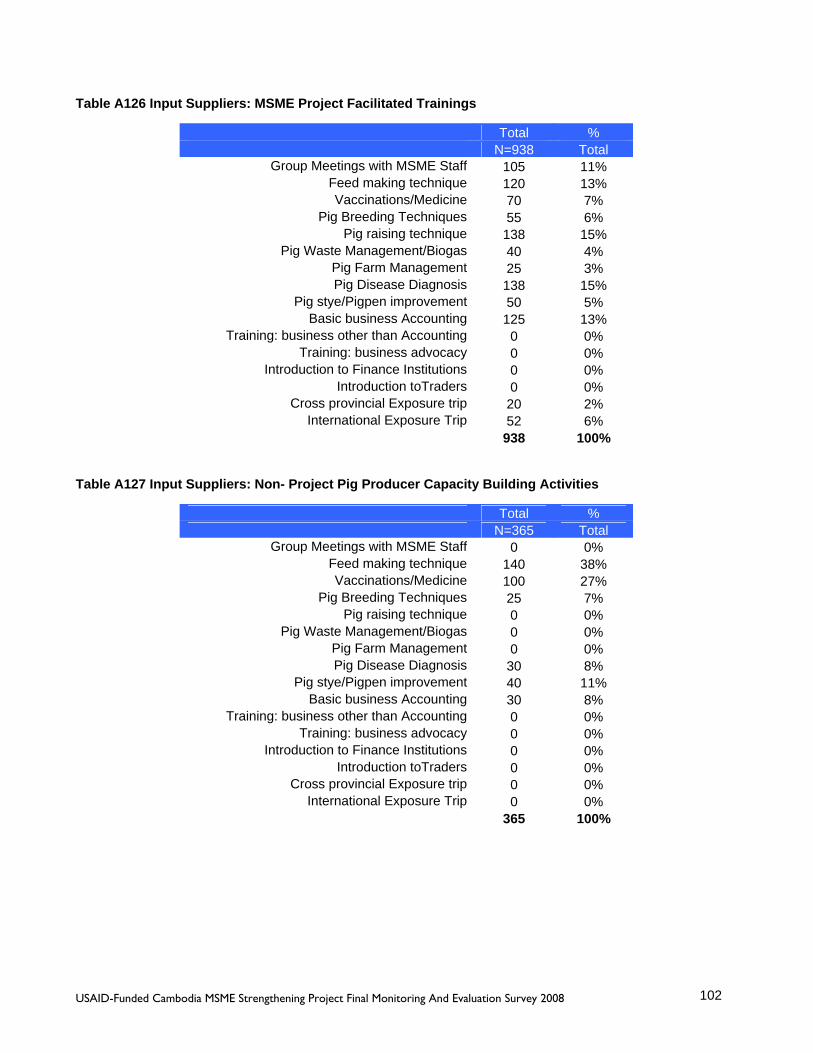
USAID-Funded Cambodia MSME Strengthening Project Final Monitoring And Evaluation Survey 2008 102
Table A126 Input Suppliers: MSME Project Facilitated Trainings
Total % N=938 Total
Group Meetings with MSME Staff 105 11% Feed making technique 120 13% Vaccinations/Medicine 70 7%
Pig Breeding Techniques 55 6% Pig raising technique 138 15%
Pig Waste Management/Biogas 40 4% Pig Farm Management 25 3% Pig Disease Diagnosis 138 15%
Pig stye/Pigpen improvement 50 5% Basic business Accounting 125 13%
Training: business other than Accounting 0 0% Training: business advocacy 0 0%
Introduction to Finance Institutions 0 0% Introduction toTraders 0 0%
Cross provincial Exposure trip 20 2% International Exposure Trip 52 6%
938 100% Table A127 Input Suppliers: Non- Project Pig Producer Capacity Building Activities
Total % N=365 Total
Group Meetings with MSME Staff 0 0% Feed making technique 140 38% Vaccinations/Medicine 100 27%
Pig Breeding Techniques 25 7% Pig raising technique 0 0%
Pig Waste Management/Biogas 0 0% Pig Farm Management 0 0% Pig Disease Diagnosis 30 8%
Pig stye/Pigpen improvement 40 11% Basic business Accounting 30 8%
Training: business other than Accounting 0 0% Training: business advocacy 0 0%
Introduction to Finance Institutions 0 0% Introduction toTraders 0 0%
Cross provincial Exposure trip 0 0% International Exposure Trip 0 0%
365 100%

USAID-Funded Cambodia MSME Strengthening Project Final Monitoring And Evaluation Survey 2008 103
Table A128 Input Suppliers: Mean New Investments Since Joining the MSME Project (Quantities).
N=15 % of HH Buying Mean Median Std.DV Max Sum
Land (Hectares) 7% $67 $0 $258 $1,000 $1,000 Business shop/office 20% $187 $0 $522 $2,000 $2,800
Storage facilities/structures 27% $3,850 $0 $10,383 $40,000 $57,750Storage equipment 20% $45 $0 $130 $500 $670
Transport 13% $37 $0 $97 $300 $550 Machinery 7% $33 $0 $129 $500 $500 Equipment 20% $14 $0 $36 $105 $209
Other Fixed Capital Investments 0% $0 $0 $0 $0 $0 Total Investment 53% $4,232 $4 $63,479
Table A129 Input Suppliers: Costs of Business Pre-Project (USD).
Cost of Business N=15 Mean Median Std. D Max Sum
Ofiice/Shop Outlet rent & maintenance $87 $0 $229 $700 $1,300 Vaccine $1,662 $225 $2,660 $9,200 $24,925
Medicine $5,265 $2,000 $11,347 $45,000 $78,975 Consumable supplies $934 $100 $1,918 $7,200 $14,010
Feed Supplements $61,099 $20,000 $98,290 $330,000 $916,490 Machinery Fuel & Oil $504 $0 $1,936 $7,500 $7,556
Machinery Repair/Maintenance $122 $0 $464 $1,800 $1,830 Electricity supply $269 $40 $509 $1,800 $4,030
Hired Labor Part-time $106 $0 $207 $650 $1,590 Hired Labor Fulltime $246 $0 $426 $1,500 $3,685
Hired Transport Costs $204 $0 $521 $2,000 $3,060 Trader license fees $0 $0 $0 $0 $0
Slaughterhouse fees $0 $0 $0 $0 $0 Inspection Fees $0 $0 $0 $0 $0
Other $0 $0 $0 $0 $0 Total $70,497 $23,350 $1,057,451
Table A130 Input Suppliers: Sources of Capital for Investment 2008.
MSME Credit N=15 Count %
Own money only 14 93% Own money and borrow 1 7%
Total 15 100% Table A131 Input Suppliers: Sources of Credit for Investment 2008.
N=1 N % $ Input suppliers (Feed & Medicine Credit) 1 100% 50,000
Total 1 100%

USAID-Funded Cambodia MSME Strengthening Project Final Monitoring And Evaluation Survey 2008 104
Table A132 Input Suppliers: Proportion with Sale of Goods & Services on Credit 2008.
Clients on Credit N=15 N %
Yes 14 93% No 1 7%
Total 15 100% Table A133 Input Suppliers: Types of Clients with Good & Services on Credit 2008.
Type of clients on credit N=14 N %
Input supplier 6 43% Producer 12 86%
Service provider 2 14% Table A134 Input Suppliers: Credit Amounts for Good & Services by Client Type 2008 (USD).
N=14 Mean Median St.Dv Max Sum
Input supplier $974 $0 $2,607 $10,000 $14,613 Producer $1,586 $250 $2,688 $10,000 $23,784
Service provide $217 $0 $589 $2,000 $3,250 Overall Credit $2,776 $750 $41,646
Table A135 Input Suppliers: Costs of Business Pre-Project (USD).
Input Suppliers Cost of Business before project N=15 Mean Median Std. D Max Sum
Ofiice/Shop Outlet rent & maintenance $87 $0 $229 $700 $1,300 Vaccine $1,662 $225 $2,660 $9,200 $24,925
Medicine $5,265 $2,000 $11,347 $45,000 $78,975 Consumable supplies $934 $100 $1,918 $7,200 $14,010
Feed Supplements $61,099 $20,000 $98,290 $330,000 $916,490 Machinery Fuel & Oil $504 $0 $1,936 $7,500 $7,556
Machinery Repair/Maintenance $122 $0 $464 $1,800 $1,830 Electricity supply $269 $40 $509 $1,800 $4,030
Hired Labor Part-time $106 $0 $207 $650 $1,590 Hired Labor Fulltime $246 $0 $426 $1,500 $3,685
Hired Transport Costs $204 $0 $521 $2,000 $3,060 Trader license fees $0 $0 $0 $0 $0
Slaughterhouse fees $0 $0 $0 $0 $0 Inspection Fees $0 $0 $0 $0 $0
Other $0 $0 $0 $0 $0 Total $70,497 $23,350 $100,927 $342,150 $1,057,451

USAID-Funded Cambodia MSME Strengthening Project Final Monitoring And Evaluation Survey 2008 105
Table A136 Input Suppliers: Volume of Sales/Number Of Customers Pre-Project.
Number of customers before project N=15 Mean Median Std. D Max Sum
Medicine Sales 327 150 583 2000 4910 Vaccine Sales 298 100 756 3000 4470
Feed Supplement Sales 475 100 882 3200 7120 Other Specify 0 0 0 0 0
Overall 1100 350 16500 Table A137 Input Suppliers: Volume of Sales/Number Of Customers 2008
Number of customers N=15 Mean Median Std. D Max Sum
Medicine Sales 334 195 517 2100 5015 Vaccine Sales 509 180 1252 5000 7640
Feed Supplement Sales 1020 300 1602 5400 15295 Other Specify 0 0 0 0 0
Overall 1863 865 27950 Table A138 Input Suppliers: Gross Sales Revenues Pre-Project.
Total Revenue before project N=15 Mean Median Std. D Max Sum
Medicine Sales $12,718 $2,250 $38,130 $150,000 $190,770 Vaccine Sales $2,425 $125 $4,140 $15,000 $36,375
Feed Supplement Sales $119,007 $24,250 $213,989 $800,000 $1,785,100 Other Specify $0 $0 $0 $0 $0
Overall $134,150 $35,500 $2,012,245 Table A139 Input Suppliers: Percentage with Gross Profit > $0 USD
During Project Before Project N=15 Profit>0 Profits<=0 Profit>0 Profits<=0
% of enterprises with gross profit 100% 0% 73% 27% Table A140 Input Suppliers: Household Labor Employment Pre-Project
N=15 Mean Median Std. D Max Sum Females-Aged 15-24 years 0.40 0.00 0.63 2.00 6.00 Females-Aged >=25 years 0.87 1.00 0.64 2.00 13.00
Males-Aged 15-24 years 0.40 0.00 0.74 2.00 6.00 Males-Aged >=25 years 0.80 1.00 0.56 2.00 12.00
Total Labor employment 2.47 3.00 1.41 5.00 37.00

USAID-Funded Cambodia MSME Strengthening Project Final Monitoring And Evaluation Survey 2008 106
Table A141 Input Suppliers: Household Labor Employment During the Project 2008.
Before the Project
During the project
N=15 N % N % Females-Aged 15-24 years 6 16 8 20 Females-Aged >=25 years 13 35 13 32
Males-Aged 15-24 years 6 16 6 15 Males-Aged >=25 years 12 32 14 34
Total Labor employment 37 100 41 100 Table A142 Input Suppliers: Household Labor Pre-Project & During the Project 2008 (Persons).
HH members Labor: During the project N=15 Mean Median Std. D Max Sum
Females-Aged 15-24 years 0.5 0.00 0.83 3.00 8.00 Females-Aged >=25 years 0.9 1.00 0.64 2.00 13.00
Males-Aged 15-24 years 0.40 0.00 0.63 2.00 6.00 Males-Aged >=25 years 0.93 1.00 0.59 2.00 14.00
Total Labor employment 2.73 3.00 1.16 5.00 41.00 Table A143 Input Suppliers: Hired Labor Employment Pre-Project & During the Project 2008.
Before the Project
During the project
N=15 N % N % Full-time labor-female 1 6 1 5
Full-time labor-male 6 33 6 27 Casual labor-female 0 0 3 14
Casual labor-male 11 61 12 55 Total Labor 18 100 22 100
Table A144 Input Suppliers: Hired Labor Daily Pay Rates During the Project 2008.
Daily Rate of Workers: During the Project (riel) N=15 Mean Median Std. D Max Sum
Full-time labor-female 8000 8000 0 8000 8000
Full-time labor-male 6000 6000 1826 8000 24000 Casual labor-female 12000 12000 0 12000 12000
Casual labor-male 10250 11000 4646 15000 41000 Table A145 Input Suppliers: Hired Labor Daily Pay Rates Pre-Project 2008.
Input Suppliers Daily Rate of Workers: Before Joining MSME (riel) N=15 Mean Median Std. D Max Sum
Full-time labor-female 8000 8000 0 8000 8000
Full-time labor-male 6000 6000 1825 8000 24000 Casual labor-female 0 0 0 0 0
Casual labor-male 8000 9000

USAID-Funded Cambodia MSME Strengthening Project Final Monitoring And Evaluation Survey 2008 107
Table A146 Input Suppliers: Productivity Indicators Pre-Project & During the Project 2008.
Productivity Indicator: During the Project N=15 Mean Median Std. D Max Sum
Input Suppliers-average customers/ week - Pre Project 40 35 34 125 602 Input Suppliers-average customers/ week -During Project 2008 73 62 57 200 1,093
Table A147 Input Suppliers: Enterprise as Percent of Total Household Income Pre-Project & 2008
Pre-Project During Project % of Total HH Cash Income
N=64 % % 10%-<20% 8% 7% 20%-<30% 8% 0% 30%-<40% 8% 13% 40%-<50% 23% 13% 50%-<60% 15% 20% 60%-<70% 8% 0% 70%-<80% 8% 20% 80%-<90% 15% 13% 90%-100% 8% 13%
100% 100% Table A148 Input Suppliers: Rated Importance of MSME Assistance for Broad Rural Poverty Alleviation
N=15 N % Not Important 0 0%
A little Important 0 0% Somewhat Important 0 0%
Quite important 9 60% Very Important 6 40%
Table A149 Input Suppliers: MSME Impact on Extension of Years of Children’s Education
Extended Education? N=15 N %
Yes 14 93% No 1 7%
Total 15 100% Table A150 Input Suppliers: MSME Impact Number of Children’s Education Years Extended
Benefits to Children N=15 Girls Boys Mean 1.1 0.9
Median 1.0 1.0 St.Dv 0.7 0.8
Min 0.0 0.0 Max 2.0 2.0 Sum 15 12

USAID-Funded Cambodia MSME Strengthening Project Final Monitoring And Evaluation Survey 2008 108
9.4. FISH VALUE CHAIN-FISH PRODUCERS TABLES
Table A151 Fish Producers: MSME Project Facilitated Trainings
Total % K.cham P.Veng Items N=606 Total N=289 N=317
Group Meetings with MSME Staff 47 84% 71% 94% Fish Feed making technique 36 64% 63% 66%
Fish Health Management 40 71% 92% 56% Fish Medicine used 35 63% 96% 38%
Fish raising technique 54 96% 100% 94% Pond Selection 40 71% 63% 78%
Pond Construction 45 80% 92% 72% Pond Preparation 49 88% 88% 88% Stocking Density 39 70% 75% 66%
Pond Water Quality 38 68% 75% 63% Fish Feeding Techniques 40 71% 92% 56% Fish Harvest Techniques 30 54% 67% 44%
Basic business Accounting 24 43% 50% 38% Training: business other than Accounting 7 13% 29% 0%
Training: business advocacy 18 32% 38% 28% Introduction to Finance Institutions 19 34% 33% 34%
Introduction to Traders 29 52% 50% 53% Cross provincial Exposure trip 15 27% 29% 25%
International Exposure Trip 1 2% 4% 0% Total 606
Table A152 Fish Producers: MSME Project Facilitated Trainings Gender Balance
Table Frequency MSME Capacity Building Gender Balance N=606 N=606 % Female % Male
Group Meetings with MSME Staff 47 23% 77% Fish Feed making technique 36 28% 72%
Fish Health Management 40 23% 78% Fish Medicine used 35 26% 74%
Fish raising technique 54 24% 76% Pond Selection 40 25% 75%
Pond Construction 45 24% 76% Pond Preparation 49 22% 78% Stocking Density 39 31% 69%
Pond Water Quality 38 24% 76% Fish Feeding Techniques 40 33% 68% Fish Harvest Techniques 30 30% 70%
Basic business Accounting 24 33% 67% Training: business other than Accounting 7 43% 57%
Training: business advocacy 18 22% 78% Introduction to Finance Institutions 19 32% 68%
Introduction to Traders 29 24% 76% Cross provincial Exposure trip 15 53% 47%
International Exposure Trip 1 100% 0% Total 606 27% 73%

USAID-Funded Cambodia MSME Strengthening Project Final Monitoring And Evaluation Survey 2008 109
Table A153 Fish Producers: Fixed Capital Investments since joining the Project by Type
N=56 % of HH Buying Mean
$ Median Std.DV Max Sum Land (Hectares) 14% 592 0 2,686 18,000 33,175
Fish Pond Excavation- cubic m. 37% 434 0 1,566 10,500 24,309 Cement Tank 4% 10 0 67 500 543
Cooking Pan & Cooker 18% 57 0 167 900 3,210 Feed making machine (number) 14% 54 0 158 700 3,025
Water pump (number) 11% 18 0 65 320 1,010 Tilapia brood stock-Kg. 14% 3 0 13 88 187
Carp Fish brood stock-Head 12% 4 0 21 150 236 Other Fixed Capital Investments 56% 96 20 254 1,350 5,369
Total 1269 94 Table 154 Fish Producers: Gross Sales Revenue Pre-Project (USD) Total & By Province
N=56 Mean Median Std. D Max Sum Mature Fish ( Sale to Market) 905 239 1,749 7,800 50,694
Fingerling (Sale to Market) 20 0 150 1,125 1,125 Overall Sale Revenue 973 331 1,738 7,833 54,509
Mature Fish (consume in family) 48 19 82 338 2,690
Table A155 Fish Producers: Household Labor Employment Pre-Project (persons)
N=56 Mean Median Std. D Max Sum Females-Aged 15-24
years 0.57 0.00 0.87 3.00 32.00 Females-Aged >=25
years 1.14 1.00 0.52 2.00 64.00 Males-Aged 15-24 years 0.45 0.00 0.78 3.00 25.00 Males-Aged >=25 years 1.07 1.00 0.76 5.00 60.00
Total Labor employment 3.23 3.00 1.95 10.00 181.00
Table A156 Fish Producers: Hired Labor Employment During Project 2008 (persons)
N=56 Mean Median Std. D Max Sum Full-time labor-female 0.00 0.00 0.00 0.00 0.00
Full-time labor-male 0.02 0.00 0.13 1.00 1.00 Casual labor-female 0.00 0.00 0.00 0.00 0.00
Casual labor-male 0.13 0.00 0.51 3.00 7.00 Table A157 Fish Producers: Hired Labor Employment Pre-Project 2008 (persons)
N=56 Mean Median Std. D Max Sum Full-time labor-female 0.00 0.00 0.00 0.00 0.00
Full-time labor-male 0.02 0.00 0.13 1.00 1.00 Casual labor-female 0.00 0.00 0.00 0.00 0.00
Casual labor-male 0.05 0.00 0.23 1.00 3.00
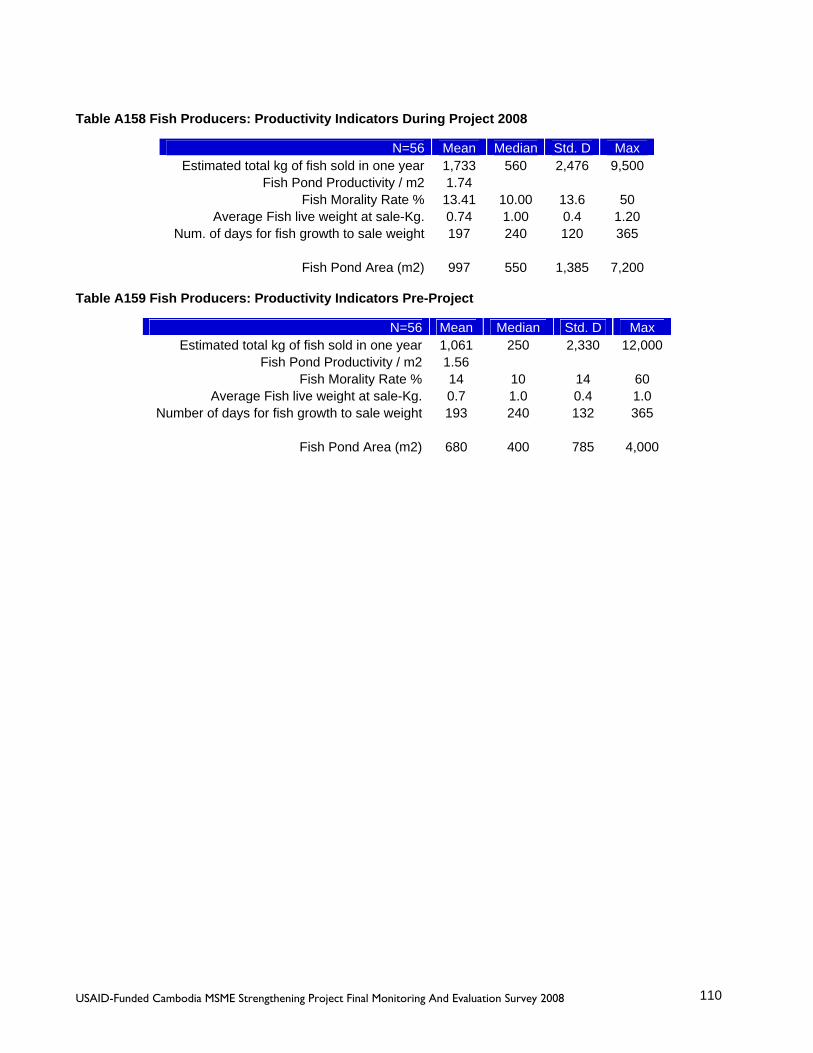
USAID-Funded Cambodia MSME Strengthening Project Final Monitoring And Evaluation Survey 2008 110
Table A158 Fish Producers: Productivity Indicators During Project 2008
N=56 Mean Median Std. D Max Estimated total kg of fish sold in one year 1,733 560 2,476 9,500
Fish Pond Productivity / m2 1.74 Fish Morality Rate % 13.41 10.00 13.6 50
Average Fish live weight at sale-Kg. 0.74 1.00 0.4 1.20 Num. of days for fish growth to sale weight 197 240 120 365
Fish Pond Area (m2) 997 550 1,385 7,200
Table A159 Fish Producers: Productivity Indicators Pre-Project
N=56 Mean Median Std. D Max Estimated total kg of fish sold in one year 1,061 250 2,330 12,000
Fish Pond Productivity / m2 1.56 Fish Morality Rate % 14 10 14 60
Average Fish live weight at sale-Kg. 0.7 1.0 0.4 1.0 Number of days for fish growth to sale weight 193 240 132 365
Fish Pond Area (m2) 680 400 785 4,000
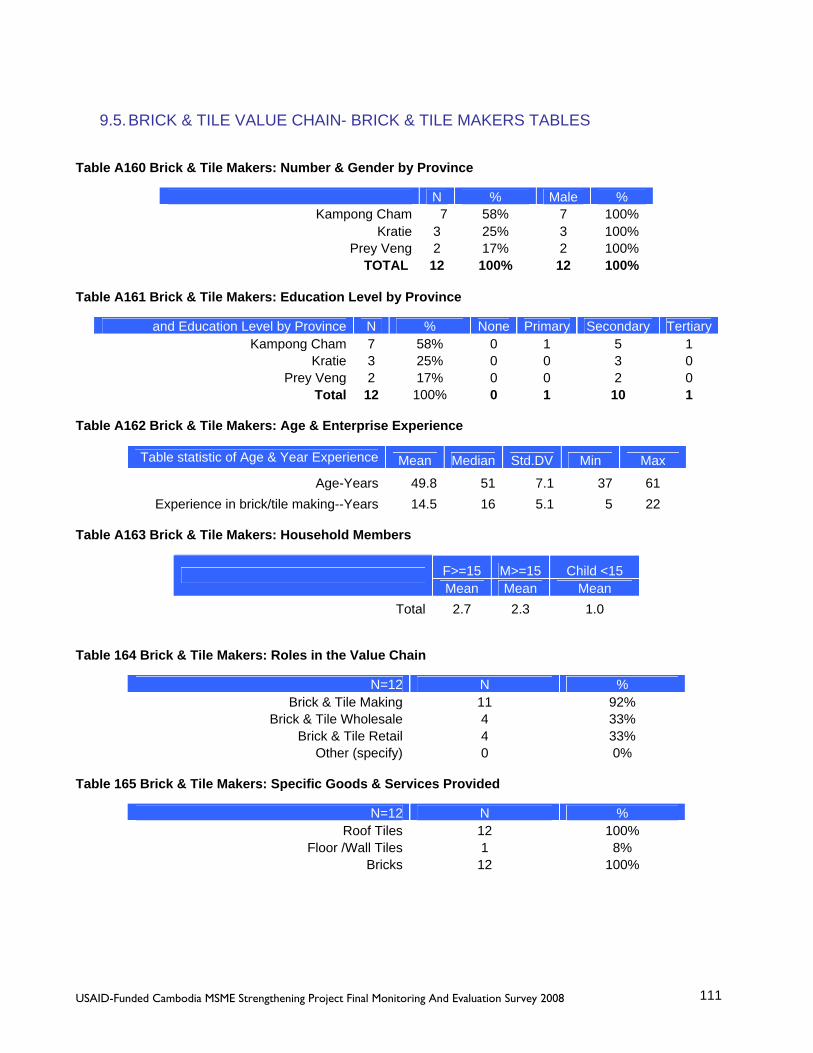
USAID-Funded Cambodia MSME Strengthening Project Final Monitoring And Evaluation Survey 2008 111
9.5. BRICK & TILE VALUE CHAIN- BRICK & TILE MAKERS TABLES
Table A160 Brick & Tile Makers: Number & Gender by Province
N % Male % Kampong Cham 7 58% 7 100%
Kratie 3 25% 3 100% Prey Veng 2 17% 2 100%
TOTAL 12 100% 12 100% Table A161 Brick & Tile Makers: Education Level by Province
and Education Level by Province N % None Primary Secondary TertiaryKampong Cham 7 58% 0 1 5 1
Kratie 3 25% 0 0 3 0 Prey Veng 2 17% 0 0 2 0
Total 12 100% 0 1 10 1 Table A162 Brick & Tile Makers: Age & Enterprise Experience
Table statistic of Age & Year Experience Mean Median Std.DV Min Max
Age-Years 49.8 51 7.1 37 61 Experience in brick/tile making--Years 14.5 16 5.1 5 22
Table A163 Brick & Tile Makers: Household Members
F>=15 M>=15 Child <15 Mean Mean Mean
Total 2.7 2.3 1.0 Table 164 Brick & Tile Makers: Roles in the Value Chain
N=12 N % Brick & Tile Making 11 92%
Brick & Tile Wholesale 4 33% Brick & Tile Retail 4 33%
Other (specify) 0 0% Table 165 Brick & Tile Makers: Specific Goods & Services Provided
N=12 N % Roof Tiles 12 100%
Floor /Wall Tiles 1 8% Bricks 12 100%

USAID-Funded Cambodia MSME Strengthening Project Final Monitoring And Evaluation Survey 2008 112
Table A166 Brick & Tile Makers: MSME Project Facilitated Trainings
Training/Capacity Building Activities N=72 N % Group Meetings with MSME Staff 10 83%
Brick & Tile Raw Materials Manageement 7 58% Kiln Management 6 50%
Glazing 3 25% Basic business Accounting 6 50%
Training: business other than Accounting 3 25% Training: business advocacy 4 33%
Introduction to Finance Institutions 11 92% Introduction to Traders 5 42%
Cross provincial Exposure trip 6 50% International Exposure Trip 11 92%
Total 72 100% Table A167 Brick & Tile Makers: Fixed Capital Investments Since Joining the Project (Quantities)
N=12 Mean Median Std.DV Max SumLand (Hectares) 0.75 0.53 0.86 2 9.05
Business shop/office 0.08 0 0.29 1 1 Construction of new Kilns 1.17 1 1.11 4 14
Renovation Improvement of existing Kilns 0.25 0 0.87 3 3 Storage facilities/structures 0.75 0 1.14 3 9
Storage equipment 15.42 1.5 26.56 80 185 Transport 9.67 9 9.16 30 116
Machinery 1.25 1 1.42 4 15 Equipment 2.08 0.5 3.48 12 25
Table A168 Brick & Tile Makers: Credit- Investment Capital by source (USD)
N=12 Count % Own money only 8 67
Own money and borrow 2 17 Borrow Only 2 17
Total 12 100 Table A169 Brick & Tile Makers: Credit Type (USD)
N=4 N % Financial Institution 2 17%
Family and/or friends 1 8% Private money lender 2 17%
Total 5 42%

USAID-Funded Cambodia MSME Strengthening Project Final Monitoring And Evaluation Survey 2008 113
Table A170 Brick & Tile Makers: Credit Amount by Type (USD)
N=4 Mean Median St.Dv Max Sum Financial Institution 16250 7500 23585 50000 65000
Family and/or friends 1250 0 2500 5000 5000 Private money lender 4000 3000 4899 10000 16000
Table A171 Brick & Tile Makers: Proportion with Sale of Goods & Services on Credit 2008.
N=12 N %
Yes 8 67% No 4 33%
Total 12 100% Table A172 Brick & Tile Makers: Types of Clients with Good & Services on Credit 2008.
N=8 N % Brick & Tile Retailer 2 25%
Builders/Construction firms 6 75% Table A173 Brick & Tile Makers: Credit Amounts for Good & Services by Client Type 2008 (USD).
N=8 Mean Median St.Dv Max Sum Brick & Tile Retailer $688 $0 $1,751 $5,000 $5,500
Builders/Construction firms $13,875 $11,500 $16,120 $50,000 $111,000 Overall Credit $14,563 $11,500 $116,500
Table A174 Brick & Tile Makers: Cost of production Pre-Project (USD)
N=12 Mean Median Std. D Max Sum Ofiice/Shop Outlet rent & maint. 0 0 0 0 0
Brick/Tile Raw materials 6,817 6,000 4,512 20,000 81,800 Brick/Tile chemicals 392 0 866 3,000 4,700
Kiln Wood Fuel 10,433 11,750 6,141 20,000 125,200 Water 1 0 3 10 10
Machinery Fuel & Oil 9,022 7,956 5,664 17,520 108,267 Machinery 408 150 848 3,000 4,900
Electricity supply 0 0 0 0 0 Hired Labor Part-time 84,17 10,225 7,225 20,000 101,000
Hired Labor Fulltime 2,508 1,800 3,451 12,000 30,090 Hired Transport Costs 681 500 877 3,000 8,175
Business operation fees 170 100 190 700 2,045 Other 0 0 0 0 0
Overall Cost $38,849 $45,683 $466,187

USAID-Funded Cambodia MSME Strengthening Project Final Monitoring And Evaluation Survey 2008 114
Table A175 Brick & Tile Makers: Mean Unit Prices for Bricks & Tiles Pre-Project (USD)
N=12 Mean Median Std. D Max Roof Tiles $56 $49 $32 $100
Bricks $21 $22 $5 $30 Table A176 Brick & Tile Makers: Mean Unit Prices for Bricks & Tiles 2008 (USD)
N=12 Mean Median Std. D Max Roof Tiles $118 $81 $69 $219
Bricks $47 $45 $3 $50 Table 177 Brick & Tile Makers: Volume of Sales Pre-Project (USD)
Table Frequency Estimate Total number of bricks/tiles sold: Before Project N=12 Mean Median Std. D Max Sum
Roof Tiles 329,226 229,018 308,149 1,250,000 3,950,709 Bricks 607,143 552,381 448,853 1,752,381 7,285,714 Total 936,369 985,712 11,236,423
Table 178 Brick & Tile Makers: Number of Customers Pre-Project (Persons)
N=12 Mean Median Std. D Max Roof Tiles 99 95 60 210
Bricks 58 33 43 120 Total 157 310
Table 179 Brick & Tile Makers: Number of Customers 2008 (Persons)
N=12 Mean Median Std. D Max Roof Tiles 113 100 68 250
Bricks 245 43 590 2,100 Total 358 2,310
Table 180 Brick & Tile Makers: Gross Sales Revenue Pre-Project (USD)
N=12 Mean Median Std. D Max Sum Roof Tiles 18,437 12,825 17,256 70,000 221,240
Bricks 12,750 11,600 9,426 36,800 153,000 Total $31,187 $30,450 $374,240

USAID-Funded Cambodia MSME Strengthening Project Final Monitoring And Evaluation Survey 2008 115
Table 181 Brick & Tile Makers: Costs of Business Pre-Project (USD)
N=12 Mean Median Std. D Max Sum
Ofiice/Shop Outlet rent & maint. 0 0 0 0 0 Brick/Tile Raw materials 6817 6000 4512 20000 81800
Brick/Tile chemicals 392 0 866 3000 4700 Kiln Wood Fuel 10433 11750 6141 20000 125200
Water 1 0 3 10 10 Machinery Fuel & Oil 9022 7956 5664 17520 108267
Machinery 408 150 848 3000 4900 Electricity supply 0 0 0 0 0
Hired Labor Part-time 8417 10225 7225 20000 101000 Hired Labor Fulltime 2508 1800 3451 12000 30090
Hired Transport Costs 681 500 877 3000 8175 Business operation fees 170 100 190 700 2045
Other 0 0 0 0 0 Overall Cost $38,849 $45,683 $466,187
Table A182 Brick & Tile Makers: Household Labor Employment Pre-Project (persons)
N=12 Mean Median Std. D Max Sum Females-Aged 15-24
years 0.17 0.00 0.39 1.00 2.00 Females-Aged >=25
years 0.92 1.00 0.51 2.00 11.00 Males-Aged 15-24 years 0.17 0.00 0.39 1.00 2.00 Males-Aged >=25 years 1.08 1.00 0.29 2.00 13.00
Total Labor employment 2.33 2.00 0.89 4.00 28.00
Table A183 Brick & Tile Makers: Hired Labor Employment Pre-Project 2008 (persons)
N=12 Mean Median Std. D Max Sum Full-time labor-female 2.5 0.0 5.0 15 30
Full-time labor-male 8.4 3.0 10.2 30 101 Casual labor-female 15.3 15.0 16.0 50 183
Casual labor-male 10.1 10.0 7.1 20 121 Table A184 Brick & Tile Makers: Hired Labor Daily Pay Rates Pre-Project (riel)
Mean Median Std. D Max Sum Full-time labor-
female 9000 6000 6083 16000 27000 Full-time labor-male 10743 9300 5430 20000 75200 Casual labor-female 5625 6000 744 6000 45000
Casual labor-male 5556 6000 726 6000 50000

USAID-Funded Cambodia MSME Strengthening Project Final Monitoring And Evaluation Survey 2008 116
Table A185 Brick & Tile Makers: Hired Labor Daily Pay Rates 2008 (riel)
Mean Median Std. D Max Sum Full-time labor-fem. 11333 7000 7506 20000 34000 Full-time labor-male 12900 13000 5462 20000 90300 Casual labor-female 7200 8000 1549 8000 72000
Casual labor-male 7200 8000 1549 8000 72000 Table A186 Brick & Tile Makers: Productivity Indicators Pre-Project
N=12 Mean Median Std. D Min Max Average number of tiles sold per month 47,477 23,733 48,743 4,500 150,000
Average number of bricks sold per month 36,017 31,500 24,093 0 80,000 Average value of a sale of 1,000 bricks-riel 55 41 32 20 100 Average value of a sale of 1,000 Tiles-riel 19 19 8 0 28
Table A187 Brick & Tile Makers: Productivity Indicators 2008
N=12 Mean Median Std. D Min Max Average number of tiles sold per month 56,389 45,000 47,544 5,500 150,000
Average number of bricks sold per month 38,944 32,500 31,917 2,500 100,000 Average value of a sale of 1,000 bricks-riel 118 81 69 45 219 Average value of a sale of 1,000 bricks-riel 47 45 3 43 50