california iso public cg planning activities: btep btep system assessment economic planning...
TRANSCRIPT
California ISO Public

ColumbiaGrid
2018 Annual Interregional Coordination Meeting (AICM)
February 22, 2018
2

3
ColumbiaGrid (CG) planning activities• Planning process – key components, products
• Planning activities
• Results – key conclusions from last year’s (2017) activities
• Next steps & 2018 planning activities
• Information and notifications
In This Presentation

CG Planning Process&
Activities
4

5
Governed by Planning and Expansion (PEFA) & Order 1000 Functional Agreements
• One single process
The planning process produces, at least, 2 key documents
• System Assessment (SA) report
• Biennial Transmission Expansion Plan (BTEP)
CG Planning Process: Overview

6
Several types of activities that are part of ColumbiaGrid’s planning process
Base case development
• Support MOD-032 process
Annual assessment
• Identify Order 1000 Needs
• Reevaluation of Order 1000 projects
CG Planning Activities: What we do?

7
Annual technical studies• Reliability Assessment (Part of SA)
• Sensitivity Studies (Flexible study scope)
Additional technical studies• Economic Planning Study (EPS)
• Transient Stability study
• Geomagnetic Disturbance study (TPL-007-1)
• Model validation study (MOD-032)
CG Planning Activities: What we do?

8
Study Teams
• Focus groups that address specific issues or specific areas
• Identify issues and/or develop plans of service• Flexible timeline
Special Projects
• As requested by the members
CG Planning Activities: Studies & Assessment

9
Conducted annually (Dec – Jul)• The final report is issued by August of each year
Scope, assumptions, and scenarios are developed in the public forum• Planning meetings (6 meetings a year)
Fulfill the requirements from both Functional Agreements (FA)• Ability to serve load/transmission obligations
• Identify Order 1000 Needs for regional transmission
CG Planning Process: SA

10
The SA report contains major findings & results from various technical studies/evaluations• Screening studies of the Regional Interconnected System
(RIS) using the Planning Criteria
• Determine the ability of each TOPP to serve native load and other obligations, consistent with planning criteria
• Determine conceptual transmission solutions to address Multi-system reliability issues (as needed)
• Identify Needs (Need Statements)
• Reevaluate Order 1000 Projects included in prior plans
CG Planning Process: SA

11
CG Planning Process: SA
Performing studies & assessments
Order 1000 Potential Needs & Suggestions
System Reliability Assessment Assumptions
Others
cSA Report
Order 1000 Projects included in prior plans
December AugustJanuary February March April May June July

12
Single utility planning approach to develop a cost effective and efficient coordinated regional plan
Covers ten-year planning horizon
Identifies transmission additions necessary for members to:• Provide reliable load service• Integrate new resources• Meet transmission service commitments• Facilitate economic transfers
CG Planning Process: BTEP

13
Projects included in the Plan are typically “committed projects”
• In the permitting, design, or construction phases
Biennial plan• The final report is issued in February (after the 2nd year
of each planning cycle)
• Ability to issue an “Updated” plan during the interim year (if needed)
• The plan also discusses results from various “for information only” studies
CG Planning Process: BTEP

14
Contents of the BTEP report include
• Key conclusions from the latest System Assessment(s) such as Need Statements
• Conclusions from other studies/activities that have been completed during the planning cycle
• Updates from other ongoing studies/activities
• Other updates
CG Planning Process: BTEP

15
“Other” studies that were conducted in 2017 (some still ongoing)• Sensitivity Studies (e.g. High Renewable, N-1-1)
• Study Teams*
• Economic Planning Study (Production Cost Simulation)
• Transient Stability Study
• Model validation (MOD-033)
• GMD studies (TPL-007)
CG Planning Process: BTEP
* Timeline to conduct detailed studies or develop plan of service can be flexible
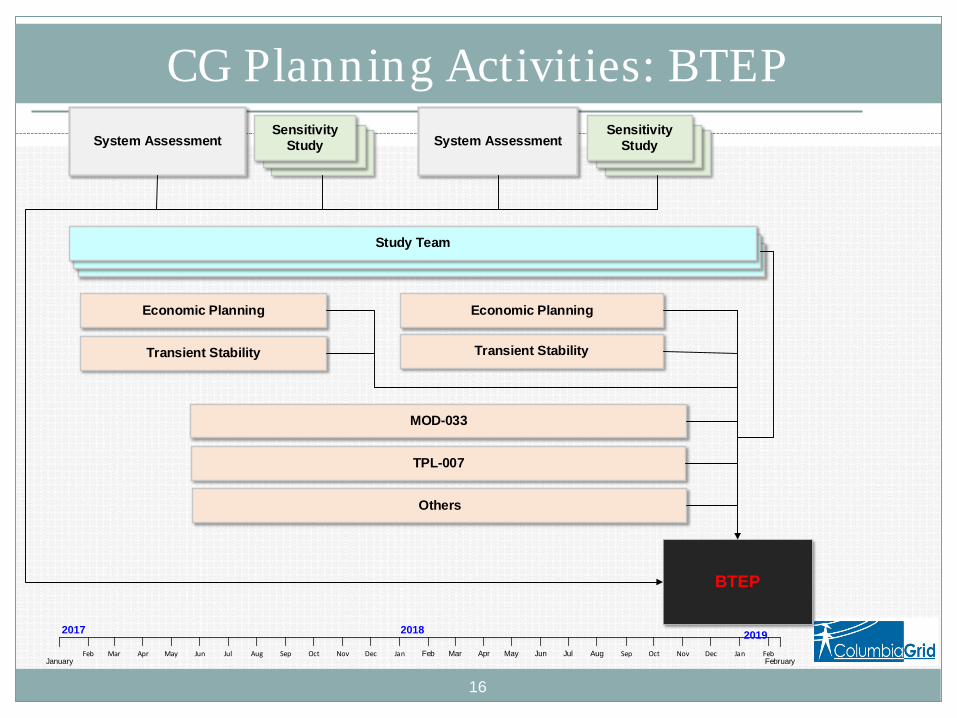
16
CG Planning Activities: BTEP
BTEP
System Assessment
Economic Planning
Transient Stability
MOD-033
System Assessment Sensitivity
Study Sensitivity
Study
Study Team
Economic Planning
Transient Stability
Others
January FebruaryFeb Mar Apr May Jun Jul Aug Sep Oct Nov Dec Jan Feb Mar Apr May Jun Jul Aug Sep Oct Nov Dec Jan Feb
TPL-007
2017 2018 2019

Results & Major Findings
17

18
2017 System Assessment: OverviewMajor contents
Overview of ColumbiaGrid regional planning process and interregional coordination.Description of major projects that comprise the ColumbiaGrid Ten Year Plan. Total costs ~ $2.4B2017 System Assessment:
Modeling assumptions, study methodology and study results
2017 Sensitivity Studies: N-1-1 outage study, future generation supply studyTransient Stability Study status updateEconomic Planning Study status updateMOD-033 study updateGeomagnetic Disturbance study update
19
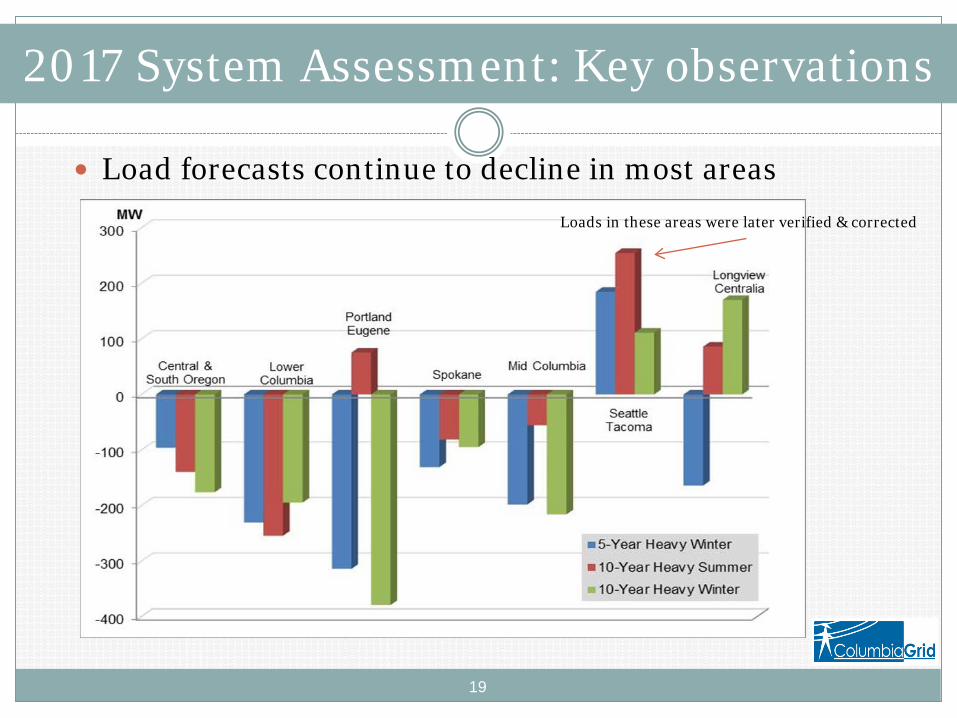
Load forecasts continue to decline in most areas
2017 System Assessment: Key observations
Loads in these areas were later verified & corrected

20
Ten (10) areas of concern were identified• Driven by thermal overload issues.• All of these areas were identified in previous system
assessments and are classified as “Recurring” problems• Reduction from 15 areas of concern in 2016 SA due to
lower loading on limiting facilities• Primarily due to modeling improvements and lower
load forecasts
No new Order 1000 Needs has been identified
2017 System Assessment: Results

21
Thirty-seven (37) unsolved cases were confirmed• Mostly triggered by local system issues• Potential solutions may involve addition of shunt
reactive support to prevent voltage instability• Details of unsolved cases can be found in this section
of the SA report
2017 System Assessment: Results

22
Two Sensitivity Studies were conducted in 2017• N-1-1• High Renewable
N-1-1 study simulated multi-million combination of contingencies• Focus on multi-system issues
• Identify potential reliability issues
• Part of requirement under NERC planning standards
Sensitivity Studies: Results

23
High Renewable Study focuses on potential impacts from significant supply changes• Uses PCM to determine potential major changes or
additional scenarios to consider
• Power flow is used to revalidate the results
• Provide additional information (for information only)
Sensitivity Studies: Results

24
The Alcoa Study Team concluded its work in December 2017• Evaluated impacts from major load shutdown
• Study Team includes representatives from Chelan PUD, BPA, Grand PUD, Douglas PUD, and CG
• The Study Team identified 7 alternatives to mitigate potential reliability issues
• RAS option was recommended as the preferred alternative
Study Teams: Results

25
A new Study Team was recently formed• Quincy Area Study Team
• Address potential issues related to higher than expected load forecast in Mid-Columbia area
• Ongoing activity
Study Teams: Update

26
An assessment of potential long-term system impacts using Production Cost Simulation (PCM)• Uses PCM as the screening tool
• Revalidate results with power flow
• For information only
• Explore potential impacts on the longer timeframe such as 15 year horizon
• Ongoing work
Economic Planning Study: Update

27
Part of the annual study program to ensure system reliability• In addition to power flow and voltage stability
• Also supports the base case development process
• ColumbiaGrid has been conducting this type of study since 2015
• Foundation for other studies such as the model validation (MOD-033)
Transient Stability: Update

28
A new study, in compliance with several requirements under MOD-033 standard• Model validation: Compare simulation results with actual
events
• Steady state power flow and transient stability
Three major tasks to be conducted by CG• Development of the validation criteria document
• Base case development
• Perform the evaluation studies
Model Validation (MOD-033): Update

29
Current status• The validation criteria have been developed & posted on
CG’s website
• The reference event was selected (Aug 8th, 2017)
• Base case has been developed
• The evaluation work is being conducted
Model Validation (MOD-033): Update

30
A new study, in compliance with several requirements under TPL-007-1 standard• Evaluated power system performance during GMD events
• The scope of current study focuses on assessing Geomagnetic Induced Current (GIC)
Major tasks • Review of GIC system model data
• Develop GMD study cases
• Perform GMD study to determine GIC flow values
Geomagnetic Disturbance (GMD): Update

31
Current status• GIC base cases have been developed
• Preliminary GIC studies have been completed, the initial results are being reviewed by CG members
• Ongoing study
Next steps• Expansion of the study scope to include GMD
Vulnerability Assessment
• Continue to monitor the development/requirements under TPL-007-2
Geomagnetic Disturbance (GMD): Update

Next Steps2018 Regional/Interregional
Planning Activities
32

33
January – March 2018 CG Order 1000 Needs Suggestions window Interregional Transmission Project (ITP) submittal
window Post annual interregional information AICM Meeting Finalize SA study plan and base cases
April – August 2018 Evaluate O1K Needs suggestions that were received Conduct 2018 SA and other studies Develop the 2018 SA (Needs Statement) report
Overview of Activities in 2018

34
September – December 2018 Begin study team activities to address regional needs Evaluate Order 1000 proposed projects Complete Sensitivity and other studies (such as MOD-
033, GMD, etc.) Start developing the 2019 Biennial Expansion
Transmission Plan (BTEP)
February 2019 Present the draft BTEP to CG’s board for approval Once approved, finalizes the 2019 BTEP
Overview of Activities in 2018

35
Annual Interregional Information is posted under CG’s “Order 1000 Inter-regional page”: https://www.columbiagrid.org/O1000Inter-overview.cfm ColumbiaGrid information package 2018 Draft Study Plan 2017 Biennial Transmission Expansion Plan 2017 System Assessment Report
ITP submission window is open through Mar 31
More information, once available, will be posted at this location & sent to interested persons
2018 Interregional Activities: Current Status

36
Order 1000 Needs Suggestion Window Interested persons may submit suggestions for “Order
1000 Potential Needs” Potential drivers for Order 1000 project(s) An Order 1000 Potential Needs submission form can be
downloaded at the following link:https://www.columbiagrid.org/1000-overview.cfm
2018 Regional Activities: Current Status

37
2018 System Assessment (2018 SA)• Study Plan is being finalized
• Focus on reliability compliance for joint areas of concern (involving multiple entities/systems)
10-year planning horizon NERC TPL Reliability Standards used as reference Evaluate applicable Order 1000 Potential Needs
Sensitivity studies Start sensitivity studies after completion of the 2018 SA Study scope will be determined by July
2018 Planning Activities: Ongoing Studies

38
Additional Studies• Transient stability assessment
• Economic Planning Study (PCM)
• System model validation (MOD-033)
• Geomagnetic Disturbance (TPL-007-1)
• Third party verification of physical security assessments (CIP-014)
Study Teams: Dedicated study groups Quincy area Study Team is ongoing, more are possible
2018 Planning Activities: Ongoing Studies

Information and Notifications
39

40
Information, Events and Announcements
Planning and Expansion: General postings & PEFA related information
Order 1000 Regional
Recent Announcements
Order 1000 Inter-regional

41
Public notifications ColumbiaGrid will notify interested persons
regarding future activities through email
Self-register system
Refer to “Join Interest List” on ColumbiaGrid’smain page
Stay Informed About Future Activities

42
Stay Informed About Future Activities

43
Please refer to ColumbiaGrid’s website for more details
Future Planning Meetings
No Date Location Focus
1 February 8, 2018 Portland, OROrder 1000 Needs suggestions, 2018 System Assessment assumptions, other updates
2 April 12, 2018 Portland, OROrder 1000 Potential Needs, finalize 2018 study plan, updates on system assessment
3 June 7, 2018 Portland, OROrder 1000 Needs, Draft System
Assessment study results, Updates
4 August 16, 2018 TBD Updates & Technical discussion
5 October 11, 2018 Portland, OROrder 1000 updates, Draft Sensitivity
Study results, Other updates
6 December 13, 2018 Portland, OR Draft 2019 BTEP, Updates

P A U L D I D S A Y A B U T R AP A U L @ C O L U M B I A G R I D . O R G
L A R R Y F U R U M A S UF U R U M A S U @ C O L U M B I A G R I D . O R G
Questions44

NTTG Annual Interregional Information
Annual Interregional Coordination MeetingFolsom, CA
February 22, 2018

NTTG Organization and Planning Process Overview
Presented by Sharon Helms, NTTG Program Manager

Northern Tier Transmission Group
Participating State RepresentativesIdaho Public Utilities CommissionMontana Consumer CounselMontana Public Service CommissionOregon Public Utility CommissionUtah Office of Consumer ServicesUtah Public Service CommissionWyoming Office of Consumer AdvocatesWyoming Public Service Commission
Participating UtilitiesDeseret Power Electric CooperativeIdaho PowerMATL LLPNorthWestern Energy PacifiCorpPortland General ElectricUtah Associated Municipal Power Systems
4747

Planning Process Flow Map
48

Planning Process Flow Map
49
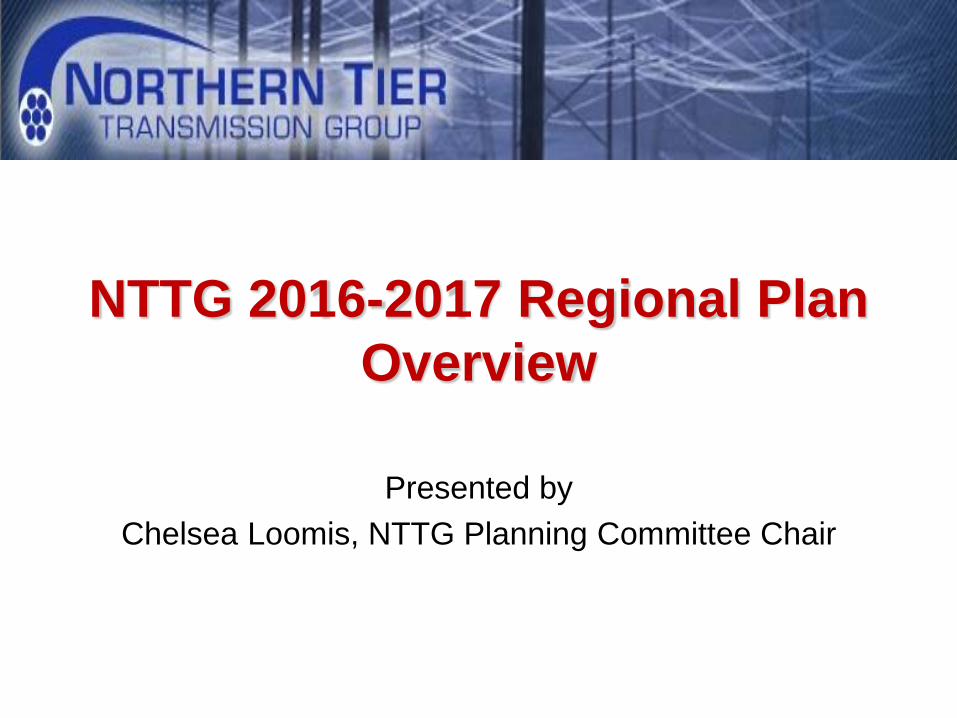
NTTG 2016-2017 Regional Plan Overview
Presented by Chelsea Loomis, NTTG Planning Committee Chair
Timeline
51

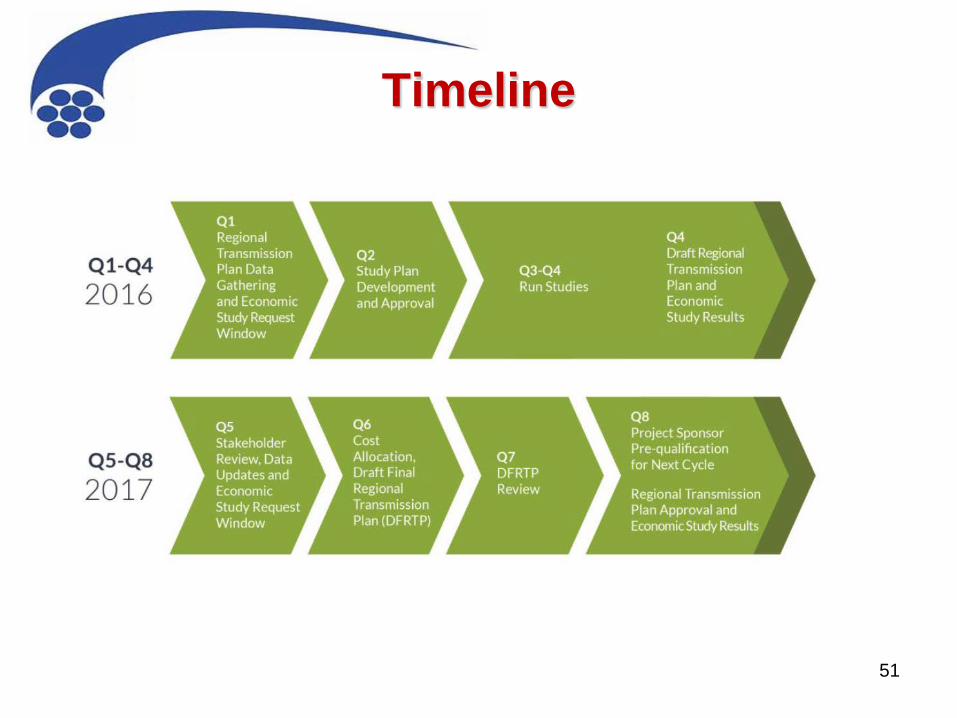
Quarter 1 and Quarter 2
• Q1: Data Submittals– Load, resource, firm service, interregional projects,
PPR/PPC, capital/reserves/losses• Q2: Develop Study Plan
– 10 year look at the system– Technical Work Group, composed of members of the
Planning Committee– Approval of Study Plan from Steering Committee
52

Q1 Data, Projects
53

Q1: Forecasted Loads
54

Q1: Forecasted Resources
55

Q1: Firm Service
56

Q1: Public Policy Consideration
• NTTG received one combined request from Renewable Northwest and the Northwest Renewable Energy Coalition
• Accelerated phase out of Colstrip Unit 3 (CS units 1 and 2 already assumed offline)
• Analysis was performed in Q5
57

Interregional Projects
• Cross-Tie: 500 kV AC, 213 miles, 1500 MW
• SWIP: 500 kV AC, 275 miles, 2000 MW
• Transwest Express: ±600 kV, 730 miles, phased 1500/3000 MW
58

Q2: Development of Study Plan
• Methodology• Assumptions• Software to be used
– Production Cost Modeling: GridView– Power flow: PowerWorld
• Criteria• Public Policy Requirements/Considerations
59

Study Plan Considerations
• NTTG assumed firm service for new projects– A note has been added to the data submittal form to
clarify if new generation has associated firm transmission
• Goal: Find the “more efficient or cost effective” combination of projects
60

Development of Base Cases
• “Round Trip” process• Started with WECC 25hs1a (PF) and WECC
TEPPC CC1.3 (PCM)• Ran PCM which resulted in 8760 hours• Selected 7 Stress cases from the 8760 hours• Converted those PCM cases back to transient-
stability ready PF cases
61

The 7 Power Flow Base Cases
62

Change Cases
• Null Case: Today’s topology with forecasted changes
• Start with the Initial Regional Transmission Plan– Rollup of projects identified in the local plans
AND those from the prior Regional Plan• Scenarios where one or more of the Alternative
Projects is added to or replaces one or more Non-Committed project in the Initial Regional Transmission Plan
63

Change Case Matrix
64

Change Case Matrix
65
Altogether, NTTG Analyzed over 100
cases with over 410 contingencies for each
case

Results: Heat Map Example
66
D2: Null Case, demonstrates violations
D2: Initial Regional Plan, demonstrates improvement from Null Case analysis
Results (cont.)
• Initial RTP, change case 21 and change case 23 satisfy reliability criteria
• Further evaluation after the Q5 data submittal indicated that change case 23 is the configuration that meets the needs of the NTTG footprint as well as being the most cost effective
67

Projects Selected into NTTG’s Regional Transmission Plan
68
Boardman-Hemingway
Gateway West
Gateway South
Antelope
Gateway West (from 300 kV to 500 kV)

Questions
69

NTTG 2018-2019 Planning Activities
Presented by Sharon Helms, NTTG Program Manager

Q8Project SponsorPre-Qualification
12
Q7DFRTPReview
Q1Data
Gathering
Q8Regional
Transmission Plan
Approval
Q1-Q4: 2018 Q5-Q8: 2019
Post Draft Regional
TransmissionPlan (DF RTP)
Q5DF RTP
StakeholderReview,
Data Updates
Q6Draft Final Regional
Transmission Plan
Q8: 2017
Q3-Q4Run
Studies
Q2Study Plan
Development
2018-2019 Process Timeline
TODAY
71

Key 2018 Planning Milestones
Milestone Key DatesQ1 Data Submittal Window Closes
• Projects, NTA’s and ITP’s• Local TP Plans/Needs• Public Policy Consideration Studies• Economic Congestion Studies
• Stakeholder Meeting – Portland, Oregon
March 31, 2018
April 26, 20182018-19 Study Plan Posted for Stakeholder Comment• Stakeholder Meeting – Boise, Idaho
May, 2018
June 21, 20182018-19 Study Plan Approval July 10, 2018Q3-Q4 Reliability and Economic Analysis
• Stakeholder Meeting – Bozeman, Montana• Stakeholder Meeting – SLC, Utah
September 27, 2018December 13, 2018
2018-19 Draft Regional Transmission Plan Posted
December 31, 201872

WestConnect 2018 Annual Interregional
Information
Annual Interregional Coordination MeetingFebruary 22, 2018
73

Topics WestConnect Regional Planning Overview 2016-17 Regional Transmission Plan 2018-19 Regional Planning Cycle Overview and Draft Study Plan Interregional Transmission Project Submittals Upcoming Meetings
74

WestConnect Regional Planning Overview
Charlie Reinhold, WestConnect Project Manager
75

Regional Compliance Filings All tariff revisions related to the regional planning requirements
of Order 1000 were fully accepted by FERC on January 21, 2016 On August 8, 2016 the 5th Circuit Court of Appeals vacated
FERC’s compliance orders related to mandates regarding the role of the non-jurisdictional utilities in cost allocation On November 16, 2017 FERC upheld its previously
compliance orders and provided further explanation as to why its mandates will ensure just and reasonable rates between public and non-public utility transmission providers in the WestConnect region
Numerous requests for review have been filed with FERC
76
Regulatory Update

WAPA BHCSU PSCo (Xcel)PRPA BasinTSGT
WAPATSGTPNM
EPE
WAPABHTSGTBasin
WAPASRPTEPAPSSWTC
WAPASMUDTANC
WAPANVE
WAPAIID
LADWP
WestConnect Planning Region
77

78
SSPGCCPG
SWAT
WestConnect Subregional Planning Groups
78

79
PMC OrganizationPlanning Management
CommitteeChair: Tom Green, Xcel
Planning Subcommittee
Chair: Roy Gearhart, WAPA
Cost Allocation Subcommittee
Chair: Akhil Mandadi, APS
Legal SubcommitteeChair: Jennifer
Spina, APS
Contract and Compliance
Subcommittee Chair: Vacant
Planning Consultants
3rd Party Finance Agent

Transmission Owner w/Load Serving Obligation (18)
Enrolled TO•Arizona Public Service•Black Hills•El Paso Electric•NV Energy•Public Service of New Mexico
•Tucson Electric•Xcel - PSCo
Coordinating TO•Arizona Electric Power Cooperative (formerly SWTC)•Basin Electric•Colorado Springs Utilities•Imperial Irrigation District•Los Angeles Department of Water and Power•Platte River•Sacramento Municipal Utility District•Salt River Project•Transmission Agency of Northern California•Tri-State G&T•Western Area Power Administration
Transmission Customer
Vacant
Independent Transmission Developer (8)
American Transmission
Company
Blackforest Partners
Exelon Transmission
ITC Grid Development,
LLC
Southwestern Power Group
TransCanyon
Western Energy
Connection
Xcel –Western
Transmission Company
State Regulatory Commission
Vacant
Key Interest Group (1)
Natural Resources
Defense Council
80
PMC Membership as of 12/21/2016
Updated 12/21/16
PMC Member Reps

Monthly in-person meetings (2nd Wednesday) held at rotating member facilities Meeting information can be accessed via the
WestConnect calendar Manages the Regional Transmission Planning Process Currently focused on developing the study plan for
the 2018-19 regional planning cycle
81
PMC Activities

2016-2017 Regional Transmission Plan
Tom Green, Planning Management Committee Chair, Xcel Energy
82

2016-17 Regional Process Overview• First full biennial Order 1000
regional planning process for WestConnect
• 2016-17 Key Findings– Based on studies conducted in needs
assessment, no regional transmission needs identified in 2016-17
– PMC elected not to have project solicitation window based on this finding
– Link to 2016-17 Regional Plan report83

2016-17 Planning Cycle Schedule
84
ALLOCATECOSTS
DRAFT REGIONAL PLAN
MODEL DEVELOPMENT
STUDY PLANDEVELOPMENT
IDENTIFY REGIONAL NEEDS
PROJECT/NTA SUBMITTAL WINDOW
Nov Dec Jan Feb Mar Apr May Jun Jul Aug Sep Oct Nov Dec Jan Feb Mar Apr May JUN JUL AUG SEP OCT NOV DEC JAN FEB
SCENARIOSUBMITTALS
2016
EVALUATE & IDENTIFY
ALTERNATIVES
201720152018
3/31/2016ITP Submittal
Deadline

85
Reliability Model Case Summary
Case Name Case ID Case Description and Scope
Base Cases
2026 Heavy Summer Base Case
WC26-HSSummer peak load conditions during 1500 to 1700 MDT, with typical flows throughout the Western Interconnection
2026 Light Spring Base Case
WC26-LSP Light spring load conditions between 0700 to 1000 MDT, with relatively high wind and solar generation
Scenario Cases
CPP –WestConnect Utility Plans Scenario
WC26-CPP1Reflect individual WestConnect member utility plans for Clean Power Plan (CPP) compliance –export stressed hour from PCM
CPP – Heavy RE/EE Build Out Scenario
WC26-CPP3Additional coal retirements, additional RE/EE, minimal new natural gas generation – export stressed hour from PCM

86
Economic Model Case Summary
Case Name Case ID Case Description and Scope
Base Case 2026 Base Case WC26-PCM
Business-as-usual case based on WECC 2026 Common Case with additional regional updates from PMC members.
Scenario Cases
High Renewables WC26-PCM-HR
California 50% RPS with regional resources (Wyoming wind and New Mexico wind) andincrease WestConnect state RPS requirement beyond enacted with other resources
CPP –WestConnect Utility Plans
WC26-PCM-CPP1Reflect individual WestConnect member utility plans for CPP compliance
CPP – Market-based Compliance
WC26-PCM-CPP2Model CO2 price in WestConnect to achieve mass-based regional CPP compliance
CPP – Heavy RE/EE Build Out
WC26-PCM-CPP3Additional coal retirements, additional RE/EE, minimal new natural gas generation

“Base” Cases
Reliability Cases Peak Summer
– Based on WECC 2026 Heavy Summer 1 Base Case
Light Spring– Based on WECC 2026 Light Spring Base Case– Low Load / High Renewable
Economic Case Updated WECC 2026 Common Case
87

2016-17 Regional Needs Assessment• Local versus Regional transmission issues
– Regional needs impact more than one TOLSO
• Regional Reliability Assessment – NERC TPL-001-4 Table 1 (P0 and P1) and TPL-001-WECC-CRT-3
• Regional Economic Assessment – Reviewing modeling for congestion (hours and cost)
• Regional Public Policy Assessment – Enacted public policies are represented in regional base models– Proposed public policies considered as a part of planning process
88

2016-17 Regional Needs Assessment (cont.)• Based on the Base Case scenarios performed as a part of the
WestConnect 2016-17 Regional Planning Process there were:– No regional reliability needs identified;– No regional economic needs identified; and– No regional public policy needs identified.
• Because there were no regional needs identified, in 2017 there was no:– Evaluation and selection of project solutions to meet regional needs
(including interregional transmission projects);– Cost allocation evaluation and identification; and– Project developer selection.
89

High-level Summary of Scenario Cases
90
Scenario Name Description Key Assumptions (changes to Base) Study Scope
Regional Renewables (RR)
50% increase to enacted WestConnect-state RPS with required resources added locally to TOs. 4,000 MW of resources added in Wyoming and New Mexico for CA 50% RPS purposes.
• 3,651 MW of wind in WestConnect• 7,166 MW of solar in WestConnect• 396 MW of geothermal in WestConnect• 4,000 MW of wind in WY/NM for CA
Economic assessment only
CPP –WestConnect Utility Plans (CPP1)
Reflect individual WestConnect member utility plans for CPP compliance, including retirements and replacement assumptions. Represents compiled set of assumptions developed independently by TOs from IRPs or other planning initiatives.
• 1,322 MW of coal retirements• 444 MW of gas retired (175 MW of
repowering)• 1,127 MW of gas added• 595 MW of renewable energy
Economic and reliability assessment
CPP – Heavy RE Build Out (CPP3)
Reflects more aggressive coal retirements than in CPP3, with replacement capacity from additional RE minimizing new natural gas generation (while meeting resource adequacy).
• 4,188 MW of coal retirements• 444 MW of gas retired (175 MW of
repowering)• 1,158 MW of gas added• 10,286 MW of additional renewable
energy
Economic and reliability assessment

Scenario Findings RR
Major Impact on Regional Congestion and Inter-regional Paths 3% of added renewable gen curtailed due to transmission constraints No Unserved Load Also Had Inter-regional Impacts
CPP1 Minimal impact on regional and single-TO congestion zero curtailment due to transmission No Unserved Load No Apparent Regional Economic Issues
CPP3 Major Impact on Regional Congestion and Inter-regional Paths 10% of the added renewable generation curtailed due to transmission No unserved load Some Inter-regional Impacts
91

92
• Production cost of WestConnect generators reduced in all scenarios. Modeled RE additions have zero operation costs whereas the gas & coal they replaced had operating costs, mostly fuel costs.
• CPP1 reduced WestConnect cost yet slightly increased WECC cost• RR case has lowest production cost because of renewables offseting thermal
generation
WestConnect (& WECC) Production Cost
ScopeTotal Production Cost (M$) Across Cases
WC 26PCM-D8_170108 CPP1rev1 CPP3rev1 RR
System(WECC)
$19,532 $19,561 $18,945 $17,991
∆ from Base $29 ($587) ($1,541)0.15% -3% -8%
WestConnect Generation Shares
$6,520 $6,405 $5,944 $5,831
∆ from Base ($115) ($577) ($689)-2% -9% -11%

ScopeCO2 Emissions (Short Ton) Across Cases
WC 26PCM-D8_170108 CPP1rev1 CPP3rev1 RR
System(WECC)
342,423,714 337,084,544 311,636,370 318,163,454
∆ from Base (5,339,170) (30,787,344) (24,260,260)-2% -9% -7%
WestConnect Generation Shares
142,240,853 136,605,743 115,772,953 128,575,232
∆ from Base (5,635,109) (26,467,900) (13,665,620)-4% -19% -10%
93
WestConnect (& WECC) CO2 Emissions
• From a regional perspective, a bold set of coal retirements (>4 GW) plus additional renewables (CPP3) is more effective at reducing WestConnect CO2 emissions than a major buildout of renewables on its own (RR)

94
• Base: Flow going SW out of Four Corners into Arizona system decreased 350 aMW from historical averages (driven by Four Corners retirements)
• CPP1: Similar to Base Case, Cholla retirement had little effect• CPP3: More volatile flows (higher highs, lower lows) than Base & CPP1, likely
due to the added variable resources• RR: Significant congestion out of Four Corners (4%, $5M)

Congestion Across All Cases (Branches & Paths) Total Congestion Hours (% Hrs) / Cost ($)Scope Owner(s) Branch/Path Name WC 26PCM-D8_170108 CPP1rev1 CPP3rev1 RR
Multi-TO
PSCO|TSGT BOONE_230.0 - LAMAR_CO_230.0 - - 3,625 (41%) / $61,160K 2,290 (26%) / $29,193KPSCO|TSGT SANLSVLY_230.0 - PONCHABR_230.0 - - 2,311 (26%) / $20,127K 2,311 (26%) / $18,019KPSCO|TSGT BOONE_230.0 - MIDWAYPS_230.0 - - - 131 (1%) / $1,522KPSCO|WAPA-RM MIDWAYPS_230.0 - MIDWAYBR_230.0 - - - 19 (0%) / $123K
WECCPath
P24 PG&E-Sierra 493 (6%) / $1,286K 511 (6%) / $1,217K 896 (10%) / $2,170K 554 (6%) / $1,323KP66 COI 4 (0%) / $58K 5 (0%) / $46K 9 (0%) / $89K 35 (0%) / $514K
PNM P48 Northern New Mexico (NM2) 3 (0%) / $3K 4 (0%) / $13K - 1 (0%) / $5KP61 Lugo-Victorville 500 kV Line 1 (0%) / $1K - 1 (0%) / $2K 99 (1%) / $747KP52 Silver Peak-Control 55 kV 2 (0%) / $0K 2 (0%) / $0K 34 (0%) / $5K 995 (11%) / $154KP41 Sylmar to SCE 2 (0%) / $0K 1 (0%) / $1K 1 (0%) / $1K -P32 Pavant-Gonder InterMtn-Gonder 230 kV - 1 (0%) / $8K 127 (1%) / $793K 223 (3%) / $1,114K
PNM|EPE P47 Southern New Mexico (NM1) - 1 (0%) / $0K - -P36 TOT 3 - - 4 (0%) / $23K 132 (2%) / $1,292KP22 Southwest of Four Corners - - - 373 (4%) / $5,048KP30 TOT 1A - - - 9 (0%) / $15K
Single TO
APS CTRYCLUB_230.0 - LINCSTRT_230.0 145 (2%) / $1,705K 161 (2%) / $2,035K 227 (3%) / $2,638K 98 (1%) / $975KLADWP TARZANA_230.0 - OLYMPC_230.0 18 (0%) / $1,327K 14 (0%) / $1,043K 19 (0%) / $1,864K 23 (0%) / $1,787KNEVP HIL TOP - HIL TOP 144 (2%) / $492K 219 (3%) / $798K 115 (1%) / $423K 110 (1%) / $336KLADWP RINALDI_230.0 - AIRWAY_230.0 2 (0%) / $118K 4 (0%) / $183K 3 (0%) / $74K 5 (0%) / $235KPSCO LEETSDAL_230.0 - MONROEPS_230.0 2 (0%) / $16K - 366 (4%) / $2,801K 600 (7%) / $4,942KNEVP CLARK 6 - CLARK 1 (0%) / $2K 1 (0%) / $2K 20 (0%) / $109K 8 (0%) / $14KPSCO GREENWD_230.0 - MONACO12_230.0 1 (0%) / $0K 3 (0%) / $29K 189 (2%) / $2,731K 482 (6%) / $6,545KAPS MEADOWBK_230.0 - SUNYSLOP_230.0 - 1 (0%) / $8K 2 (0%) / $16K -WAPA-SN TRCY PMP_230.0 - HURLEY S_230.0 - - 10 (0%) / $1,479K -NEVP FRONTIER_230.0 - MACHACEK_230.0 - - 17 (0%) / $74K 776 (9%) / $5,218KNEVP FT CHUR - FT CH PS - - 18 (0%) / $61K 110 (1%) / $298KWAPA-RM SANJN PS - WATRFLW - - 8 (0%) / $43K -PSCO STORY_230.0 - PAWNEE_230.0 - - 5 (0%) / $22K -NEVP FAULKNER - FAULKNER - - 1 (0%) / $12K -NEVP GONDER_230.0 - MACHACEK_230.0 - - 3 (0%) / $9K 197 (2%) / $717KWAPA-RM ARCHER_230.0 - TERRY_RANCH_230.0 - - - 179 (2%) / $2,360KPSCO BOONE - BOONE - - - 140 (2%) / $1,065K
Total Congestion Cost: $5,008K $5,383K $96,725K $84,700K
*Phase shifting transformers (PST) removedNegligible regional congestion in
Base Case & CPP1 studyCPP3 & RR studies shows
potential for regional congestion

Scenario Reliability Study Method
• Production cost modeling used to identify what stressed dispatch might look like under scenario futures
• Condition at 1pm on April 15th was selected and dispatch/flow assumptions were transferred to the reliability model for study Did this for entire WECC system
• Reliability assessment scope included steady-state contingency analysis but focused on transient stability analysis to assess frequency response of system under major disturbances The goal was to identify occurrences of
under frequency load shedding (UFLS), system frequency losing stability (e.g., undamped oscillations), and system instability (e.g., cascading trips)
WestConnect 96
Base CaseRenewables: 29% load
Load: 33.5 GWHeadroom: 3 GW
Utility Plans ScenarioRenewables: 30% load
Load: 33.5 GWHeadroom: 3.1 GW
Aggressive ScenarioRenewables: 45% load
Load: 33.5 GWHeadroom: 4.5 GW
Studied stressed hour with low thermal headroom, high renewable dispatch, and lower loads
April 15th

Scenario Reliability Study Results• Key qualifications: Operating reserves, reliance on neighboring systems, no mitigations studied, no
local system analysis
• Steady-state analysis: Ability of system to maintain extended safe operation post-contingency No regionally significant overloads or voltage issues were identified through contingency analysis Several single-system issues were identified but were not addressed consistent with the study scope
• Transient stability/frequency response analysis: Ability to maintain synchronism following disturbance Studied robust set of regionally-significant contingencies provided by members, including major generator
trips, line trips, faults, stuck breakers, etc. Results of scenarios were compared to base case to track relative performance – focus on first 30 seconds System achieved stable frequency recovery within 20 seconds under all scenarios for condition studied,
which is within WECC criterion
WestConnect 97
60.0 Hz
59.2 Hz
60.8 Hz
Freq
uenc
y
Base Utility Plans Aggressive
20 seconds 20 seconds 20 seconds

“Opportunity” Investigation• PMC agreed to explore scenario congestion
• Limited Scope for a Single Example
• Not a perfect example, due to radial nature of the congested line• Ideally would also address “Deliverability”
• Investigation evaluated three alternatives• Numerous assumptions required
• some of these discussed and supported by the WC• others have not been contemplated.
• Scope:1. Confirm alternatives mitigates regional opportunity and do not cause additional regional issues
2. Evaluate Alternatives for Cost Effectiveness
3. Cost Allocation
98

Opportunity Alternatives
9999
Segment A: Upgrade terminal equipment
on 230kV CRT#1
Segment C: New 50+ mile230kV single circuit
Segment B: New 85+ mile,230kV single circuit
Project Alternative Description
Alt 1 Upgrade A + New Build B
Alt 2 Upgrade A + New Build C
Alt 3 Upgrade A + 250 MW Battery Storage at Poncha
• Base Case
• Alt 1: Build Segment B is a new 230 kV
• Alt 2: Build Segment C is a new 230 kV
• Alt 3: Energy storage
Congested Element
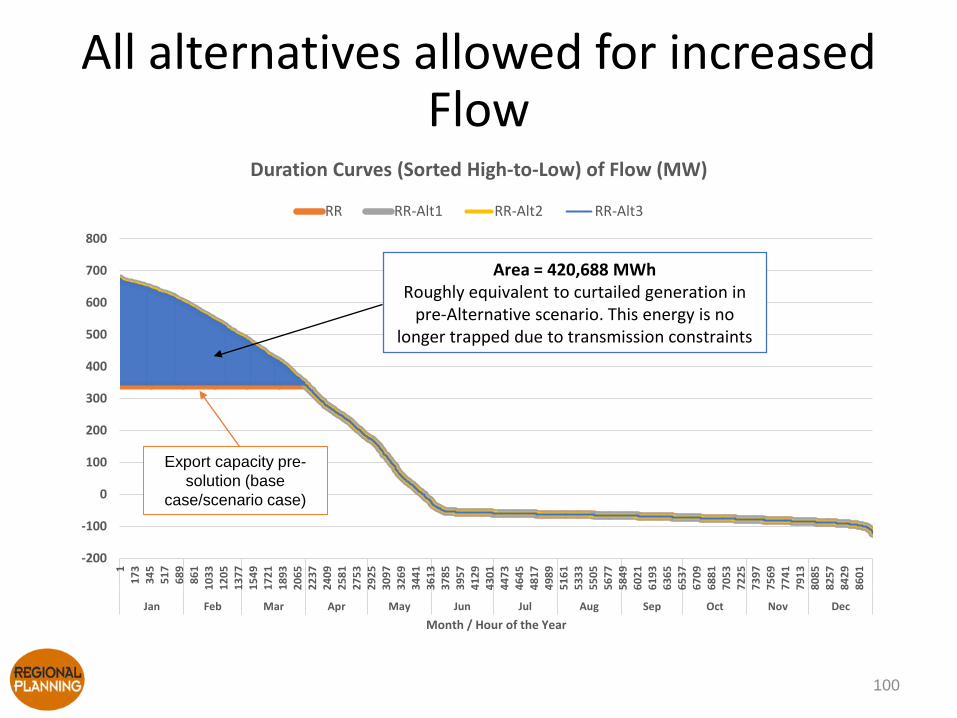
All alternatives allowed for increasedFlow
100
-200
-100
0
100
200
300
400
500
600
700
800
117
334
551
768
986
110
3312
0513
7715
4917
2118
9320
6522
3724
0925
8127
5329
2530
9732
6934
4136
1337
8539
5741
2943
0144
7346
4548
1749
8951
6153
3355
0556
7758
4960
2161
9363
6565
3767
0968
8170
5372
2573
9775
6977
4179
1380
8582
5784
2986
01
Jan Feb Mar Apr May Jun Jul Aug Sep Oct Nov DecMonth / Hour of the Year
Duration Curves (Sorted High-to-Low) of Flow (MW)
RR RR-Alt1 RR-Alt2 RR-Alt3
Area = 420,688 MWhRoughly equivalent to curtailed generation in
pre-Alternative scenario. This energy is no longer trapped due to transmission constraints
Export capacity pre-solution (base
case/scenario case)

Economic Benefit & B/C Ratio
101
-16
-14
-12
-10
-8
-6
-4
-2
0Aggregated Annual ∆ APC (M$)
-16
-14
-12
-10
-8
-6
-4
-2
0
WestConnect Other in WC Footprint
Aggregated Annual ∆ APC (M$)
SLV-Poncha-Midway (Alt1) SLV-Poncha-Malta (Alt2) SLV-Poncha+Poncha Storage (Alt3)
Shaded bars show savings after excluding positive ∆APC (i.e. excluding TOLSOs with increased APC)
0
0.25
0.5
0.75
1
1.25
1.5
Alternative 1 Alternative 2 Alternative 3
B/C Ratio Comparison

Regional Plan Report Outline
WestConnect 102
1 Summary and Introduction2 Study Plan3 Model Development4 Regional Transmission Needs Assessment5 Scenario (Opportunity) Assessment6 Stakeholder Involvement and Interregional Coordination7 Regional Plan Conclusions
Appendix A – Information ConfidentialityAppendix B – Base Transmission Plan ProcessAppendix C –Base Transmission Plan (2016-2026 Projects)Appendix D – WestConnect Regional Project Submittal FormAppendix E – WestConnect Scenario Submittal FormAppendix F – 2026 Base Case (PCM) AssumptionsAppendix G – Results of Reliability Need AssessmentAppendix H – Results of Economic Need AssessmentAppendix I – Scenario Resource AssumptionsAppendix J – Results of Reliability Scenario Assessment

2018-2019 Regional Planning Cycle Overview and Draft Study Plan
Keegan Moyer, WestConnect Planning Consultant, Energy Strategies
Roy Gearhart, Planning Subcommittee Chair, WAPA
103

2018-19 Process Timeline
104
Today
ALLOCATECOSTS
DRAFT REGIONAL PLAN
MODEL DEVELOPMENT
STUDY PLANDEVELOPMENT
IDENTIFY REGIONAL NEEDS
PROJECT/NTA SUBMITTAL WINDOW
Nov Dec Jan Feb Mar Apr May Jun Jul Aug Sep Oct Nov Dec Jan Feb Mar Apr May JUN JUL AUG SEP OCT NOV DEC JAN FEB
SCENARIOSUBMITTALS
2018
EVALUATE & IDENTIFY
ALTERNATIVES
20192017 2020
3/31/2016ITP Submittal
Deadline(3/31/18)

2018-19 Study Plan Overview• Study Plan identifies the scope and schedule of the study
work to be performed during the planning cycle• The subsequent slides review:
– Base Transmission Plan– Regional Need Assessments (including key models)– Scenario Studies – Opportunities for participation and next steps
• Note that the Study Plan does not explain every aspect of the process and the BPM should be consulted for details not provided (especially when referenced)
105

2018-19 Base Transmission Plan
WestConnect 106

Base Transmission Plan: transmission network topology that is to be reflected in each of the regional planning models.• Base Transmission Plan = Planned TO Projects + High probability ITD Projects
Based on project information gathered in WestConnect’s Transmission Plan Project List for 2018-19 cycle
Will document Base Transmission Plan in 2018-19 Study Plan (which will be approved by PMC), and ensure this transmission is included in base models
Based on member feedback from survey, plan is to provide more details about what the 2018-19 Base Transmission Plan represents, and how it is different than the 2016-17 Base Transmission Plan
The Base Transmission plan is current in draft form and will not be finalized until the Study Plan is approved
The Model Development Report will include a summary as to how this Base Transmission Plan has changed relative to the 2016-17 Base Plan
107
Base Transmission Plan

Planned TO Projects
• Criteria from last study plan and BPM:• All TO projects designated with a “planned” project
status are included in the base transmission plan. As defined by WestConnect, planned facilities include projects that have a sponsor, have been incorporated in an entity’s regulatory filings, have an agreement committing entities to participate and construct, or for which permitting has been or will be sought.
WestConnect 108
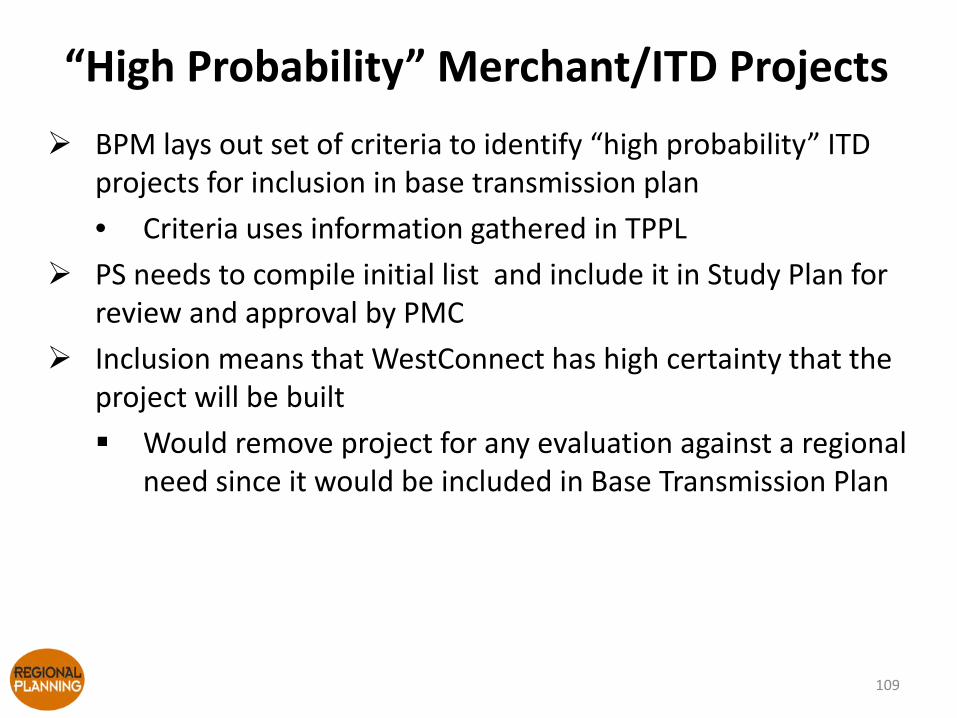
BPM lays out set of criteria to identify “high probability” ITD projects for inclusion in base transmission plan• Criteria uses information gathered in TPPL
PS needs to compile initial list and include it in Study Plan for review and approval by PMC
Inclusion means that WestConnect has high certainty that the project will be built Would remove project for any evaluation against a regional
need since it would be included in Base Transmission Plan
109
“High Probability” Merchant/ITD Projects

Process for Including ITD Projects in Base Transmission Plan

Regional Assessments
WestConnect 111
Regional Needs Assessment Background
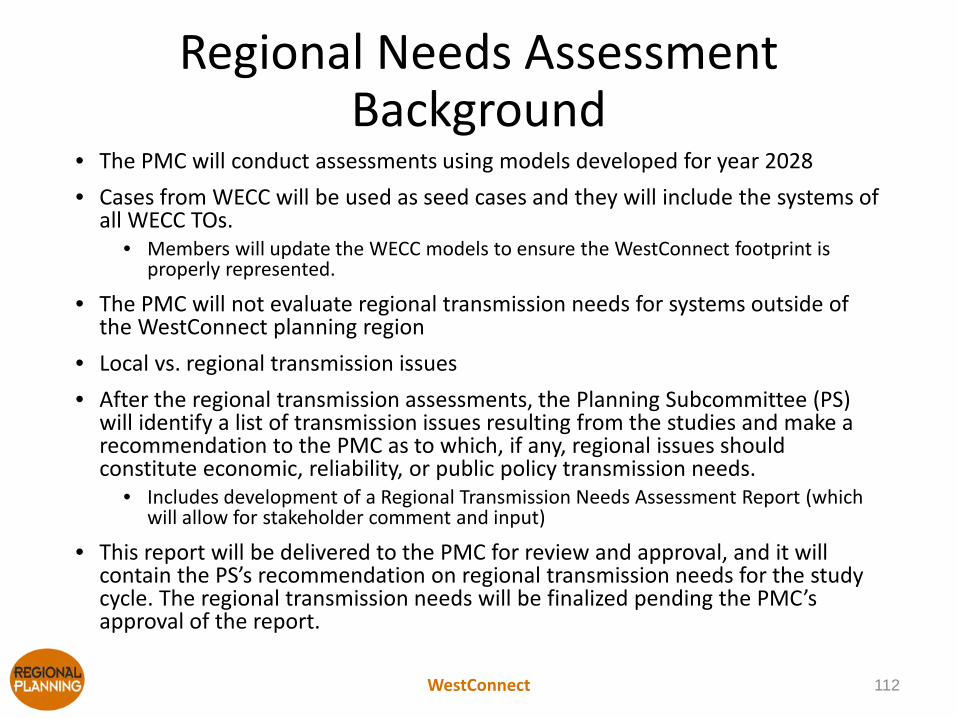
• The PMC will conduct assessments using models developed for year 2028 • Cases from WECC will be used as seed cases and they will include the systems of
all WECC TOs.• Members will update the WECC models to ensure the WestConnect footprint is
properly represented.
• The PMC will not evaluate regional transmission needs for systems outside of the WestConnect planning region
• Local vs. regional transmission issues• After the regional transmission assessments, the Planning Subcommittee (PS)
will identify a list of transmission issues resulting from the studies and make a recommendation to the PMC as to which, if any, regional issues should constitute economic, reliability, or public policy transmission needs.
• Includes development of a Regional Transmission Needs Assessment Report (which will allow for stakeholder comment and input)
• This report will be delivered to the PMC for review and approval, and it will contain the PS’s recommendation on regional transmission needs for the study cycle. The regional transmission needs will be finalized pending the PMC’s approval of the report.
WestConnect 112

Reliability Assessment
WestConnect Base Case Name Case Description WECC Seed Case
2028 Heavy Summer Summer peak load conditions during 1500 to 1700 MDT, with typical flows throughout the Western Interconnection.
2028 Heavy Summer (28HS1)
2028 Light Spring
Light load conditions with high wind and solar dispatch. Case includes new wind/solar capacityconsistent with what is planned by TOs or required by enacted public policy.
2028 Light Spring (28LSP1)
113
• Conducted to ensure the WestConnect planning region as a whole is in compliance with applicable North American Electric Reliability Corporation (NERC) standards and WECC regional criteria for the 2028 planning horizon.
• Assessment will include steady state contingency analysis and transient stability analysis.
• Transmission elements of 100 kV and above will be monitored for performance along with any Member specified lower voltage Bulk Electric System (BES) elements.

Economic Assessment
WestConnect Base Case Name Case Description WECC Seed Case
2028 Base Case
Business-as-usual, expected-future case with median load and hydro conditions and representation of resources consistent with enacted public policies.
WECC 2028 Anchor Data Set
114
• To create Base Case model, PS will initiate and coordinate a review of the data and assumptions contained within the WECC ADS dataset
• Assessment will include review of metrics such as congested hours and congestion cost for regional transmission elements greater than 100 kV and WECC transfer paths (or other defined interfaces in the WestConnect footprint) along with any Member specified lower voltage BES elements
• Regional transmission with significant congestion are identified and verified through Planning Subcommittee review, historical benchmarking, and follow-up study
• WestConnect will also conduct sensitivity studies on the 2028 Base Case

Public Policy Assessment• WestConnect begins evaluation by identifying a list of
enacted public policies that impact local TO (see study plan)• The regional base models will reflect the enacted public
policies• If the assessments identify regional issues that are related
to enacted public policy these may constitute a public policy-driven transmission need
• There is also an opportunity to make suggestions as to whether a TO’s policy-driven project may constitute a public policy-driven regional transmission need
• Stakeholders are invited to make a recommendation to the Planning Subcommittee
115

2018-19 Scenario Considerations
WestConnect 116

Scenario Status Summary• Scenario requests were collected in December 2017
– 8 Scenarios were submitted for 4 companies. These were reviewed and discussed by the PS.
– The PS has recommended to include a list of three scenarios in the draft 2018-19 study plan, motivated by concepts of increased RPS, lower carbon, and high CAISO export 117

2018-19 Draft Scenarios
WestConnect 118
1. Load Stress Study (Heavy Summer) Reliability study based on 2028 Heavy Summer case where regional peak load is
increased 10% and the load/gen imbalanced is filled with renewable capacity not dispatched in Base Case, or incremental renewable capacity if no headroom is available. Details of dispatch are TBD.
Purpose of analysis is to test robustness of Base Transmission Plan against potential changes in load and incremental dispatch of renewable resources. Will consider congestion/economic study if deemed useful.
2. CAISO Export Stress Study Reliability study based on regional model that will be adjusted based on CAISO
export conditions observed in regional production cost model. Alternatively, will seek guidance from CAISO on assumptions appropriate for export study.
Purpose of analysis is to evaluate reliability of regional system if power flows from the CAISO to WestConnect during CAISO overgeneration conditions
3. EV Load Stress Study Reliability study and/or economic study designed to evaluate the effects of high EV
penetration non the regional transmission system. Study scoping will determine the exact study scope. Study requires developing estimates for (1) EV penetration levels; (2) charging shape; (3) distribution of shape to loads for select conditions/hours. Option to test impact of different charging behaviors and their impact to the transmission system (reliability or congestion) and/or option to identify what penetration of EVs begin to substantially impact the reliability of the regional transmission system.

• Stakeholder/WPR comment period for draft 2018-19 Study Plan v3 will be February 17-March 1
– Comment window will be announced via email and will include instructions for submitting comments
• 2018-19 Study Plan will be finalized and approved by the PMC by the end of March
• The PS will then proceed with developing the regional planning models– More detail on this process will be provided in later agenda items
119
Next Steps

Interregional Transmission Project (ITP) Submittals
120
Charlie Reinhold, WestConnect Project Manager

Project Name Company Project Submitted To Relevant Planning Regions
Seeking Cost Allocation from
WestConnect
SWIP North Western Energy Connection, LLC
WestConnectCAISONTTG
WestConnectNTTG* Yes
Cross-Tie Project TransCanyon, LLCWestConnectCAISONTTG
WestConnect*NTTG Yes
TransWest Express TransWest Express, LLCWestConnectCAISONTTG
WestConnectCAISO*NTTG
Yes
HVDC Conversion Project San Diego Gas & Electric WestConnect
CAISOWestConnectCAISO* No
121
2016-17 Interregional Transmission Project Submittals
* = Indicates lead planning region
WestConnect did not identify any regional transmission needs in the 2016-17 regional planning cycle, and as such, did not evaluate any ITPs in 2016-17.

Proponents of an ITP for which WestConnect is a Relevant Planning Region must submit the project to WestConnect by March 31, 2018
Link to project submittal form $25k study deposit is not required at this stage
The project will need to be resubmitted following the needs identification stage of the 2018-19 planning cycle, at which time the study deposit is required
WestConnect has received no ITP submittals to-date
122
2018-19 ITP Submittals

Upcoming Meetings
123
WestConnect PS & PMC Meetings:• March 13-14, Salt Lake City, UT(Energy Strategies)• No CAS meeting, Next CAS meeting April 10, 2018
2018 WestConnect Stakeholder Meetings:• November 15, 2018, Tempe, AZ (tentative)

Additional Information Regarding the Regional Planning Process can be
Accessed at:www.WestConnect.com
124

Questions?
125
Presenter Contact Information: Charlie Reinhold, [email protected] Green, [email protected] Gearhart, [email protected] Moyer, [email protected]

2018-19 WestConnect Planning Activities
126

2018-19 Process Timeline
127
Today
ALLOCATECOSTS
DRAFT REGIONAL PLAN
MODEL DEVELOPMENT
STUDY PLANDEVELOPMENT
IDENTIFY REGIONAL NEEDS
PROJECT/NTA SUBMITTAL WINDOW
Nov Dec Jan Feb Mar Apr May Jun Jul Aug Sep Oct Nov Dec Jan Feb Mar Apr May JUN JUL AUG SEP OCT NOV DEC JAN FEB
SCENARIOSUBMITTALS
2018
EVALUATE & IDENTIFY
ALTERNATIVES
20192017 2020
3/31/2016ITP Submittal
Deadline(3/31/18)

2018-19 Schedule
WestConnect 128
Due Date Quarter 2018–2019 Activity
February 16, 2018 Q1 Draft Regional Study Plan posted to WestConnect website
February 14, 2018 Q1 WestConnect Stakeholder Meeting to present draft Regional Study Plan
February 22, 2018 Q1 Interregional Coordination MeetingMarch 14, 2018 Q1 Final Regional Study Plan approved by PMCMarch 31, 2018 Q1 Interregional Transmission Project (ITP) submittal deadlineSeptember 2018 Q3 Regional models finalizedDecember 2018 Q4 Regional transmission needs posted to WestConnect websiteDecember 2018 Q4 Stakeholder meeting to discuss identified regional needs
January 2019 Q5 Submittal window opens for projects to meet the posted regional needs. Submittal window lasts for no less than 30 days
September 2019 Q7 WestConnect posts listing of projects meeting an identified regional need selected for the purposes of cost allocation
November 2019 Q8 Draft Regional Plan posted to WestConnect website
November 2019 Q8 WestConnect meeting to discuss the draft Regional Plan with stakeholders
Two weeks following stakeholder meeting Q8 Stakeholder comments on draft Regional Plan due to
WestConnectDecember 2019 Q8 Final 2018–19 Regional Plan posted to WestConnect website

WestConnect Regional Model Development
129
Keegan Moyer, WestConnect Planning Consultant, Energy Strategies
Roy Gearhart, Planning Subcommittee Chair, WAPA

2018-19 Regional ModelsWestConnect Base
Case Name Case Description WECC Seed Case
2028 Heavy Summer Summer peak load conditions during 1500 to 1700 MDT, with typical flows throughout the Western Interconnection.
2028 Heavy Summer (28HS1)
2028 Light Spring
Light load conditions with high wind and solar dispatch. Case includes new wind/solar capacityconsistent with what is planned by TOs or required by enacted public policy.
2028 Light Spring (28LSP1)
130
Powerflow Models
WestConnect Base Case Name Case Description WECC Seed Case
2028 Base Case
Business-as-usual, expected-future case with median load and hydro conditions and representation of resources consistent with enacted public policies.
WECC 2028 Anchor Data Set
Production Cost Models
• Depending on the final scenarios selected for the Study Plan, WestConnectmay utilize the round trip to evaluate the reliability of the regional system under flows observed in the PCM dispatch (CAISO Export Stress Study)

131
Perform Regional Transmission Assessments
2016 Technical Schedule
Jan JanFeb Mar Apr May Jun Jul Aug Sep Oct Nov Dec
PMC Approve Study PlanPMC Approve
Regional Models
Finalize Study PlanStakeholder commentPMC comment
Develop Base Powerflow Model(s)
Develop Base Economic Model(s)
Develop Scenario Model(s)
Draft Model Development ReportStakeholder & PMC comment
Draft and Transmission Assessment ReportStakeholder & PMC comment
PMC Approve Regional Needs
2018 Technical Schedule

California ISO Public
California ISO Public
Annual Interregional Information2017-2018 Transmission Planning Process
Annual Interregional Coordination MeetingFolsom, CAFebruary 22, 2018

California ISO Public
California ISO Public
Introduction and OverviewDraft 2017-2018 Transmission Plan and transmission project approval recommendations

California ISO Public
2017-2018 Transmission Planning Process
March 2018April 2017January 2017
State and federal policy
CEC - Demand forecasts
CPUC - Resource forecasts and common assumptions with procurement processes
Other issues or concerns
Phase 1 – Develop detailed study plan
Phase 2 - Sequential technical studies • Reliability analysis• Renewable (policy-driven) analysis
• Economic analysis
Publish comprehensive transmission plan with recommended projects
ISO Board for approval of transmission plan
Phase 3 Procurement
Draft transmission plan presented for stakeholder
comment.

California ISO Public
2017-2018 Ten Year Plan Milestones Preliminary reliability study results were posted on August 15
Stakeholder session September 21st and 22nd
Comments received October 6 (slow response resource special study extended to October 10)
Request window closed October 15
Preliminary policy and economic study results and update on other issues November 16
Comments received November 30
Draft plan posted February 1, 2018
Comments due February 22
Revised draft for approval at March Board of Governor meeting
Page 135

California ISO Public
Planning and procurement overview
Create demand forecast & assess resource needs
CEC &CPUC
With input from ISO, IOUs & other stakeholders
Creates transmission planISO
With input from CEC, CPUC, IOUs & other stakeholders Creates procurement
planCPUC
1
2
3
feed into
With input from CEC, ISO, IOUs & other stakeholders
4
IOUs
Final plan authorizes procurement
Results of 2-3-4 feed into next biennial cycle
feed into

California ISO Public
Slide 137
Development of 2017-2018 Annual Transmission Plan
Reliability Analysis(NERC Compliance)
33% RPS Portfolio Analysis- Incorporate GIP network upgrades- Identify policy transmission needs
Economic Analysis- Congestion studies- Identify economic
transmission needs
Other Analysis(LCR, SPS review, etc.)
Results

California ISO Public
Emphasis in the transmission planning cycle:• A modest capital program, as:
• Reliability issues are largely in hand, especially with load forecasts declining from previous years and behind the meter generation forecasts increasing from previous projections
• Policy work was largely informational as we await actionable renewable portfolio policy direction regarding moving beyond 33% (for approvals)
• Modestly-sized economic–driven projects emerging as evolving industry circumstances create some new opportunities
• A major effort in this third and final year of the programmatic review of previously-approved projects
• Preferred resources and transmission upgrades playing a critical role in the integrated solutions in several areas
• Emerging issues continuing to drive re-thinking on how we study and assess transmission system issues
Page 138

California ISO Public
Consideration of the impacts of behind the meter photovoltaic generation on load shapes – and shifting the time of load peaks to later in the day – is evolving:• In CED 2015 (2016-2026 Forecast), the CEC determined
peak loads through downward adjustments to the traditional mid-day peak loads and acknowledged the issue of later-day peaks. In the 2016-2017 planning cycle the ISO conducted is own sensitivities
• In CEDU 2016 (2017-2027), the CEC provided sensitivities of later day peaks. The ISO used those sensitivities in this 2017-2017 planning cycle to review previously-approved projects, but not as the basis for approving new projects
• Through CED 2017 (2018-2028) the ISO is anticipating hourly load shapes
Page 139

California ISO Public
The ISO’s reliability analysis led to the following:
Page 140
• 12 new reliability projects are recommended – firming up the February 1 posted plan
• In the PG&E service territory ,19 previously-approved projects are recommended to be canceled and 21 have been re-scoped, paring over $2.7 billion from current estimates. 6 have been identified as needing further review
• Two previously-approved projects in the SDG&E service territory are recommended to be canceled

California ISO Public
Policy-driven analysis for approval purposes was not needed - no policy-driven approvals are recommended Portfolio direction received from the CPUC and CEC on June
13, 2016:“Recommend reusing the "33% 2025 Mid AAEE" RPS trajectory portfolio that was used in the 2015-16 TPP studies, as the base case renewable resource portfolio in the 2016-17 TPP studies”“Given the range of potential implementation paths for a 50 percent RPS, it is undesirable to use a renewable portfolio in the TPP base case that might trigger new transmission investment, until more information is available”
This policy direction remained in place for the 2017-2018 transmission planning cycle
Portfolios used in the ISO’s informational 50% RPS special studies and evaluation of interregional projects were provided by CPUC staff
Page 141

California ISO Public
The ISO is recommending a number of economic-driven projects:
• One – in the VEA service territory – provides production simulation benefits
• One – in the Imperial Valley area – provides both local capacity requirement reduction benefits and production simulation benefits
• Two – in the East Bay/Moss Landing Sub-area – focus on reducing local capacity requirements in the area
Slide 142

California ISO Public
Status of proposal to add Phasor Measurement Units (PMUs) to all CAISO Interties:
• In November 2017, the ISO introduced the proposal that PMUs be added to all ISO intertie transmission faculties to other balancing areas
• Phasor measurement units will enhance accuracy of measurements to demonstrate compliance with NERC Reliability Standard BAL-003-1.1
• The ISO must meet frequency response obligation based on net actual interchange measurements
The ISO is continuing to refine the scope of the effort and will bring forward a recommendation in the future
Page 143

California ISO Public
Special studies performed as part of the 2017-2018 planning process will help inform future studies• The six special studies conducted in 2017 have been
summarized in the 2017-2018 Transmission Plan – Interregional Transmission Project (ITP) Evaluation and 50%
RPS Out-of-State Portfolio Assessment (extension of 2016-2017 studies)
– Risks of early economic retirement of gas fleet (extension of 2016-2017 studies)
– Benefits analysis of large energy storage (extension of 2016-2017 studies)
– Frequency response assessment
– Gas/Electric coordination special study
– Characteristics of slow response local capacity resources
Page 144
California ISO Public
The ISO Board has approved the proposal to remove the conceptual statewide plan requirement• Since 2010, the ISO has prepared and published the statewide plan
as part of its annual planning process, initially developed to facilitate coordination with the California Transmission Planning Group (CTPG)
• Implementation of FERC Order No. 1000 has supplanted the need to develop the statewide plan– CTPG is no longer functioning and its members are focused on regional
planning through Order 1000– The statewide plan no longer facilitates the coordination function it was
intended to provide– ISO developing the plan on its own diverts resources away from Order
1000 activities• After an ISO stakeholder process in May and June, the ISO Board
approved the proposal on July 26.• The change was filed with FERC on August 26 and we are awaiting
a decisionSlide 145

California ISO Public
California ISO Public
Economic AssessmentDraft 2017-2018 Transmission Plan and transmission project approval recommendations

California ISO Public
Overview of economic planning methodology
• ISO’s economic planning study follows the updated TEAM documentation updated in 2017
• Study approach:
Page 147
Power System analyses (production cost simulation, power flow studies, etc.) with and
without network upgrade under study
Production benefits
Other benefits
Total benefits
Benefit to cost ratio (BCR)
Total cost (revenue requirement) estimation and calculation

California ISO Public
• Database development with more accurate representation of network models– Identical network models for the ISO system in PCM and in the
reliability power flow cases • Transmission topology, generator location, load distribution
– Load modifiers were modeled as generators at the locations as in power flow cases
– Coordinated with other regions to update their system models
• Most recently updated operational data and models– Updated solar profiles (in collaboration with WPR ADS process)
with higher granularity based on NREL measurements– Updated thermal unit ramp rates based on industry average– IV PFC dispatchable
Page 148
Overview of ISO’s planning PCM development and enhancement (cont.)

California ISO Public
Summary and recommendations
Congestion or study area
Production benefit ($M)
Capacity benefit ($M)
Estimated total cost ($M)
Economic justification
S-Line 40 85~110 46~72 YesBob SS-Mead S 180 Not applicable 37 YesSan Diego North 27 Not applicable 101~116 NoSouth Bay-Moss Landing area
Not applicable 400-600 MW LCR benefit
$14 Yes
Page 149
Four upgrades were found to be needed as economic-driven projects in the 2017-2018 planning cycle:- S-Line Upgrade- Bob SS to Mead S 230 kV Line Upgrade, - South Bay-Moss Landing enhancements comprising of the San
Jose-Trimble 115 kV series reactor and the Moss Landing–Panoche 230 kV Path Upgrade
California ISO Public
California ISO Public
Special Study Frequency Response Assessment-Generation Modeling

California ISO Public
Frequency Response Studies
Frequency response studies performed in the previous Transmission Plans showed optimistic results
Actual measurements of the generators’ output were lower that the generators’ output in the simulations
Therefore models update and validation is needed
After improvement of models, more frequency studies will be performed
Slide 151

California ISO Public
Update of Generator Models
The ISO reviewed, and identified issues with dynamic stability models for multiple units
Issues Missing models Suspicious models Models with generic parameters Models no longer approved by WECC
Currently working with the PTOs to get results from generator testing and improve the models
Challenges: Challenges in getting fully validated models from generation
owners Difference between NERC Standards and WECC Policy on
generator testing
Slide 152

California ISO Public
Standards on Generator Testing
NERC dynamic data related compliance (MOD-26 and MOD-27) applies to the following to Western Interconnection Individual generating unit greater than 75 MVA (gross nameplate
rating) Individual generating plant consisting of multiple generating units
that are directly connected at a common BES bus with total generation greater than 75 MVA (gross aggregate nameplate rating)
WECC Policy applies to Generating facilities connected to the Western Electricity
Coordinating Council (WECC) transmission grid at 60 kV or higher voltage (both new and existing, synchronous and non-synchronous) with single unit capacity of 10 MVA and larger, or facilities with aggregate capacity of 20 MVA and larger
Slide 153

California ISO Public
Stay connected
Page 154
Sign up for theDaily Briefing at www.caiso.com
Download ISO Todaymobile app
@California_ISO
Questions?

California ISO Public
California ISO Public
Interregional Transmission Project (ITP) Evaluation and 50% RPS Out-of-State Portfolio Assessment
California ISO Public
An information-only study performed as a continuation of 2016-2017 Transmission Planning Process

California ISO Public
Continuation of the information-only 50% RPS special study (2016-2017 TPP)
The 2016-2017 50% RPS study focused on
Investigating the transmission impacts of moving beyond 33 percent RPS requirements in California;
Testing the transmission capability estimates used in RPS calculator v6.2 and where appropriate, updating these transmission capability estimates; and
Investigating transmission implications on in-state facilities of meeting part of California’s 50 percent RPS requirement by assuming California’s procurement of 2000 MW of wind resources in Wyoming and 2000 MW of wind resources in New Mexico.
Page 156
Context

California ISO Public
Portfolios provided by the CPUC; the Out-of-state portfolio shows a shift to higher WY and NM wind
Note - RPS calculator v6.2 was used to generate the portfoliosPage 157
In-state FCDS In-state EODS Out-of-state FCDS/EODS
Portfolio In-state FCDS In-state EODS OOS EODS/FCDS
MW Capacity 14,842 14,814 11,093
Context

California ISO Public
Findings from 2016-2017 out-of-state portfolio assessment helped us identify three action items
Three action items identified based on ISO’s analysis and stakeholder feedback –1. Refining the assumptions and models 2. Using the out-of-state portfolio to test ITP evaluation framework in preparation for the next
planning cycles; and3. Exploring a way to capture the Available Transmission Capacity (ATC) for out-of-state RPS
resourcesPage 158
Assessment Key findings pertaining to OOS portfolio (2016-2017 50% special study)
Production Cost Simulation
• Curtailment: OOS portfolio showed the lowest curtailment • Transmission congestion: OOS portfolio showed the least amount of intra-CA
congestion• Further coordination is expected on stressed scenario identification and reviewing
study results
Reliability Assessment
• OOS portfolio was the least severe one• No major issues in the Northern CA system due to lower amount of resource
selection• One potential issue in Southern CA observed in all portfolios• The snapshots identified with CA transmission in mind were not the most stressed
ones for the system outside of CA
Deliverability• Evaluated the need for MIC expansion and found that adequate import capacity
exists to deliver OOS resources (NM and WY) from injection point into CAISO BA to CAISO loads
Context

California ISO Public
Regional coordination efforts resulted in model refinement and contingency list creation
• Considered the four ITPs submitted to the planning regions in 2016
• Received input from WestConnect and NTTG about the location and size of wind resources in NM and WY respectively
• WPRs provided input regarding transmission topology enhancements in alignment with the ongoing WECC Anchor Data Set work
• Shared power flow models with WPRs and received feedback• Shared contingency files with ColumbiaGrid, WestConnect and
NTTG; the WPRs provided crucial information regarding additional contingencies to be tested
• APS and NV Energy provided specific input regarding contingencies to be tested
Page 159
Context

California ISO Public
Test the system outside of CA using OOS portfolio and leverage the findings to gain insights about ITPs
Page 160
Objectives
California ISO Public
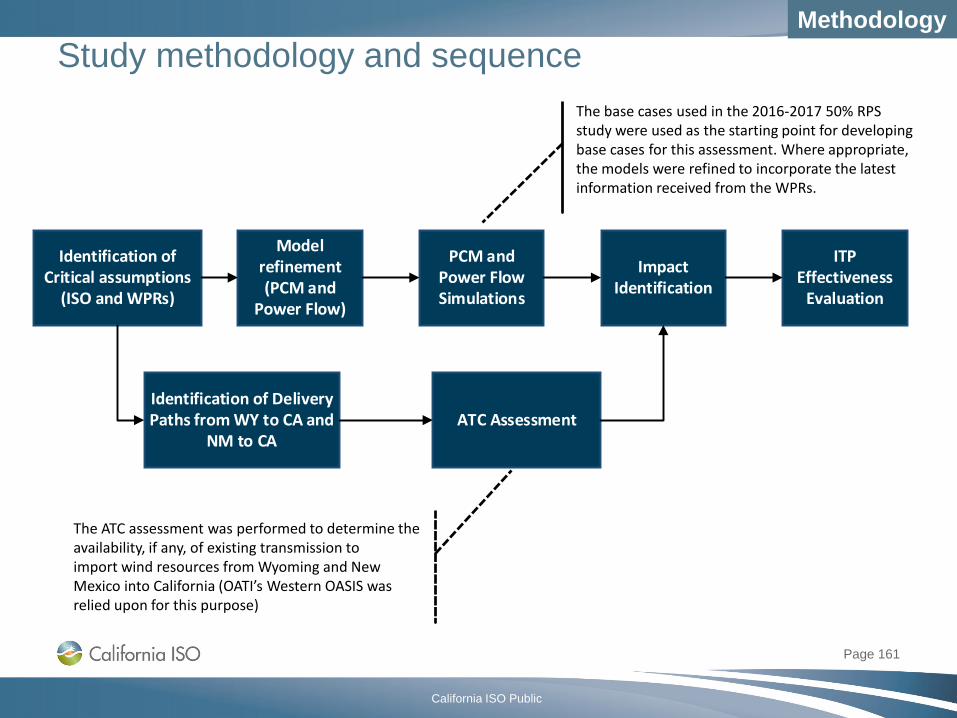
Study methodology and sequence
Page 161
Identification of Critical assumptions
(ISO and WPRs)
Model refinement (PCM and
Power Flow)
PCM and Power Flow Simulations
Impact Identification
ITP Effectiveness
Evaluation
Identification of Delivery Paths from WY to CA and
NM to CAATC Assessment
The base cases used in the 2016-2017 50% RPS study were used as the starting point for developing base cases for this assessment. Where appropriate, the models were refined to incorporate the latest information received from the WPRs.
The ATC assessment was performed to determine the availability, if any, of existing transmission to import wind resources from Wyoming and New Mexico into California (OATI’s Western OASIS was relied upon for this purpose)
Methodology

California ISO Public
Study ComponentsITP-out-of-state 50% portfolio assessment
PCM simulations Power flow and stability studies ATC assessment
Page 162
The expected outcome of PCM simulations was:
• Extent of curtailment of out-of-state renewables
• Identification of transmission constraints outside of California that may results in significant amount of congestion when delivering wind resources from WY and NM to CAISO BAA
• Stressed snapshot identification for the purpose of power flow studies
• Impact of ITPs on PCM results
• Power flow studies were performed in order to (i) identify additional transmission limitations that may not be captured by PCM studies and (ii) to confirm the transmission system limitations identified by PCM simulation and (iii) capture the impact of ITPs
• The 8,760 hours of snapshots created during PCM simulations were used to identify high transmission system usage patterns to be tested using the power flow models for reliability assessment.
• Contingency assessment was performed with a focus on the system outside of California
• The ISO tested for ATC adequacy for delivering renewable resources from Wyoming and New Mexico to the ISO BAA
• At a conceptual level, this effort can be viewed as a “loose” proxy for testing “deliverability” of these out-of-state resources
• However, the ISO believes it reasonable to assume that large out-of-state resource installations cannot serve California load without viable long-term firm transmission service from the point of receipt to the CAISO BAA boundary
Methodology

California ISO Public
Key modeling enhancements and topology/resource assumptions
Page 163
Resource Assumptions
Topology Assumptions
In-state RPS resources
Out-of-state RPS resources
All other resources
Planned transmission within ISO
Planned transmission
outside of ISO
• No change to in-state RPS• WY and NM RPS resources identified in
the out-of-state portfolio• Additional wind resources identified in
WY as part of PacifiCorp’s IRP (~1,100 MW)
• Minor generation adjustments per the latest WPR ADS seed case (as of May 2017)
Starting study model: 2016-2017 TPP 50% RPS out-of-state portfolio case
• Modeled projects approved in the 2016-2017 TPP
• Relied on the information received from the Anchor Data Set work being performed by WPRs
• Gateway Energy Project• SunZia Project
Assumptions

California ISO Public
Overview of Production Cost Model for ITP studies
• Started from the PCM for OOS 50% portfolio in 2016/17 planning cycle
• Updated ISO’s network model to reflect the changes identified in 2017/2018 planning cycle reliability assessment
• Updated WPR ( NTTG, WestConnect, and ColumbiaGrid) system models based on recommendations of the corresponding planning regions
• Load forecast and NG/CO2 prices remained the same as in the last planning cycle
• WY local 230 kV line limits were not enforced
Page 164
Production Cost Simulation

California ISO Public
Page 165
ATC AssessmentStakeholders raised a question about the availability of ATC outside of California
• OATI’s webSmartOASIS system was utilized to extract ATC data• Transmission Offering Summary in OASIS was utilized; this is what each Transmission
Provider(TP) has submitted as available on a facility over a particular timeframe• We looked for the active offerings in the first month of 2027 as a proxy for long-term
availability
Used the Common Western OASIS map to identify discrete scheduling points i.e. PODs (Points of Delivery) and PORs (Points of Receipt) of interest along these paths
Identified major transmission paths that establish a link from WY and NM to CA
Utilized the Transmission Offering Summary from webSmartOASIS system to extract firm, point-to-point, yearly ATC entries submitted by corresponding TPs
Pieced together the representative ATC numbers to gauge the long term availability of firm transmission along the path from WY and NM to CA

California ISO Public
Page 166
1. The ISO renewable curtailment did not show a noticeable reduction after adding any of the ITPs.
2. Relaxation of ISO Net Export Limit resulted in almost zero renewable curtailment. This indicates that the renewable curtailment under 2,000 MW ISO Net Export scenario is not primarily related to transmission congestion.
3. ITPs show a variation in transmission congestion performance. It is important to note that this congestion is driven by overall dispatch which includes non-renewable resource
1. Power flow performance of TWE, SWIP-N (with Gateway West) and Cross-tie (with Gateway South) is comparable
2. SWIP-N and Cross-tie projects without the corresponding Gateway segments do not provide much thermal relief when delivering resources from WY to CA
3. REX HVDC project does not greatly impact power flow performance when delivering resources from NM to CA
1. ATC assessment shows severe shortage of contractual capacity to deliver WY and NM resources to CA over the existing transmission system
2. TWE would provide ~1,500 MW of ATC from Southwestern WY to Southern CA
3. SWIP-N and Cross-tie would rely corresponding segments of Gateway project and some existing facilities to establish ~1,500 MW ATC between WY and CA
4. REX HVDC would not add ATC at the most constrained locations along the NM to CA path
Summary
Summary of Findings
PCM simulations Power flow studies ATC assessment
California ISO Public
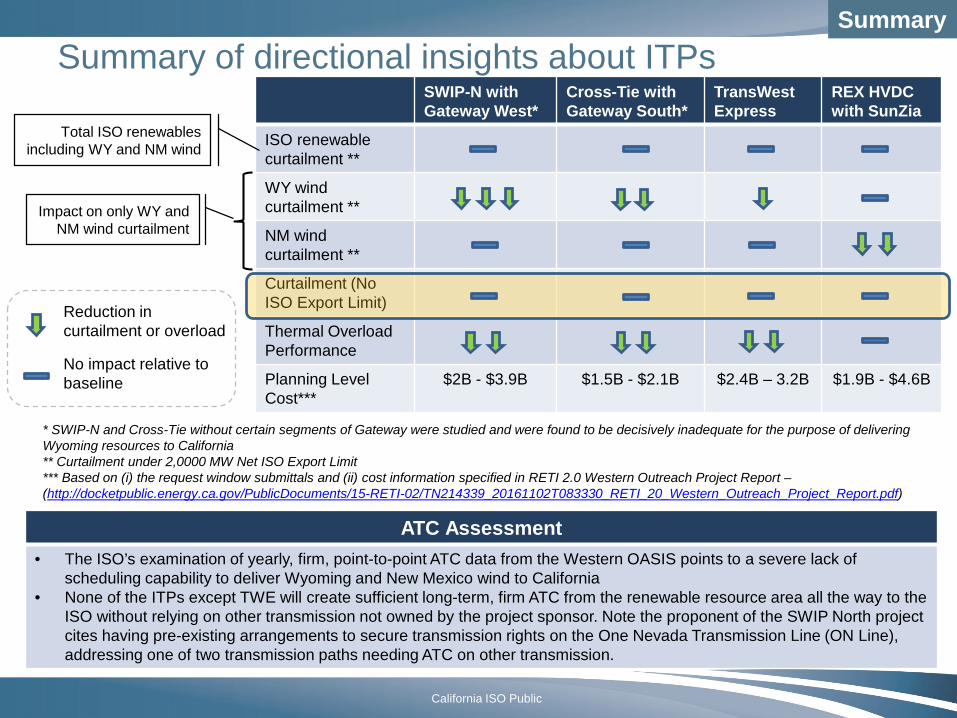
Summary of directional insights about ITPs
Page 167
SWIP-N with Gateway West*
Cross-Tie with Gateway South*
TransWest Express
REX HVDC with SunZia
ISO renewable curtailment **
WY wind curtailment **
NM wind curtailment **
Curtailment (No ISO Export Limit)
Thermal Overload Performance
Planning Level Cost***
$2B - $3.9B $1.5B - $2.1B $2.4B – 3.2B $1.9B - $4.6B
ATC Assessment• The ISO’s examination of yearly, firm, point-to-point ATC data from the Western OASIS points to a severe lack of
scheduling capability to deliver Wyoming and New Mexico wind to California• None of the ITPs except TWE will create sufficient long-term, firm ATC from the renewable resource area all the way to the
ISO without relying on other transmission not owned by the project sponsor. Note the proponent of the SWIP North project cites having pre-existing arrangements to secure transmission rights on the One Nevada Transmission Line (ON Line), addressing one of two transmission paths needing ATC on other transmission.
* SWIP-N and Cross-Tie without certain segments of Gateway were studied and were found to be decisively inadequate for the purpose of delivering Wyoming resources to California** Curtailment under 2,0000 MW Net ISO Export Limit*** Based on (i) the request window submittals and (ii) cost information specified in RETI 2.0 Western Outreach Project Report –(http://docketpublic.energy.ca.gov/PublicDocuments/15-RETI-02/TN214339_20161102T083330_RETI_20_Western_Outreach_Project_Report.pdf)
Reduction in curtailment or overload
No impact relative to baseline
Total ISO renewables including WY and NM wind
Impact on only WY and NM wind curtailment
Summary

California ISO Public
Attributes requiring further consideration given the differing nature of the projects and dependencies:
• How the transmission would be procured – interregional project, regional project, or component of generation procurement?
• Arrangements with other non-ISO transmission owners for capacity, and for development of non-ISO transmission
• Costs and cost responsibilities
• Staging and sequencing of transmission and generation resources
Page 168
Next Steps

California ISO Public
Recommendations for next steps
• Utilize the results obtained from this study for future out-of-state RPS portfolio creation
• Create a framework for accounting for interdependencies of ITPs and other non-ITP infrastructure projects while evaluating ITPs
• Incorporate ATC assessment as part of the ITC evaluation framework for future ITP RW submittals
• Explore further the other attributes that would be taken into account in selecting a “preferred” project to access out of state wind resources
Page 169
Next Steps

California ISO Public
Focus in 2018-2019 Transmission Planning Cycle:
• Focus on renewable integration issues – both in-front-of and behind-the-meter resources
• A major economic study being focused on local capacity areas• Special studies targeting:
• ISO support for CPUC proceeding re Aliso Canyon• Potential for increasing opportunities for transfers of low carbon
electricity with the PAC Northwest, and for PAC Northwest Hydro to play role in reducing dependence on resources impacted by Aliso Canyon
• Interregional projects will be addressed as per tariff-defined processes:• The ISO is not planning additional “special study” efforts at this time
focusing on out-of-state renewables given the recently completed studies spanning the 2016-2017 and 2017-2018 planning cycles.
Page 170

California ISO Public
Stay connected
Page 171
Sign up for theDaily Briefing at www.caiso.com
Download ISO Todaymobile app
@California_ISO
Questions?

California ISO Public
California ISO Public
ITP Suggestions and Open Discussion of WPR Planning Activities
Page 172
TransWest Express Transmission Project 2018 Interregional Transmission Project SubmittalsDC Project and AC & DC Project Configurations
Annual Interregional Transmission Coordination Meeting
Folsom, CaliforniaFebruary 2018

174
TransWest ExpressTransmission Project Route

Wind Resources Within WECC and Existing Transmission Capacity
• Highest-quality wind resources in the U.S. are located in the Rocky Mountain Region in Wyoming
• Transmission studies have identified a lack of transmission to connect California to this resource
• Economic studies have shown wind resources plus the cost of transmission provides a diversity and cost benefit if added to California RPS portfolios
175

Same as ITP submittal in 2016
2022 in-service date
730-mile, 600 kV DC from WY (Platte-Latham) to NV (Eldorado Valley)
1,500 MW Initial Accepted Rating, 3,000 MW Ultimate Rating
Relevant Regional Planning Groups: CAISO, WestConnect(multiple) and NTTG (PacifiCorp)
Seek Cost Allocation: CAISO, possibly WestConnect
176
TransWest Express DC Project
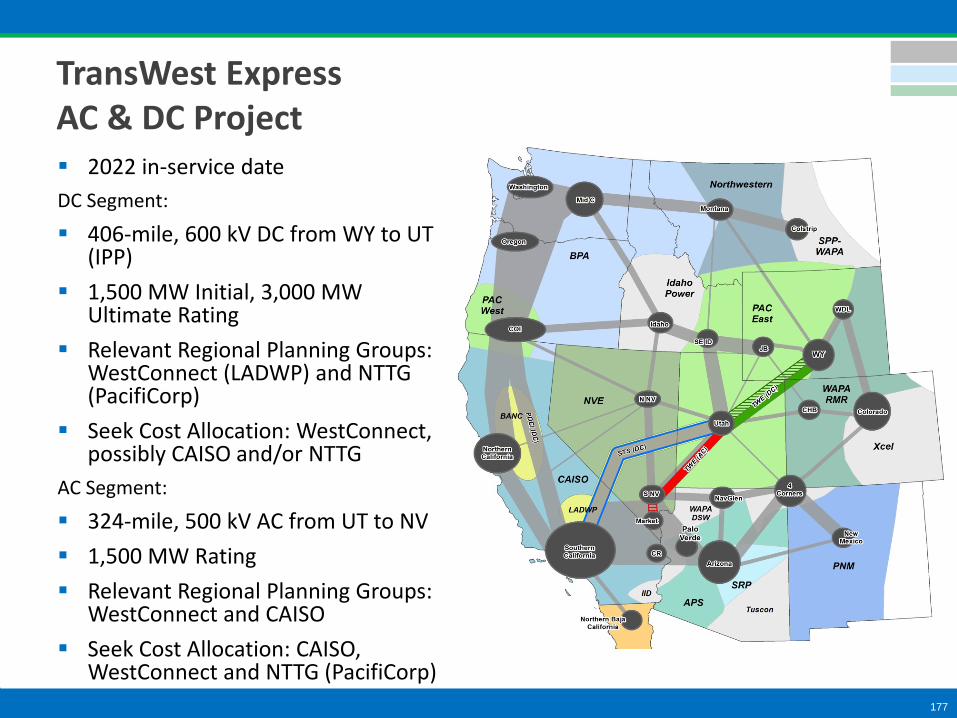
2022 in-service date DC Segment:
406-mile, 600 kV DC from WY to UT (IPP)
1,500 MW Initial, 3,000 MW Ultimate Rating
Relevant Regional Planning Groups: WestConnect (LADWP) and NTTG (PacifiCorp)
Seek Cost Allocation: WestConnect, possibly CAISO and/or NTTG
AC Segment:
324-mile, 500 kV AC from UT to NV 1,500 MW Rating Relevant Regional Planning Groups:
WestConnect and CAISO Seek Cost Allocation: CAISO,
WestConnect and NTTG (PacifiCorp)177
TransWest Express AC & DC Project

TWE Project Wyoming Interconnection
178
Southern Wyoming, from WECC 2017 Planned Facilities Map, January 2017
Gateway West D.3+ Gateway
West D.2
Gateway South
TransWestExpress

Advanced Permittingand Development Status
Significant Milestones
Nevada PUC UEPA Permit –September 2015
Bureau of Land Management Record of Decision (ROD) –December 2016
Western Area Power Administration ROD –January 2017
BLM Right-of-Way Grant –June 2017
Ongoing/Planned Activities
Private ROW Easements –2017-18
Wyoming Industrial Siting Permit – 2018
County Permits – 2018-19
Agency Notice to Proceed (Construction Start) – 2018 (2019)
179

For More Information www.transwestexpress.net
David SmithDirector of Engineering and OperationsTransWest Express [email protected]

California ISO Public
California ISO Public
WPR Coordination of Planning Data and Information through the ADS
Page 181

NTTG Use of ADS in 2018-2019 Biennial Cycle
Presented by Ron Schellberg, NTTG TWG Project Manager
Annual Interregional Coordination MeetingFolsom, CA
February 22, 2018

NTTG Use of 2028 ADS in Studies
• The ADS forms the basis for its studies, subject to:– A consistency check with the Prior Regional Transmission Plan (pRTP)
and Quarter 1 data submittals (due March 31st)– There are known differences between the 28hs1a Powerflow case
which is the basis of the 2028 ADS and the pRTP• Mostly missing resources, but there may be also bulk transmission addition difference
as well.
• Change files will be developed in layers to track recommended changes to draft ADS (delivered in March 2018) that should be incorporated into the Final 2028 ADS (delivered in June 2018), for example:– Layer 1 – Missing resources and transmission missing from draft ADS
based upon pRTP– Layer 2 – Changes necessary to reflect Q1 Data submittals
183

NTTG Use of 2028 ADS in Studies• Studies are performed and managed by the Technical
Workgroup, comprised of NTTG members with study expertise. The Technical Workgroup reports to the NTTG Planning Committee.
• NTTG will review and validate modified ADS prior to performing studies
• Typically, NTTG will select 6+ conditions for study, which may include:– Heavy Summer Peak NTTG loads– Heavy Winter Peak NTTG Loads– Selected stressed path conditions:
• Colstrip System• Tot 2 with North-to-South flows• Low/High renewable production (no change in installed capacity) 184

• NTTG will use the ADS to extract study seed conditions for its studies– These seed conditions may need to be adjusted to
meet the study objectives. Examples:• Heavy Summer and Winter NTTG co-incident loads will be
scaled from 1 in 2 to 1 in 5 and/or 1 in 10 probability• Adjust interchange/resource dispatch to meet path flow
targets.
• NTTG will study a subset of these conditions using today’s network topology (Null Case)
185
NTTG Use of 2028 ADS in Studies

• NTTG typically analyzes each condition with over 400 single and credible double contingencies.
• NTTG depending on contingency results, additional dynamic simulations may be performed.
• Results will be tabulated or displayed in heat-map form in a manor that does not expose CEII
• Studies will begin in July and a draft study report will be drafted and available by the end of the year.
186
NTTG Use of 2028 ADS in Studies

Questions and Discussion
187

California ISO Public
Stay connected
Page 188
Sign up for theDaily Briefing at www.caiso.com
Download ISO Todaymobile app
@California_ISO
Meeting Conclusion
Review of key points, action items and assignments
Closing remarks, next meeting and adjourn