california board of registered nursing - … board of registered nursing ... a presentation of...
TRANSCRIPT

1
California Board of Registered Nursing 2014-2015 Annual School Report
Data Summary and Historical Trend Analysis
A Presentation of Pre-Licensure Nursing Education Programs in California
July 12, 2016
Prepared by: Lisel Blash, MPA Dennis Keane, MPH Joanne Spetz, PhD University of California, San Francisco 3333 California Street, Suite 265 San Francisco, CA 94118

2
Table of Contents
PREFACE ......................................................................................................................................................3
NURSING EDUCATION SURVEY BACKGROUND ...............................................................................................3 ORGANIZATION OF REPORT ..........................................................................................................................3 AVAILABILITY OF DATA .................................................................................................................................3 VALUE OF THE SURVEY ................................................................................................................................3 SURVEY PARTICIPATION ...............................................................................................................................4
DATA SUMMARY AND HISTORICAL TREND ANALYSIS ........................................................................5
TRENDS IN PRE-LICENSURE NURSING PROGRAMS ........................................................................................5 Number of Nursing Programs .......................................................................................................................... 5 Admission Spaces and New Student Enrollments ....................................................................................... 6 Student Census Data ........................................................................................................................................ 9 Student Completions ........................................................................................................................................ 9 Retention and Attrition Rates ......................................................................................................................... 10 Retention and Attrition Rates for Accelerated Programs .......................................................................... 11 NCLEX Pass Rates ......................................................................................................................................... 12 Employment of Recent Nursing Program Graduates ................................................................................ 13 Clinical Training in Nursing Education ......................................................................................................... 14 Clinical Space & Clinical Practice Restrictions ........................................................................................... 18 Faculty Census Data ...................................................................................................................................... 23
SUMMARY ................................................................................................................................................ 25
APPENDICES ............................................................................................................................................ 26
APPENDIX A – LIST OF SURVEY RESPONDENTS BY DEGREE PROGRAM .................................................... 26 APPENDIX B – BRN EDUCATION ISSUES WORKGROUP MEMBERS............................................................ 28
3
PREFACE
Nursing Education Survey Background
Development of the 2014-2015 Board of Registered Nursing (BRN) School Survey was the work of
the Board's Education Issues Workgroup, which consists of nursing education stakeholders from
across California. A list of workgroup members is included in the Appendices. The University of
California, San Francisco was commissioned by the BRN to develop the online survey instrument,
administer the survey, and report data collected from the survey.
Funding for this project was provided by the California Board of Registered Nursing.
Organization of Report
The survey collects data about nursing programs and their students and faculty from August 1
through July 31. Annual data presented in this report represent August 1, 2014 through July 31,
2015. Demographic information and census data were requested for October 15, 2015.
Data from pre- and post-licensure nursing education programs are presented in separate reports
and will be available on the BRN website. Data are presented in aggregate form and describe
overall trends in the areas and over the times specified and, therefore, may not be applicable to
individual nursing education programs.
Statistics for enrollments and completions represent two separate student populations. Therefore, it is
not possible to directly compare enrollment and completion data.
Availability of Data
The BRN Annual School Survey was designed to meet the data needs of the BRN as well as other
interested organizations and agencies. A database with aggregate data derived from the last ten
years of BRN School Surveys will be available for public access on the BRN website. Parties
interested in accessing data not available on the website should contact Julie Campbell-Warnock at
the BRN at [email protected].
Value of the Survey
This survey has been developed to support nursing, nursing education and workforce planning in
California. The Board of Registered Nursing believes that the results of this survey will provide data-
driven evidence to influence policy at the local, state, federal and institutional levels.
The BRN extends appreciation to the Education Issues Workgroup and all survey respondents.
Your participation has been vital to the success of this project.

2014-2015 BRN Annual School Report
University of California, San Francisco 4
Survey Participation1
All California nursing schools were invited to participate in the survey. In 2014-2015, 132 nursing
schools offering 142 pre-licensure programs approved by the BRN to enroll students responded to
the survey. A list of the participating nursing schools is provided in the Appendix.
Table 1. RN Program Response Rate
1 In this 2015 report there are 132 schools in California that offer a pre-licensure nursing program. Some nursing schools offer more than one program, which is why the number of programs (n=142) is greater than the number of schools.
Program Type # Programs Responded
Total # Programs
Response Rate
ADN 83 83 100%
LVN to ADN 7 7 100%
BSN 36 36 100%
ELM 16 16 100%
Total programs 142 142 100%
2014-2015 BRN Annual School Report
University of California, San Francisco 5
DATA SUMMARY AND HISTORICAL TREND ANALYSIS
This analysis presents pre-licensure program data from the 2014-2015 BRN School Survey in
comparison with data from previous years of the survey. Data items addressed include the number
of nursing programs, enrollments, completions, retention rates, NCLEX pass rates, new graduate
employment, student and faculty census data, the use of clinical simulation, availability of clinical
space, and student clinical practice restrictions.
Trends in Pre-Licensure Nursing Programs
Number of Nursing Programs
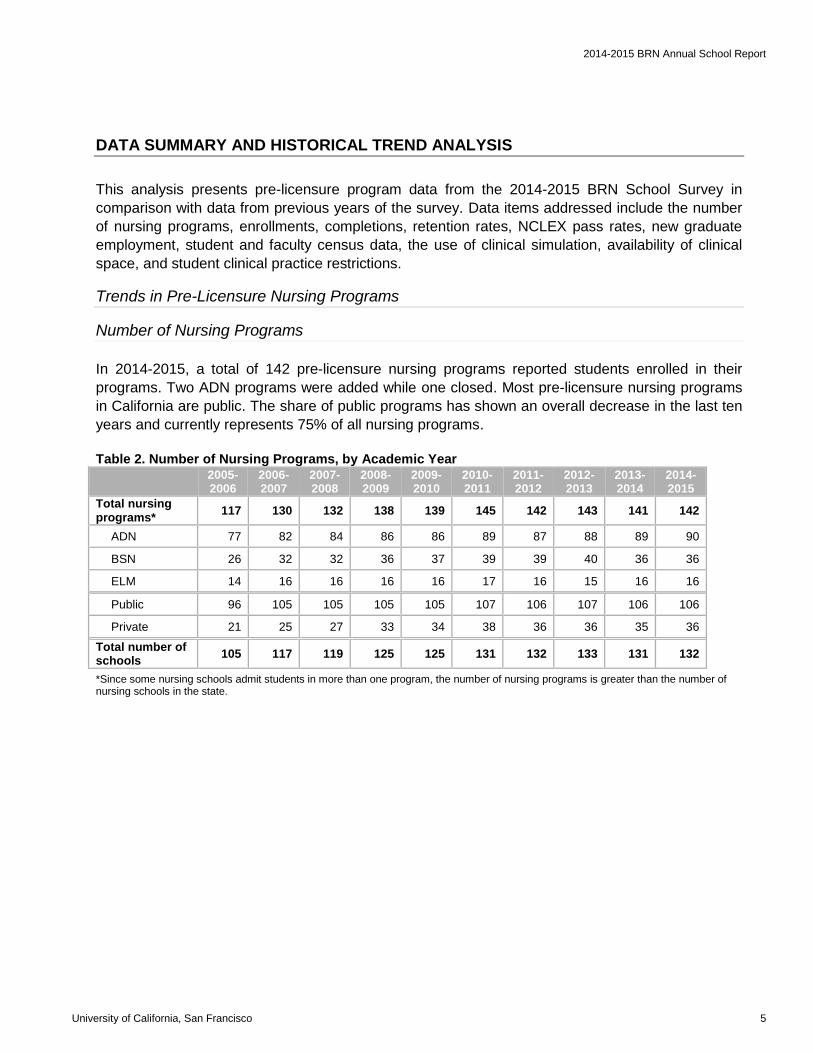
In 2014-2015, a total of 142 pre-licensure nursing programs reported students enrolled in their
programs. Two ADN programs were added while one closed. Most pre-licensure nursing programs
in California are public. The share of public programs has shown an overall decrease in the last ten
years and currently represents 75% of all nursing programs.
Table 2. Number of Nursing Programs, by Academic Year
2005-2006
2006-2007
2007-2008
2008-2009
2009-2010
2010-2011
2011-2012
2012-2013
2013-2014
2014-2015
Total nursing programs*
117 130 132 138 139 145 142 143 141 142
ADN 77 82 84 86 86 89 87 88 89 90
BSN 26 32 32 36 37 39 39 40 36 36
ELM 14 16 16 16 16 17 16 15 16 16
Public 96 105 105 105 105 107 106 107 106 106
Private 21 25 27 33 34 38 36 36 35 36
Total number of schools
105 117 119 125 125 131 132 133 131 132
*Since some nursing schools admit students in more than one program, the number of nursing programs is greater than the number of nursing schools in the state.

2014-2015 BRN Annual School Report
University of California, San Francisco 6
The share of nursing programs that partner with another nursing school that offers a higher degree
has been increasing since 2007-2008. In 2014-2015, 49% of nursing programs (n=69) collaborated
with another program that offered a higher degree than offered at their own program. Of nursing
programs that had these collaborations in 2014-2015, 54% (n=37) had formal agreements and 74%
(n=51) had informal agreements.
Table 3. Partnerships*, by Academic Year
2005-2006
2006- 2007
2007- 2008
2008- 2009
2009- 2010
2010- 2011
2011- 2012
2012- 2013
2013- 2014
2014-2015
Programs that partner with another program leading to a higher degree
9 9 9 19 35 44 50 64 67 69
Formal collaboration 45.3% 52.2% 53.6%
Informal collaboration 67.2% 68.7% 73.9%
Total number of programs that reported
117 130 132 138 139 145 142 141 141 142
*These data were collected for the first time in 2005-2006. Note: Blank cells indicate the applicable information was not requested in the given year.
Admission Spaces and New Student Enrollments
The number of spaces available for new students in nursing programs has fluctuated over the past
five years, reaching a high of 12,739 in 2012-2013 followed by a significant decline in 2013-2014
and another decline in 2014-2015 when there were 11,976 spaces reported available for new
students and these spaces were filled with a total of 13,318 students. The share of nursing
programs that reported filling more admission spaces than were available stayed steady between
2013-2014 (39%; n=55) and 2014-2015 (40%; n=56).
Table 4. Availability and Utilization of Admission Spaces, by Academic Year
2005-2006
2006-2007
2007-2008
2008-2009
2009- 2010
2010-2011
2011-2012
2012-2013
2013-2014
2014-2015
Spaces available 10,523 11,475 11,969 12,812 12,797 12,643 12,391 12,739 12,394 11,976
New student enrollments
11,131 12,709 13,157 13,988 14,228 13,939 13,677 13,181 13,226 13,318
% Spaces filled with new student enrollments
105.8% 110.8% 109.9% 109.2% 111.2% 110.3% 110.4% 103.5% 106.7% 111.2%
2014-2015 BRN Annual School Report
University of California, San Francisco 7
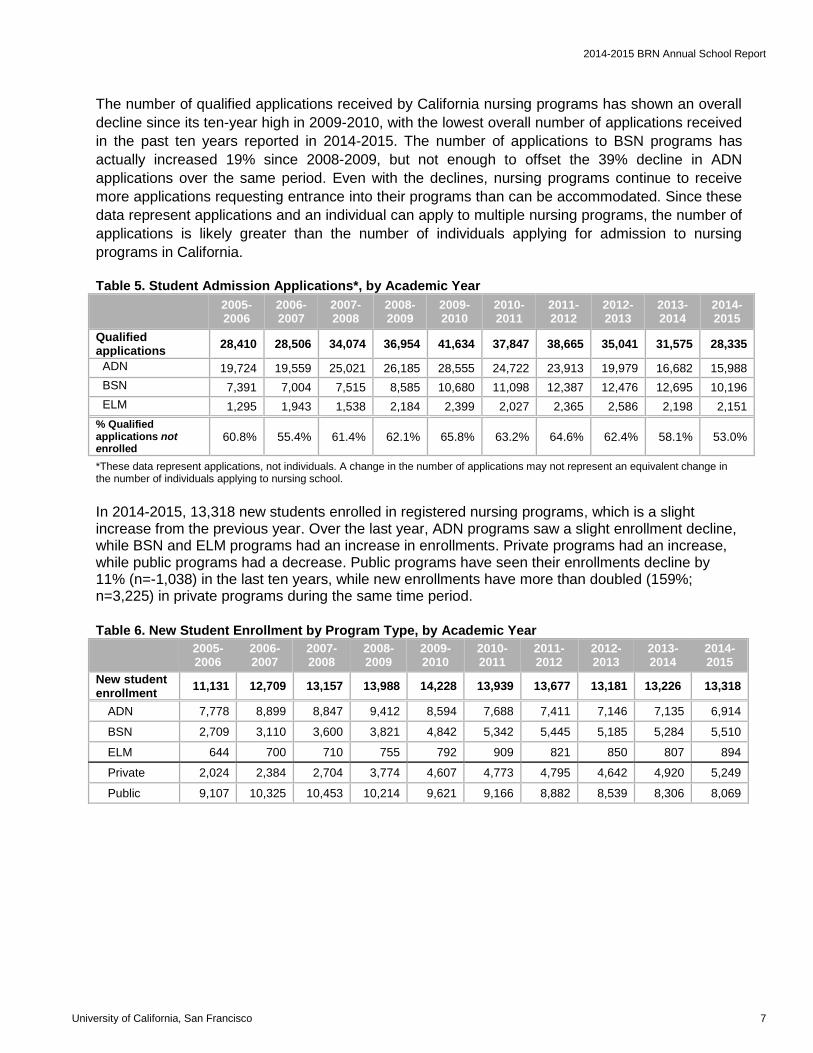
The number of qualified applications received by California nursing programs has shown an overall
decline since its ten-year high in 2009-2010, with the lowest overall number of applications received
in the past ten years reported in 2014-2015. The number of applications to BSN programs has
actually increased 19% since 2008-2009, but not enough to offset the 39% decline in ADN
applications over the same period. Even with the declines, nursing programs continue to receive
more applications requesting entrance into their programs than can be accommodated. Since these
data represent applications and an individual can apply to multiple nursing programs, the number of
applications is likely greater than the number of individuals applying for admission to nursing
programs in California.
Table 5. Student Admission Applications*, by Academic Year
2005-2006
2006-2007
2007-2008
2008-2009
2009- 2010
2010-2011
2011-2012
2012-2013
2013-2014
2014-2015
Qualified applications
28,410 28,506 34,074 36,954 41,634 37,847 38,665 35,041 31,575 28,335
ADN 19,724 19,559 25,021 26,185 28,555 24,722 23,913 19,979 16,682 15,988
BSN 7,391 7,004 7,515 8,585 10,680 11,098 12,387 12,476 12,695 10,196
ELM 1,295 1,943 1,538 2,184 2,399 2,027 2,365 2,586 2,198 2,151
% Qualified applications not enrolled
60.8% 55.4% 61.4% 62.1% 65.8% 63.2% 64.6% 62.4% 58.1% 53.0%
*These data represent applications, not individuals. A change in the number of applications may not represent an equivalent change in the number of individuals applying to nursing school.
In 2014-2015, 13,318 new students enrolled in registered nursing programs, which is a slight increase from the previous year. Over the last year, ADN programs saw a slight enrollment decline, while BSN and ELM programs had an increase in enrollments. Private programs had an increase, while public programs had a decrease. Public programs have seen their enrollments decline by 11% (n=-1,038) in the last ten years, while new enrollments have more than doubled (159%; n=3,225) in private programs during the same time period.
Table 6. New Student Enrollment by Program Type, by Academic Year
2005-2006
2006-2007
2007-2008
2008-2009
2009- 2010
2010-2011
2011-2012
2012-2013
2013-2014
2014-2015
New student enrollment
11,131 12,709 13,157 13,988 14,228 13,939 13,677 13,181 13,226 13,318
ADN 7,778 8,899 8,847 9,412 8,594 7,688 7,411 7,146 7,135 6,914
BSN 2,709 3,110 3,600 3,821 4,842 5,342 5,445 5,185 5,284 5,510
ELM 644 700 710 755 792 909 821 850 807 894
Private 2,024 2,384 2,704 3,774 4,607 4,773 4,795 4,642 4,920 5,249
Public 9,107 10,325 10,453 10,214 9,621 9,166 8,882 8,539 8,306 8,069
2014-2015 BRN Annual School Report
University of California, San Francisco 8
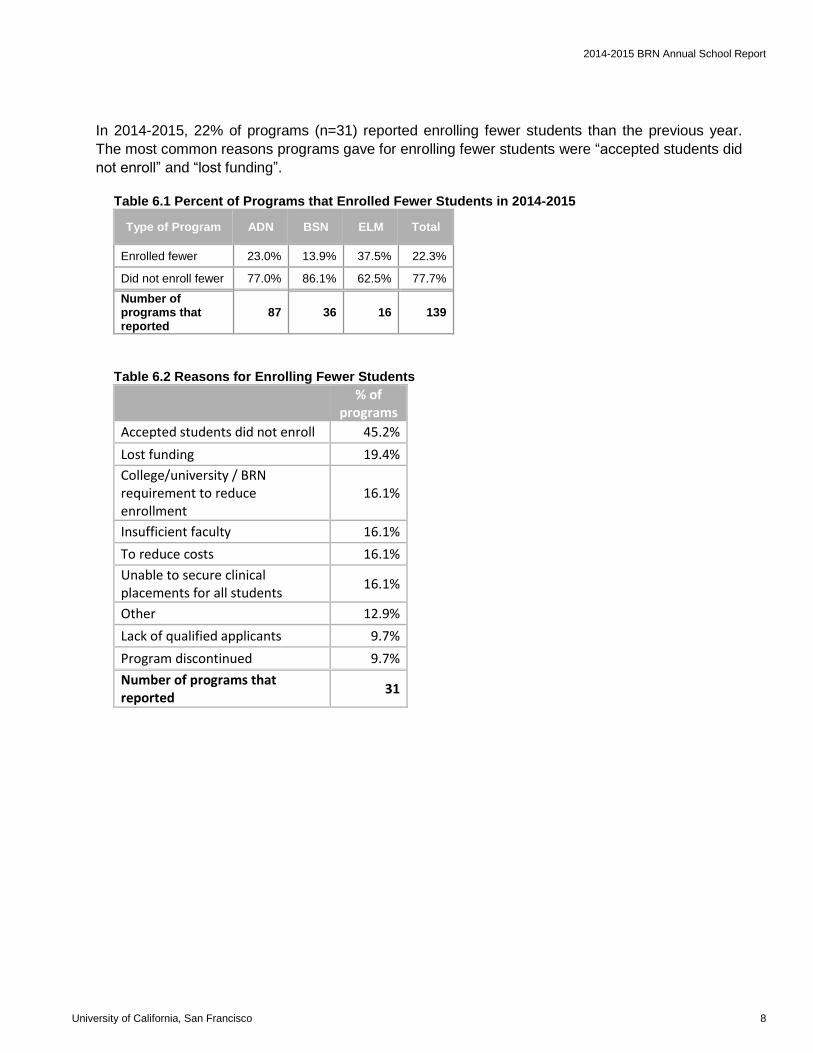
In 2014-2015, 22% of programs (n=31) reported enrolling fewer students than the previous year.
The most common reasons programs gave for enrolling fewer students were “accepted students did
not enroll” and “lost funding”.
Table 6.1 Percent of Programs that Enrolled Fewer Students in 2014-2015
Type of Program ADN BSN ELM Total
Enrolled fewer 23.0% 13.9% 37.5% 22.3%
Did not enroll fewer 77.0% 86.1% 62.5% 77.7%
Number of programs that reported
87 36 16 139
Table 6.2 Reasons for Enrolling Fewer Students
% of
programs
Accepted students did not enroll 45.2%
Lost funding 19.4%
College/university / BRN requirement to reduce enrollment
16.1%
Insufficient faculty 16.1%
To reduce costs 16.1%
Unable to secure clinical placements for all students
16.1%
Other 12.9%
Lack of qualified applicants 9.7%
Program discontinued 9.7%
Number of programs that reported
31

2014-2015 BRN Annual School Report
University of California, San Francisco 9
Student Census Data
The total number of students enrolled in California pre-licensure nursing programs increased
slightly in 2015 from the previous year (3%; n=831). While ADN programs increased slightly (5%;
n=525), as did BSN programs (3%, n=324), ELM programs decreased slightly (-1%; n=18). Of the
total number of students enrolled on October 15, 2015 census, 47% were in ADN programs, 48%
were in BSN programs and 6% were in ELM programs. The 2015 reported census has declined
from a high of 26,531 in 2011.
Table 7. Student Census Data* by Program Type, by Year
*Census data represent the number of students on October 15th of the given year.
Student Completions
The number of students graduating from California nursing programs has increased by 48%
(n=3,591) over the last ten years and peaked at 11,512 graduates in 2009-2010. All program types
have had overall increases in the number of students completing their programs over the last ten
years, although ADN programs have had an overall decline in the number of graduates since 2009-
2010. ADN graduates still represent half (50%) of all students completing a pre-licensure nursing
program in California.
Table 8. Student Completions by Program Type, by Academic Year
2005-2006
2006-2007
2007-2008
2008-2009
2009-2010
2010-2011
2011-2012
2012-2013
2013-2014
2014-2015
ADN 5,351 5,885 6,527 7,075 7,690 6,606 6,162 6,164 5,916 5,542
BSN 1,861 2,074 2,481 2,788 3,157 3,330 3,896 4,364 4,606 4,860
ELM 316 358 572 663 665 717 756 764 769 717
Total student completions
7,528 8,317 9,580 10,526 11,512 10,653 10,814 11,292 11,291 11,119
2006 2007 2008 2009 2010 2011 2012 2013 2014 2015
ADN 12,632 14,191 14,304 14,987 14,011 13,041 11,860 12,070 11,502 12,027
BSN 6,799 7,059 7,956 9,288 10,242 11,712 12,248 12,453 12,008 12,332
ELM 896 1,274 1,290 1,405 1,466 1,778 1,682 1,808 1,473 1,455
Total nursing students
20,327 22,524 23,550 25,680 25,719 26,531 25,790 26,331 24,983 25,814
2014-2015 BRN Annual School Report
University of California, San Francisco 10
Retention and Attrition Rates
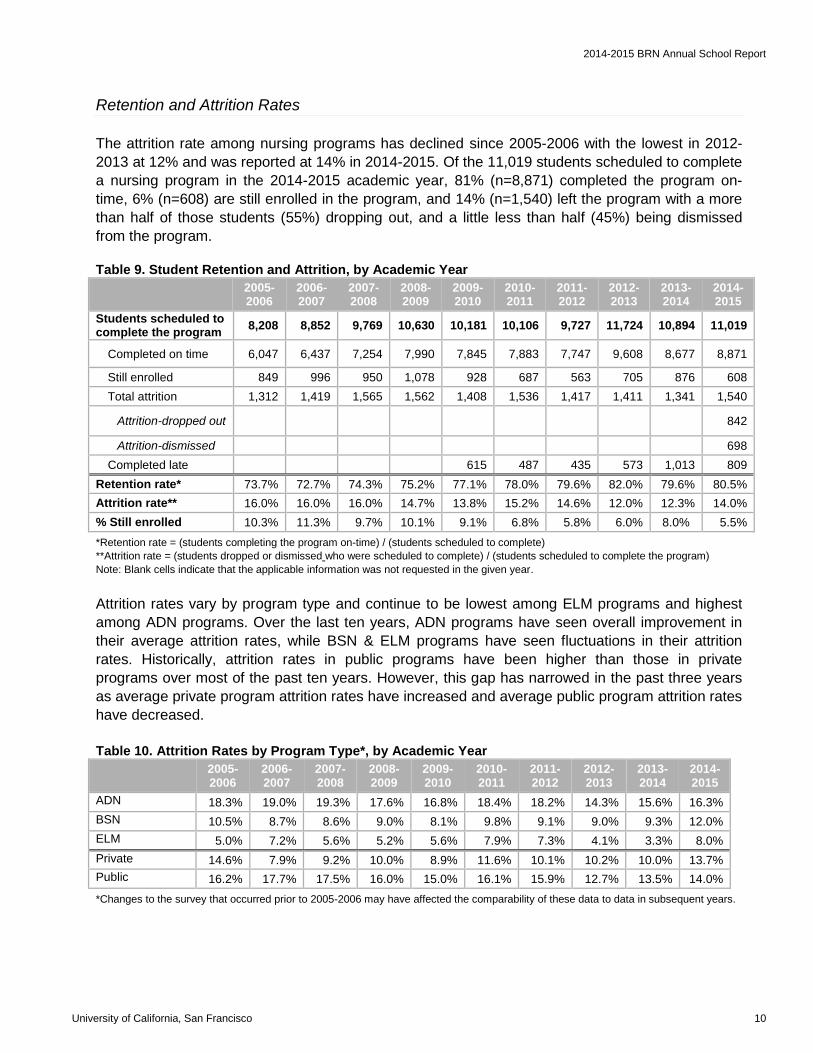
The attrition rate among nursing programs has declined since 2005-2006 with the lowest in 2012-
2013 at 12% and was reported at 14% in 2014-2015. Of the 11,019 students scheduled to complete
a nursing program in the 2014-2015 academic year, 81% (n=8,871) completed the program on-
time, 6% (n=608) are still enrolled in the program, and 14% (n=1,540) left the program with a more
than half of those students (55%) dropping out, and a little less than half (45%) being dismissed
from the program.
Table 9. Student Retention and Attrition, by Academic Year
2005-2006
2006-2007
2007-2008
2008-2009
2009- 2010
2010-2011
2011-2012
2012-2013
2013-2014
2014-2015
Students scheduled to complete the program
8,208 8,852 9,769 10,630 10,181 10,106 9,727 11,724 10,894 11,019
Completed on time 6,047 6,437 7,254 7,990 7,845 7,883 7,747 9,608 8,677 8,871
Still enrolled 849 996 950 1,078 928 687 563 705 876 608
Total attrition 1,312 1,419 1,565 1,562 1,408 1,536 1,417 1,411 1,341 1,540
Attrition-dropped out 842
Attrition-dismissed 698
Completed late 615 487 435 573 1,013 809
Retention rate* 73.7% 72.7% 74.3% 75.2% 77.1% 78.0% 79.6% 82.0% 79.6% 80.5%
Attrition rate** 16.0% 16.0% 16.0% 14.7% 13.8% 15.2% 14.6% 12.0% 12.3% 14.0%
% Still enrolled 10.3% 11.3% 9.7% 10.1% 9.1% 6.8% 5.8% 6.0% 8.0% 5.5%
*Retention rate = (students completing the program on-time) / (students scheduled to complete)
**Attrition rate = (students dropped or dismissed who were scheduled to complete) / (students scheduled to complete the program)
Note: Blank cells indicate that the applicable information was not requested in the given year.
Attrition rates vary by program type and continue to be lowest among ELM programs and highest
among ADN programs. Over the last ten years, ADN programs have seen overall improvement in
their average attrition rates, while BSN & ELM programs have seen fluctuations in their attrition
rates. Historically, attrition rates in public programs have been higher than those in private
programs over most of the past ten years. However, this gap has narrowed in the past three years
as average private program attrition rates have increased and average public program attrition rates
have decreased.
Table 10. Attrition Rates by Program Type*, by Academic Year
2005-2006
2006-2007
2007-2008
2008-2009
2009- 2010
2010-2011
2011-2012
2012-2013
2013-2014
2014-2015
ADN 18.3% 19.0% 19.3% 17.6% 16.8% 18.4% 18.2% 14.3% 15.6% 16.3%
BSN 10.5% 8.7% 8.6% 9.0% 8.1% 9.8% 9.1% 9.0% 9.3% 12.0%
ELM 5.0% 7.2% 5.6% 5.2% 5.6% 7.9% 7.3% 4.1% 3.3% 8.0%
Private 14.6% 7.9% 9.2% 10.0% 8.9% 11.6% 10.1% 10.2% 10.0% 13.7%
Public 16.2% 17.7% 17.5% 16.0% 15.0% 16.1% 15.9% 12.7% 13.5% 14.0%
*Changes to the survey that occurred prior to 2005-2006 may have affected the comparability of these data to data in subsequent years.
2014-2015 BRN Annual School Report
University of California, San Francisco 11
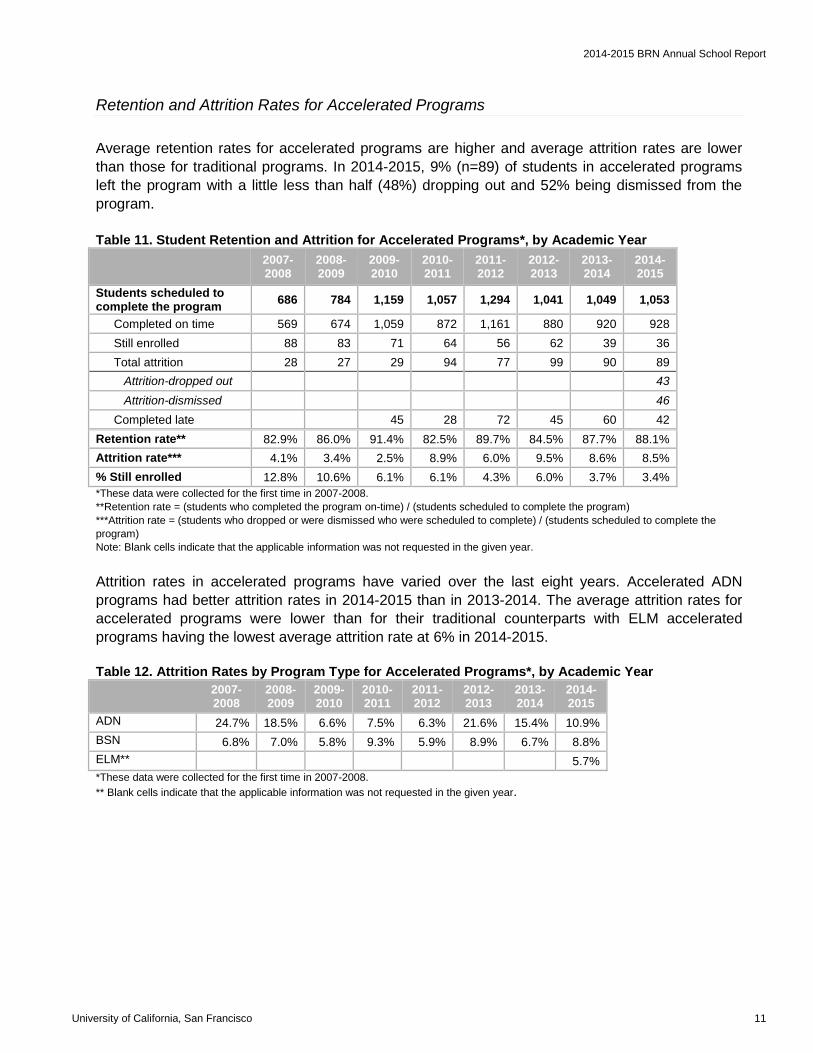
Retention and Attrition Rates for Accelerated Programs
Average retention rates for accelerated programs are higher and average attrition rates are lower
than those for traditional programs. In 2014-2015, 9% (n=89) of students in accelerated programs
left the program with a little less than half (48%) dropping out and 52% being dismissed from the
program.
Table 11. Student Retention and Attrition for Accelerated Programs*, by Academic Year
2007-2008
2008-2009
2009- 2010
2010-2011
2011-2012
2012- 2013
2013-2014
2014-2015
Students scheduled to complete the program
686 784 1,159 1,057 1,294 1,041 1,049 1,053
Completed on time 569 674 1,059 872 1,161 880 920 928
Still enrolled 88 83 71 64 56 62 39 36
Total attrition 28 27 29 94 77 99 90 89
Attrition-dropped out 43
Attrition-dismissed 46
Completed late 45 28 72 45 60 42
Retention rate** 82.9% 86.0% 91.4% 82.5% 89.7% 84.5% 87.7% 88.1%
Attrition rate*** 4.1% 3.4% 2.5% 8.9% 6.0% 9.5% 8.6% 8.5%
% Still enrolled 12.8% 10.6% 6.1% 6.1% 4.3% 6.0% 3.7% 3.4%
*These data were collected for the first time in 2007-2008.
**Retention rate = (students who completed the program on-time) / (students scheduled to complete the program)
***Attrition rate = (students who dropped or were dismissed who were scheduled to complete) / (students scheduled to complete the
program)
Note: Blank cells indicate that the applicable information was not requested in the given year.
Attrition rates in accelerated programs have varied over the last eight years. Accelerated ADN
programs had better attrition rates in 2014-2015 than in 2013-2014. The average attrition rates for
accelerated programs were lower than for their traditional counterparts with ELM accelerated
programs having the lowest average attrition rate at 6% in 2014-2015.
Table 12. Attrition Rates by Program Type for Accelerated Programs*, by Academic Year
2007-2008
2008-2009
2009- 2010
2010-2011
2011-2012
2012-2013
2013-2014
2014-2015
ADN 24.7% 18.5% 6.6% 7.5% 6.3% 21.6% 15.4% 10.9%
BSN 6.8% 7.0% 5.8% 9.3% 5.9% 8.9% 6.7% 8.8%
ELM** 5.7%
*These data were collected for the first time in 2007-2008. ** Blank cells indicate that the applicable information was not requested in the given year.
2014-2015 BRN Annual School Report
University of California, San Francisco 12
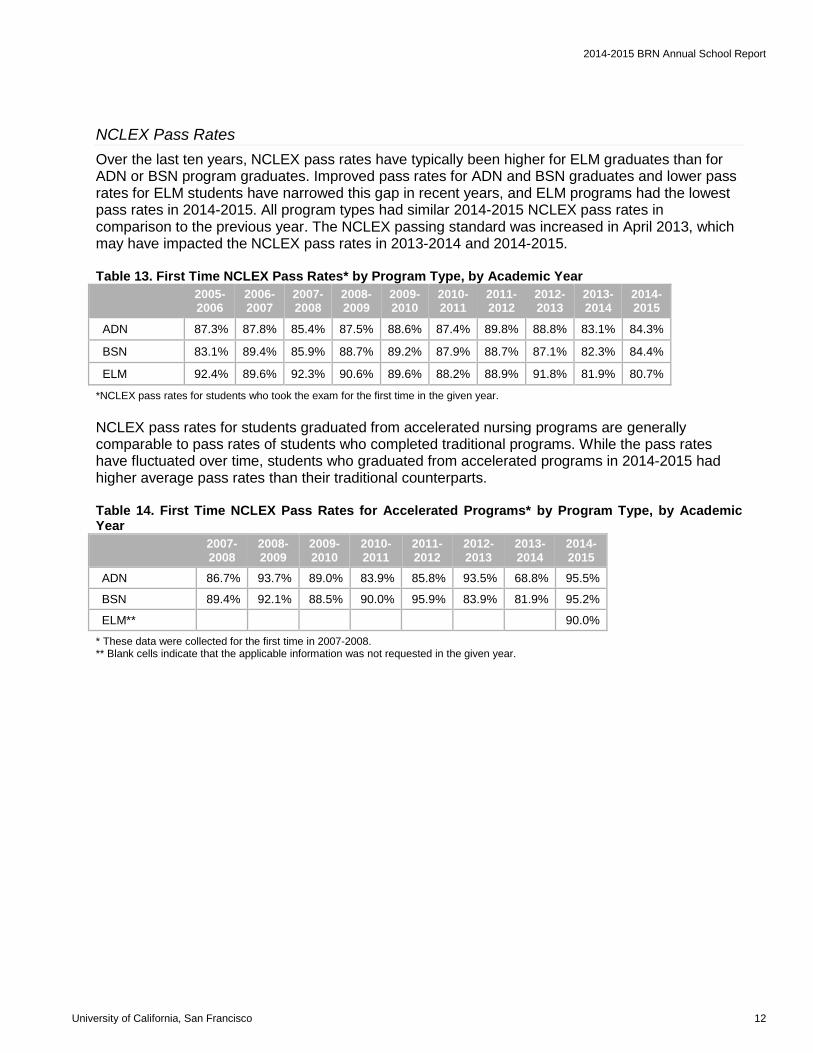
NCLEX Pass Rates
Over the last ten years, NCLEX pass rates have typically been higher for ELM graduates than for ADN or BSN program graduates. Improved pass rates for ADN and BSN graduates and lower pass rates for ELM students have narrowed this gap in recent years, and ELM programs had the lowest pass rates in 2014-2015. All program types had similar 2014-2015 NCLEX pass rates in comparison to the previous year. The NCLEX passing standard was increased in April 2013, which may have impacted the NCLEX pass rates in 2013-2014 and 2014-2015. Table 13. First Time NCLEX Pass Rates* by Program Type, by Academic Year
2005-2006
2006-2007
2007-2008
2008-2009
2009-2010
2010-2011
2011-2012
2012-2013
2013-2014
2014-2015
ADN 87.3% 87.8% 85.4% 87.5% 88.6% 87.4% 89.8% 88.8% 83.1% 84.3%
BSN 83.1% 89.4% 85.9% 88.7% 89.2% 87.9% 88.7% 87.1% 82.3% 84.4%
ELM 92.4% 89.6% 92.3% 90.6% 89.6% 88.2% 88.9% 91.8% 81.9% 80.7%
*NCLEX pass rates for students who took the exam for the first time in the given year. NCLEX pass rates for students graduated from accelerated nursing programs are generally comparable to pass rates of students who completed traditional programs. While the pass rates have fluctuated over time, students who graduated from accelerated programs in 2014-2015 had higher average pass rates than their traditional counterparts. Table 14. First Time NCLEX Pass Rates for Accelerated Programs* by Program Type, by Academic Year
2007-2008
2008-2009
2009- 2010
2010-2011
2011-2012
2012-2013
2013-2014
2014-2015
ADN 86.7% 93.7% 89.0% 83.9% 85.8% 93.5% 68.8% 95.5%
BSN 89.4% 92.1% 88.5% 90.0% 95.9% 83.9% 81.9% 95.2%
ELM** 90.0%
* These data were collected for the first time in 2007-2008. ** Blank cells indicate that the applicable information was not requested in the given year.

2014-2015 BRN Annual School Report
University of California, San Francisco 13
Employment of Recent Nursing Program Graduates2
The largest share of RN program graduates work in hospitals, even though this share has been
decreasing from a high of 88% in 2007-2008. In 2014-2015, programs reported that 58% of
graduates were employed in hospitals. The share of new graduates working in nursing in California
had been declining, from a high of 92% in 2007-2008 to a low of 64% in 2012-2013. In 2014-2015,
there was an increase in the share of graduates working in California from 69% the prior year up to
73% in 2014-2015. Nursing programs reported that 9% of their graduates were unable to find
employment by October 2015, a figure which has steadily declined since 2009-2010.
Table 15. Employment Location of Recent Nursing Program Graduates, by Academic Year
2007-2008
2008-2009
2009-2010
2010-2011
2011-2012
2012-2013
2013-2014
2014-2015
Hospital 88.0% 71.4% 59.0% 54.4% 61.1% 56.7% 56.0% 58.4%
Pursuing additional nursing education
2.7% 8.4% 9.7% 7.8% 8.3% 7.9% 7.1% 11.5%
Long-term care facilities 2.2% 5.4% 3.9% 4.5% 3.6% 3.6% 3.7% 7.9%
Other 4.0% 15.6% 14.8% 6.5% 4.2% 1.7% 3.4% 4.9%
Other healthcare facilities 7.1% 10.5% 4.4%
Community/public health facilities
3.1% 5.6% 6.0% 5.0% 5.2% 4.7% 6.0% 4.2%
Unable to find employment* 27.5% 21.8% 17.6% 18.3% 13.7% 9.4%
Employed in California 91.5% 83.4% 81.1% 68.0% 69.6% 63.7% 68.8% 73.1%
Note: Blank cells indicate that the applicable information was not requested in the given year.
Graduates of all program types were most likely to work in hospitals, especially BSN graduates.
ADN and ELM graduates were much more likely to be pursuing additional education than were BSN
graduates. ADN graduates were more likely to be unemployed than either BSN or ELM graduates.
Table 15.1 Employment Location for Recent Nursing Program Graduates 2014-2015, by Academic Program Type
ADN BSN ELM All
Hospital 51.4% 79.4% 55.6% 58.4%
Pursuing additional nursing education 13.0% 2.0% 21.8% 11.5%
Long-term care facilities 10.3% 4.4% 1.5% 7.9%
Community/public health facilities 4.1% 3.4% 6.0% 4.2%
Other healthcare facilities 4.9% 2.5% 5.5% 4.4%
Other 5.6% 4.7% 1.4% 4.9%
Unable to find employment* 11.6% 3.8% 8.2% 9.4%
Employed in California 73.1%
Note: Statistics on the percent of graduates employed in California were collected at the school level only.
2Graduates whose employment setting was reported as “unknown” have been excluded from this table. In 2014-2015, on average, the employment setting was unknown for 14% of recent graduates.

2014-2015 BRN Annual School Report
University of California, San Francisco 14
Clinical Training in Nursing Education
Questions regarding clinical simulation3 were revised in the 2014-2015 survey to collect data on
average amount of hours students spend in clinical areas including simulation in various content
areas and plans for future use. One-hundred and thirty (92%) of 142 nursing programs reported
using clinical simulation in 2014-2015.4
The content areas using the most hours of clinical simulation on average are Medical/Surgical
(27.4) and Obstetrics (11.6). On average, a similar amount of time is also spent in other non-direct
patient care in these areas. Programs allocate the largest proportion of clinical hours to direct
patient care (81%), followed by non-direct patient care (12%) and simulation (8%).
Table 16. Average Hours Spent in Clinical Training by Content Area 2014-2015
Content Area Direct
Patient Care
Non-Direct Patient Care (excluding simulation)
Clinical Simulation
Avg Total Clinical Hours
Medical/Surgical 273.6 29.2 27.2 332.3
Fundamentals 82.0 44.9 9.7 137.6
Obstetrics 73.7 8.0 11.5 93.3
Pediatrics 71.9 5.2 5.3 87.3
Geriatrics 65.7 7.6 7.7 74.2
Psychiatry/Mental Health 77.1 4.8 4.8 87.6
Leadership/Management 63.2 5.5 3.9 72.2
Other 36.5 1.7 2.5 40.4
Total average clinical hours 744.4 107.4 72.8 924.6
Percent of Clinical Hours 80.5% 11.6% 7.9% 100.0%
Number of programs that reported 128 128 128 128
3 Clinical simulation provides a simulated real-time nursing care experience which allows students to integrate, apply, and refine specific
skills and abilities that are based on theoretical concepts and scientific knowledge. It may include videotaping, de-briefing and dialogue as part of the learning process. 4 136 programs reported. 6 programs did not use clinical simulation, and 6 did not answer the question. One program reported using
clinical simulation but did not give a breakdown of clinical hours.
2014-2015 BRN Annual School Report
University of California, San Francisco 15
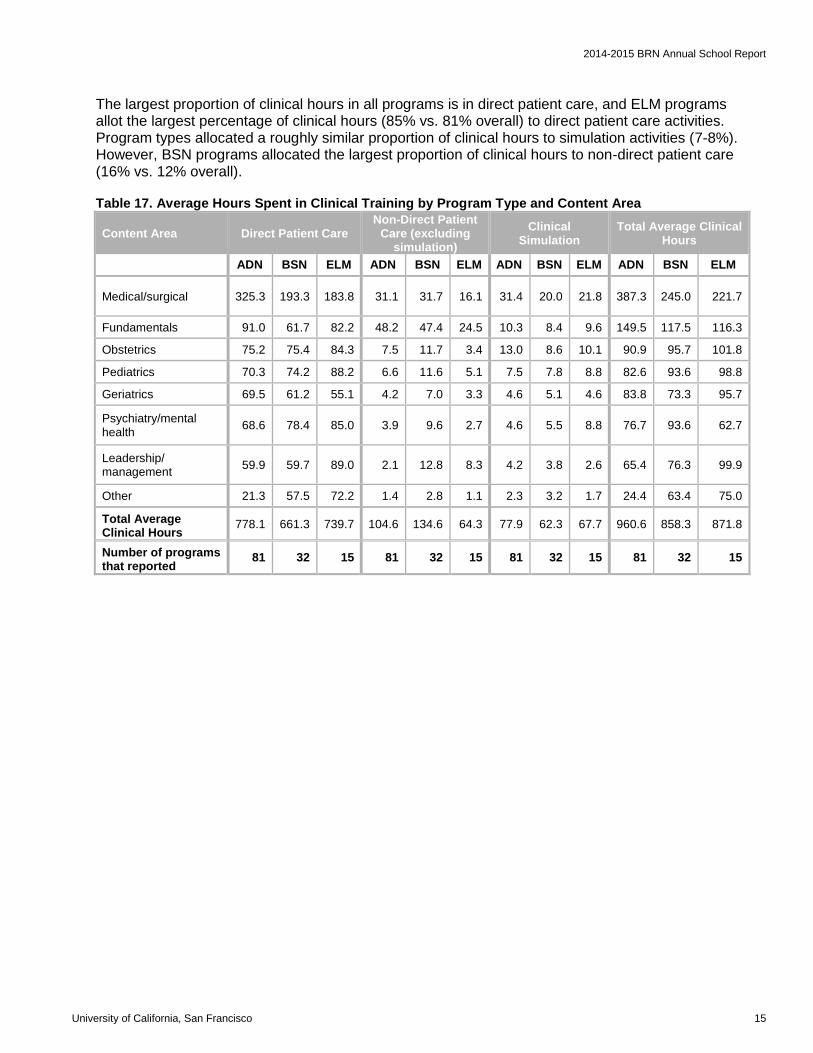
The largest proportion of clinical hours in all programs is in direct patient care, and ELM programs allot the largest percentage of clinical hours (85% vs. 81% overall) to direct patient care activities. Program types allocated a roughly similar proportion of clinical hours to simulation activities (7-8%). However, BSN programs allocated the largest proportion of clinical hours to non-direct patient care (16% vs. 12% overall).
Table 17. Average Hours Spent in Clinical Training by Program Type and Content Area
Content Area Direct Patient Care Non-Direct Patient
Care (excluding simulation)
Clinical Simulation
Total Average Clinical Hours
ADN BSN ELM ADN BSN ELM ADN BSN ELM ADN BSN ELM
Medical/surgical 325.3 193.3 183.8 31.1 31.7 16.1 31.4 20.0 21.8 387.3 245.0 221.7
Fundamentals 91.0 61.7 82.2 48.2 47.4 24.5 10.3 8.4 9.6 149.5 117.5 116.3
Obstetrics 75.2 75.4 84.3 7.5 11.7 3.4 13.0 8.6 10.1 90.9 95.7 101.8
Pediatrics 70.3 74.2 88.2 6.6 11.6 5.1 7.5 7.8 8.8 82.6 93.6 98.8
Geriatrics 69.5 61.2 55.1 4.2 7.0 3.3 4.6 5.1 4.6 83.8 73.3 95.7
Psychiatry/mental health
68.6 78.4 85.0 3.9 9.6 2.7 4.6 5.5 8.8 76.7 93.6 62.7
Leadership/ management
59.9 59.7 89.0 2.1 12.8 8.3 4.2 3.8 2.6 65.4 76.3 99.9
Other 21.3 57.5 72.2 1.4 2.8 1.1 2.3 3.2 1.7 24.4 63.4 75.0
Total Average Clinical Hours
778.1 661.3 739.7 104.6 134.6 64.3 77.9 62.3 67.7 960.6 858.3 871.8
Number of programs that reported
81 32 15 81 32 15 81 32 15 81 32 15
2014-2015 BRN Annual School Report
University of California, San Francisco 16
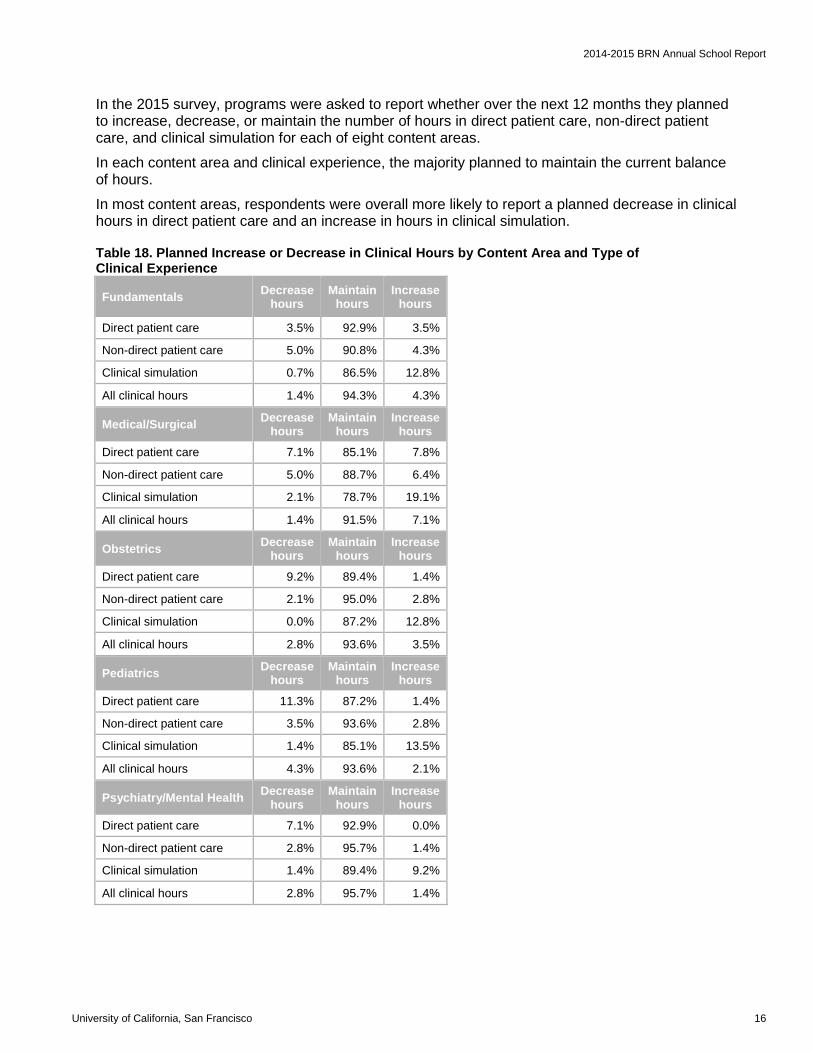
In the 2015 survey, programs were asked to report whether over the next 12 months they planned to increase, decrease, or maintain the number of hours in direct patient care, non-direct patient care, and clinical simulation for each of eight content areas.
In each content area and clinical experience, the majority planned to maintain the current balance of hours.
In most content areas, respondents were overall more likely to report a planned decrease in clinical hours in direct patient care and an increase in hours in clinical simulation.
Table 18. Planned Increase or Decrease in Clinical Hours by Content Area and Type of Clinical Experience
Fundamentals Decrease
hours Maintain
hours Increase
hours
Direct patient care 3.5% 92.9% 3.5%
Non-direct patient care 5.0% 90.8% 4.3%
Clinical simulation 0.7% 86.5% 12.8%
All clinical hours 1.4% 94.3% 4.3%
Medical/Surgical Decrease
hours Maintain
hours Increase
hours
Direct patient care 7.1% 85.1% 7.8%
Non-direct patient care 5.0% 88.7% 6.4%
Clinical simulation 2.1% 78.7% 19.1%
All clinical hours 1.4% 91.5% 7.1%
Obstetrics Decrease
hours Maintain
hours Increase
hours
Direct patient care 9.2% 89.4% 1.4%
Non-direct patient care 2.1% 95.0% 2.8%
Clinical simulation 0.0% 87.2% 12.8%
All clinical hours 2.8% 93.6% 3.5%
Pediatrics Decrease
hours Maintain
hours Increase
hours
Direct patient care 11.3% 87.2% 1.4%
Non-direct patient care 3.5% 93.6% 2.8%
Clinical simulation 1.4% 85.1% 13.5%
All clinical hours 4.3% 93.6% 2.1%
Psychiatry/Mental Health Decrease
hours Maintain
hours Increase
hours
Direct patient care 7.1% 92.9% 0.0%
Non-direct patient care 2.8% 95.7% 1.4%
Clinical simulation 1.4% 89.4% 9.2%
All clinical hours 2.8% 95.7% 1.4%
2014-2015 BRN Annual School Report
University of California, San Francisco 17
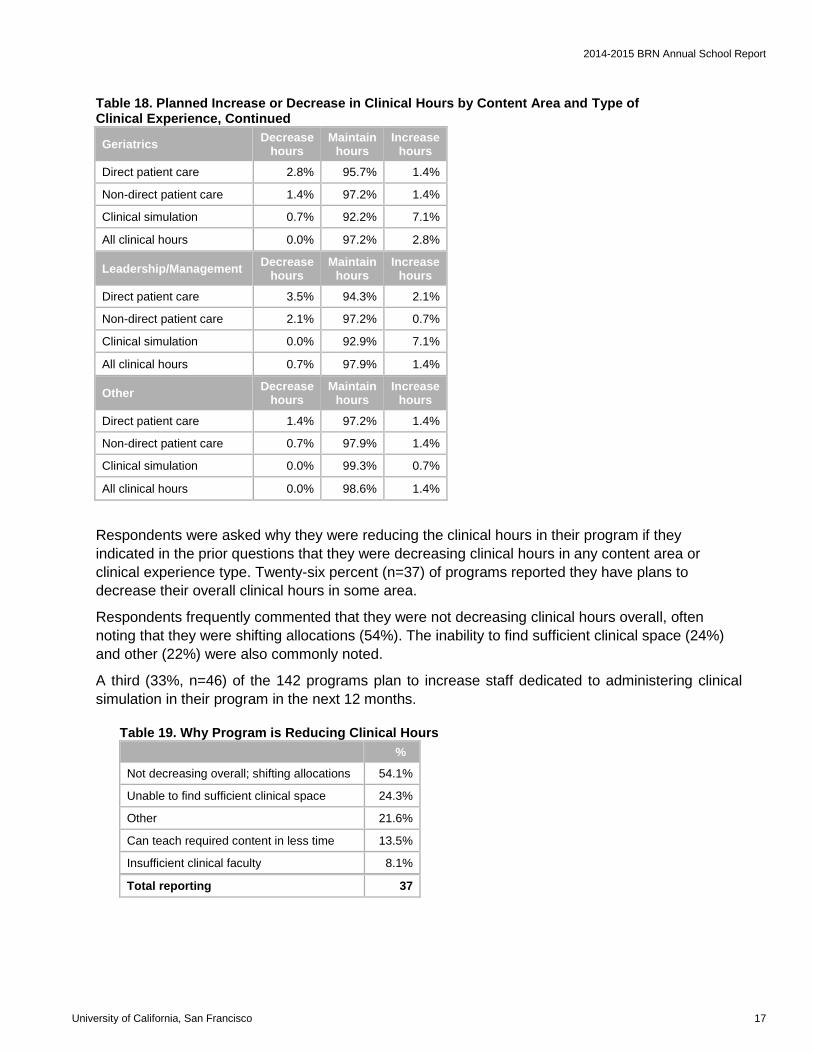
Table 18. Planned Increase or Decrease in Clinical Hours by Content Area and Type of Clinical Experience, Continued
Geriatrics Decrease
hours Maintain
hours Increase
hours
Direct patient care 2.8% 95.7% 1.4%
Non-direct patient care 1.4% 97.2% 1.4%
Clinical simulation 0.7% 92.2% 7.1%
All clinical hours 0.0% 97.2% 2.8%
Leadership/Management Decrease
hours Maintain
hours Increase
hours
Direct patient care 3.5% 94.3% 2.1%
Non-direct patient care 2.1% 97.2% 0.7%
Clinical simulation 0.0% 92.9% 7.1%
All clinical hours 0.7% 97.9% 1.4%
Other Decrease
hours Maintain
hours Increase
hours
Direct patient care 1.4% 97.2% 1.4%
Non-direct patient care 0.7% 97.9% 1.4%
Clinical simulation 0.0% 99.3% 0.7%
All clinical hours 0.0% 98.6% 1.4%
Respondents were asked why they were reducing the clinical hours in their program if they
indicated in the prior questions that they were decreasing clinical hours in any content area or
clinical experience type. Twenty-six percent (n=37) of programs reported they have plans to
decrease their overall clinical hours in some area.
Respondents frequently commented that they were not decreasing clinical hours overall, often
noting that they were shifting allocations (54%). The inability to find sufficient clinical space (24%)
and other (22%) were also commonly noted.
A third (33%, n=46) of the 142 programs plan to increase staff dedicated to administering clinical
simulation in their program in the next 12 months.
Table 19. Why Program is Reducing Clinical Hours
%
Not decreasing overall; shifting allocations 54.1%
Unable to find sufficient clinical space 24.3%
Other 21.6%
Can teach required content in less time 13.5%
Insufficient clinical faculty 8.1%
Total reporting 37
2014-2015 BRN Annual School Report
University of California, San Francisco 18
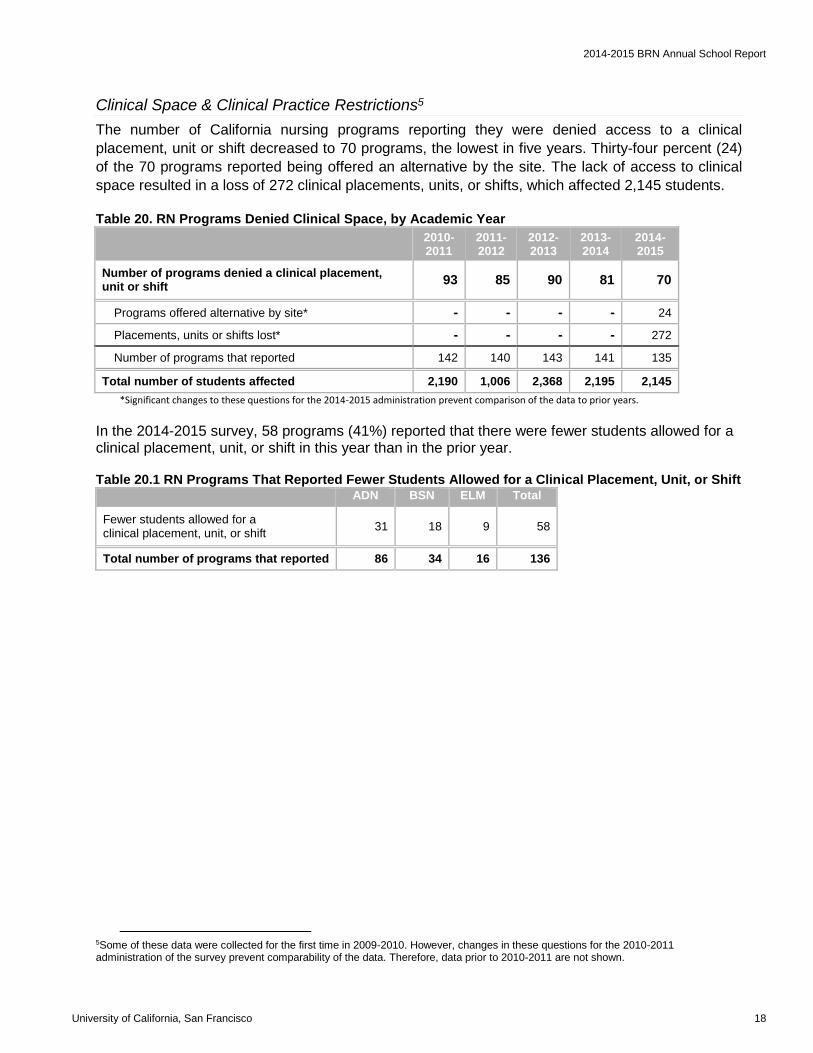
Clinical Space & Clinical Practice Restrictions5
The number of California nursing programs reporting they were denied access to a clinical
placement, unit or shift decreased to 70 programs, the lowest in five years. Thirty-four percent (24)
of the 70 programs reported being offered an alternative by the site. The lack of access to clinical
space resulted in a loss of 272 clinical placements, units, or shifts, which affected 2,145 students.
Table 20. RN Programs Denied Clinical Space, by Academic Year
2010-2011
2011-2012
2012-2013
2013-2014
2014-2015
Number of programs denied a clinical placement, unit or shift
93 85 90 81 70
Programs offered alternative by site* - - - - 24
Placements, units or shifts lost* - - - - 272
Number of programs that reported 142 140 143 141 135
Total number of students affected 2,190 1,006 2,368 2,195 2,145
*Significant changes to these questions for the 2014-2015 administration prevent comparison of the data to prior years.
In the 2014-2015 survey, 58 programs (41%) reported that there were fewer students allowed for a clinical placement, unit, or shift in this year than in the prior year.
Table 20.1 RN Programs That Reported Fewer Students Allowed for a Clinical Placement, Unit, or Shift ADN BSN ELM Total
Fewer students allowed for a clinical placement, unit, or shift
31 18 9 58
Total number of programs that reported 86 34 16 136
5Some of these data were collected for the first time in 2009-2010. However, changes in these questions for the 2010-2011 administration of the survey prevent comparability of the data. Therefore, data prior to 2010-2011 are not shown.

2014-2015 BRN Annual School Report
University of California, San Francisco 19
Competition for space arising from an increase in the number of nursing students continued to be the most frequently reported reason why programs were denied clinical space, though the share of programs citing it as a reason has been declining since 2009-2010. Overall, 9 programs (7%) reported providing financial support to secure a clinical placement. Table 21. Reasons for Clinical Space Being Unavailable*, by Academic Year
Data were collected for the first time in the 2009-2010 or 2010-2011 survey. Note: Blank cells indicate that the applicable information was not requested in the given year.
2009-2010
2010-2011
2011-2012
2012-2013
2013-2014
2014-2015
Competition for clinical space due to increase in number of nursing students in region
71.4% 64.5% 58.8% 54.5% 46.9% 48.7%
Displaced by another program 62.3% 40.9% 44.7% 42.2% 43.2% 38.2%
Staff nurse overload or insufficient qualified staff 54.5% 46.2% 54.1% 41.1% 45.7% 36.8%
Visit from Joint Commission or other accrediting agency 21.1% 21.0% 26.3%
Decrease in patient census 35.1% 30.1% 31.8% 30.0% 28.4% 25.0%
Change in facility ownership/management 11.8% 12.9% 21.1% 14.8% 21.1%
Other 20.8% 9.7% 10.6% 11.1% 11.1% 21.1%
No longer accepting ADN students 26.0% 16.1% 21.2% 20.0% 23.5% 21.1%
Nurse residency programs 28.6% 18.3% 29.4% 17.8% 18.5% 18.4%
Closure, or partial closure, of clinical facility 23.7% 25.9% 26.7% 25.9% 18.4%
Clinical facility seeking magnet status 36.4% 12.9% 18.8% 15.5% 11.1% 17.1%
Implementation of Electronic Health Records system 3.5% 32.3% 22.2% 13.2%
The facility began charging a fee (or other RN program offered to pay a fee) for the placement and the RN program would not pay
4.9% 1.3%
Facility moving to a new location 6.2%
Number of programs that reported 77 93 85 90 81 76
2014-2015 BRN Annual School Report
University of California, San Francisco 20
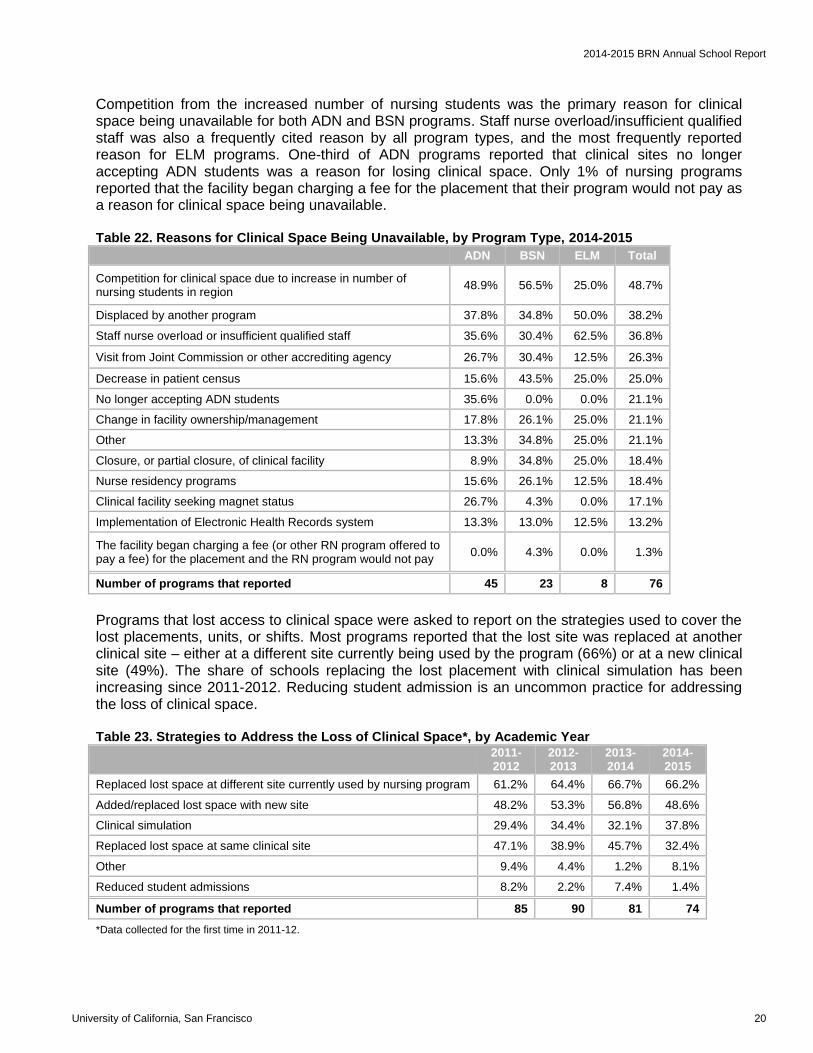
Competition from the increased number of nursing students was the primary reason for clinical space being unavailable for both ADN and BSN programs. Staff nurse overload/insufficient qualified staff was also a frequently cited reason by all program types, and the most frequently reported reason for ELM programs. One-third of ADN programs reported that clinical sites no longer accepting ADN students was a reason for losing clinical space. Only 1% of nursing programs reported that the facility began charging a fee for the placement that their program would not pay as a reason for clinical space being unavailable. Table 22. Reasons for Clinical Space Being Unavailable, by Program Type, 2014-2015
ADN BSN ELM Total
Competition for clinical space due to increase in number of nursing students in region
48.9% 56.5% 25.0% 48.7%
Displaced by another program 37.8% 34.8% 50.0% 38.2%
Staff nurse overload or insufficient qualified staff 35.6% 30.4% 62.5% 36.8%
Visit from Joint Commission or other accrediting agency 26.7% 30.4% 12.5% 26.3%
Decrease in patient census 15.6% 43.5% 25.0% 25.0%
No longer accepting ADN students 35.6% 0.0% 0.0% 21.1%
Change in facility ownership/management 17.8% 26.1% 25.0% 21.1%
Other 13.3% 34.8% 25.0% 21.1%
Closure, or partial closure, of clinical facility 8.9% 34.8% 25.0% 18.4%
Nurse residency programs 15.6% 26.1% 12.5% 18.4%
Clinical facility seeking magnet status 26.7% 4.3% 0.0% 17.1%
Implementation of Electronic Health Records system 13.3% 13.0% 12.5% 13.2%
The facility began charging a fee (or other RN program offered to pay a fee) for the placement and the RN program would not pay
0.0% 4.3% 0.0% 1.3%
Number of programs that reported 45 23 8 76
Programs that lost access to clinical space were asked to report on the strategies used to cover the lost placements, units, or shifts. Most programs reported that the lost site was replaced at another clinical site – either at a different site currently being used by the program (66%) or at a new clinical site (49%). The share of schools replacing the lost placement with clinical simulation has been increasing since 2011-2012. Reducing student admission is an uncommon practice for addressing the loss of clinical space. Table 23. Strategies to Address the Loss of Clinical Space*, by Academic Year
2011-2012
2012-2013
2013-2014
2014-2015
Replaced lost space at different site currently used by nursing program 61.2% 64.4% 66.7% 66.2%
Added/replaced lost space with new site 48.2% 53.3% 56.8% 48.6%
Clinical simulation 29.4% 34.4% 32.1% 37.8%
Replaced lost space at same clinical site 47.1% 38.9% 45.7% 32.4%
Other 9.4% 4.4% 1.2% 8.1%
Reduced student admissions 8.2% 2.2% 7.4% 1.4%
Number of programs that reported 85 90 81 74
*Data collected for the first time in 2011-12.

2014-2015 BRN Annual School Report
University of California, San Francisco 21
Thirty-nine (27%) nursing programs in the state reported an increase in out-of-hospital clinical placements in 2014-2015 which is the lowest number reported for the past six years.6 For the last five years, the two most frequently reported non-hospital clinical sites were skilled nursing/rehabilitation facility and public health or community health agency, reported by 46% and 41% respectively of all responding programs in 2014-2015. In 2014-2015, three respondents among the five citing “Other” clinical sites listed childcare or child development centers
Table 24. Alternative Out-of-Hospital Clinical Sites* Used by RN Programs, by Academic Year
2010-2011
2011-2012
2012-2013
2013-2014
2014-2015
Skilled nursing/rehabilitation facility 47.3% 46.4% 45.0% 43.9% 46.2%
Public health or community health agency 43.6% 51.8% 55.0% 53.7% 41.0%
School health service (K-12 or college) 30.9% 30.4% 22.5% 34.1% 38.5%
Medical practice, clinic, physician office 23.6% 33.9% 22.5% 39.0% 30.8%
Outpatient mental health/substance abuse 36.4% 42.9% 20.0% 39.0% 28.2%
Surgery center/ambulatory care center 20.0% 23.2% 30.0% 29.3% 28.2%
Hospice 25.5% 25.0% 27.5% 29.3% 23.1%
Home health agency/home health service 30.9% 32.1% 35.0% 19.5% 20.5%
Other 14.5% 17.9% 17.5% 12.2% 12.8%
Correctional facility, prison or jail 5.5% 7.1% 5.0% 7.3% 10.3%
Case management/disease management 7.3% 12.5% 5.0% 7.3% 7.7%
Urgent care, not hospital-based 9.1% 10.7% 5.0% 12.2% 7.7%
Renal dialysis unit 12.7% 5.4% 5.0% 4.9% 5.1%
Occupational health or employee health service
5.5% 5.4% 0.0% 2.4% 0.0%
Number of programs that reported 55 56 40 41 39
*These data were collected for the first time in 2010-2011.
6 Thirty-seven programs reported an increase in out-of-hospital placements, and thirty-nine answered questions about alternative
placements.

2014-2015 BRN Annual School Report
University of California, San Francisco 22
In 2014-2015, 70% (n=93) of nursing schools reported that pre-licensure students in their programs had encountered restrictions to clinical practice imposed on them by clinical facilities. The most common types of restrictions students faced continued to be access to the clinical site itself due to a visit from the Joint Commission or another accrediting agency, access to electronic medical records, and access to bar coding medication administration. Schools reported that the least common types of restrictions students faced were direct communication with health care team members, alternative setting due to liability, and IV medication administration. Table 25. Common Types of Restricted Access in the Clinical Setting for RN Students*, by Academic Year 2009-
2010 2010-2011
2011-2012
2012-2013
2013-2014
2014-2015
Clinical site due to visit from accrediting agency (Joint Commission)
68.1% 71.0% 74.3% 77.9% 73.1% 68.8%
Electronic Medical Records 70.3% 50.0% 66.3% 72.6% 66.7% 60.2%
Bar coding medication administration 70.3% 58.0% 68.3% 72.6% 58.1% 59.1%
Automated medical supply cabinets 53.1% 34.0% 35.6% 48.4% 45.2% 44.1%
Student health and safety requirements 39.0% 43.6% 45.3% 43.0% 40.9%
Glucometers 37.2% 33.0% 29.7% 36.8% 34.4% 31.2%
Some patients due to staff workload 31.0% 37.6% 30.5% 41.9% 30.1%
IV medication administration 27.7% 31.0% 30.7% 24.2% 23.7% 26.9%
Alternative setting due to liability 20.2% 13.0% 22.8% 18.9% 18.3% 19.4%
Direct communication with health team 11.8% 12.0% 15.8% 17.9% 10.8% 7.5%
Number of schools that reported 94 100 101 95 93 93
*Data collected for the first time in 2009-2010. Note: Blank cells indicate that the applicable information was not requested in the given year. Numbers indicate the percent of schools reporting these restrictions as “common” or “very common”.
Schools reported that restricted student access to electronic medical records was due to insufficient time for clinical site staff to train students (70%) and clinical site staff still learning the system (59%). Schools reported that students were restricted from using medication administration systems due to liability (68%) and limited time for clinical staff to train students (32%). Table 26. Share of Schools Reporting Reasons for Restricting Student Access to Electronic Medical Records and Medication Administration*, by Academic Year
Electronic Medical
Records Medication
Administration
2013-2014 2014-2015 2013-2014 2014-2015
Liability 42.9% 35.8% 66.7% 68.1%
Insufficient time to train students 61.9% 70.4% 36.4% 31.9%
Staff fatigue/burnout 32.1% 29.6% 37.9% 30.4%
Staff still learning and unable to assure documentation standards are being met
63.1% 59.3% 45.5% 29.0%
Cost for training 29.8% 29.6% 24.2% 21.7%
Other 14.3% 7.4% 18.2% 11.6%
Patient confidentiality 28.6% 22.2% 18.2% 7.2%
Number of schools that reported 84 81 66 69
*Data collected for the first time in 2013-2014. **Numbers indicate the percent of schools reporting these restrictions as “uncommon”, “common” or “very common” to capture any instances where reasons were reported.” and add the same footnote to this Table in all regional reports.
2014-2015 BRN Annual School Report
University of California, San Francisco 23
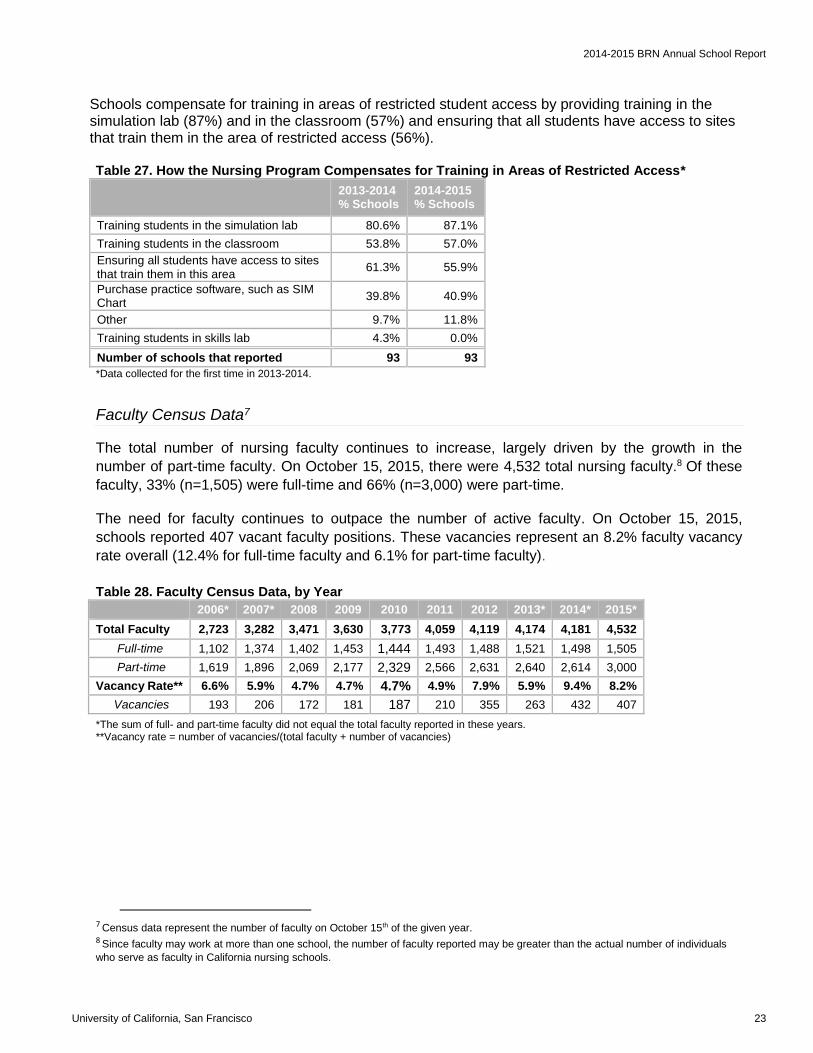
Schools compensate for training in areas of restricted student access by providing training in the simulation lab (87%) and in the classroom (57%) and ensuring that all students have access to sites that train them in the area of restricted access (56%). Table 27. How the Nursing Program Compensates for Training in Areas of Restricted Access*
2013-2014 % Schools
2014-2015 % Schools
Training students in the simulation lab 80.6% 87.1%
Training students in the classroom 53.8% 57.0%
Ensuring all students have access to sites that train them in this area
61.3% 55.9%
Purchase practice software, such as SIM Chart
39.8% 40.9%
Other 9.7% 11.8%
Training students in skills lab 4.3% 0.0%
Number of schools that reported 93 93
*Data collected for the first time in 2013-2014.
Faculty Census Data7
The total number of nursing faculty continues to increase, largely driven by the growth in the
number of part-time faculty. On October 15, 2015, there were 4,532 total nursing faculty.8 Of these
faculty, 33% (n=1,505) were full-time and 66% (n=3,000) were part-time.
The need for faculty continues to outpace the number of active faculty. On October 15, 2015,
schools reported 407 vacant faculty positions. These vacancies represent an 8.2% faculty vacancy
rate overall (12.4% for full-time faculty and 6.1% for part-time faculty).
Table 28. Faculty Census Data, by Year
2006* 2007* 2008 2009 2010 2011 2012 2013* 2014* 2015*
Total Faculty 2,723 3,282 3,471 3,630 3,773 4,059 4,119 4,174 4,181 4,532
Full-time 1,102 1,374 1,402 1,453 1,444 1,493 1,488 1,521 1,498 1,505
Part-time 1,619 1,896 2,069 2,177 2,329 2,566 2,631 2,640 2,614 3,000
Vacancy Rate** 6.6% 5.9% 4.7% 4.7% 4.7% 4.9% 7.9% 5.9% 9.4% 8.2%
Vacancies 193 206 172 181 187 210 355 263 432 407
*The sum of full- and part-time faculty did not equal the total faculty reported in these years. **Vacancy rate = number of vacancies/(total faculty + number of vacancies)
7 Census data represent the number of faculty on October 15th of the given year. 8 Since faculty may work at more than one school, the number of faculty reported may be greater than the actual number of individuals
who serve as faculty in California nursing schools.
2014-2015 BRN Annual School Report
University of California, San Francisco 24
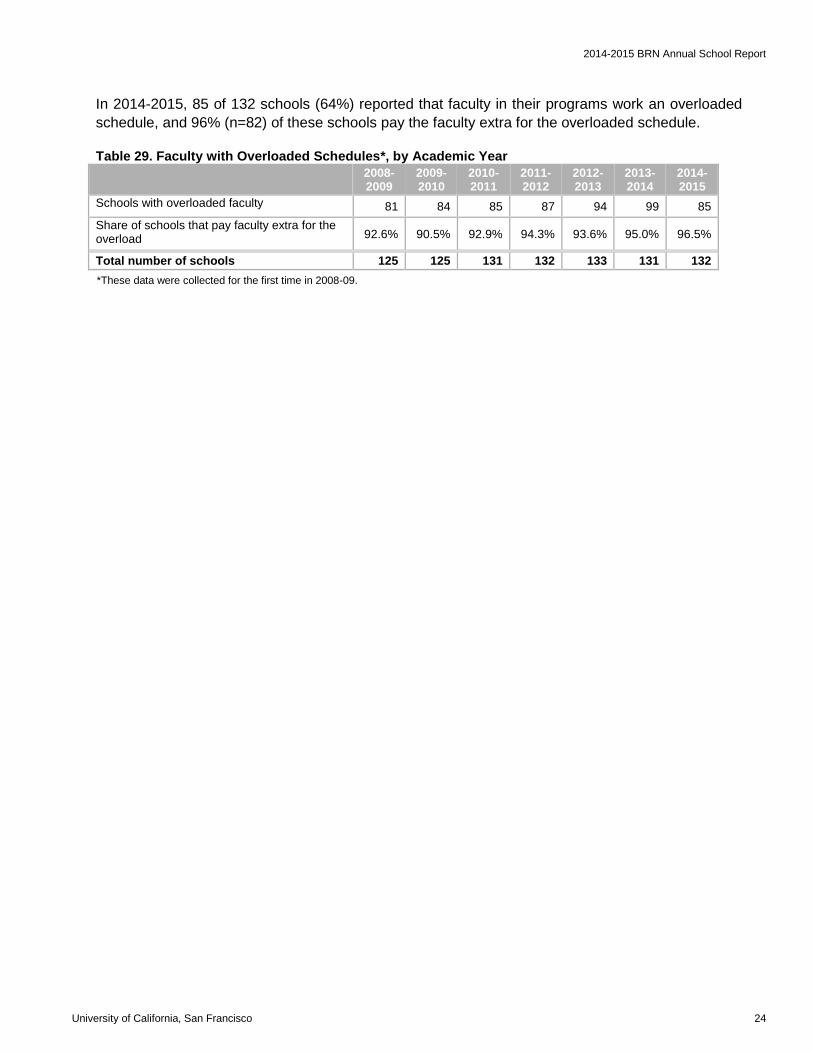
In 2014-2015, 85 of 132 schools (64%) reported that faculty in their programs work an overloaded
schedule, and 96% (n=82) of these schools pay the faculty extra for the overloaded schedule.
Table 29. Faculty with Overloaded Schedules*, by Academic Year
2008-2009
2009-2010
2010-2011
2011-2012
2012-2013
2013-2014
2014-2015
Schools with overloaded faculty 81 84 85 87 94 99 85
Share of schools that pay faculty extra for the overload 92.6% 90.5% 92.9% 94.3% 93.6% 95.0% 96.5%
Total number of schools 125 125 131 132 133 131 132
*These data were collected for the first time in 2008-09.
2014-2015 BRN Annual School Report
University of California, San Francisco 25
Summary
Over the past decade, the number of California pre-licensure nursing programs has grown
dramatically, increasing from 117 programs in 2005-2006 to 142 programs in 2014-2015. In the
past ten years, the share of nursing programs that partner with other schools to offer programs that
lead to a higher degree increased from 9 to 69.
California RN programs reported number of admission spaces available has fluctuated over the
past ten years. New student enrollments have also fluctuated over the past ten years, reaching a
peak of 14,228 in 2009-2010 and remaining stable around 13,200 for the past three years. This
decline was largely due to fewer qualified applications and enrollments to ADN programs.
Pre-licensure RN programs reported 11,119 completions in 2014-2015—a 48% increase in student
completions since 2005-2006. After four consecutive years of growth in the number of graduates
from California nursing programs from 2005-2006 to 2009-2010, the number of graduates declined
slightly and have fluctuated around 11,000 the last three years.
After three years of an increasing average retention rate to a ten-year high of 82% in 2012-2013,
the retention rate has declined slightly to 81% in 2014-2015. If retention rates remain at current
levels, the declining rate of growth among new student enrollments will likely lead to further declines
in the number of graduates from California nursing programs. At the time of the survey, 9% of new
nursing program graduates were unable to find employment, which is a decline from the high of
28% in 2009-2010. The number of new graduates employed in California has increased for the
second year and was reported at 73%.
Clinical simulation has become widespread in nursing education, with 92% (n=130) of programs
reporting using it in some capacity in 2015. On average programs reported students spend 8% of
their clinical training in simulation with the highest proportion of time in medical/surgical and
obstetrics. The importance of clinical simulation is underscored by data showing the continued use
of out-of-hospital clinical placements and programs continuing to report being denied access to
clinical placement sites that were previously available to them. In addition, a large number of
school—70% in 2014-2015—reported that their students had faced restrictions to specific types of
clinical practice.
Expansion in RN education has required nursing programs to hire more faculty to teach the growing
number of students. Even as the number of new student enrollments has started to decline, the
number of faculty has continued to rise, largely driven by increases in part-time faculty as the
number of full-time faculty has stayed relatively level since 2011. The number of nursing faculty has
increased by 66% in the past ten years, from 2,723 in 2006 to 4,532 in 2015. In 2015, 407 faculty
vacancies were reported, representing an overall faculty vacancy rate of 8.2% (12.4% for full-time
faculty and 6.1% for part-time faculty). This vacancy rate is the second highest reported in the last
ten years but a slight decrease from 2014.
2014-2015 BRN Annual School Report
University of California, San Francisco 26
APPENDICES
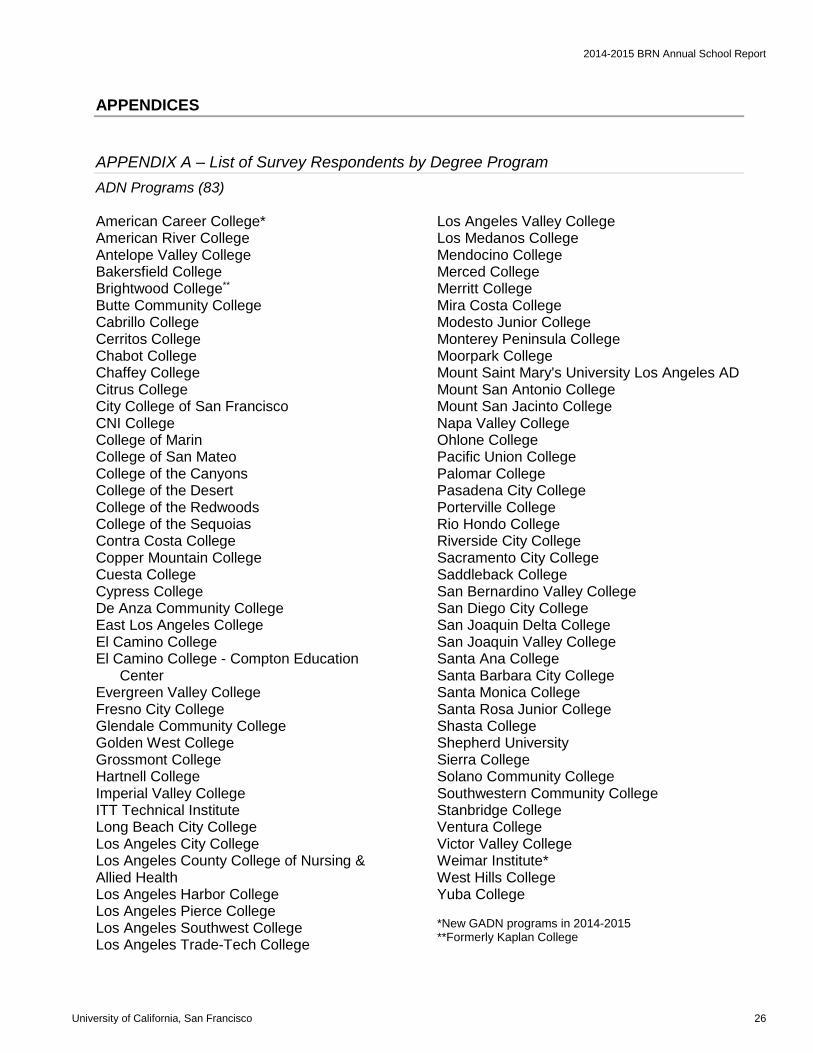
APPENDIX A – List of Survey Respondents by Degree Program
ADN Programs (83) American Career College* American River College Antelope Valley College Bakersfield College Brightwood College** Butte Community College Cabrillo College Cerritos College Chabot College Chaffey College Citrus College City College of San Francisco CNI College College of Marin College of San Mateo College of the Canyons College of the Desert College of the Redwoods College of the Sequoias Contra Costa College Copper Mountain College Cuesta College Cypress College De Anza Community College East Los Angeles College El Camino College El Camino College - Compton Education
Center Evergreen Valley College Fresno City College Glendale Community College Golden West College Grossmont College Hartnell College Imperial Valley College ITT Technical Institute Long Beach City College Los Angeles City College Los Angeles County College of Nursing & Allied Health Los Angeles Harbor College Los Angeles Pierce College Los Angeles Southwest College Los Angeles Trade-Tech College
Los Angeles Valley College Los Medanos College Mendocino College Merced College Merritt College Mira Costa College Modesto Junior College Monterey Peninsula College Moorpark College Mount Saint Mary's University Los Angeles AD Mount San Antonio College Mount San Jacinto College Napa Valley College Ohlone College Pacific Union College Palomar College Pasadena City College Porterville College Rio Hondo College Riverside City College Sacramento City College Saddleback College San Bernardino Valley College San Diego City College San Joaquin Delta College San Joaquin Valley College Santa Ana College Santa Barbara City College Santa Monica College Santa Rosa Junior College Shasta College Shepherd University Sierra College Solano Community College Southwestern Community College Stanbridge College Ventura College Victor Valley College Weimar Institute* West Hills College Yuba College *New GADN programs in 2014-2015 **Formerly Kaplan College

2009-2010 BRN Annual School Report
27
LVN to ADN Programs Only (7) Allan Hancock College Carrington College College of the Siskiyous Gavilan College Mission College
Reedley College at Madera Community College Center Unitek College
BSN Programs (36) American University of Health Sciences Azusa Pacific University Biola University California Baptist University Concordia University Irvine CSU Bakersfield CSU Channel Islands CSU Chico CSU Dominguez Hills CSU East Bay CSU Fresno CSU Fullerton CSU Long Beach CSU Northridge CSU Sacramento CSU San Bernardino CSU San Marcos CSU Stanislaus Dominican University of California
Holy Names University Loma Linda University Mount Saint Mary's University Los Angeles BSN National University Point Loma Nazarene University Samuel Merritt University San Diego State University San Francisco State University Simpson University Sonoma State University University of California Irvine University of California Los Angeles University of Phoenix University of San Francisco Valley Foundation School of Nursing at SJSU West Coast University Western Governors University
ELM Programs (16) Azusa Pacific University California Baptist University Charles R. Drew University CSU Dominguez Hills CSU Fresno CSU Fullerton CSU Long Beach CSU Los Angeles Samuel Merritt University
San Francisco State University United States University University of California Los Angeles University of California San Francisco University of San Diego, Hahn School of Nursing University of San Francisco Western University of Health Sciences
2014-2015 BRN Annual School Report
University of California, San Francisco 28
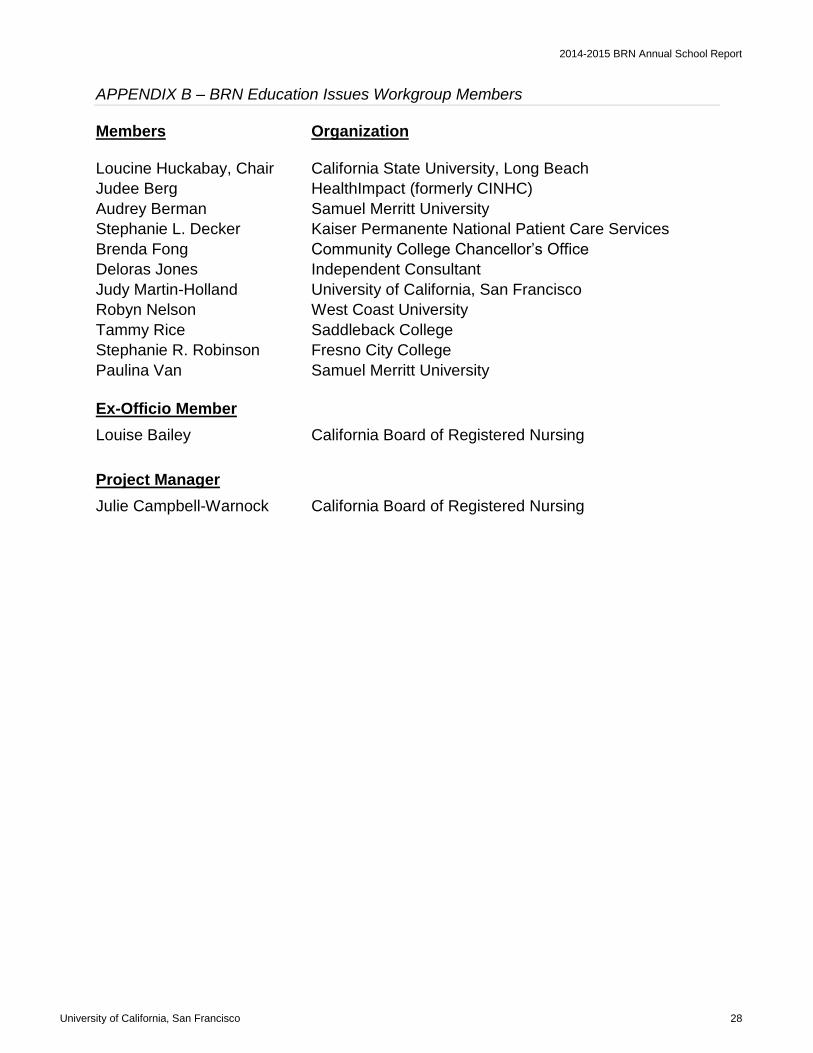
APPENDIX B – BRN Education Issues Workgroup Members
Members Organization
Loucine Huckabay, Chair California State University, Long Beach
Judee Berg HealthImpact (formerly CINHC)
Audrey Berman Samuel Merritt University
Stephanie L. Decker Kaiser Permanente National Patient Care Services
Brenda Fong Community College Chancellor’s Office
Deloras Jones Independent Consultant
Judy Martin-Holland University of California, San Francisco
Robyn Nelson West Coast University
Tammy Rice Saddleback College
Stephanie R. Robinson Fresno City College
Paulina Van Samuel Merritt University
Ex-Officio Member
Louise Bailey California Board of Registered Nursing
Project Manager
Julie Campbell-Warnock California Board of Registered Nursing