california biomass utilization facility
TRANSCRIPT

California Biomass
Utilization Facility
Feedstock Supply Report
Completed for:
The State of California
Department of Housing and Community
Development
Completed by:
CT Bioenergy Consulting
Twain Harte, California
October 2018

CALIFORNIA BIOMASS UTILIZATION FACILITY (BUF)
FEEDSTOCK SUPPLY REPORT
OCTOBER 2018

TABLE OF CONTENTS
PAGE
CHAPTER 1 – EXECUTIVE SUMMARY .............................................................................................. 1
1.1 Overview .......................................................................................................................................... 1
1.2 Biomass Feedstock Supply Area (FSA).............................................................................................. 1
1.3 Biomass Feedstock Volume in the FSA ............................................................................................. 2
1.4 Biomass Feedstock Delivered Price Estimates ................................................................................. 3
1.5 Discussion ......................................................................................................................................... 4
1.6 Conclusions ....................................................................................................................................... 4
CHAPTER 2 – INTRODUCTION ........................................................................................................ 6
2.1 National Disaster Resilience Competition Program ......................................................................... 6
2.2 Tuolumne County History ................................................................................................................. 6
CHAPTER 3 – FEEDSTOCK SUPPLY AREA ....................................................................................... 11
3.1 Feedstock Supply Area (FSA) .......................................................................................................... 11
3.2 Biomass Feedstock Resource Base ................................................................................................. 12
3.3 Standing Biomass Volume .............................................................................................................. 15
3.4 Tree Mortality High Hazard Zones ................................................................................................. 15
CHAPTER 4 – BIOMASS FEEDSTOCK SUPPLY VOLUME ................................................................... 19
4.1 Forest-Derived Biomass Supply Volume ........................................................................................ 19
4.1.1 Harvest Residuals ........................................................................................................................... 20
4.1.2 Pre-commercial Thinning ............................................................................................................... 23
4.1.4 Standing Dead Trees ....................................................................................................................... 24
4.1.4.1 Standing Dead Trees Removed Concurrently with Harvests 26
4.1.4.2 Standing Dead Trees Removed within 100 feet of Roads 27 4.1.4.3 Standing Dead Trees Within 101 feet and 1,000 feet from Roads 27
4.1.5 Plantation Thinning and Timber Stand Improvement .................................................................... 32
4.1.6 Other Community-based Programs ................................................................................................ 32
4.1.7 Forest Derived Biomass Summary .................................................................................................. 33
4.2 Potentially vs. Practically Available Forest Derived Biomass Feedstock Supply ............................ 33
4.3 Non-Forest Derived Biomass Feedstock Supply ............................................................................. 35
4.3.1 Sawmill Residuals ........................................................................................................................... 35
4.3.2 Orchard Removals .......................................................................................................................... 36
4.3.3 Urban/Industrial Wood Waste ....................................................................................................... 37
4.3.4 Tree Service Debris ......................................................................................................................... 38

TABLE OF CONTENTS
PAGE
4.3.5 Summary of Non-Forest Derived Feedstocks ................................................................................. 39
4.4 SUMMARY OF PRACTICALLY AVAILABLE BIOMASS FEEDSTOCKS .................................................. 39
4.6 CURRENT BIOMASS Users in the FSA ............................................................................................. 41
4.7 Net Biomass Feedstock Available for BUF ...................................................................................... 43
4.8 Allocating Practically Available Forest Derived Biomass Supply by Zone ...................................... 45
CHAPTER 5 – BIOMASS FEEDSTOCK PRICING ................................................................................ 49
5.1 Current and Historic Pricing ........................................................................................................... 49
5.2 Forest Derived Biomass Production Costs ..................................................................................... 50
5.3 Processing Equipment .................................................................................................................... 53
5.4 Future Biomass Supply Risks and Opportunities ............................................................................ 54
5.4.1 Supply Risks .................................................................................................................................... 54
5.4.2 Supply Opportunities ...................................................................................................................... 54
5.4.3 Supply Risks and Opportunities from Stakeholder Interviews ....................................................... 55
5.4.3.1 Sierra Pacific Industries (SPI) 55 5.4.3.2 Pacific Ultrapower Chinese Station (CS) 56
5.4.3.3 US Forest Service 57
5.4.3.4 Central Valley Ag Group (CVAG) 58
5.4.3.5 AmPine 58
5.4.3.6 American Wood Shavings (AWS) 59
5.4.3.7 Central Sierra Environmental Resource Center (CSERC) 59
5.4.4 Policy Risks ..................................................................................................................................... 59
5.4.4.1 Federal 59
5.4.4.2 State 60
5.4.4.3 Local 62

CHAPTER 1 – EXECUTIVE SUMMARY
1.1 OVERVIEW
In the wake of the 2013 Rim Fire, the State of California received a grant through the National Disaster Resilience Competition, a program administered by the US Department of Housing and Urban Development. A portion of the grant funds are to be used to assist Tuolumne County (TC) in planning a Biomass Utilization Facility (BUF). The goal is to develop a business, or businesses that can utilize biomass (i.e., a BUF), and in the process, enhance forest and community resilience in the region affected by the Rim Fire.
The biomass1
1 For this study biomass has been defined as any portion of a tree that is not a merchantable sawlog. This includes trees that are too small to be utilized as sawlogs; the parts of larger, sawlog size trees that are not used as logs (e.g. limbs, tops, and cull sections); and dead trees regardless of size that cannot be utilized as sawlogs.
feedstock analysis in this report is the first phase in work aimed at assessing the feasibility of a BUF. This report defines a Feedstock Supply Area (FSA) in the TC region; characterizes the types of biomass feedstocks available in the FSA; provides an estimate of the annual biomass volume available to a BUF; and provides an estimate of the cost for delivering biomass to a BUF facility.
1.2 BIOMASS FEEDSTOCK SUPPLY AREA (FSA)
The feedstock supply area considered in this study is an area defined by a 40-mile straight line radius around the Camage Avenue Industrial Park in Sonora, California (see Figure 3.1 on page 11). That site was selected from several sites considered because it is the closest to the majority of the forest resource in TC. Proximity to the forest resource is important since minimizing transportation cost is a critical component in the economic viability of any BUF. To aid in assessing supply, the FSA was subdivided into Zone 1 (< 20 miles from the Camage site) and Zone 2 (between 20 and 40 miles).
Within the FSA there is a total of about 816,000 acres of forestland. However, not all of that forested area can be considered productive for supplying a BUF with biomass raw materials. Therefore, about 321,000 acres were excluded because they are in National Parks, Wilderness Areas, areas with slopes greater than 35 percent, etc. Thus, after exclusions there is an estimated 495,000 acres of productive forestland. Specific to the productive forestland area, about 45 percent is privately owned and about 55 percent is publicly owned. Also specific to the productive forestland area, about 18 percent (87,000 acres) is owned and managed by industrial timberland owners.
Per US Forest Service Forest Inventory and Analysis data, there is an estimated 50.7 million bone dry tons of standing timber on areas designated as timberland in the FSA.2
2 Timberland (also referred to as Productive Forestland in this report) is land that can grow at least 20 cubic feet of wood fiber/acre/year and that is not reserved for other uses (e.g., National Parks, Wilderness, etc.)
About 67 percent of the standing timber is on publicly owned land and 33 percent is on privately owned land. About 10 percent of the total standing timber volume is dead trees. Since about 2010 the Southern Sierra forests have experienced high mortality from the combined effects of drought and insect attacks. Areas heavily affected by tree mortality have been designated as High Hazard Zones by the State of California. An estimated 93 percent of the productive forestland in the FSA has been designated as High Hazard Zone.
California BUF – Feedstock Supply Study Page 1

CHAPTER 1 – EXECUTIVE SUMMARRY
1.3 BIOMASS FEEDSTOCK VOLUME IN THE FSA
The biomass feedstocks considered in this study were a combination of those derived directly from forests including: timber harvest residuals, pre-commercial thinning, standing dead trees removed concurrently with timber harvests, standing dead trees removed within 100 feet of existing roads, standing dead trees removed from within 101 to 1000 feet of existing roads, plantation thinnings, and biomass from community programs. Additionally, biomass from non-forest direct sources was also considered including: mill residues, orchard removals, urban/industrial wood, and tree service companies.
The preceding sources were analyzed to estimate the total annual volume of biomass supply Potentially Available from each. Additionally, safety screens were applied to each source to reduce the total annual volume to the Practically Available annual volume. The safety screens account for factors such as limited access to some materials because of forest road systems, or limited ability to cost-effectively gather material, or in the case of dead trees, to recognize the limited time during which this material is viable for utilization. Finally, an additional screen was applied to account for biomass supply that is already being utilized by existing facilities, which results in an estimate of the Net Quantity Available for a new BUF.
The results of the preceding analysis are illustrated in Table 1.1 which shows a total potentially available annual volume of 641.8 thousand BDT. After applying screens to filter out material not readily available, the practically available annual volume is estimated to be 508.3 thousand bone dry tons. Finally, after accounting for material used by existing facilities the net quantity available is 42.8 thousand bone dry tons.
Table 1.1 - Annual Biomass Feedstock Availability and Demand Within the FSA (BDT/Year)
Biomass Feedstock Type
Quantity Potentially Available
Quantity Practically Available
Quantity Already Being
Utilized
Net Quantify Available
BDT BDT
Use Type: Biomass
Fuel
(BDT Logs and Chips)
Use Type: Mulch & Compost
(BDT Logs and Chips)
Use Type: Animal
Bedding
(BDT Logs only)
Use Type: Particle-
Board
(BDT Logs only)
Use Type: Other
(BDT from all Sources) BDT
Forest Derived Feedstocks 279,659 170,592 105,000 9,000 16,800 4,500 2,000 33,292
Non-Forest Derived Mill Residues 124,740 124,740 30,294 5,346 0 30,640 53,460 5,000
Non-Forest Derived: Orchard Removals 167,854 167,854 153,000 0 0 0 12,500 2,354
Non-Forest Derived: Urban/Industrial & Tree Service 69,522 45,163 15,000 20,000 0 0 8,000 2,163
Total 641,775 508,349 303,294 34,346 16,800 35,140 75,960 42,809
California BUF – Feedstock Supply Study Page 2

CHAPTER 1 – EXECUTIVE SUMMARRY
To aid in understanding the preceding table, the leftmost column shows the total potentially available volume. Then the potentially available amount is reduced to account for material that isn’t readily available. The result of that screening is shown as the column labeled practically available (i.e., the second column from the left). Next the five middle data columns labeled “quantity already being utilized” show the biomass volume consumed annually by various existing uses. The total biomass volume in the middle five columns that is already being used is subtracted from the practically available volume to arrive at the net quantity available, which is shown in the far right column.
1.4 BIOMASS FEEDSTOCK DELIVERED PRICE ESTIMATES
In addition to estimating available biomass volume, one must also understand the delivered cost of biomass. The consulting team elected to focus this analysis on the 170,592 BDT of forest derived biomass feedstock estimated to be practically available annually. This is because utilization of these feedstock sources is best aligned with the biomass utilization goals of the disaster resilience program and because it comprises the largest portion of the currently unused material. Table 1.2 shows the estimated delivered cost of various specific feedstock sources within the broad grouping of forest derived feedstocks. See Chapter 4 for additional detail about the specific feedstock sources.
Table 1.2 – Estimated Delivered Biomass Cost from Various Forest Derived Sources ($/BDT)
Fuel Type
Feedstock Supply Area
Zone Landowner
Type Annual Volume
(BDT)
Avg. Delivered Cost for Row
($/BDT)
Community-Based/Utility Programs Zone 1 Private 1,830 $ 25.04
Community-Based/Utility Programs Zone 2 Private 2,745 $ 29.86
Standing Dead Trees Removed with Harvest Zone 1 Public 3,362 $ 44.86
Standing Dead Trees Removed with Harvest Zone 1 Private 1,399 $ 44.86
Standing Dead Trees Removed with Harvest Zone 2 Public 2,751 $ 53.09
Standing Dead Trees Removed with Harvest Zone 2 Private 4,196 $ 53.09
Harvest Residuals: Top Piles, Burn Piles Zone 1 Public 7,146 $ 56.77
Harvest Residuals: Top Piles, Burn Piles Zone 1 Private 8,813 $ 56.77
Harvest Residuals: Top Piles, Burn Piles Zone 2 Public 5,847 $ 66.40
Harvest Residuals: Top Piles, Burn Piles Zone 2 Private 26,438 $ 66.40
Standing Dead Trees > 20" DBH within 100' of roads Zone 1 Public 2,202 $ 72.33
Standing Dead Trees > 20" DBH within 100' of roads Zone 1 Private 5,509 $ 72.33
Pre-commercial & Plantation Thinning Zone 1 Public 1,938 $ 72.75
Pre-commercial & Plantation Thinning Zone 1 Private 806 $ 72.75
Standing Dead Trees > 20" DBH 101 to 1000' of roads Zone 1 Public 3,987 $ 73.04
Standing Dead Trees > 20" DBH 101 to 1000' of roads Zone 1 Private 10,065 $ 73.04
Standing Dead Trees > 20" DBH within 100' of roads Zone 2 Public 17,817 $ 80.14
Standing Dead Trees > 20" DBH within 100' of roads Zone 2 Private 7,012 $ 80.14
Standing Dead Trees > 20" DBH 101 to 1000' of roads Zone 2 Public 32,259 $ 80.86
Standing Dead Trees > 20" DBH 101 to 1000' of roads Zone 2 Private 12,810 $ 80.86
Pre-commercial & Plantation Thinning Zone 2 Public 2,720 $ 82.35
Pre-commercial & Plantation Thinning Zone 2 Private 8,940 $ 82.35
Total 170,592
California BUF – Feedstock Supply Study Page 3

CHAPTER 1 – EXECUTIVE SUMMARRY
As the data in the preceding table shows, the delivered prices range from a low of about $25 per BDT to a high of about $82 per BDT. As shown in Table 1.1, only about 33,000 BDT of the 170,592 BDT of forest derived biomass is estimated to be currently unutilized. This is important because the existing users are highly likely to utilize the lowest cost materials before utilizing higher cost materials. Thus, it is probable that a new BUF facility would likely be forced to pay prices at the high end of the range of the delivered costs shown Table 1.2.
1.5 DISCUSSION
There are several wildcards that complicate the analysis of feedstock supply and cost for a TC BUF. The first is the significant volume of standing dead trees in the FSA. Normally standing dead trees would not be considered as a viable source of supply because they decay and eventually cannot be utilized. In this case, however, it was deemed that standing dead trees should be included because of the large volume of dead trees and because many of them are large diameter, which may extend their “shelf-life”. The analysis of how much biomass feedstock might be available from dead trees was conservative in that it was limited to only trees greater than 20 inches in diameter at breast height. Also, the usable volume of dead trees was discounted to account for trees that died early in the onset of the dead tree epidemic and therefore may already be too decayed for utilization.
Another key wildcard is the status of Pacific Ultrapower Chinese Station located in Chinese Camp. The 20 MW biomass plant is currently operating in the second year of a five year BioRAM power sales contract. Contract terms specify that beginning in 2019 a minimum of 80 percent of the plant’s fuel must come from certain designated forest derived biomass sources. If the plant cannot meet this requirement, they may elect to “opt out”. In that case, it is very likely the plant will continue to operate, but it’s demand for forest derived biomass fuel would likely decline and a significant portion of the 105,000 BDT per year of forest derived material currently considered utilized could become available to a TC BUF. Plant managers have indicated opting out is under serious consideration. However, California Governor Brown recently signed Senate Bill 901, which appears to have language that will provide contract relief to the Pacific Ultrapower Chinese Station plant and other BioRAM power plants. It is still unclear when Senate Bill 901 will take effect. Additionally, the details of how it will be implemented are not known. Nevertheless, the bill’s passage makes it more likely than not that the plant will continue operating under the BioRAM contract and sustain their demand for at least some level of forest derived material for the foreseeable future.
1.6 CONCLUSIONS
The conclusions that can be drawn from the feedstock supply report are:
• There is a significant forested land base and standing timber volume in the FSA that is currently supporting a number of forest products facilities. There is, however, some forest derived biomass material that is not currently being utilized. More specifically, the total potentially available annual volume is nearly 642,000 bone dry tons, which reduces to about 508,0000 bone dry tons after accounting for material not readily or cost effectively available. That amount is further reduced by the consumption of existing users, resulting in a net available quantity of just over 42,000 BDT.
California BUF – Feedstock Supply Study Page 4

CHAPTER 1 – EXECUTIVE SUMMARRY
• Since most of the biomass supply identified in the study is already being utilized, it is likely that the material still available will be among the highest cost types of biomass. This is because existing users are very likely to already be utilizing the lowest cost sources.
• The finding of the relatively small amount of currently unutilized biomass material and the likelihood of a relatively high price for the material is discouraging for the viability of BUF facility. However, there are several factors at play that create uncertainty and, which if changed, could significantly increase the chances for a viable BUF facility. The first is the status of Pacific Ultrapower Chinese Station. Although it more likely than not will continue to operate under its BioRAM contract, its demand for forest derived fuel could dwindle as the interpretation and implementation of SB 901 becomes clearer over time. In the event of less demand for forest derived fuel from the plant, additional biomass volume would likely be available to a BUF and it would reduce upward pressure on biomass cost. Second, the large number of standing dead trees in the region is an awkward source of supply because it cannot be counted on as a secure, long-term source of supply.
• The issues of available biomass supply, biomass cost, and the implications of wildcard issues including existing users and standing dead trees will all be explored in greater detail in Phase 2 of the study, which will analyze the economic feasibility of a BUF.
California BUF – Feedstock Supply Study Page 5
CHAPTER 2 – INTRODUCTION
This chapter provides the context for this feedstock supply study and the associated California Biomass Utilization Facility feasibility analysis.
2.1 NATIONAL DISASTER RESILIENCE COMPETITION PROGRAM
The National Disaster Resilience Competition (NDRC) is a national program administered by the US Department of Housing and Urban Development (HUD) that provides grants totaling up to $1 billion to communities to rebuild in a more resilient way following major disaster. The funds are awarded competitively and are designed to promote risk assessment and planning and the implementation of innovative resilience projects to better prepare communities for future extreme natural events.
The State of California received an NDRC grant to help restore forest and watershed health, support local economic development, and increase disaster resilience in the rural areas affected by the 2013 Rim Fire. The monies received will be used as part of the Community and Watershed Resilience Program (CWRP), which is designed to develop three project activities to provide long-term community resilience. One of the project activities of the California NDRC grant is planning for the development of a Biomass Utilization Facility (BUF) in Tuolumne County. One aim of the development of a BUF facility is to enhance forest resilience in the region affected by the Rim Fire. The Beck Group, a forest products planning and consulting firm, was retained to complete the BUF planning effort. CT Bioenergy Consulting (CTB) of Twain Harte, California, a sub-contractor to BECK, completed this biomass feedstock supply assessment, which is the first step in the BUF planning effort.
2.2 TUOLUMNE COUNTY HISTORY
TC has had a long history of biomass utilization for renewable energy production, primarily from the conversion of sawmill residues such as bark, chips, sawdust and shavings from the two large sawmills in Standard and Tuolumne. For more than 100 years the region has maintained a progressive role as a generator of renewable energy from biomass. In the early 1900’s the Standard Lumber Company installed wood-fired steam boilers at the sawmilling complex located in Standard, California (east of Sonora) to dry pine lumber and run the steam-driven machinery. Then in the late 1960’s the mill became a cogeneration facility as a 3 MW steam turbine-generator was installed to provide power to run the mill. The original boiler was replaced in the mid-1980’s and a 6 MW turbine-generator installed. The steam-turbine has recently been upgraded to 11 MW of electrical production capacity. In 1986 Ultrapower constructed a 20 MW stand-alone wood fired power plant near Chinese Camp, which continues to operate today. The Pacific Ultrapower Chinese Station bioenergy facility was the first in the area to use large amounts of forest-derived biomass from timber harvest residuals and pre-commercial thinnings, particularly during the first 10 years of operation. Figure 2.1 shows the old Standard Lumber Company sawmill complex. Figure 2.2 shows the 20 MW Pacific Ultrapower Chinese Station facility.
California BUF – Feedstock Supply Study Page 6

CHAPTER 2 - INTRODUCTION
Figure 2.1 - Standard Lumber Company Sawmill Circa 1901
Figure 2.2 – Pacific Ultrapower Chinese Station located in Chinese Camp
California BUF – Feedstock Supply Study Page 7

CHAPTER 2 - INTRODUCTION
Although TC has had a long history of biomass utilization for energy, a relatively low value commodity, the surrounding forests are still choked with excess trees and brush that make them extremely susceptible to loss from wildfire and drought. The HUD grant seeks to help planning efforts aimed at constructing an additional Biomass Utilization Facility. Ideally, the additionally facility will not compete directly with existing users and will produce products that can support the high costs of the biomass thinning and fuels reduction activities, which are needed to restore the forestland to a more resilient condition.
TC is home to an extensive forest products industry and some of the most productive and beautiful forestland in the state. Starting on the southwestern border of the county along the edge of the fertile San Joaquin Valley the county ranges from near sea level elevation in the west rising to more than 9,900 foot elevation at the Sierra Crest along its eastern border. TC is also home to a large portion of Yosemite National Park, one of the most popular and majestic parks in the National Park system. Figure 2.3 provides an overview map of the county.
TC is estimated to be greater than 70 percent forested and contains two of the last three remaining large-scale sawmills within the central and southern Sierra Nevada. The only other remaining sawmill between TC and the Mexican border is located 165 miles south at Terra Bella, California.
Figure 2.3 - Map of Tuolumne County
California BUF – Feedstock Supply Study Page 8

CHAPTER 2 - INTRODUCTION
Unfortunately, TC also has a long history of devastating wildfires as shown in Figure 2.4. Over the past three decades there have been numerous wildfires in the region. Most notable were the Stanislaus Complex Fire, which burned more than 145,000 acres in the Tuolumne and Merced River watersheds in 1987 and the Rim Fire which burned 257,314 acres in the Tuolumne River watershed in 2013. The Rim Fire is still considered the largest and most environmentally destructive wildfire ever to burn in the Sierra Nevada.
Figure 2.4 - Wildfire History Map of Rim Fire and Surrounding Area
Recognizing the extent of the destruction caused by these conflagrations, federal, state, and local policymakers have realized that something must be done to help reverse this destructive wildfire trend and return forests to a more resilient state. Along with policy-makers, a broad cross-section of the public is now crying out for a dramatic increase in the pace and scale of forest health treatments including selectively thinning trees followed by prescribed fire. These treatments can increase the forest’s resilience to disturbances such as insects, disease and wildfire.
Biomass utilization facilities can increase the amount of area treated by providing a financial incentive to undertake forest management treatments; provide a productive use for small diameter trees and wood waste that would otherwise be piled and burned onsite; and help sustain rural economies. Utilization can create economic, public health, and environmental benefits by using local contractors to thin overstocked forests and reduce the amount of woody biomass burned in a wildfire or following forest operations.
California BUF – Feedstock Supply Study Page 9
CHAPTER 2 - INTRODUCTION
One promising approach is the development of a BUF to help utilize a variety of biomass feedstocks from the Productive Forestlands3 within and adjacent to Tuolumne County. A key initial step in this process is the evaluation of the biomass feedstock supply availability within this region. This study was undertaken to help address the issue of biomass feedstock supply for the BUF.
3 For this study the term Productive Forestland generally means land that is capable of growing at least 20 cubic feet of wood fiber per acre per year. It generally includes mixed coniferous & conifer/oak forests and does not include oak woodland between 2,000 and 7,000 feet elevation.
California BUF – Feedstock Supply Study Page 10

CHAPTER 3 – FEEDSTOCK SUPPLY AREA
The following chapter describes the area considered in the feedstock supply analysis.
3.1 FEEDSTOCK SUPPLY AREA (FSA)
Considering that sawmilling operations have existed in and around Standard since the late 1800’s, the Industrial Park located on Camage Avenue near the Sierra Pacific Industries sawmill in Standard, California was chosen as a reasonable starting point from which to assess biomass availability for a prospective BUF. While there are at least two other industrial sites within TC that could be considered by BUF developers, the Camage Industrial Park has the shortest haul distance from the forest. Transportation is one of the highest cost items in the production of biomass feedstocks and the Camage site allows for minimization of transportation costs. Thus, the combination of a long history of forest products manufacturing and minimization of transportation costs led to the selection of the Camage site. Figure 3.1 below shows a map of this 40 mile radius biomass FSA for the BUF.
Figure 3.1- 40 Mile Radius Biomass Feedstock Supply Area
California BUF – Feedstock Supply Study Page 11

CHAPTER 3 – FEEDSTOCK SUPPLY AREA
3.2 BIOMASS FEEDSTOCK RESOURCE BASE
While the bulk of the FSA is in Tuolumne County, it also contains portions of eight central California counties, including the heavily forested areas of Calaveras and Mariposa counties. It also includes major nut and fruit orchard production areas are located in Stanislaus, Merced and San Joaquin counties located within the San Joaquin Valley.
Utilizing several forest vegetation analysis programs, CTB compiled the following description of the biomass FSA and the biomass feedstock types. These programs included the US Forest Service, Forest Inventory EVALIDator program 4
4 US Department of Agricultural, Forest Service, Northern Research Station. Forest Inventory EVALIDator web-application version 1.7.0.01 May 2018.
(FIA), the CALFIRE Fire and Resource Protection Program, and the Landscape, Ecology, Modeling, Mapping, and Analysis Program (LEMMA)5
5 LEMMA (Landscape Ecology, Modeling, Mapping, and Analysis), Forestry Sciences Lab, Oregon State University.
. Averaging the data generated from these programs, CTB estimates there are approximately 816,700 acres of Productive Forestland within the FSA in forest types generally ranging from mixed Ponderosa/Gray Pine at the lower elevations to mixed conifer in the mid-elevations and true fir at the higher elevations.
In order to provide a more realistic estimate of biomass feedstock availability, slopes greater than 35 percent as well as non-harvestable areas have been excluded from this acreage, including riparian 6
6 Average riparian zone width used was 75 feet for all Class 1, 2, and 3 watercourses and lakes.
zones, Wild and Scenic River corridors, California spotted owl habitat reserve areas, Roadless and Wilderness areas, National and State Parks, other non-timber management areas and the most heavily burned portions of the Rim Fire. The excluded areas totaled 321,547 acres. After subtracting the excluded areas, CTB estimates that there are 495,153 acres of Productive Forestland potentially available for biomass feedstock sourcing within the FSA. Table 3.1 provides a summary of the Productive Forestland acres by ownership type and by county for the FSA.
Table 3.1 - Productive Forestland Acreage after Exclusions by Ownership and County within the FSA
County Private
Non-Industrial Private
Industrial US Forest
Service BLM Tribal TOTAL
Tuolumne 33,028 41,302 177,023 1,474 396 253,223
Calaveras 46,711 46,041 41,136 5,294 16 139,198
Amador 38,612 0 8,203 1,176 0 47,991
Mariposa 13,939 0 31,580 1,632 29 47,180
Alpine 526 0 4,394 0 0 4,920
El Dorado 2,594 0 47 0 0 2,641
TOTAL 135,410 87,343 262,383 9,576 441 495,153
California BUF – Feedstock Supply Study Page 12

CHAPTER 3 – FEEDSTOCK SUPPLY AREA
From Table 3.1 it can be calculated that 271,960 acres, or almost 55 percent of the Productive Forestland7
7 Industrial Productive Forestland is land owned and managed by companies that also have manufacturing facilities. Private Non-Industrial, in contrast, is typically made up of small tracts (e.g., 20 to 500 acres) of forestland owned by individuals.
within the FSA is managed by the Federal government (USFS, BLM) with only about 87,000 acres, or 18 percent managed industrially. Clearly the federally owned and managed US Forest Service lands are critical to the successful long-term feedstock supply within this FSA. While the non-industrial ownership accounts for over 27 percent of the FSA Productive Forestland, it is important to realize that this ownership type is highly fragmented consisting of many smaller landowners who often have differing management goals and objectives for their lands. This situation makes it difficult to access supply from this ownership group on a consistent and long-term basis.
The FSA was divided into two zones with Zone 1 being 0 to 20 miles from the Camage site and Zone 2 being 20 to 40 miles. Table 3.2 shows the acres of Productive Forestland within each of the two zones by ownership type.
Table 3.2 - Acres of Productive Forestland within each Distance Zone within the FSA
Ownership Type
Zone 1*
*Zone 1 = 0 to 20 miles from Camage Industrial Park
Zone 2**
**Zone 2 = 21 to 40 miles from Camage Industrial Park
Study Area
Acres % of Total
in Zone Acres % of Total
in Zone Acres % of Total Study Area
Private Industrial 17,914 14.0 69,429 18.9 87,343 17.6
Private Non-Industrial 42,874 33.6 92,536 25.2 135,410 27.3
Subtotal Private 60,788 47.6 161,965 44.1 222,753 45.0
Public - Federal 66,590 52.1 205,370 55.9 271,960 54.9
Public - State 0 0.0 0 0.0 0 0.0
Public - Local 0 0.0 0 0.0 0 0.0
Public - Other 0 0.0 0 0.0 0 0.0
Subtotal Public 66,590 52.1 205,370 55.9 271,960 54.9
Tribal 386 0.3 55 0.0 441 0.1
Grand Total 127,764 100.0 367,390 100.0 495,154 100.0
% of Total Study Area 25.8 74.2
Exclusions include Federal Wilderness, National & State Parks, Wild & Scenic Rivers, Slopes > 35%, Poorly and non-stocked lands, Riparian Zones, Spotted Owl PACs, Rim Fire areas with 70 to 100 percent Basal Area loss, and areas > ½ mile from existing roads.
Figure 3.2 provides an overview map showing Productive Forestland ownership within the FSA. The figure shows Zone 1 and Zone 2 boundaries and the location of key ownership blocks.
California BUF – Feedstock Supply Study Page 13

CHAPTER 3 – FEEDSTOCK SUPPLY AREA
Figure 3.2 - Productive Forestland Ownership within the FSA
California BUF – Feedstock Supply Study Page 14

CHAPTER 3 – FEEDSTOCK SUPPLY AREA
The map in Figure 3.2 clearly shows the concentration of National Forest ownership within the FSA to the north and east of the Camage Avenue site. Nearly all the National Forest Productive Forestland within the FSA is located on the Stanislaus National Forest. This makes the Stanislaus National Forest a key player in any biomass feedstock supply program.
3.3 STANDING BIOMASS VOLUME
Using the US Forest Service Forest Inventory and Analysis database, it is estimated that the FSA just described (i.e., a 40-mile radius around the Camage Avenue industrial site) contains an estimated 50.7 million bone dry tons of standing timber as shown in Table 3.3. About two-thirds of the standing volume is on public lands and over 50 percent of the standing volume is in Tuolumne County. Additionally, about 10 percent of the standing volume is dead trees. Finally, about 25 percent of the standing volume is various true firs, about 33 percent is various pine species (e.g., ponderosa and sugar), and about 17 percent is incense cedar.
Table 3.3 – Estimated Standing Timber Volume within the FSA (BDT thousands)
County Public Standing Volume
(BDT thousands) Private Standing Volume
(BDT thousands) Total Standing Volume
(BDT thousands)
Tuolumne 22,181 4,526 26,707
Calaveras 5,098 9,288 14,386
Mariposa 5,044 1,197 6,240
Amador 421 1,347 1,768
Alpine 790 0 790
El Dorado 260 513 774
Total 33,795 16,870 50,665
3.4 TREE MORTALITY HIGH HAZARD ZONES
An additional consideration for this BUF feedstock supply study is that the California Tree Mortality Task Force (TMTF) estimates 129 million trees have died throughout the Sierra between 2010 and 20178 . Figure 3.3 on the following page illustrates a forest in the FSA heavily affected by the tree mortality crisis.
8 http://www.fire.ca.gov/treetaskforce/downloads/WorkingGroup_Minutes/Facts_and_Figures_April_2018.pdf
California BUF – Feedstock Supply Study Page 15

CHAPTER 3 – FEEDSTOCK SUPPLY AREA
Figure 3.3 – Example of Recent Tree Mortality on the National Forest
The unprecedented die off has created not only a huge wildfire hazard but also a serious threat to public safety along roads and public spaces throughout the forests of the central and southern Sierra. To address the problem, Governor Brown declared a state of emergency and convened a Tree Mortality Task Force (TMTF) to enact Orders within the Declaration. CALFIRE was directed to identify High Hazard Zones9 (HHZ) throughout the state. HHZ’s have been designated based on 1) proximity of tree mortality to public infrastructure and communities and, 2) areas of concern for forest health and wildfire risk. CALFIRE developed a GIS map with 2 tiers of hazard zones.10 The Tier 1 HHZs are adjacent to communities and utility lines, and roads and represent a direct public safety threat. Tier 2 HHZs are defined by entire watersheds of significant tree mortality and wildfire risks. Using aerial flyover observations, the USFS and CALFIRE have been mapping the dead trees annually and the TMTF Mapping and Monitoring Working Group have been periodically updating the HHZs over the past 3 to 4 years.
Figure 3.4 shows the extent of the HHZ within the FSA. As previously described, when excluded areas such as slopes greater than 35 percent and other non-harvestable areas (see list in Section 3.2) are subtracted, the HHZ acreage drops to an estimated 459,453 acres.
9 http://www.fire.ca.gov/treetaskforce/downloads/HHZ_Watershed_Scoring_Methodology2.pdf 10 http://egis.fire.ca.gov/TreeMortalityViewer/
California BUF – Feedstock Supply Study Page 16

CHAPTER 3 – FEEDSTOCK SUPPLY AREA
Figure 3.4 - Map of the High Hazard Zones within the FSA (CALFIRE)
California BUF – Feedstock Supply Study Page 17
CHAPTER 3 – FEEDSTOCK SUPPLY AREA
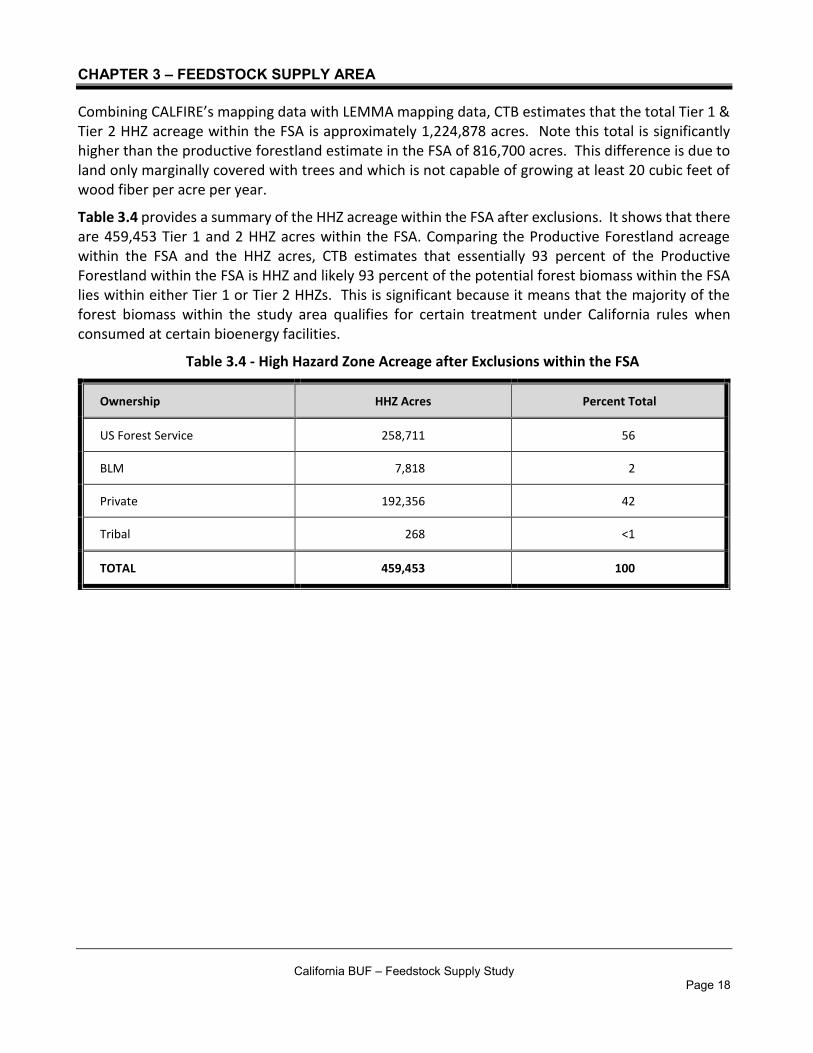
Combining CALFIRE’s mapping data with LEMMA mapping data, CTB estimates that the total Tier 1 & Tier 2 HHZ acreage within the FSA is approximately 1,224,878 acres. Note this total is significantly higher than the productive forestland estimate in the FSA of 816,700 acres. This difference is due to land only marginally covered with trees and which is not capable of growing at least 20 cubic feet of wood fiber per acre per year.
Table 3.4 provides a summary of the HHZ acreage within the FSA after exclusions. It shows that there are 459,453 Tier 1 and 2 HHZ acres within the FSA. Comparing the Productive Forestland acreage within the FSA and the HHZ acres, CTB estimates that essentially 93 percent of the Productive Forestland within the FSA is HHZ and likely 93 percent of the potential forest biomass within the FSA lies within either Tier 1 or Tier 2 HHZs. This is significant because it means that the majority of the forest biomass within the study area qualifies for certain treatment under California rules when consumed at certain bioenergy facilities.
Table 3.4 - High Hazard Zone Acreage after Exclusions within the FSA
Ownership HHZ Acres Percent Total
US Forest Service 258,711 56
BLM 7,818 2
Private 192,356 42
Tribal 268 <1
TOTAL 459,453 100
California BUF – Feedstock Supply Study Page 18

CHAPTER 4 – BIOMASS FEEDSTOCK SUPPLY VOLUME
This Chapter describes the volume of biomass feedstocks estimated to be available annually within the feedstock supply area. Note that while the primary focus of this biomass feedstock supply assessment is on forest derived biomass, this region of California also offers other non-forest derived biomass feedstocks including agricultural wood waste from fruit and nut orchard removals and urban wood waste. Using FIA data and GIS forest and agricultural crop data as well as CTB’s experience with forest and agricultural biomass feedstocks in the area, the biomass sources and annual volumes were determined.
4.1 FOREST-DERIVED BIOMASS SUPPLY VOLUME
Forest-derived biomass are those materials generated as result of timber harvest operations (limbs and tree tops in concentrated landing piles) and silvicultural treatments such as pre-commercial thinning and other timber stand improvement work (see Figure 4.1). There is also a component of the forest stand consisting of sub-merchantable, sapling size material that can be removed as part of a timber harvest operation to reduce wildfire hazard, ladder fuels, and to improve forest resiliency. In addition, because of the recent drought and beetle infestation there is a significant volume of standing dead trees throughout the FSA. The following sections describe the biomass volumes likely to be available annually from each of these forest-derived biomass sources.
Photo 4.1 - Slash Pile (Forest Derived Biomass) Remaining after Fuel Break Harvest on Industrial Forestland
California BUF – Feedstock Supply Study Page 19

CHAPTER 4 – BIOMASS FEEDSTOCK SUPPLY VOLUME
4.1.1 Harvest Residuals
This biomass feedstock includes limbs and tree tops (usually less than 5” to 6” large end diameter) as well as other unmerchantable logs from trees cut and removed during timber harvest. These harvest residues are traditionally disposed of through uncontrolled open-pile burning. A BUF could utilize these materials to manufacture wood products such as posts, poles or firewood. Or they could be ground or chipped and then converted in controlled transformation equipment to produce heat, electricity, or other energy products. Utilizing this material in a BUF helps reduce criteria air pollutants and GHG emissions compared to pile burning.
As just described the harvest of sawtimber is directly related to the production of harvest residuals. Therefore, using private timber harvest data compiled by the California State Board of Equalization and CALFIRE, 11
11 ftp://ftp.fire.ca.gov/forest
along with the US Forest Service FS Geodata Clearinghouse, CTB calculated the average timber harvest volume in the FSA for the past 7-years (see Appendix A for annual detail). This timber harvest data is compiled for an entire county. Therefore, it is necessary to estimate an appropriate harvest volume for the portion of the county located within the FSA. CTB assumed that the harvest volume is distributed equally across each county’s Productive Forestland and used each county’s percentage of Productive Forestland within the FSA to estimate the corresponding harvest volume. Table 4.1 provides a summary of this timber harvest data by county within the FSA.
Table 4.1 - Seven Year Average Annual Timber Harvest Volume (MBF) by County on Private and Public Productive Forestlands within the Feedstock Supply Area
County
Total Private Timber Harvest Volume (MBF12
12 MBF is defined as one thousand board feet.
1.7.0.01 May 2018.
)
Total Public Timber Harvest Volume (MBF)
Total Productive Forestland
That lies Within the
FSA 13
13 Source: US Department of Agricultural, Forest Service, Northern Research Station. Forest Inventory EVALIDator web-application version
(%)
Estimated Private Timber Harvest Volume
Within FSA (MBF)
Estimated Public Timber
Harvest Volume
Within FSA (MBF)
Estimated Total Timber
Harvest Volume
Within the FSA
(MBF)
Tuolumne 43,023 28,961 98 42,163 28,382 70,544
Calaveras 31,835 1,286 100 31,835 1,286 33,121
Amador 6,739 577 60 4,043 346 4,390
Mariposa 6,021 402 65 3,914 261 4,175
El Dorado 59,962 15,409 1 600 154 754
Total 147,580 46,635 n/a 82,555 30,429 112,984
California BUF – Feedstock Supply Study Page 20
CHAPTER 4 – BIOMASS FEEDSTOCK SUPPLY VOLUME
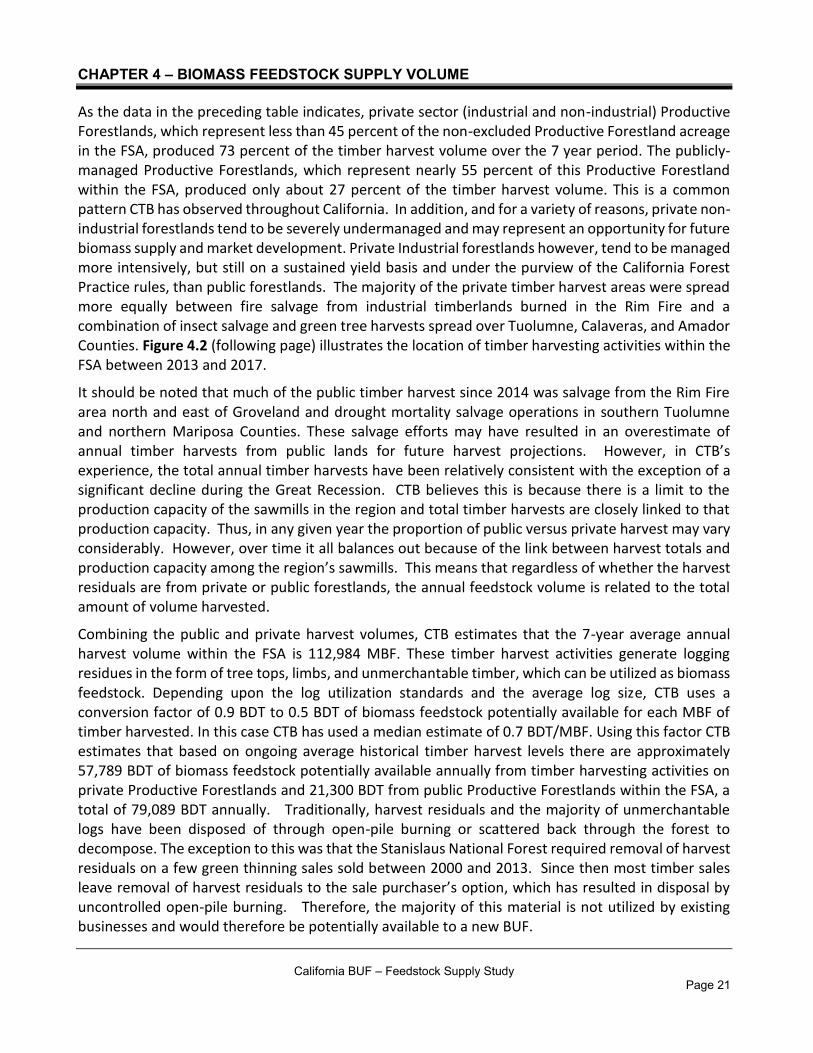
As the data in the preceding table indicates, private sector (industrial and non-industrial) Productive Forestlands, which represent less than 45 percent of the non-excluded Productive Forestland acreage in the FSA, produced 73 percent of the timber harvest volume over the 7 year period. The publicly-managed Productive Forestlands, which represent nearly 55 percent of this Productive Forestland within the FSA, produced only about 27 percent of the timber harvest volume. This is a common pattern CTB has observed throughout California. In addition, and for a variety of reasons, private non-industrial forestlands tend to be severely undermanaged and may represent an opportunity for future biomass supply and market development. Private Industrial forestlands however, tend to be managed more intensively, but still on a sustained yield basis and under the purview of the California Forest Practice rules, than public forestlands. The majority of the private timber harvest areas were spread more equally between fire salvage from industrial timberlands burned in the Rim Fire and a combination of insect salvage and green tree harvests spread over Tuolumne, Calaveras, and Amador Counties. Figure 4.2 (following page) illustrates the location of timber harvesting activities within the FSA between 2013 and 2017.
It should be noted that much of the public timber harvest since 2014 was salvage from the Rim Fire area north and east of Groveland and drought mortality salvage operations in southern Tuolumne and northern Mariposa Counties. These salvage efforts may have resulted in an overestimate of annual timber harvests from public lands for future harvest projections. However, in CTB’s experience, the total annual timber harvests have been relatively consistent with the exception of a significant decline during the Great Recession. CTB believes this is because there is a limit to the production capacity of the sawmills in the region and total timber harvests are closely linked to that production capacity. Thus, in any given year the proportion of public versus private harvest may vary considerably. However, over time it all balances out because of the link between harvest totals and production capacity among the region’s sawmills. This means that regardless of whether the harvest residuals are from private or public forestlands, the annual feedstock volume is related to the total amount of volume harvested.
Combining the public and private harvest volumes, CTB estimates that the 7-year average annual harvest volume within the FSA is 112,984 MBF. These timber harvest activities generate logging residues in the form of tree tops, limbs, and unmerchantable timber, which can be utilized as biomass feedstock. Depending upon the log utilization standards and the average log size, CTB uses a conversion factor of 0.9 BDT to 0.5 BDT of biomass feedstock potentially available for each MBF of timber harvested. In this case CTB has used a median estimate of 0.7 BDT/MBF. Using this factor CTB estimates that based on ongoing average historical timber harvest levels there are approximately 57,789 BDT of biomass feedstock potentially available annually from timber harvesting activities on private Productive Forestlands and 21,300 BDT from public Productive Forestlands within the FSA, a total of 79,089 BDT annually. Traditionally, harvest residuals and the majority of unmerchantable logs have been disposed of through open-pile burning or scattered back through the forest to decompose. The exception to this was that the Stanislaus National Forest required removal of harvest residuals on a few green thinning sales sold between 2000 and 2013. Since then most timber sales leave removal of harvest residuals to the sale purchaser’s option, which has resulted in disposal by uncontrolled open-pile burning. Therefore, the majority of this material is not utilized by existing businesses and would therefore be potentially available to a new BUF.
California BUF – Feedstock Supply Study Page 21

CHAPTER 4 – BIOMASS FEEDSTOCK SUPPLY VOLUME
Figure 4.2 - Map of Timber Harvest Areas Completed during 2013-2017
California BUF – Feedstock Supply Study Page 22

CHAPTER 4 – BIOMASS FEEDSTOCK SUPPLY VOLUME
4.1.2 Pre-commercial Thinning
In addition to timber harvest residues there are also sub merchantable, sapling sized trees, which make up a portion of the potentially available biomass feedstock within the FSA’s Productive Forestlands. Using the FIA EVALIDator program, it is possible to estimate the volume of this sapling sized understory material potentially available within the FSA.
Using FIA data there are estimated to be 992,107 BDT of sapling-sized material within the FSA. However, this material is scattered over an estimated 495,153 acres of Productive Forestland within the FSA, resulting in an average of 2.0 BDT per acre of sapling sized material. It should be noted here that in CTB’s experience this FIA estimate understates what is typically potentially available from pre-commercial thinning activities within the FSA. However, CTB believes it is impractical to consider all this sapling sized material economically available throughout the FSA due to the high cost of removal when not done in conjunction with a timber harvest. Therefore, only those tons available from actual harvested acres within the FSA are considered as part of this potentially available biomass feedstock. Using Timber Harvest Plan data for the period 2013 to 2017 (see Appendix A), there were approximately 2,643 acres of private Productive Forestland and 2,888 acres of US Forest Service Productive Forestland harvested annually within the FSA.
Using 2.0 BDT of sapling-sized material per acre on private Productive Forestland harvest per year results in approximately 5,286 BDT of sapling sized material potentially available from these timber harvest acres on private Productive Forestland and 5,776 BDT on US Forest Service Productive Forestland within the FSA, a total of 11,062 BDT annually. Table 4.2 provides a summary of this sub merchantable, material that could be available from pre-commercial thinning activities. Like harvest residues, biomass derived from pre-commercial thinning of sub merchantable trees is generally not utilized by existing facilities because of the high cost of removal and processing. Therefore, the entire volume is potentially available to a new BUF.
Table 4.2 - Potentially Available Pre-Commercial Thinning Biomass on Private and Public Productive Forestlands within the FSA
Feedstock Source
Average Volume Factor
(BDT/Acre)
Annual Harvested
Area on Private Lands
(Acres)
Potentially Available Volume
Private Lands (BDT/Year)
Annual Harvested
Area on Federal Lands
(Acres)
Potentially Available Volume
Public Lands (BDT/Year)
Total Potentially Available Volume
(BDT/Year)
Sub merchantable 2.0 2,643 5,286 2,888 5,776 11,062
California BUF – Feedstock Supply Study Page 23
CHAPTER 4 – BIOMASS FEEDSTOCK SUPPLY VOLUME
4.1.4 Standing Dead Trees
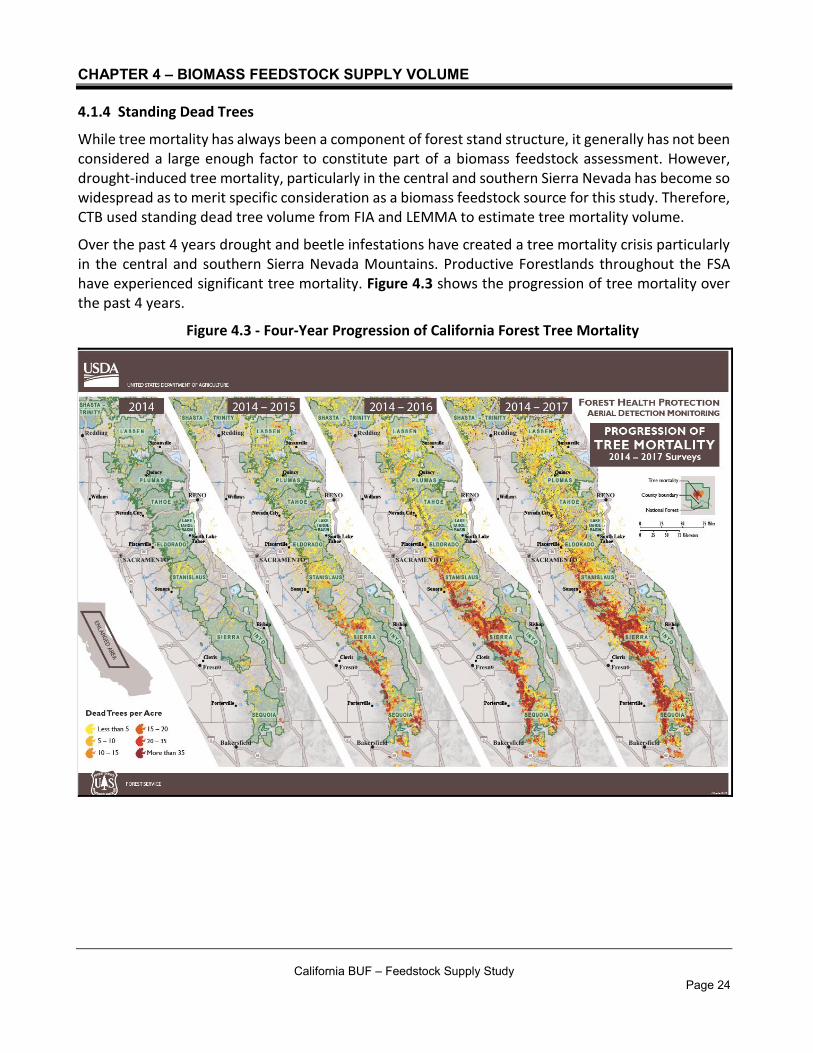
While tree mortality has always been a component of forest stand structure, it generally has not been considered a large enough factor to constitute part of a biomass feedstock assessment. However, drought-induced tree mortality, particularly in the central and southern Sierra Nevada has become so widespread as to merit specific consideration as a biomass feedstock source for this study. Therefore, CTB used standing dead tree volume from FIA and LEMMA to estimate tree mortality volume.
Over the past 4 years drought and beetle infestations have created a tree mortality crisis particularly in the central and southern Sierra Nevada Mountains. Productive Forestlands throughout the FSA have experienced significant tree mortality. Figure 4.3 shows the progression of tree mortality over the past 4 years.
Figure 4.3 - Four-Year Progression of California Forest Tree Mortality
California BUF – Feedstock Supply Study Page 24

CHAPTER 4 – BIOMASS FEEDSTOCK SUPPLY VOLUME
As the previous maps show, significant mortality (shown in red) has occurred as the drought progressed. Using LEMMA Forest Structure Maps14
14 https://lemma.forestry.oregonstate.edu/data/structure-maps
there are an estimated 1,721,817 BDT of standing dead trees within the FSA. This tree mortality has typically occurred in small to large groups and occasionally over entire sub watersheds. Unfortunately, there is no readily available and reliable numerical data that locates exactly where these groups of concentrated tree mortality have occurred. For the purposes of this study CTB considers the standing dead is spread evenly over the entire 495,153 acres of Productive Forestland within the FSA. This equates to an average of 3.47 BDT per acre of standing dead trees within the FSA (1,721,817 total BDT total divided by 495,153 total acres).
Local data regarding decay and degradation of beetle killed trees within the FSA is limited. However, studies conducted on beetle-killed mixed conifer trees in Blodgett Forest Research Station in the northern Sierra and Sequoia-Kings Canyon National Park in the southern Sierra15
15 http://www.energy.ca.gov/2016publications/CEC-500-2016-001/CEC-500-2016-001.pdf
, suggest that, the half-life16
16 “Half-life” refers to the how long it takes for 50% of the trees to fall down
of these standing dead trees may be between 3.4 and 11.2 years, depending on species, tree size, and other factors. CTB and others have observed locally that typically the smaller trees topple first due to rot in the lower bole area. Also, dead true fir and incense cedar trees tend to remain standing longer than ponderosa pine. Extrapolating from this data and observations, CTB estimates that much of this standing dead tree biomass feedstock may only be available for a period of 5 to 10 years after the tree has died.
Recent statistical analysis by the US Forest Service, Pacific Southwest Research Station suggests that tree mortality in the Sierra Nevada is on the decline again this year, after peaking in 201617
17 Sustain Our Nation’s Forests and Grasslands: Predictor map forecasts reduced likelihood of tree mortality in 2018. www.usda.gov, March 13, 2018.
. Table 4.3 shows the estimated cumulative number of dead trees in California for the period 2010 - 201718
18 Tree Mortality: Facts and Figures, Tree Mortality Task Force, April 2018
.
Table 4.3 - Estimated Number of Dead Trees in California 2010-2017
Year Estimated Number of Dead Trees (Millions)
2010 3.1
2011 1.6
2012 1.8
2013 1.3
2014 3.2
2015 29.0
2016 62.0
2017 27.0
TOTAL 129.0
California BUF – Feedstock Supply Study Page 25

CHAPTER 4 – BIOMASS FEEDSTOCK SUPPLY VOLUME
As can be calculated from the data in the table, the rate of mortality declined by 56 percent between 2016 and 2017. Recent research at the US Forest Service, PSRS from March 2018 projects that the tree mortality will be much lower - between 3 million to 26 million trees for 2018 and that the rate of true fir mortality has increased significantly since 2017. While no one can be certain of these projections because of the influence of weather and beetle populations, CTB believes that 15 million trees is a reasonable estimate for 2018. This equates to a 44 percent decline from 2017 levels. Should this rate of decline continue, by 2022 tree mortality levels could be back below 2014 levels and become an insignificant contributor to annually available volume.
Although the residual impact of this extensive tree mortality will likely be long lasting, CTB believes the window of opportunity for access and utilization of this standing dead timber is on the order of 3.4 to 11.2 years. After this length of time CTB believes that most of the timber will be so degraded as to not allow for conventional harvesting and removal and subsequent utilization by a BUF. This timeframe assumes that more normal levels of mortality will be observed within the next 3 to 4 years. Thus within 5 to 10 years from the present date, CTB expects most of the unharvested drought mortality, will either be on the ground or in such a condition as to be impractical to harvest, process, and utilize as biomass feedstocks. Although the BUF may not be operational until 2022, CTB projects that a portion of the currently-standing dead trees along with trees that continue to die, will continually be available until at least 2027.
4.1.4.1 Standing Dead Trees Removed Concurrently with Harvests
CTB believes that, in general, areas with active timber harvesting operations would allow for the most likely economic removal of these biomass feedstocks, and only in areas where there are high concentrations of dead trees. Based on an average of 3.47 BDT per acre and 2,643 acres harvested annually on private Productive Forestland and 2,888 acres harvested annually on US Forest Service Productive Forestland within the FSA there are potentially 9,171 BDT available on private Productive Forestland and 10,021 BDT available on US Forest Service Productive Forestland, a total of 19,192 BDT annually. Table 4.5 provides a summary of this standing dead tree biomass feedstock potentially available within the FSA.
Table 4.5 - Potentially Available Standing Dead Tree Volume on Private and Public Productive Forestlands within Harvest Areas
Feedstock Source
Volume Factor
(BDT/Acre)
Private Harvested
Area Within the FSA
(Acres/Year)
Private Potentially Available Volume
(BDT/Year)
Public Harvested
Area Within the FSA
(Acres/Year)
Public Potentially Available Volume
(BDT/Year)
Total Potentially Available Volume
(BDT/Year)
Standing Dead Trees Within Harvest Areas 3.47 2,643 9,171 2,888 10,021 19,192
California BUF – Feedstock Supply Study Page 26

CHAPTER 4 – BIOMASS FEEDSTOCK SUPPLY VOLUME
4.1.4.2 Standing Dead Trees Removed within 100 feet of Roads
Many agencies, including CalTrans, US Forest Service, County Public Works, and utilities have been actively removing standing dead trees that are a hazard to infrastructure and/or to the general public. CTB estimated the volume of this biomass feedstock using an FIA EVALIDator program filter that estimates standing dead tree volume within 100 feet of existing roads within the FSA. Although CTB has observed many areas, particularly in the 3-5,000 feet elevation range with higher amounts of standing dead trees, this FIA data is believed to represent a conservative estimate of the potentially available biomass feedstock from these types of hazard tree removal operations.
Per FIA data there are an estimated 102,630 BDT of standing dead trees on private Productive Forestland and 164,092 BDT on public Productive Forestland within 100 feet of existing roads in the FSA. It should be noted that all of these standing dead trees within 100 feet of roads, with the exception of an unquantifiable number of hazard trees that have already been cut and removed by PG&E, CalTrans, the Stanislaus National Forest, and Tuolumne County in portions of the Wildland Urban Interface are 100 percent and available right now.
For purposes of this study and in order to provide a practical estimate of annual availability for a BUF, CTB has conservatively assumed that this volume could be removed in equal amounts over a 5-year period. Thus, the annual availability of biomass from this source is assumed to be 53,334 BDT/year (102,630 BDT of private divided by 5 years plus 164,092 BDT of public divided by 5 years).
4.1.4.3 Standing Dead Trees Within 101 feet and 1,000 feet from Roads
Although the Stanislaus National Forest has had an active program for many years to remove hazard trees within 150 feet of main Forest Service roads, an even larger source of biomass feedstock would be potentially available if efforts were undertaken to remove more of the standing dead tree volume beyond 100 feet of existing roads throughout Productive Forestlands within the FSA.
Complete access to all the standing dead tree material within the FSA is not realistic, so CTB limited this assessment to those areas within 101 feet to 1,000 feet of existing roads. CTB assumes that this distance could allow for some economic access to this standing dead tree material.
Using the FIA EVALIDator program the volume, diameter and species of standing dead trees were estimated for trees located 101 feet to 1,000 feet from existing roads. Table 4.6 provides a breakdown of diameter class, species and ownership for standing dead trees within 101 feet to 1000 feet of existing roads.
California BUF – Feedstock Supply Study Page 27

CHAPTER 4 – BIOMASS FEEDSTOCK SUPPLY VOLUME
Table 4.6 - Standing Dead Tree Biomass (BDT) by Diameter Class, Species and Ownership within 101’ to 1000’ of Existing Roads within the FSA
Species
Private Forestlands Public Forestlands
Total Volume
(BDT)
Volume (BDT) by Diameter Size Class (DBH) Volume (BDT) by Diameter Size Class (DBH)
0.1” to 8.9”
9” to 19.9”
20” to 39.9”
40”+ 0.1” to 8.9”
9” to 19.9”
20” to 39.9”
40”+
White fir/Red Fir 0 31,556 0 0 0 183,990 123,667 23,741 362,954
Pine sp. 4,301 40,766 0 0 0 397,301 365,288 3,608 811,264
Incense Cedar 12,470 11,146 0 0 0 79,688 29,446 2,906 135,656
DF 0 0 0 0 0 0 17,672 0 17,672
Total (BDT) 16,771 83,468 0 0 0 660,979 536,073 30,255 1,327,546
This data certainly highlights the extent of the tree mortality crisis, with over 1.327 million BDT of potential standing dead tree biomass within 100 to 1,000 feet of existing roads within the FSA. Figure 4.4 and Figure 4.5 below provide a graphic display of the data in Table 4.6.
Figure 4.4 - Volume of Standing Dead Trees by Diameter Class and Species within 1000’ of Existing roads on Private Forestlands in the FSA
California BUF – Feedstock Supply Study Page 28

CHAPTER 4 – BIOMASS FEEDSTOCK SUPPLY VOLUME
Figure 4.5 - Volume of Standing Dead Trees by Diameter Class and Species within 1000’ of Existing roads on Public Forestlands in the FSA
As the data in the preceding figures show, pine sp. makes up over 60 percent of the volume of standing dead tree biomass on all Productive Forestlands within 100 feet to 1,000 feet of existing roads. Furthermore, more than 27 percent or an estimated 365,288 BDT of this Pine sp. biomass is in trees 20” DBH or larger, an additional 201,040 BDT of other softwood species in this size class is also potentially available. Thus, there is an estimated total of 566,328 BDT of standing dead trees that are greater than 20” DBH. CTB believes these larger diameter standing dead trees are a more realistic source of additional biomass feedstock. The larger diameter trees should resist decay, stay standing longer, would allow for more economical harvesting and transport, and also offer more market outlets in traditional markets.
CTB estimates that approximately 86 percent of the greater than 20” DBH standing dead tree biomass would be available in log form. The estimate is based on the assumption that 14 percent of the volume is lost to breakage during harvest and yarding and from bark sloughing off the trees. The assumption is based on CTB’s experience. Therefore, there is approximately 487,042 BDT of biomass in log form. While smaller diameter trees could also be salvaged as part of this removal it is CTB’s experience that the high cost of harvesting and transporting would greatly limit the utilization of the smaller diameter standing dead trees. Using the 61 percent Practically Available factor, which includes such things as snags retained for wildlife habitat (see discussion in Section 4.2 for more detailed explanation of the 61 percent availability factor), CTB estimates that 297,095 BDT of logs from trees greater than 20” DBH could be practically available within this 100 feet to 1000 feet distance from existing roads.
California BUF – Feedstock Supply Study Page 29

CHAPTER 4 – BIOMASS FEEDSTOCK SUPPLY VOLUME
There are economic and logistical constraints regarding the viability of this standing dead tree biomass feedstock. First this volume is a direct result of the massive tree mortality crisis that has hit California’s Productive Forestlands. In general, biomass feedstock assessments do not consider episodic events such as drought induced tree mortality, insect infestations, wildfires, etc. as part of the Practically Available long-term biomass feedstock supply. CTB is familiar with some studies that have referenced events such as the Emerald Ash Borer infestation in the upper Midwest or hurricanes in the southeast, but generally these types of unpredictable episodic events are not included as part of an ongoing biomass feedstock supply. Such short-term supply sources can overstate the reliable long-term biomass feedstock supply for a biomass project that may have a 20 or 30-year life expectancy. However, the sheer size of this problem in California suggests that this situation will take years to deal with and its consideration is justified.
For purposes of this supply study CTB has tried to provide a rational, realistic assessment of the standing dead tree biomass potential within this FSA. To begin with, CTB has assumed that the majority of standing dead tree biomass will be useable over the next 8 to 10 years. Additionally, CTB assumed that new mortality at levels greater than historical norms will continue for at least 3 more years. It was also assumed that logging activities to remove these standing dead trees will be limited to within 1,000 feet of existing roads. Finally, CTB has assumed that only larger diameter (> 20” DBH) will be worth the effort and cost to harvest as a biomass feedstock in log form. Logs from trees > 20” DBH would allow for conventional log harvesting and transporting operations at somewhat reasonable economics.
Without consideration of the market price or environmental restrictions, CTB estimates that an additional 297,095 BDT of standing dead tree biomass in log form could be available over the next 5 years. It should be noted that all of these standing dead trees are 100 percent available right now. For purposes of this analysis CTB conservatively assumes that approximately 59,419 BDT per year of standing dead tree timber on public forestlands and 37,501 BDT per year on private forestlands > 20” DBH could be potentially available from the FSA.
California BUF – Feedstock Supply Study Page 30
CHAPTER 4 – BIOMASS FEEDSTOCK SUPPLY VOLUME
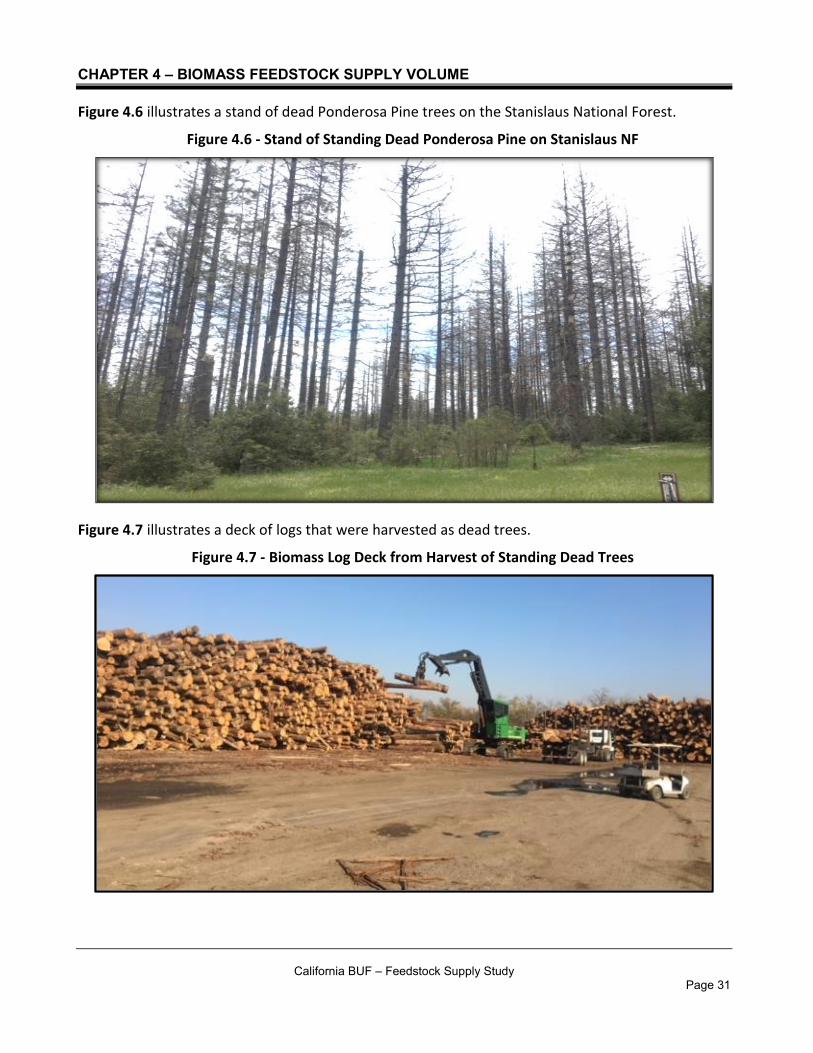
Figure 4 .6 illustrates a stand of dead Ponderosa Pine trees on the Stanislaus National Forest.
Figure 4.6 - Stand of Standing Dead Ponderosa Pine on Stanislaus NF
Figure 4 .7 illustrates a deck of logs that were harvested as dead trees.
Figure 4.7 - Biomass Log Deck from Harvest of Standing Dead Trees
California BUF – Feedstock Supply Study Page 31

CHAPTER 4 – BIOMASS FEEDSTOCK SUPPLY VOLUME
4.1.5 Plantation Thinning and Timber Stand Improvement
In addition to the above mentioned forest derived biomass feedstocks there is also a component of biomass generated from timber stand improvement and plantation thinning treatments. These treatments result in increased residual tree spacing, remove understory trees and brush that act as ladder fuels that allow ground fires to escalate into crown fires, and helps create stands that are more resilient to wildfire and drought. To estimate the potential availability of this material CTB considered the acreage of plantations in the 10 to 20 year age class, when the plantation trees are too small to produce merchantable sawlogs and are most likely to be thinned. Using the EVALIDator program CTB was able to estimate the acreage of these 10 to 20 year old plantations within the FSA. Table 4.7 provides a summary of these plantations.
Table4.7 - Plantations in the 10 to 20 Year Age Class within the FSA (Acres)
County
Private Productive Forestland
(Acres)
Public Productive Forestland
(Acres) Total
(Acres)
Tuolumne 0 0 0
Mariposa 0 0 0
Calaveras 2,308 1,549 3,857
Amador 6,673 0 6,673
Total 8,981 1,549 10,530
We note that the publicly-available data from FIA shows no plantations within the FSA in Tuolumne County in the 10-20 year age class. CTB believes, based on discussions with public and private industrial land managers, that the FIA data set likely underestimates plantation acres to an unknown extent. Thus, this feedstock source may require further study. Based on this data CTB estimates there are at least 10,530 acres of medium to fully stocked plantations on Productive Forestland in the 10 to 20 year age class. While some of these plantations have already been thinned within the FSA, CTB believes that additional plantation thinning is likely desirable and that as much as 10 percent per year of this acreage could potentially be available for mechanical thinning and biomass removal.
For this assessment CTB has assumed that 891 acres of private plantations and 155 acres of public plantations could be treated annually within the FSA. Furthermore, CTB estimates that thinning these plantations could generate approximately 12 BDT per acre of biomass feedstock. Thus, CTB estimates that approximately 10,692 BDT of biomass feedstock could be potentially produced from private Productive Forestlands and 1,860 BDT from public Productive Forestlands from these 10 to 20 year old plantations, a total of 12,552 BDT annually.
4.1.6 Other Community-based Programs
Additional forest derived fuel is generated from fuels reductions programs including required homeowner Defensible Space programs, Fire Safe Council and Utility clearance activities adjacent to
California BUF – Feedstock Supply Study Page 32

CHAPTER 4 – BIOMASS FEEDSTOCK SUPPLY VOLUME
powerlines and water conveyances. Based on CTB’s experience with these programs within the FSA it is estimated that between 5,000 and 10,000 BDT per year of biomass feedstock would be generated from these community level programs (i.e., 7,500 BDT/year).
4.1.7 Forest Derived Biomass Summary
Table 4.8 provides a summary of all forest derived biomass feedstock supplies potentially available within the FSA. Based on this assessment, CTB estimates that approximately 148,465 BDT of biomass feedstock are potentially available on an annual basis from private Productive Forestlands and 131,194 BDT from public Productive Forestlands within the FSA, or a total of 279,659 BDT.
Table 4.8 - Potentially Available Forest Derived Biomass Feedstock within the FSA
Forest Derived Biomass Feedstock Source
Private Forestlands (BDT/year)
Public Forestlands (BDT/year)
Total Private and Public Forestlands
(BDT/year)
Timber Harvest Residuals 57,789 21,300 79,089
Pre-commercial Thinning (removed concurrently with harvests) 5,286 5,776 11,062
Standing Dead Trees (removed concurrently with harvests) 9,171 10,021 19,192
Standing Dead (removed from within 100’ of existing roads) 20,526 32,818 53,344
Standing Dead (removed from within 101’ and 1000’ of existing roads 37,501 59,419 96,920
Plantation Thinnings 10,692 1,860 12,552
Other Community Programs 7,500 0 7,500
Total 148,465 (53%)
131,194 (47%)
279,659 (100%)
4.2 POTENTIALLY VS. PRACTICALLY AVAILABLE FOREST DERIVED BIOMASS FEEDSTOCK SUPPLY
When it comes to forest-derived biomass feedstock sources, it is important to understand that there is limitation as to how much of the potentially available biomass feedstock can be considered as Practically Available. Due to a variety of environmental and economic constraints such as, but certainly not limited to, road access, project size, NEPA delays, timber harvest plan costs, contractor availability, or unwillingness or inability of a landowner to fund biomass removal, it is infeasible to access and utilize all the potential biomass feedstock within a study area.
It is also important to note that forest-derived biomass can only be accessed seasonally because winter weather and saturated soil conditions prohibit equipment access to most of the forest. Generally, a BUF facility can expect to be able to access the forest from April through October,
California BUF – Feedstock Supply Study Page 33

(BDT/year)
CHAPTER 4 – BIOMASS FEEDSTOCK SUPPLY VOLUME
depending on the winter, elevation, and slope aspect of harvest areas. This means that if the BUF uses 100 percent forest-derived biomass, it must be able to extract all the biomass needed for operations during the period April through October 7-month operating window. It also means that the BUF facility site must have enough area to store 5 months of usage.
Over the years a variety of rules-of-thumb have been utilized to model Practically Available forest fuels. For example, the Minnesota Forest Resource Council19
19 Biomass Harvesting on Forest Management Sites, Minnesota Forest Resource Council, December 2007.
uses a factor of 65 to 70 percent Practically Available biomass. Closer to home, a number of biomass fuel consultants in California20
20 Burk J. Wheelabrator Shasta Energy Biomass Fuel Study. JEB Consulting, Inc. (2010)
use 65 percent Practically Available. Most recently, researchers at UC Berkeley21
21 Lara J.D., Tubbesing C.L. et al. Sustainability metrics and analysis of the woody biomass feedstock potential resulting from California’s drought. Energy Resources Group et. al. University of California, Berkeley CA. (2018)
imply a 45 percent Practically Available factor. Combining the values from these various sources, CTB estimates that approximately 61 percent of the potentially available forest derived biomass feedstock is practically available within the FSA. Applying this practically available factor of 0.61 to the potentially available volume results in the practically available forest derived biomass feedstock within the FSA.
Table 4.9 provides a summary of the practically available biomass feedstock. Based on this analysis CTB estimates that annually there are approximately 170,592 BDT of practically available biomass feedstock within the FSA that could be available for a BUF.
Table 4.9 - Practically Available Forest Derived Feedstock Within the FSA (BDT/Year)
Forest Derived Biomass Feedstock Source
Private Practically Available Volume
(BDT/year)
Public Practically Available Volume
(BDT/year)
Total Practically Available Volume
(BDT/year)
Timber Harvest Residues 35,251 12,993 48,244
Pre-commercial Thinning (removed concurrently with harvests) 3,224 3,523 6,748
Standing Dead Trees (removed concurrently with harvests) 5,594 6,113 11,707
Standing Dead (removed from within 100’ of existing roads) 12,521 20,019 32,540
Standing Dead (removed from within 101’ and 100’ of existing roads 22,876 36,246 59,121
Plantation Thinning 6,522 1,135 7,657
Other Community Programs 4,575 0 4,575
Total 90,564 (53%)
80,029 (47%)
170,592 (100%)
California BUF – Feedstock Supply Study Page 34

CHAPTER 4 – BIOMASS FEEDSTOCK SUPPLY VOLUME
The data in the preceding table reveals that standing dead tree volume is a significant part of the Practically Available biomass feedstock, making up 55 percent of this annual volume. While this is a significant portion of the potential biomass feedstock, it is important to recognize that due to the episodic nature of this tree mortality crisis this material will likely not be available on a long-term basis. As previously described decay and degradation of these standing dead trees limit its accessibility as a long-term, perpetual biomass feedstock source.
4.3 NON-FOREST DERIVED BIOMASS FEEDSTOCK SUPPLY
In addition to biomass derived directly from forest, other forms of biomass are available from other non-forest sources. The following sections assess the volume of biomass available from those non-forest biomass sources.
4.3.1 Sawmill Residuals
One source of non-forest derived biomass feedstocks is that produced as by-products of the sawmilling operations within the FSA. Currently there are two large scale sawmills operating in Tuolumne County within the FSA. Both mills are owned by Sierra Pacific Industries (SPI) and generate significant quantities of sawmill residues. Relative to utilization by wood-to-energy technologies, most of these mill residues have higher value markets when used as landscape products, animal bedding or particle board feedstock. The volume of residues produced by a sawmill is directly related to the mill’s log use. An estimated 56 percent of the total volume of wood fiber processed by sawmills ends up as mill residues such as bark, sawdust, chips and shavings22
22 McIver, C.P.; et.al. 2015. California’s Forest Products Industry and Timber Harvest, 2012. PNW-GTR-908. US Department of Agriculture, Forest Service, Pacific Northwest Research Station.
. Table 4.10 provides a summary of the estimated sawmill residues generated within the FSA.
Table 4.10 - Estimated Annual Production of Sawmill Residues Within the FSA (BDT/Year)
Mill
Estimated Annual Log
Usage (MMBF)
Coarse Residues (Chips)
(BDT/year) Sawdust
(BDT/year) Bark
(BDT/year) Shavings
(BDT/year) Total
(BDT/year)
SPI - Standard 95 37,620 15,960 25,080 9,120 87,780
SPI – Chinese Camp 40 15,840 6,720 10,560 3,840 36,960
Total 135 53,460 22,680 35,640 12,960 124,740
Importantly, while there are estimated to be more nearly 124,740 BDT per year of sawmill residues generated by these two mills, CTB found that very little of this residue is available on the open market. Except for a portion of the green sawdust, which does have some outlet in the biomass energy market, the remaining residues have sufficiently robust markets and corresponding high market values which essentially makes them unavailable as a competitive biomass feedstock. For purposes of this review
California BUF – Feedstock Supply Study Page 35

CHAPTER 4 – BIOMASS FEEDSTOCK SUPPLY VOLUME
CTB estimates that only 5,000 BDT of green sawdust are Practically Available seasonally outside of internal mill use during fall and winter within the FSA.
4.3.2 Orchard Removals
Orchard removals are another type of non-forest derived biomass. As previously discussed, the southwest edge of the FSA borders along the San Joaquin Valley and includes portions of San Joaquin, Stanislaus and Merced counties. This area is some of the most productive agricultural ground in the United States and contains a considerable acreage of fruit and nut orchards. Figure 4.8 shows the distribution of these orchards within the FSA.
Figure 4.8 - Fruit and Nut Orchards within the FSA
California BUF – Feedstock Supply Study Page 36
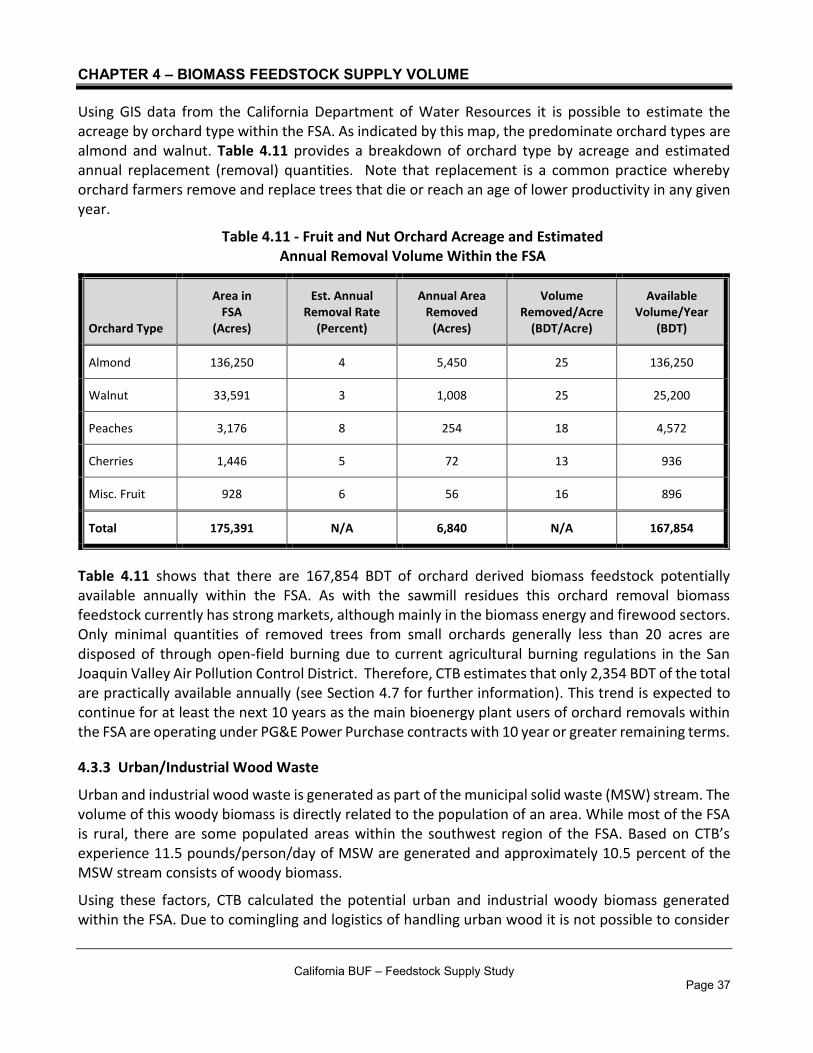
CHAPTER 4 – BIOMASS FEEDSTOCK SUPPLY VOLUME
Using GIS data from the California Department of Water Resources it is possible to estimate the acreage by orchard type within the FSA. As indicated by this map, the predominate orchard types are almond and walnut. Table 4.11 provides a breakdown of orchard type by acreage and estimated annual replacement (removal) quantities. Note that replacement is a common practice whereby orchard farmers remove and replace trees that die or reach an age of lower productivity in any given year.
Table 4.11 - Fruit and Nut Orchard Acreage and Estimated Annual Removal Volume Within the FSA
Orchard Type
Area in FSA
(Acres)
Est. Annual Removal Rate
(Percent)
Annual Area Removed
(Acres)
Volume Removed/Acre
(BDT/Acre)
Available Volume/Year
(BDT)
Almond 136,250 4 5,450 25 136,250
Walnut 33,591 3 1,008 25 25,200
Peaches 3,176 8 254 18 4,572
Cherries 1,446 5 72 13 936
Misc. Fruit 928 6 56 16 896
Total 175,391 N/A 6,840 N/A 167,854
Table 4.11 shows that there are 167,854 BDT of orchard derived biomass feedstock potentially available annually within the FSA. As with the sawmill residues this orchard removal biomass feedstock currently has strong markets, although mainly in the biomass energy and firewood sectors. Only minimal quantities of removed trees from small orchards generally less than 20 acres are disposed of through open-field burning due to current agricultural burning regulations in the San Joaquin Valley Air Pollution Control District. Therefore, CTB estimates that only 2,354 BDT of the total are practically available annually (see Section 4.7 for further information). This trend is expected to continue for at least the next 10 years as the main bioenergy plant users of orchard removals within the FSA are operating under PG&E Power Purchase contracts with 10 year or greater remaining terms.
4.3.3 Urban/Industrial Wood Waste
Urban and industrial wood waste is generated as part of the municipal solid waste (MSW) stream. The volume of this woody biomass is directly related to the population of an area. While most of the FSA is rural, there are some populated areas within the southwest region of the FSA. Based on CTB’s experience 11.5 pounds/person/day of MSW are generated and approximately 10.5 percent of the MSW stream consists of woody biomass.
Using these factors, CTB calculated the potential urban and industrial woody biomass generated within the FSA. Due to comingling and logistics of handling urban wood it is not possible to consider
California BUF – Feedstock Supply Study Page 37

CHAPTER 4 – BIOMASS FEEDSTOCK SUPPLY VOLUME
all this urban wood Practically Available within the FSA. Based on previous experience dealing with urban and industrial wood waste, CTB used a factor of 65 percent Practically Available urban wood waste and a moisture content of 25 percent. Table 4.12 shows the estimated population and the volume of urban and industrial woody biomass potentially generated. As the table illustrates, there are approximately 34,964 BDT of woody urban and industrial wood waste available within the FSA on an annual basis.
Table 4.12 - Urban/Industrial Woody Biomass Generated Annually within the FSA
County
Estimated Population
within the FSA23
23 City and County Population Estimate January 1, 2017 and January 1, 2018. California Dept. of Finance Demographic Research. May, 2018.
(People)
Total Waste
Generated (GT/year)
Total Wood Waste
Generated (GT/year)
Potentially Available Wood
Waste Generated (GT/year)
Practically Available Wood
Waste Generated (BDT/year)
Tuolumne 54,740 114,886 12,063 7,841 5,880
Calaveras 45,157 94,773 9,951 6,468 4,851
Amador 17,352 36,418 3,824 2,486 1,864
Mariposa 10,877 22,828 2,397 1,558 1,169
San Joaquin 37,937 79,620 8,360 5,434 4,075
Stanislaus 128,895 270,518 28,404 18,462 13,847
Merced 27,998 58,760 6,170 4,010 3,008
Total 322,956 677,803 71,169 46,259 34,694
4.3.4 Tree Service Debris
In addition to the urban and industrial wood waste there is also a portion of tree service debris generated by tree service companies and electric utilities that can be utilized as biomass feedstock. It is estimated that approximately 100 bone dry pounds of tree trimmings suitable for fuel is generated on an annual per capita basis24
24 Urban Tree Residues. March 1992. Minnesota Dept. of Natural Resources, Division of Forestry.
. CTB assumes that roughly 65 percent of this tree service debris would be Practically Available on an annual basis. Table 4.13A below summarizes this tree service debris annual volume.
California BUF – Feedstock Supply Study Page 38

CHAPTER 4 – BIOMASS FEEDSTOCK SUPPLY VOLUME
Table 4.13A - Tree Service Debris Available Annually Within the FSA (BDT/Year)
Estimated Population within the FSA
(People)
Total Tree Service Debris Generated
(BDT/year)
Practical Tree Service Debris Generated (BDT/year)
322,956 16,147 10,469
4.3.5 Summary of Non-Forest Derived Feedstocks
Table 4.13B summarizes the total estimated volume of non-forest derived biomass feedstocks. As the table shows there is an estimated 218,017 BDT of biomass produced annually from non-forest derived sources. Note that this material is either already being utilized or a total to practically available factor has already been applied. Therefore, the annual volumes shown section 4.4 are net of what is estimated to be consumed by existing users.
Table 4.13B – Summary of Total Estimated Volume of Non-Forest Derived Biomass (BDT/Year)
Non-Forest Derived Biomass Source
Total Annual Volume
(BDT)
Practically Available Volume
(BDT)
Sawmill Residues 124,740 124,740
Orchard Removals 167,854 167,854
Urban/Industrial 53,375 34,694
Tree Service 16,147 10,469
Total 362,116 337,757
4.4 SUMMARY OF PRACTICALLY AVAILABLE BIOMASS FEEDSTOCKS
Table 4.14 provides a summary of the Practically Available biomass feedstocks (both forest derived and non-forest derived) identified within the FSA. Based on this biomass feedstock analysis it is estimated that approximately 389,682 BDT of biomass feedstock are Practically Available on an annual basis within the FSA.
California BUF – Feedstock Supply Study Page 39

CHAPTER 4 – BIOMASS FEEDSTOCK SUPPLY VOLUME
Table 4.14 - Estimated Practically Available Biomass Feedstocks Within the FSA (BDT/Year)
Biomass Feedstock Source
Private Practically Available Volume
(BDT/Year)
Public Practically Available Volume
(BDT/Year)
Total Practically Available Volume
(BDT/year)
Timber Harvest Residues 35,251 12,993 48,244
Pre-commercial Thinning (removed concurrently with harvests) 3,224 3,523 6,748
Standing Dead Trees (removed concurrently with harvests) 5,594 6,113 11,707
Standing Dead (removed from within 100’ of existing roads) 12,521 20,019 32,540
Standing Dead (removed from within 101’ and 100’ of existing roads) 22,876 36,246 59,121
Plantation Thinnings 6,522 1,135 7,657
Other Community Programs 4,575 0 4,575
Subtotal Forest Derived 90,564 80,029 170,592
Sawmill Residues 124,740 0 124,740
Orchard Removals 167,854 0 167,854
Urban/ Industrial 34,694 0 34,694
Tree Service Debris 10,469 0 10,469
Subtotal
Non-Forest Derived 337,757 0 337,757
Grand Total 428,321 80,029 508,349
California BUF – Feedstock Supply Study Page 40

CHAPTER 4 – BIOMASS FEEDSTOCK SUPPLY VOLUME
4.6 CURRENT BIOMASS USERS IN THE FSA
Importantly, not all of the 508,349 BDT of biomass estimated to be practically available with the FSA in the preceding table are currently unutilized. In fact, within the FSA there is actually considerable competition for biomass feedstocks. Figure 4.9 shows a map of the major competitors within and adjacent to the FSA. As the figure shows, there are 10 existing or planned facilities that utilized biomass, in or near the FSA. Depending on the specific facility, these existing or planned plants utilize logs (both live and dead), mill residues (bark, sawdust, shavings, chips), and chipped/ground timber harvest residues, urban wood waste, and ag/orchard residues. As an example, Figure 4.10 shows a load of cull (non-merchantable) sawlogs bound for one of the many markets in or near the FSA.
Figure 4.9 - Map Showing the Location of Major Biomass Feedstock Users Within the FSA
California BUF – Feedstock Supply Study Page 41

CHAPTER 4 – BIOMASS FEEDSTOCK SUPPLY VOLUME
Figure 4.10 – Example of Otherwise Unmerchantable Biomass (Cull) Logs from Standing Dead Trees Bound for One of the Many Markets within the FSA
California BUF – Feedstock Supply Study Page 42

CHAPTER 4 – BIOMASS FEEDSTOCK SUPPLY VOLUME
4.7 NET BIOMASS FEEDSTOCK AVAILABLE FOR BUF
This section provides an estimate of current usage of biomass by the existing biomass facilities in or near the FSA. Thus, the biomass estimates reflect the “net” biomass feedstock available reducing total biomass volume to practically available volume and after accounting for biomass used by existing biomass facilities. Table 4.15 provides a summary of the estimated biomass feedstock availability and demand within the FSA. As this data indicates after taking existing market demand within the FSA into account, there are an estimated 42,809 BDT of biomass feedstocks Practically Available annually within the FSA.
Table 4.15. Annual Biomass Feedstock Availability and Demand Within the FSA
Biomass Feedstocks
Total Quantity
Practically Available
(BDT)
Estimated Annual Existing Usage by Category (deductions from total volume available)
Net Feedstock Available for BUF
After Deductions
(BDT)
Biomass Fuel
(BDT from Logs and
Chips)
Mulch & Compost
(BDT from Logs and
Chips)
Animal Bedding/ Shavings
(BDT from Logs only)
Particle Board
Feedstock
(BDT from Logs only)
Other
(BDT from all Sources)
Forest Derived Feedstocks 170,592 105,000 25
25 2018 demand for HHZ forest biomass by Chinese Station facility
9,00026
26 Includes mulch production for export market
16,800 4,500 2,00027
27 Includes firewood production
33,292
Non-Forest Derived: Mill Residues 124,740 30,294 5,346 0 30,640 53,46028
28 Includes coarse mill residues sold as landscape material and to traditional markets
5,000
Non-Forest Derived: Orchard Removals 167,854 153,000 0 0 0 12,50029
29 Includes firewood production and land application of processed orchard wood
2,354
Non-Forest Derived: Urban/Industrial & Tree Service 45,163 15,000 20,000 0 0 8,00030
30 Includes Alternative Daily Cover use at landfills
2,163
Total 508,349 303,294 34,346 16,800 35,140 75,960 42,809
California BUF – Feedstock Supply Study Page 43

CHAPTER 4 – BIOMASS FEEDSTOCK SUPPLY VOLUME
The largest component of net biomass feedstock available for BUF is the forest derived fuel, which makes up over 75 percent of the total. Unfortunately, this forest derived feedstock is also the most expensive biomass to gather, process, and transport within the FSA. In CTB’s experience, most existing biomass users, if given the option and the ability, will utilize the lowest cost feedstocks first. In this case, the biomass power plants at Chinese Station, SPI Standard, DTE Stockton and Merced Power utilize almost all the orchard removal and urban/industrial & Tree Service biomass within the FSA.
A complicating factor in predicting the available biomass for the BUF is that the Chinese Station biomass power plant is currently operating under a special “BioRAM” Power Purchase Agreement (PPA) with Southern California Edison. The contract requires the facility to consume 60 percent forest derived fuels from HHZs in 2018 and 80 percent HHZ fuel in 2019 and beyond. The 2019 increase equates to an additional 32,000 BDT/year to Chinese Station’s forest fuel demand. According to Table 4.15, there is only an estimated additional 38,292 BDT of net practically available forest derived biomass available within the FSA. Note, this total includes the 33,292 BDT of forest derived fuel and 5,000 BDT of mill residues. Mill residues are included in the total because per the BioRAM contracts, mill residues count as an HHZ fuel so long as the mill and power plant can document that the mill residues were derived from logs originating in HHZ zones. In any event, the 2019 BioRAM contract fuel requirements will likely require Chinese Station to either use most of the forest derived feedstock from HHZs within the FSA, or seek more qualifying fuel from HHZs outside of the FSA to comply with the contract.
Another consideration is that under the terms of the PPA, Chinese Station can reportedly opt-out of the 80 percent HHZ forest fuel requirement in 2019. In that case, Chinese Station’s demand for forest derived fuel would drop significantly and be replaced with lower cost orchard and urban feedstock. Such a strategic move by Chinese Station would significantly increase the available forest-derived fuel and essentially consume all excess orchard and urban feedstock within the FSA.
During the preparation of this study, the California Legislature passed Senate Bill 90131
31 Bill Text - SB-901 Wildfires. - https://leginfo.legislature.ca.gov/faces/billTextClient.xhtml?bill_id=201720180SB901
addressing wildfire-related issues. Among other things, the Bill directs Utilities to amend all existing BioRAM PPAs to allow the facility to “opt in” or “opt out” of the minimum HHZ fuel requirements each month. If a facility elects to opt out in a particular month, they receive a lower energy price. While it is too early to know what the terms of these amendments will look like, it is reasonable to assume that Chinese Station will continue to “opt in” and operate at least some of the months each year using 80 percent of their fuel derived from HHZs. Chinese Station’s permitted ability to change feedstock mix, coupled with the fact that they will likely have the ability to opt in and out of their minimum 80 percent HHZ feedstock requirement, makes forecasting biomass demand within the FSA very uncertain.
Based on the above, CTB believes it very likely that Chinese Station will greatly reduce demand for forest derived biomass feedstock. However, based on interviews with other biomass feedstock users, CTB also expects that biomass feedstock demand in the form of logs for use as particle board raw material, shavings for animal bedding, and high value landscape chips will remain and possibly increase. If, though unlikely at the writing of this report, Chinese Station were to reduce its demand
California BUF – Feedstock Supply Study Page 44

CHAPTER 4 – BIOMASS FEEDSTOCK SUPPLY VOLUME
for forest-derived feedstock to zero, the practically available biomass for a BUF would increase by 105,000 BDT to 149,192 BDT/year.
4.8 ALLOCATING PRACTICALLY AVAILABLE FOREST DERIVED BIOMASS SUPPLY BY ZONE
The largest single cost item for biomass feedstocks is typically the cost of transportation. To better address the transportation costs associated with this project, CTB broke the FSA into 20-mile radius and 40-mile radius supply zones. Using Stanislaus National Forest Base map data, a road haul distance map was developed for the FSA. Figure 5.1 shows one-way road miles (color difference denote differing road miles – see legend) data for the Productive Forestlands within Supply Zone 1 and Supply Zone 2. See Chapter 5 for additional analysis of how transportation distance affects delivered costs.
Figure 5.1 - One-way Road Haul Distance Map for Productive Forestlands within the FSA
California BUF – Feedstock Supply Study Page 45
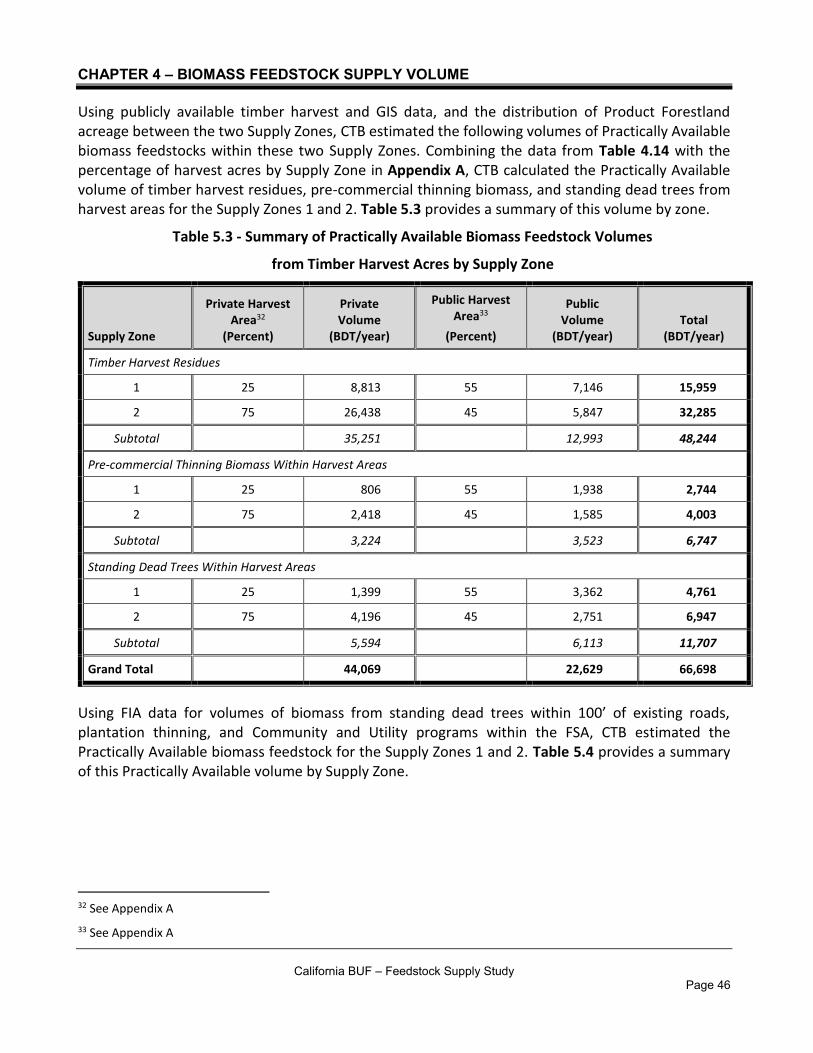
CHAPTER 4 – BIOMASS FEEDSTOCK SUPPLY VOLUME
Using publicly available timber harvest and GIS data, and the distribution of Product Forestland acreage between the two Supply Zones, CTB estimated the following volumes of Practically Available biomass feedstocks within these two Supply Zones. Combining the data from Table 4.14 with the percentage of harvest acres by Supply Zone in Appendix A, CTB calculated the Practically Available volume of timber harvest residues, pre-commercial thinning biomass, and standing dead trees from harvest areas for the Supply Zones 1 and 2. Table 5.3 provides a summary of this volume by zone.
Table 5.3 - Summary of Practically Available Biomass Feedstock Volumes
from Timber Harvest Acres by Supply Zone
Supply Zone
Private Harvest Area32
32 See Appendix A
(Percent)
Private Volume
(BDT/year)
Public Harvest Area33
33 See Appendix A
(Percent)
Public Volume
(BDT/year) Total
(BDT/year)
Timber Harvest Residues
1 25 8,813 55 7,146 15,959
2 75 26,438 45 5,847 32,285
Subtotal 35,251 12,993 48,244
Pre-commercial Thinning Biomass Within Harvest Areas
1 25 806 55 1,938 2,744
2 75 2,418 45 1,585 4,003
Subtotal 3,224 3,523 6,747
Standing Dead Trees Within Harvest Areas
1 25 1,399 55 3,362 4,761
2 75 4,196 45 2,751 6,947
Subtotal 5,594 6,113 11,707
Grand Total 44,069 22,629 66,698
Using FIA data for volumes of biomass from standing dead trees within 100’ of existing roads, plantation thinning, and Community and Utility programs within the FSA, CTB estimated the Practically Available biomass feedstock for the Supply Zones 1 and 2. Table 5.4 provides a summary of this Practically Available volume by Supply Zone.
California BUF – Feedstock Supply Study Page 46

CHAPTER 4 – BIOMASS FEEDSTOCK SUPPLY VOLUME
Table 5.4. Summary of Practically Available Biomass Feedstock Volumes from Standing Dead Trees Within 100’ and 101’ to 1,000’of Existing roads, Plantation Thinnings and Community and
Utility Programs By Supply Zone
Supply Zone
Private Volume (BDT/year)
Public Volume (BDT/year)
Total Volume (BDT/year)
Standing Dead Trees (within 100’ of existing roads)
1 5,509 2,202 7,711
2 7,012 17,817 24,829
Subtotal 12,521 20,019 32,540
Standing Dead Trees (within 101’ to 1,000’ of existing roads)
1 10,065 3,987 14,052
2 12,810 32,259 45,069
Subtotal 22,876 36,246 59,121
Plantation Thinnings
1 0 0 0
2 6,522 1,135 7,657
Subtotal 6,522 1,135 7,657
Community-based and Utility Programs
1 1,830 0 1,830
2 2,745 0 2,745
Subtotal 4,575 4,575
Grand Total 46,493 57,400 103,893
California BUF – Feedstock Supply Study Page 47

CHAPTER 4 – BIOMASS FEEDSTOCK SUPPLY VOLUME
Table 5.5 combines the estimated volume of forest derived biomass feedstocks by zone for the entire FSA.
Table 5.5- Total Practically Available Forest Derived Biomass Feedstocks By Supply Zone34
34 Sawmill residues (green sawdust) have not be included in this forest derived feedstock summary.
Biomass Feedstock
Source
Zone 1 (BDT/year)
Zone 2 (BDT/year)
Total (BDT/year)
Grand Total Private Public Private Public Private Public
Timber Harvest Residues 8,813 7,146 26,438 5,847 35,251 12,993 48,244
Pre-commercial Thinning
(removed concurrently with harvests) 806 1,938 2,418 1,585 3,224 3,523 6,747
Standing Dead Trees
(removed concurrently with harvests) 1,399 3,362 4,196 2,751 5,595 6,113 11,708
Standing Dead
(removed from < 100’ of existing roads) 5,509 2,202 7,012 17,817 12,521 20,019 32,540
Standing Dead
(removed from 101’ -1,000’ of ex. roads) 10,065 3,987 12,810 32,259 22,875 36,246 59,121
Plantation Thinnings 0 0 6,522 1,135 6,522 1,135 7,657
Community-based & Utility Programs 1,830 0 2,745 0 4,575 0 4,575
Public vs. Private Subtotal 28,422 18,635 62,141 61,394 90,563 80,029 170,592
Grand Total
47,057
(28%)
123,535
(72%)
170,592
(100%)
Based on this analysis CTB estimates that 47,057 BDT or approximately 28 percent of the Practically Available forest derived biomass feedstocks are within the Supply Zone 1. In addition, CTB estimates that 123,535 BDT or approximately 72 percent of the forest derived biomass feedstocks are within Supply Zone 2.
Of the total of 170,592 BDT of Practically Available forest derived biomass feedstock within the FSA, CTB estimates that existing markets account for between 32,810 BDT (if Chinese Station were to opt out of using forest biomass completely) and 137,300 BDT of demand (see Table 4.15). Therefore, CTB estimates that somewhere between 33,292 BDT and 137,782 BDT of unused forest derived biomass are Practically Available within the FSA.
California BUF – Feedstock Supply Study Page 48

CHAPTER 5 – BIOMASS FEEDSTOCK PRICING
This chapter provides estimates of the delivered price of the various types of biomass feedstocks.
5.1 CURRENT AND HISTORIC PRICING
Biomass feedstock pricing has fluctuated dramatically over the past several years within the FSA. The primary driver affecting feedstock pricing has been the rise and fall of demand from the biomass power sector, which has traditionally been the largest user of biomass in the FSA. Table 5.1 provides a historical overview of delivered prices for biomass feedstocks within the FSA.
Table 5.1 – 2012-2016 Average Delivered Prices for Biomass Feedstock within the FSA
Feedstock Source
Feedstock Type
Feedstock Price ($/BDT)
Forest Derived Fuel Chips 35-45
Sawmill Residues Sawdust 25-30
Orchard Chips 25-35
Urban/Industrial/Tree Service Chips 20-30
Standing Dead Tree (Cull Logs) Logs 31-39
Biomass feedstock pricing moderated somewhat following the closure of the Tracy, Ione, Mendota, and Delano bioenergy plants in 2014-2016. These closures resulted in a dramatic decrease in demand and the market price for orchard and urban biomass feedstocks. However, over the past eighteen months with the execution of the BioRAM PPAs there has been a dramatic shift in demand for forest biomass feedstock, particularly originating from HHZs. Within the FSA, only Chinese Station is operating under a BioRAM PPA and as such is required to meet the 60 percent and 80 percent forest derived HHZ feedstock minimum (historically CS has used less than 10 percent forest-derived feedstock). As a result, the demand for forest derived feedstocks in the FSA has skyrocketed and prices have as well. With falling demand for orchard and urban/industrial biomass feedstocks, market prices for these materials have also softened. Table 5.2 provides a summary of the more recent biomass feedstock pricing within the FSA.
Table 5.2. Current Biomass Feedstock Delivered Prices within the FSA
Feedstock Source Feedstock Type Feedstock Price ($/BDT)
Forest Derived Fuel Chips 45-65
Sawmill Residues Sawdust 40-45
Orchard Chips 15-25
Urban/Industrial/Tree Service Chips 15-20
Standing Dead Tree (Cull Logs) Logs 31-69
California BUF – Feedstock Supply Study Page 49

CHAPTER 5 – BIOMASS FEEDSTOCK COST
5.2 FOREST DERIVED BIOMASS PRODUCTION COSTS
To estimate the cost of this forest derived biomass feedstock, CTB determined from published studies, interviews with several forest operators in the FSA, combined with extensive experience in the area to estimate costs to harvest and process the various types of forest biomass feedstocks. Since site and road conditions as well as other project-related operating requirements vary so much, biomass harvest and processing costs vary as well. CTB has chosen to provide a range of costs from Low to High. The cost estimates to gather, process, and load biomass feedstock on a truck in $/Green Ton (including moisture) and BDT are shown in Table 5.6 below.
Table 5.6 - Estimated Forest Biomass Harvest and Processing Costs
Biomass Product
Type
Cut & Skid Process & Load Tot. Cost fob Truck
Avg. MC (%)
Tot. Cost fob Truck
Low ($/GT)
High ($/GT)
Low ($/GT)
High ($/GT)
Low ($/GT)
High ($/GT)
Low ($/BDT)
High ($/BDT)
Community-Based/Utility Programs Chips 0 0 0 15 0 15 40 0 25
Harvest Residuals: Top Piles, Burn Piles Chips 0 0 24 34 24 34 35 36 52
Standing Dead Trees Removed with Harvest Logs 18 24 3 3 21 27 30 30 39
Pre-commercial & Plantation Thinning Chips 20 25 13 15 33 40 40 54 67
Standing Dead Trees > 20" DBH 101 to 1000' of roads Logs 36 40 5 6 41 46 30 59 66
Standing Dead Trees > 20" DBH within 100' of roads Logs 32 45 5 6 37 51 30 53 73
Based on GIS evaluation of the haul distance data from Figure 5.1 it was determined that the average one-way haul distance within Supply Zone 1 is 23 road miles and 48 road miles for Supply Zone 2. Combining the average haul distances for each supply zone with the biomass feedstock prices on board truck CTB calculated the average all in cost for forest derived biomass feedstocks within these two zones. Table 5.7 provides a summary of these cost estimates for forest derived feedstocks.
California BUF – Feedstock Supply Study Page 50

Biomass Product
Type
Cost on Board Truck
Est. Transportation Cost
Delivered Cost from Zone 1
Delivered Cost from Zone 2
Low High Zone 1 Zone 2 Low High Low High
Community-Based/Utility Programs Chips
0 25 13 22 13 38 13 47
Harvest Residuals: Top Piles, Burn Piles Chips
36 52 13 22 49 65 58 74
Standing Dead Trees Removed with Harvest Logs
30 39 11 19 41 49 49 57
Pre-commercial & Plantation Thinning Chips
54 67 12 22 67 79 76 89
Standing Dead Trees > 20" DBH 101 to 1000' of roads Logs
59 66 10 18 69 76 77 84
Standing Dead Trees > 20" DBH within 100' of roads Logs
53 73 10 18 63 83 71 91
CHAPTER 5 – BIOMASS FEEDSTOCK COST
Table 5.7 - Delivered Cost Estimate ($/BDT) for Producing Forest Biomass Feedstocks
Supply Zone 1 is 0 to 20 miles from Camage Industrial Park. Average 1-way haul = 23 miles.
Supply Zone 2 is 21 to 40 miles from Camage Industrial Park. Average 1-way haul = 48 miles.
Note that a Green Ton is the actual weight of the wood (i.e., water included) and the weight of biomass on each truck is 25 green tons.
Estimated transportation costs based on:
$115/hour trucking cost and 1 hour loading and unloading time
30/35/40 percent moisture content for standing dead/community-based, & top piles/thinnings respectively
As this economic analysis shows biomass feedstocks in the Supply Zone 1 range in cost from a low of $12.54/BDT (freight only) for biomass from Community-based and Utility programs to a high of $90.86/BDT for accessing standing dead trees that are 101 - 1,000 feet from existing roads.
Table 5.8 provides a summary of the cost associated with each of these biomass feedstocks. Note that for the purposes of calculating the delivered costs in this table, the mid-point of the delivered cost range in the preceding table was used. For example, for fuel from Community-Based programs, the low range of the delivered cost estimate was $12.54/BDT and the high range of the delivered cost estimate was $37.54/BDT. Therefore, the mid-point of the range, which is $25.04/BDT was used. Also note the average haul distance assumed for Zone 1 was 23 miles (1-way) and for Zone 2 was 48 miles (1-way).
As the data in the chart illustrates, the cost for any given increment (row) of supply ranges from a low of $25/BDT to a high of about $82/BDT. Also, the two columns on the right hand side of the table shows the cumulative volume of supply available from different feedstocks (ranked from lowest cost to highest cost) and the cumulative weighted average for the cost of fuel in a given row and all rows before it.
California BUF – Feedstock Supply Study Page 51
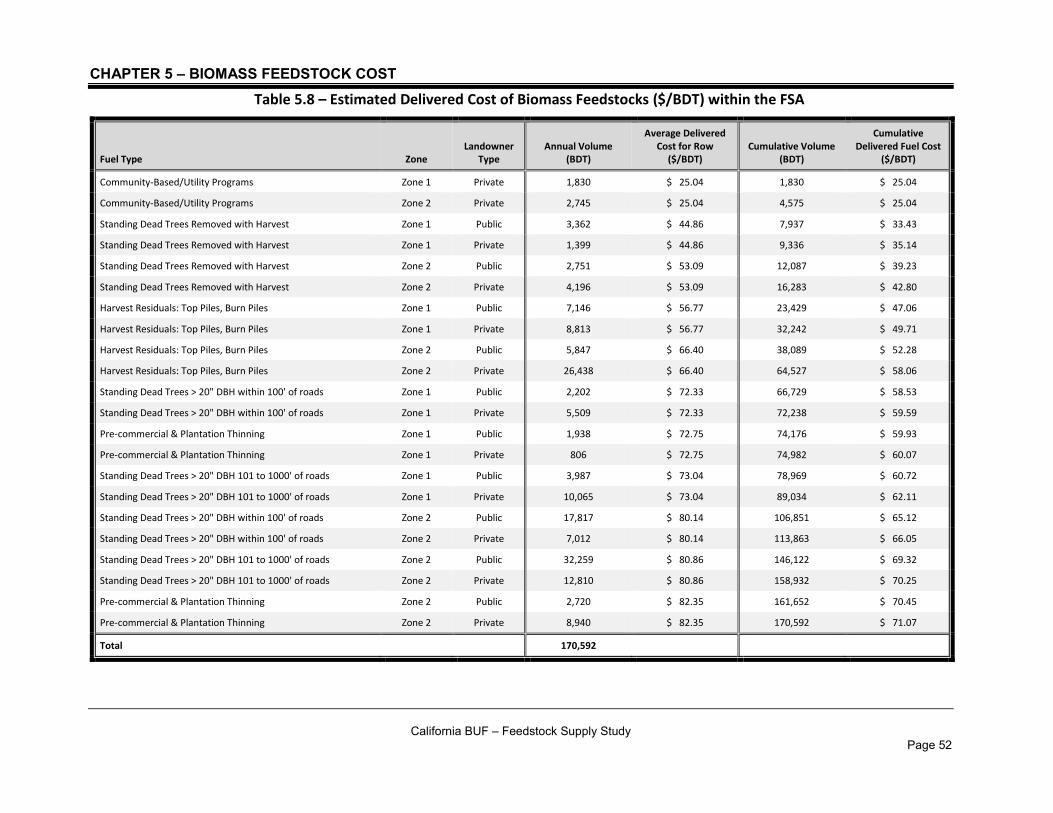
CHAPTER 5 – BIOMASS FEEDSTOCK COST
Fuel Type Zone Landowner
Type Annual Volume
(BDT)
Average Delivered Cost for Row
($/BDT) Cumulative Volume
(BDT)
Cumulative Delivered Fuel Cost
($/BDT)
Community-Based/Utility Programs Zone 1 Private 1,830 $ 25.04 1,830 $ 25.04
Community-Based/Utility Programs Zone 2 Private 2,745 $ 25.04 4,575 $ 25.04
Standing Dead Trees Removed with Harvest Zone 1 Public 3,362 $ 44.86 7,937 $ 33.43
Standing Dead Trees Removed with Harvest Zone 1 Private 1,399 $ 44.86 9,336 $ 35.14
Standing Dead Trees Removed with Harvest Zone 2 Public 2,751 $ 53.09 12,087 $ 39.23
Standing Dead Trees Removed with Harvest Zone 2 Private 4,196 $ 53.09 16,283 $ 42.80
Table 5.8 – Estimated Delivered Cost of Biomass Feedstocks ($/BDT) within the FSA
Harvest Residuals: Top Piles, Burn Piles Zone 1 Public 7,146 $ 56.77 23,429 $ 47.06
Harvest Residuals: Top Piles, Burn Piles Zone 1 Private 8,813 $ 56.77 32,242 $ 49.71
Harvest Residuals: Top Piles, Burn Piles Zone 2 Public 5,847 $ 66.40 38,089 $ 52.28
Harvest Residuals: Top Piles, Burn Piles Zone 2 Private 26,438 $ 66.40 64,527 $ 58.06
Standing Dead Trees > 20" DBH within 100' of roads Zone 1 Public 2,202 $ 72.33 66,729 $ 58.53
Standing Dead Trees > 20" DBH within 100' of roads Zone 1 Private 5,509 $ 72.33 72,238 $ 59.59
Pre-commercial & Plantation Thinning Zone 1 Public 1,938 $ 72.75 74,176 $ 59.93
Pre-commercial & Plantation Thinning Zone 1 Private 806 $ 72.75 74,982 $ 60.07
Standing Dead Trees > 20" DBH 101 to 1000' of roads Zone 1 Public 3,987 $ 73.04 78,969 $ 60.72
Standing Dead Trees > 20" DBH 101 to 1000' of roads Zone 1 Private 10,065 $ 73.04 89,034 $ 62.11
Standing Dead Trees > 20" DBH within 100' of roads Zone 2 Public 17,817 $ 80.14 106,851 $ 65.12
Standing Dead Trees > 20" DBH within 100' of roads Zone 2 Private 7,012 $ 80.14 113,863 $ 66.05
Standing Dead Trees > 20" DBH 101 to 1000' of roads Zone 2 Public 32,259 $ 80.86 146,122 $ 69.32
Standing Dead Trees > 20" DBH 101 to 1000' of roads Zone 2 Private 12,810 $ 80.86 158,932 $ 70.25
Pre-commercial & Plantation Thinning Zone 2 Public 2,720 $ 82.35 161,652 $ 70.45
Pre-commercial & Plantation Thinning Zone 2 Private 8,940 $ 82.35 170,592 $ 71.07
Total 170,592
California BUF – Feedstock Supply Study Page 52

CHAPTER 5 – BIOMASS FEEDSTOCK COST
The data displayed in Table 5.8 is displayed graphically as a biomass feedstock pricing and feedstock volume curve in Figure 5.2 below. As previously described, it is important to note that existing users are estimated to consume all but about 42,000 BDT of the 172,000 BDT total volume in the supply curve. It is logical and very likely that the existing firms utilize the lowest cost available materials. Thus, a new BUF facility is likely to be relatively high on the cost curve.
Figure 5.2 - Forest Derived Biomass Feedstock Supply Curve
5.3 PROCESSING EQUIPMENT
As stated earlier the cost estimates are based on processing equipment and harvesting methods currently utilized within the FSA. The primary biomass feedstock that has been produced is biomass fuel (chips and chip logs) for use by biomass fired power plants in the FSA. Appendix B provides a typical specification for this type of biomass feedstock.
For forest derived biomass feedstocks this includes the use of mechanical harvesting equipment as well as some traditional hand falling of larger standing dead trees. Extraction equipment typical includes rubber tired grapple skidders or crawler tractor skidding. Recently there have been several operators using small skid steer track machines to extract standing dead hazard trees along roads. These machines are smaller in size and allow for minimal impact on the site and damage to paved roads. Unfortunately, these machines do not have the payload capacity of the more common larger skidders and crawler tractors and as such require the operator to buck logs into smaller lengths to reduce the weight. For larger diameter trees this can result in log lengths less than 10 feet. Handling these standing dead trees with shorter log lengths has changed the traditional processing techniques
California BUF – Feedstock Supply Study Page 53

CHAPTER 5 – BIOMASS FEEDSTOCK COST
associated with biomass feedstock production in the FSA. More and more loggers are removing this material in log form rather than in-woods chipping or grinding. In addition, several end users of biomass feedstocks within the FSA are now accepting logs rather than the historical practice of accepting chips/ground material. This has many advantages for loggers as well as end users. Some of these are: log trucks can access more difficult road systems than chip vans, there is no need to have specialized chipping equipment and personnel to run a separate chipping operation, log trucks are more available, and logs can be stored much longer at the manufacturing facility than chipped material. Of course, the double handling involved (offloading and storage) creates higher costs for the manufacturing facility. This tends to be offset somewhat by lower biomass processing costs because the chipper or grinder is operating in one spot in a log yard with large volumes of biomass to process rather than in a small constrained landing in the woods. Also, a stationary grinder is typically electrically powered rather than diesel powered; electric power is less costly.
5.4 FUTURE BIOMASS SUPPLY RISKS AND OPPORTUNITIES
There are positive and negative risks associated with certainty, reliability, and costs of projecting the future of any biomass feedstock supply. A perfect example has been the unexpected tremendous tree mortality that has occurred the past 4 years. Other risks include large scale catastrophic wildfires, which may provide an unanticipated windfall of biomass feedstock for short periods (5 to 10 years). These types of unanticipated events result in less predictable biomass feedstock supplies over the long-term (20 to 30 years).
5.4.1 Supply Risks
Historically, federal land manager’s ability to adequately address the complex and often litigious environmental regulations required to get approval for timber harvesting operations, along with budget and staffing limitations, have significantly slowed the pace of planned forest treatments. Unexpected demand changes are also a possibility. In July 2018 the shuttered Buena Vista Biomass power plant was put up for auction. The auction resulted in no new Buyer at this time. However, there is always the risk that a new owner may try to restart this facility, located approximately 60 miles from the BUF site. In addition, a new player, with an as-yet unproven technology at commercial scale, has announced plans to enter the market for orchard biomass. Aemetis, Inc. aims to construct a 12 million gallon per year cellulosic ethanol plant in Riverbank, CA. Located approximately 45 miles from the BUF this facility is targeting use of up to 150,000 tons per year of orchard and possibly other wood waste, such as forest-derived biomass.
Perhaps the greatest risk to the supply of forest derived biomass is the fact that the majority of Productive Forestland within the FSA is under US Forest Service management. Over the past 3 decades annual tree growth on these Productive Forestlands have greatly outpaced the rate of removals. The ability of the agency to prepare and administer management treatments to the Productive Forestlands within the FSA is critical to the success of any forest derived biomass feedstock supply.
5.4.2 Supply Opportunities
There are two separate but seemingly probable things at play that could greatly increase the practically available biomass feedstock supply within the FSA.
California BUF – Feedstock Supply Study Page 54

CHAPTER 5 – BIOMASS FEEDSTOCK COST
First, as discussed above under Current Biomass Market Competition, the Chinese Station bioenergy facility in Chinese Camp may choose to exercise the option in their PPA to withdraw from the minimum requirement to secure at least 80 percent of their feedstock from HHZ’s in 2019 and beyond. A more likely scenario is, under the new provisions in SB 901, is they will opt to use 80 percent forest feedstock during the summer months when it is most readily available from inwoods operations. This is an advantage and a disadvantage for a BUF. The advantage is that there will be likely less demand for forest-derived biomass feedstock available from within the FSA than there is currently on an annual basis. The disadvantage is that Chinese Station’s demand for forest-derived biomass would peak during the summer months when the forest is most accessible creating greater demand during that period. Chinese Station’s likely operating scenario represents lower annual demand for forest biomass within the FSA by as much as 105,000 BDT/year compared to the demand in 2018 and make it available for the BUF.
Secondly, the 10-year Tuolumne County Master Stewardship Agreement (TCMSA) with the Forest Service, executed in early 2018, although still subject to the same NEPA requirements, could produce significant amounts of forest biomass above and beyond the historical timber harvests the Forest Service has undertaken over the past 7 years (see detailed discussion below under Policy Risks). The first 1,000 acre thinning project is being planned for implementation in 2019 which could produce as much as 20,000 BDT. TC’s goal is to ramp up the annual program to at least 5,000 acres of commercial thinning and 3,000 acres of biomass thinning within the TC portion of the FSA. While it is too early to gauge the future success of the TCMSA, this level of treatments could potentially produce 50,000 to 75,000 BDT/year of biomass feedstock for the BUF.
It is important to note that any BUF facility seeking commercial financing will note be able to point to these sources as a secure and stable supply since they have no track record and will almost certainly be viewed as too risky by lenders.
5.4.3 Supply Risks and Opportunities from Stakeholder Interviews
CTB interviewed a variety of stakeholders that currently use and/or supply various forms of biomass from forestlands within the study area to help get a realistic picture of historic biomass availability. CTB found the stakeholders to be willing to freely discuss biomass supply issues. Comments are summarized below.
5.4.3.1 Sierra Pacific Industries (SPI)
SPI is the largest market and supplier of forest products in the FSA. CTB spoke with a variety of managers that have responsibility for procurement of saw timber and biomass, management of their timber tracts and sales of mill byproducts.
Eric Shelby, Byproducts Manager, indicates that SPI has very strong high-value markets for all of their mill byproducts (sawdust, shavings, chips, bark, and dry planer hog wood), including their own bark and landscape materials processing facility in Keystone, California. As a result, they purchase most of the fuel for their 10 MW biomass cogeneration plant at the Sonora sawmill on the open market. Occasionally they use biomass produced from their own Productive Forestlands and Forest Service (FS) sales, but primarily target fuel from the abundant orchard removals in the northern San Joaquin valley. This orchard fuel is preferred because the delivered cost is much less than the cost of forest
California BUF – Feedstock Supply Study Page 55

CHAPTER 5 – BIOMASS FEEDSTOCK COST
biomass and is readily available on a year-round basis. Whenever possible SPI sells biomass produced from its forestry operations to other local users such as Pacific Ultrapower Chinese Station (CS); American Wood Shavings (AWS) near Jamestown; and the AmPine particleboard plant in Martell. SPI also traditionally sells some excess mill byproducts (sawdust) during late fall and winter when demand from landscape markets is lower.
Brian Wayland, Resource Manager for Sonora & Chinese Camp sawmills, states that between Sonora and Chinese Camp Mills, SPI can utilize all species of merchantable logs that are longer than 12 feet and larger than 6 inches small end diameter from company lands, other private lands, and US Forest Service sales. SPI has purchased some Forest Service green thinning sales between 2000 and 2013 with mandatory biomass removal requirements (usually the < 6” tops and limbs from whole-tree yarding), but they strongly encourage the Forest Service to make biomass removal optional for the Purchaser or “subject to agreement”. This is because of the great uncertainty surrounding the future of the local bioenergy market. Mr. Wayland suggested the largest supply of biomass will be from future projects on Forest Service lands because that is where the largest management needs are.
Tim Tate, Central Sierra Regional Productive Forestlands Manager, oversees management of SPI’s fee lands within the study area. Roughly 75 percent of SPI’s forestland holdings within the study area are managed by the Sonora District with the other 25 percent north of the South Fork Mokelumne River managed by the Martell District. Mr. Tate indicates that traditionally SPI has disposed of timber harvest residuals and unmerchantable logs from recent drought mortality salvage operations through open pile burning.
One of SPI’s goals is to move away from open-pile burning whenever possible. However, historically low fuel pricing from local biomass markets make forest residuals too costly, even though SPI is willing to pick up some of the tab. This continues to be true even since Chinese Station has reportedly been offering higher prices for forest-derived biomass feedstock under the BioRAM PPA. Economics and roads inaccessible to chip trucks limit SPI’s ability to move away from open-pile burning. There are other obstacles to utilization of biomass (besides market pricing) relating to road accessibility for chip trucks, and a lack of processing infrastructure (chipping/grinding operators and chip trucks). There is also a need for pre-commercial thinning of sub-merchantable trees in young plantations on the Martell District (as much as 500 acres/year) and wildland stands. Historically SPI has performed these activities using hand-thinning or mastication because of the same reasons listed above.
5.4.3.2 Pacific Ultrapower Chinese Station (CS)
CTB interviewed Rick Carter, Plant Manager. Mr. Carter indicated that CS, located in Chinese Camp, is in the 2nd year of a 5-year BioRAM 1 Power Purchase Agreement (PPA) to sell renewable power to Southern California Edison (SCE). The PPA requires utilization of at least 60 percent of their feedstock from High Hazard Zones (HHZ) in the forest during 2018 and 80 percent in 2019 and beyond. In contrast, CS historically derived about 7 to 10 percent of their feedstock from the forest.
Mr. Carter frankly stated that CS is having a difficult time obtaining the 95,000 BDT of HHZ feedstock under the price constraints of the PPA. He said that the difficulty lies in the fact that to achieve this target, landowners or suppliers must share in the cost of biomass removal. This has been available with hazard tree removal from threats to utility powerlines, State highways, public roads, and other infrastructure. However, now that the drought mortality has slowed dramatically, the additional HHZ
California BUF – Feedstock Supply Study Page 56

CHAPTER 5 – BIOMASS FEEDSTOCK COST
feedstock must come from more costly fire and drought salvage or forest management projects on Forest Service and private forestlands. Mr. Carter stated that their experience is that there is substantial competition for forest biomass and cull logs right now which has driven market prices higher than expected and he can’t predict what CS’ future is going to be right now.
The PPA contains a provision that allows CS to opt out of the HHZ feedstock requirements in exchange for a lower energy price for the balance of the PPA term. This would allow CS to utilize less costly orchard and urban feedstock. He emphatically suggested that any Biomass Utilization Facility (BUF) that is developed needs to be able to pay for the full cost of gathering, processing, and transportation of the biomass from the forest to the BUF and target feedstock that isn’t being utilized by other markets.
5.4.3.3 US Forest Service
The following subsections describe information gathered from interviews and meetings related to potential biomass supply from the US Forest Service.
Region 5 US Forest Service - Randy Moore, Region 5 Regional Forester made a presentation at a May 14, 2018 tour of the Stanislaus National Forest attended by Washington Office (including acting USFS Chief Forester), Region 5, local USFS managers, California timber industry representatives and state and local government. Among other things, Mr. Moore outlined the Region’s general strategy for vegetation management. Mr. Moore stated that the Washington office is directing the Region to increase the pace and scale of vegetation treatments, including an increase in timber outputs. However, region-wide the work force is down by 36 percent and the USFS is going to have to do more with less people. Three important strategies are to: 1) use Master Stewardship Agreements and other collaborative partnerships; 2) use thinning prescriptions which require less tree marking; and 3) streamlining the time and effort for the NEPA process by using more Categorical Exclusions.
Stanislaus National Forest - Jason Kuiken, Stanislaus Forest Supervisor, discussed the outlook for vegetation management treatments at a September 19, 2018 meeting with interested members of the American Forest Resource Council. He explained that the FY 2019 budget expected to be same as FY 2018 but has heard that the Washington Office will want more timber output. The Stanislaus National Forest is still understaffed in many key vegetation management positions. The hope is that the Master Stewardship Agreement (MSA) with Tuolumne County and others will begin to produce viable projects that will add to what the Stanislaus National Forest can put together. The Stanislaus National Forest hopes to do a forest-wide NEPA document using soon-to-be-acquired LiDAR data under a $5 million CCI Healthy Forests grant to Tuolumne County. He hopes to have a completed Decision Notice by July 2020. Environmental documents for future projects will tier-off the main NEPA document and make project implementation happen more easily and quickly. He expects the use of LiDAR data in fire behavior modeling will justify heavier thinning and fuels treatments as well as future expenditures on roads to help improve forest resiliency.
Also, Brian McCrory, contracting officer from the Stanislaus National Forest, discussed the recent accomplishments and anticipated vegetation/fuels management program of work for
California BUF – Feedstock Supply Study Page 57

CHAPTER 5 – BIOMASS FEEDSTOCK COST
the Stanislaus National Forest at the same September 19, 2018 meeting with the American Forest Resource Council. Mr. McCrory shared the following:
• In FY 2018 The Stanislaus National Forest awarded 28 million board feet of green thinning, fire & insect salvage projects, including small amounts of biomass and firewood.
• In FY 2019 the Stanislaus National Forest projects that 5,250 acres will be treated to reduce fuels and produce the equivalent of 38 million board feet of green thinning, fire salvage, and insect salvage trees. Almost all green thinning sales will have biomass removal “subject to agreement” by purchaser rather than required because of uncertainty about the future of the biomass market. One project - Looney (currently being developed under the Tuolumne County MSA) plans have required biomass removal and is expected to produce 5-10,000 BDT biomass.
• In FY 2020 the Stanislaus National Forest projects that 7,400 acres will be treated to reduce fuels and will produce the equivalent of 40 million board feet of timber. One project called Cold Springs IRSC is about 500 acres and is expected to produce 1.5 million board feet of biomass but needs at least $2 million of additional funding to implement.
El Dorado National Forest - CTB interviewed Jesse Plummer, Amador Ranger District Fire Management Officer. Mr. Plummer indicated that many large burn piles with 6 to 20 truckloads per pile have been generated from the View 88 Timber Sale on Hwy 88. He indicated that the District will likely be generating many more burn piles and that the District has a huge backlog of unburned piles. He indicated the Forest is willing to sell the biomass in burn piles for 10 cents/ton but the District has no funding to help transport it from the woods to the end user. He did indicate that the El Dorado National Forest could possibly funnel some Brush Disposal funds through their Master Stewardship Agreement partner the Wild Turkey Foundation who could then use the money to assist interested biomass users to process and remove the piles.
5.4.3.4 Central Valley Ag Group (CVAG)
Mike Barry, President & CEO, said that CVAG, located in Oakdale, is a relative newcomer to the forest biomass market. They currently utilize 5 truckloads/day of logs to manufacture a variety of landscape materials for domestic and Asian markets. They plan to ramp up to 10 truckloads/day (50,000 tons/year) by Q4 2018. Their minimum log specifications are 8 feet long, and/or 5 inches diameter small end. Mr. Barry stated that their biggest obstacle is a shortage of log trucks to get material to their yard in Oakdale. There are, however, many loggers willing to sell them material.
5.4.3.5 AmPine
AmPine is a particleboard manufacturing facility located in Martell, located on the northern boundary of the Study Area. Traditionally the majority of AmPine’s feedstock has been sawmill byproducts and waste from pallet companies. An interview with Rob Crummett, Feedstock Supply Manager, indicated
California BUF – Feedstock Supply Study Page 58

CHAPTER 5 – BIOMASS FEEDSTOCK COST
that AmPine has historically has also had a small biomass log purchase program. Salvage operations after the Rim and Butte fires allowed them to increase the amount of the biomass logs after finding that use of fiber from charred logs did not create a problem with quality of their finished products. In 2017-18 AmPine began utilizing salvage logs from utility and public road hazard tree abatement operations. The facility is now targeting purchase of 25,000 green tons/year of biomass logs, more if available at the right price.
5.4.3.6 American Wood Shavings (AWS)
AWS has a facility located next to SPI’s landscape materials plant outside of Jamestown at the old Keystone sawmill site. At this facility AWS produces, dries, and bags shavings from whole logs. The shavings are primarily used as bedding for animals (e.g., horses). AWS has very specific log length specifications and the minimum log size is 8 feet long and 10” diameter small end. According to John Davis, Vice President Western Operations, the Keystone facility currently uses 25,000 to 28,000 green tons/year of pine and Douglas-fir logs. Markets for bagged shavings are strong and a planned capital investment in Q4 2018 will increase production and log use to about 35,000 green tons/year. They are evaluating the possibility of producing shavings from incense cedar. Mr. Davis expressed frank concern because they have had difficulty getting enough logs to run the operation in 2018 due to increased competition from other log markets, including SPI. As a result, log prices are significantly higher than planned this year.
5.4.3.7 Central Sierra Environmental Resource Center (CSERC)
CSERC, an active local Conservation Group located in Twain Harte, although neither a producer nor user of forest biomass, is a very involved and vocal supporter of biomass removal from the National Forest. John Buckley, Director, told CTB that CSERC is, and has been, a strong supporter of biomass removal along with thinning logging operations followed by prescribed fire that return the green forest to a more natural resilient condition. CSERC has never opposed a biomass removal project on the Stanislaus NF and would like to see the FS do much more. They have also been a strong supporter of local markets for forest biomass. However, they have been disappointed that historical biomass feedstock prices have been too low to get much done on the Stanislaus. Mr. Buckley said CSERC would like to see any newly developed BUF located as close to forest as possible and be able to make it economical to remove biomass.
5.4.4 Policy Risks
Public policy and public sentiment have never been more aligned in support of forest biomass removal for wildfire hazard reduction. The increasing frequency and size of catastrophic wildfires in CA and across the west have not only resulted in billions of dollars in property and resource damages, it has also increasingly taxed Fire Management Agency’s budgets and resources and perhaps reached a tipping point.
5.4.4.1 Federal
• Wildfire Disaster Funding Fix – This was included in the 2018 Omnibus Spending Bill passed in April 2018 that was added by a bi-partisan coalition of Legislators. This “Fix” appropriates separate wildfire suppression funding that “allows the Forest Service to use disaster relief funds to fight wildfires instead of borrowing money from other parts of the agency’s budget
California BUF – Feedstock Supply Study Page 59

CHAPTER 5 – BIOMASS FEEDSTOCK COST
such as fire prevention” 35
35 Forest Service Says Disaster Funding Bill Will Help Fight Wildfires This Year | Jefferson Public Radio
and fuel reduction activities such as creation of fuel breaks, biomass thinning, dead tree removal, pre and post-harvest fuels treatments, and the use of prescribed fire. The 2018-19 appropriation is $1.394 billion/year with $500 million in additional reserves. The wildfire disaster fund is increased to $2.19 billion in 2020 escalating to $2.95 billion in 2027.
• Other New Federal Forest Management Reforms – The 2018 Omnibus Spending Bill also adds a new 3,000 acre Categorical Exclusion (CE) (a shortened NEPA process) for forest fuels reduction projects, a shortened NEPA process for construction of Fuel Breaks and Fire Breaks, and 20-year Stewardship Contracting Authority for the Forest Service and BLM (previously limited to 10 years). Tuolumne County has expressed great interest in taking advantage of this by extending their 10-year Master Stewardship Agreement with the Stanislaus NF to 20 years.
• Forest Service Budget Outlook – Nationally, US Forest Service budgets for forest management and hazardous fuels treatment have been in decline and are projected to continue to lower even more over the next 5 years. To make matters more challenging, the workforce in California’s Region 5 is down by 36 percent. 36
36 Personal Conversation - Region 5 Forester Randy Moore – May 14, 2018
Recently, a multi-year Agency hiring freeze was lifted and the Stanislaus NF started advertising to fill some of the key vacant positions .37
37 Jason Kuiken, Forest Supervisor Stanislaus NF – 1/31/18 mtg with American Forest Resource Council
Future work is going to require that more be done with less resources. As a result, the Forest Service plans to expand the use of partnerships through the Master Stewardship Agreement process to plan and implement projects it has neither the budget nor staffing to accomplish on its own.
5.4.4.2 State
• Forest Carbon Plan – California adopted the Forest Carbon Plan (FCP) in May 2018. The FCP stresses the importance of managing CA’s 33 million acres of forestland to protect its ability to be a net carbon sink as well as provide abundant clean water, wildlife habitat, support for local economies, and many other benefits. The FCP also recognizes that CA’s forests are increasingly being lost to large catastrophic wildfires and mortality from drought and insects. As much as 15 million acres are ranked high priority for reducing threats to catastrophic wildfire. Proposed actions in the FCP include increasing the annual rate of forest restoration & fuels treatments on non-federal lands to 35,000 acres by 2020 and 60,000 acres by 2030, and increase the annual rate of forest reforestation, thinning, fuels reduction, and resiliency treatments to 500,000 acres (no specific date). The FCP emphasizes a variety of methods to establish more resilient forests, such as the use of mechanical thinning and fuels reduction, sustainable timber management, and the use of prescribed and managed fire. 38
38 http://www.fire.ca.gov/fcat/downloads/CaliforniaForestCarbonPlaFinal.pdf
California has budgeted $95 million in FY 2018-19 for funding prescribed fire crews, regional forest health initiatives, forest health block grants, and fuels reduction and restoration projects in State Parks.
California BUF – Feedstock Supply Study Page 60

CHAPTER 5 – BIOMASS FEEDSTOCK COST
• Governor’s Executive Order B-52-18 – Issued by Governor Brown on May 10, 2018, B-52-18 is an implementation order to State Agencies to carry out the proposed actions listed in the FCP, including ramping up the overall rate of forest treatments to 500,000 acres/year by 2023, accelerate forest restoration thinning and prescribed fire, streamline the timber harvest permitting process, provide education and financing for small forest landowners to encourage fuels reduction and forest health projects, and work with federal forest managers to cooperatively increase treatments on federal lands using the Good Neighbor Authority. 39
39 https://www.gov.ca.gov/wp-content/uploads/2018/05/5.10.18-Forest-EO.pdf
• California Climate Investments Forest Health Grant Program 40
40 http://www.fire.ca.gov/resource_mgt/resource_mgt_foresthealth_grants
- Funded by the Cap & Trade Program receipts revitalized under AB 398 and tied to the California Global Warming Solutions Act of 2006 (AB 32), CALFIRE offered an enhanced ($200 million) Forest Health Grant program in early 2018 awarding $171.5 million for Forest Health and Fire Prevention projects. Eligible activities for grant funding included fuel reduction and biomass utilization on large landscape-scale projects that provide net greenhouse gas (GHG) benefits. Up to $155 million will also be available through CALFIRE grant programs from FY 2018-2019 funding. As of the writing of this report, TC received a $5 million grant from this program to fund a variety of proposed projects on the Stanislaus NF, including ecological thinning, fuels reduction and biomass removal, prescribed fire and the collection of LiDAR flight data for the entire County under their Master Stewardship Agreement.
• Forest Management Task Force – The State has officially ended the State Tree Mortality Task Force, originally established to develop a coordinated approach to the Tree Mortality Emergency, and on June 11, 2018 launched the State Forest Management Task Force (FMTF) in its place. The multi-stakeholder FMTF will still monitor and coordinate state-wide tree mortality while focusing more on specific forest management efforts to carry out the Forest Carbon Plan, the State Strategic Fire Plan (currently being revised), and Executive Order B-52-18. Among other things the FMTF and various sub-groups will meet monthly to address increasing the pace and scale of thinning and fuels reduction, expanding markets for wood products, and forest landowner education 41
41 http://www.fire.ca.gov/treetaskforce/
.
• 2018 Strategic Fire Plan (SFP)42
42 http://cdfdata.fire.ca.gov/pub/fireplan/fpupload/fpppdf1614.pdf
– CALFIRE’s 2018 Strategic Fire Plan was revised and finalized during the preparation of this study. The SFP addresses wildfire prevention, public safety, and public education on the importance of forest fuel reduction activities. The SFP contains provisions that will move CA towards a more fire resilient natural environment achieved through local, state, federal, tribal, and private partnerships. Two SFP objectives that are important to the BUF include 1) providing increased support of land-owner initiated fuels reduction efforts, and 2) work to streamline regulatory or policy barriers that limit fuel reduction activities.
California BUF – Feedstock Supply Study Page 61

CHAPTER 5 – BIOMASS FEEDSTOCK COST
• Wildfire Preparedness and Response Conference Committee (WPRCC)43
43 https://www.gov.ca.gov/2018/07/02/governor-brown-and-legislative-leaders-issue-statement-on-formation-of-wildfire-preparedness-and-response-conference-committee/
and Senate Bill 901 – Governor Brown and the Legislative leadership coordinated formation of a bi-partisan WPRCC to make recommendations in SB 901 designed to address wildfire prevention, public safety, and make CA more resilient to future wildfire disasters. As of the writing of this report, SB 901 was approved by the Legislature and is on the Governor’s desk awaiting signature. This new law, contains a number of very positive provisions designed to help increase the amount fuel reduction and thinning treatments over the next 5 years, particularly on non-industrial forestlands and ensure that BioRAM bioenergy facilities like Chinese Station, remain operating through 2027. While it is too early to tell how the various State Agencies (CALFIRE, Sierra Nevada Conservancy, Resources Agency, Air Resources Board, Public Utilities Commission) will actually implement their funded and unfunded directives in SB 901, it appears that there could be an increase in production of inestimable amounts of biomass within the FSA, particularly during the initial vegetation reduction treatments along utility distribution lines.
5.4.4.3 Local
• TC Tree Mortality Program – Tuolumne County’s Board of Supervisors (TCBOS) has been very proactive on reducing tree and wildfire hazards, particularly since the 2013 Rim Fire, and was among the first of the Sierra foothill Counties to declare a State of Emergency for both Drought and the Tree Mortality. They established a County Tree Mortality Task Force (TMTF) patterned after the State TMTF, obtained OES assistance funding through the California Drought Assistance Act (CDAA) and launched a hazard tree removal program to protect County roads and infrastructure. The program included the establishment of a County Wood Sort Yard in Chinese Camp adjacent to the Pacific Ultrapower biomass plant where tree removal contractors and homeowners could dispose of logs from hazard tree removal projects. To date, TC has removed and disposed of over 5,000 trees in 45 tree removal projects and has 20 more tree removal projects planned for 2018. More than 70,000 tons of logs have been delivered to the wood yard since its inception and processed into biomass fuel and utilized by Pacific Ultrapower44
44 Report by Mike Albrecht, Tree Mortality Project Manager, at the July 12, 2018 Tuolumne County Tree Mortality Task Force mtg.
.
• Tuolumne County Master Stewardship Agreement (TCMSA) – The TCBOS, in conjunction with the local Forest Collaborative group Yosemite Stanislaus Solutions (YSS), entered into a 10-year Master Stewardship Agreement in January 2018 with the Forest Service to partner with the Stanislaus National Forest (SNF) in increasing the pace and scale of forest resiliency treatments on SNF lands within the County45
45 https://www.mymotherlode.com/news/local/343231/agreement-finalized-between-tuolumne-county-and-stanislaus-national-forest.html
. Under the MSA, the first proposed project is the NEPA-ready Looney Stewardship – approximately 1,000 acres of ecological thinning logging, biomass removal, and prescribed fire treatments on the MiWuk District based on the FS Publication GTR-22046
46 https://www.fs.fed.us/psw/publications/documents/psw_gtr220/psw_gtr220.pdf
. Under an MOA with TCBOS, YSS is charged with collaborative
California BUF – Feedstock Supply Study Page 62

CHAPTER 5 – BIOMASS FEEDSTOCK COST
development of all future MSA projects and recommending them to the TCBOS and STF. One of YSS’ goals is to support at least 5,000 acres/year of thinning treatments, 3,000 acres/year of prescribed fire, and 500 acres/year of restoration projects above and beyond what the STF would normally accomplish. TC, in cooperation with YSS, was recently awarded a $5 million grant from CALFIRE’s CCI Forest Health Program to fund implementation of future thinning, biomass removal, and prescribed fire projects. TCBOS have already expressed their desire to amend the TCMSA to a 20-year term so they can continue to help increase the pace and scale of returning the forest to a more resilient condition.
• Yosemite Stanislaus Solutions - While YSS is not a biomass-related public policy group per se, the 28-member collaborative group representing a broad cross-section of conservation, recreation, tribal, forest products, wildlife, Fire Management agencies, and other governmental interests helps shape and supports local forest projects which restore forest ecosystems to health and resiliency. Following the devastating 2013 Rim Fire, YSS coalesced into a highly motivated supporter of ecological forest thinning, biomass removal, restoration, and wildlife habitat improvement activities. YSS has successfully been awarded $2 million in grants to help restore the Rim Fire burn area, which includes removal of biomass to reduce fire hazards. They are also an active partner with Tuolumne County in identifying and collaboratively vetting future forest resiliency and restoration projects for the TCMSA. YSS is recognized throughout the State as a force that shapes and supports sound forest policies and activities.
• Amador-Calaveras Consensus Group (ACCG)47
47 http://acconsensus.org
– Similar to YSS, this community consensus group was formed in 2008 and is funded by appropriations under the Healthy Forests Landscape Restoration Act (HFLRA). ACCG’s mission statement states The Amador-Calaveras Consensus Group is a community-based organization that works to create fire-safe communities, healthy forests and watersheds, and sustainable local economies. ACCG actively supports forest resiliency and fuels reduction projects in the Study Area within Calaveras and Amador Counties. In particular, their Cornerstone CFLRP Project, proposes, among other things, to remove surface and ladder fuels; thin overstocked stands; thin plantations on 38,500 acres in Calaveras, Amador, El Dorado, and Alpine Counties. The most significant utilization opportunities include: biomass utilization for energy and heating, soil amendments, compost, landscaping chips, firewood, animal bedding, saw logs, designer fencing, agricultural and architectural posts and poles, furniture wood, wood pellets, and non-timber forest products. The project has received 10-year cost-share funding averaging $1.7 million/year from the FS.
CTB developed a 1-5 numeric scoring system to rate the relative influence, or “climate” created by each of the policies listed above to short and medium-term biomass availability and financial assistance over the next 10 years within the Study Area. Each policy was given a relative score in 3 categories – Short Term (1-5 year) Biomass Availability, Medium Term (5-10 year) Biomass Availability, and Funding Assistance. The results are presented in Table 5.9. The results reveal a favorable policy
California BUF – Feedstock Supply Study Page 63

CHAPTER 5 – BIOMASS FEEDSTOCK COST
climate for an increase in biomass availability over the next 10 years. The policy climate score declines somewhat in the medium term, largely because of the expiration of many of the provisions in the 2018 Farm Bill in 2023. The policy climate score for availability of funding assistance for biomass removal averages 3.67, which is still slightly on the favorable side of neutral. This highlights the historic dilemma in CA with forest biomass removal – many people and agencies see the need for reducing wildfire hazard and improving forest resiliency using biomass removal as one of the tools, but few government budgets offer sufficient funds to pay for the costs to get the biomass to market. This indicates the need for either 1) more government funding for biomass removal or 2) the creation of high value markets that can pay for the costs of cutting, processing, and removing the biomass from the forest.
California BUF – Feedstock Supply Study Page 64

CHAPTER 5 – BIOMASS FEEDSTOCK COST
Table 5.9 - Risks of Federal, State, and Local Policies to Forest Biomass Removal
Policy
Risk Category
Short Term
(1-5 year)
Biomass
Avalability
Long Term
(6-10 year)
Biomass
Availability
Funding
Assistance
Average
Score
Federal
Wildfire Disaster Funding Fix 4 4 3 3 .67
New Federal Forest Reforms
3,000 acre CE for Fuel Reduction 4 3 3 3 .33
Shortened NEPA process for Fuel Breaks 4 4 3 3 .67
20 year Stewardship Contract Authority 5 5 4
Forest Service Budget Outlook 2 1 1 1 .33
4.67
State
Forest Carbon Plan 4 4 4 4 .00
Governor's Executive Order B-52-18 4 4 3 3 .67
CCI Forest Health Grant Program 5 4 4 4 .33
Forest Management Task Force 4 4 3 3 .67
2018 Strategic Fire Plan 4 4 3 3 .67
Wildfire Preparedness and Response
Conference Committee (SB 901) 5 5 5 5 .00
Local
TC Tree Mortality Program 5 3 4 4 .00
Tuolumne County MSA 5 5 5 5 .00
Yosemite Stanislaus Solutions 5 4 5 4 .67
Amador Calaveras Consensus Group 5 4 5 4 .67
Average Score 4 .33 3.87 3.67 3.96
Key: Score Meaning
1 Very Unfavorable
2 Unfavorable
3 Neutral
4 Favorable
5 Very Favorable
California BUF – Feedstock Supply Study Page 65
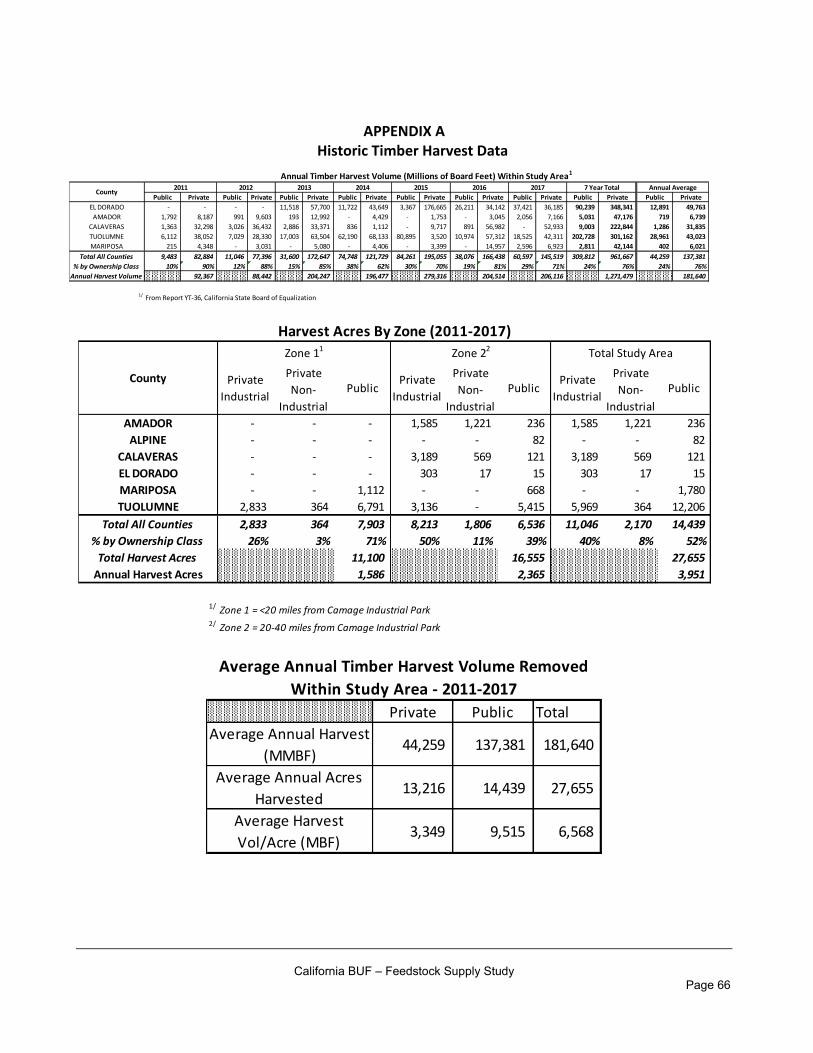
APPENDIX A Historic Timber Harvest Data
Annual Timber Harvest Volume (Millions of Board Feet) Within Study Area1
1/ From Report YT-36, California State Board of Equalization
County2011 2012 2013 2014 2015 2016 2017 7 Year Total Annual Average
Public Private Public Private Public Private Public Private Public Private Public Private Public Private Public Private Public Private
EL DORADO - - - - 11,518 5 7,700 11,722 4 3,649 3 ,367 176,665 26,211 3 4,142 37,421 3 6,185 90,239 348,341 12,891 49,763
AMADOR 1,792 8 ,187 991 9,603 193 1 2,992 - 4,429 - 1,753 - 3,045 2 ,056 7,166 5,031 4 7,176 719 6 ,739
CALAVERAS 1,363 32,298 3,026 36,432 2,886 3 3,371 836 1,112 - 9,717 891 56,982 - 5 2,933 9,003 222,844 1 ,286 31,835
TUOLUMNE 6,112 38,052 7,029 28,330 17,003 63,504 62,190 68,133 80,895 3,520 10,974 5 7,312 18,525 4 2,311 2 02,728 301,162 28,961 43,023
MARIPOSA 215 4 ,348 - 3,031 - 5,080 - 4,406 - 3,399 - 14,957 2 ,596 6,923 2,811 4 2,144 402 6 ,021
Total All Counties
% by Ownership Class
Annual Harvest Volume
9,483 82,884 11,046 77,396 31,600 172,647 74,748 121,729 84,261 195,055 38,076 166,438 60,597 145,519 309,812 961,667 44,259 137,381
10% 90% 12% 88% 15% 85% 38% 62% 30% 70% 19% 81% 29% 71% 24% 76% 24% 76%
92,367 88,442 204,247 196,477 279,316 204,514 206,116 1,271,479 181,640
Harvest Acres By Zone (2011-2017)
County
Zone 11
1/ Zone 1 = <20 miles from Camage Industrial Park
Zone 22
2/ Zone 2 = 20-40 miles from Camage Industrial Park
Total Study Area
Private
Industrial
Private
Non-
Industrial
PublicPrivate
Industrial
Private
Non-
Industrial
PublicPrivate
Industrial
Private
Non-
Industrial
Public
AMADOR - - - 1,585 1,221 236 1,585 1,221 236
ALPINE - - - - - 82 - - 82
CALAVERAS - - - 3,189 569 121 3,189 569 121
EL DORADO - - - 303 17 15 303 17 15
MARIPOSA - - 1,112 - - 668 - - 1,780
TUOLUMNE 2,833 364 6,791 3,136 - 5,415 5,969 364 12,206
Total All Counties 2,833 364 7,903 8,213 1,806 6,536 11,046 2,170 14,439
% by Ownership Class 26% 3% 71% 50% 11% 39% 40% 8% 52%
Total Harvest Acres 11,100 16,555 27,655
Annual Harvest Acres 1,586 2,365 3,951
Average Annual Timber Harvest Volume Removed
Within Study Area - 2011-2017
Private Public Total
Average Annual Harvest
(MMBF)44,259 137,381 181,640
Average Annual Acres
Harvested 13,216 14,439 27,655
Average Harvest
Vol/Acre (MBF)3,349 9,515 6,568
California BUF – Feedstock Supply Study Page 66

California BUF – Feedstock Supply Study Page 67

APPENDIX B Biomass Product Specifications
Below is a chart showing typical biomass raw material specifications by type of biomass facility within the FSA. Note that there are no currently operating small-scale pyrolysis facilities operating on forest-derived biomass within the FSA. This was included for comparison purposes only.
Facility TypeMaterial
Type
Max
Piece
Size (in)
Max %
fines
Max ash
content
(%)
Max
Moisture
Content
(%)
Max
Length
(feet)
Min
Length
(feet)
Min Dia
(in)
Max dia
(feet)Other Notes
Large-scale Bioenergy1
1/ Conventional biomass steam boiler with generally greater than 3 MW generating capacity
Biomass gasification facility with generally less than 5 MW generating capacity
Processed 3.5 10% 3% 60% NA NA NA NA Any Species
Large-scale Bioenergy Logs NA NA NA 60% 50 4 None None Any Species
Small-scale Pyrolisis2
2/
Processed 2 2% 2% 25% NA NA NA NA Any Species
Small-scale Pyrolisis Logs NA NA NA unknown 50 4 None None Any Species
Particleboard Plant Logs NA NA NA NA 50 4 None None Pine and fir only, no cedar
Wood Shavings Mill Logs NA NA NA NA 48 8 10 NonePine only, log lengths must be
8' multiplesLandscape Mfg Logs NA NA NA NA 50 8 None None Any Species
California BUF – Feedstock Supply Study Page 68