utilization of pentoses from sugarcane biomass: techno
TRANSCRIPT

Bioresource Technology 142 (2013) 390–399
Contents lists available at SciVerse ScienceDirect
Bioresource Technology
journal homepage: www.elsevier .com/locate /bior tech
Utilization of pentoses from sugarcane biomass: Techno-economicsof biogas vs. butanol production
0960-8524/$ - see front matter � 2013 Elsevier Ltd. All rights reserved.http://dx.doi.org/10.1016/j.biortech.2013.05.052
⇑ Corresponding author. Present address: Department of Chemical Engineering,École Polytechnique de Montréal C.P. 6079, Succ. Centre-Ville, Montreal, QC H3C3A7, Canada. Tel.: +1 514 340 4711x3424; fax: +1 514 340 5150.
E-mail addresses: [email protected], [email protected](A.P. Mariano).
Adriano Pinto Mariano a,⇑, Marina O.S. Dias b, Tassia L. Junqueira a,b, Marcelo P. Cunha b,Antonio Bonomi a,b, Rubens Maciel Filho a,b
a Laboratory of Optimization, Design and Advanced Control (LOPCA), School of Chemical Engineering – University of Campinas (UNICAMP), Av. Albert Einstein 500, CEP13083-852 Campinas, SP, Brazilb Laboratório Nacional de Ciência e Tecnologia do Bioetanol – CTBE/CNPEM, Caixa Postal 6170, CEP 13083-970 Campinas, SP, Brazil
h i g h l i g h t s
� Greenfield projects of a second-generation sugarcane biorefinery were evaluated.� Pentoses from sugarcane biomass were used either for biogas or n-butanol production.� Production of n-butanol and acetone led to increased and diversified revenues.� Energy efficiency of the butanol plant affected power and ethanol production.� Energy reduction in the butanol plant enhanced the profitability of the biorefinery.
a r t i c l e i n f o
Article history:Received 9 April 2013Received in revised form 14 May 2013Accepted 15 May 2013Available online 23 May 2013
Keywords:BiorefinerySugarcanePentosesBiogasButanol
a b s t r a c t
This paper presents the techno-economics of greenfield projects of an integrated first and second-gener-ation sugarcane biorefinery in which pentose sugars obtained from sugarcane biomass are used either forbiogas (consumed internally in the power boiler) or n-butanol production via the ABE batch fermentationprocess. The complete sugarcane biorefinery was simulated using Aspen Plus�. Although the pentosesstream available in the sugarcane biorefinery gives room for a relatively small biobutanol plant (7.1–12 thousand tonnes per year), the introduction of butanol and acetone to the product portfolio of thebiorefinery increased and diversified its revenues. Whereas the IRR of the investment on a biorefinerywith biogas production is 11.3%, IRR varied between 13.1% and 15.2% in the butanol production option,depending on technology (regular or engineered microorganism with improved butanol yield and pen-toses conversion) and target market (chemicals or automotive fuels). Additional discussions includethe effects of energy-efficient technologies for butanol processing on the profitability of the biorefinery.
� 2013 Elsevier Ltd. All rights reserved.
1. Introduction
In Brazil, the great majority of the current annual bioethanolproduction of about 25 billion liters is based on the fermentationof sugars (glucose + fructose) obtained from the sugarcane juicein mills called first-generation (1G) biorefineries. Basically, thereare two biorefinery models, namely annexed plants and autono-mous distilleries. In the former, sugars from the sugarcane juiceare converted to ethanol and food-grade sugar, and the sugarcanebagasse is burnt to generate steam and power. This model accountsfor approximately 70% of the Brazilian sugarcane biorefineries
(Cavalett et al., 2012). In the latter, on the other hand, sugar isnot produced. In both cases, if efficient high-pressure boilers(65–90 bar) are employed in the cogeneration system, surpluselectricity can be sold to the power grid. Still valid for both models,the concept of second-generation (2G) biorefineries is defined bythe utilization of fermentable sugars extracted from the lignocellu-losic portion of the sugarcane plant, such as the bagasse, in order toproduce ethanol.
The integration of second-generation units with conventionalfirst-generation biorefineries, in contrast to stand-alone second-generation units, has the potential to offer significant economicadvantages since important operations (concentration, fermenta-tion, distillation and cogeneration) and feedstock (sugarcane ba-gasse is already available at plant site) may be shared betweenboth plants (Dias et al., 2012). Furthermore, extending to the tech-nical side, the effects on fermentation yields of inhibitors gener-

A.P. Mariano et al. / Bioresource Technology 142 (2013) 390–399 391
ated during biomass pretreatment can be minimized, if not elimi-nated, by mixing the hydrolyzed liquor with sugarcane juice. How-ever, an important fraction (�25%) of the sugars available in thebagasse, the pentose sugars, cannot be fermented by the yeast Sac-charomyces cerevisiae employed in sugarcane biorefineries.Although engineered microorganisms able to ferment pentoses toethanol have been developed, to date none of them could outper-form the high fermentation yield and productivity achieved withS. cerevisiae (Chandel et al., 2011). In face of this limitation, the bio-digestion of the pentose sugars for the production of biogas is aninteresting solution to increase ethanol production (Rabelo et al.,2011). The logic is straightforward. Since bagasse is used to pro-duce steam and power, the amount of bagasse available as feed-stock for ethanol production depends on the thermal energyconsumption of the biorefinery. By supplementing the cogenera-tion system with biogas, this additional source of energy increasesthe availability of bagasse for ethanol production.
Alternatively, pentose sugars could be used for the productionof added-value chemicals or advanced biofuels, resulting in in-creased revenues. Particularly, n-butanol, hereafter simply butanol,has attracted the attention of investors due to its potential use as adrop-in biofuel and demand by the chemical market. The opportu-nities around butanol, as phrased by Mascal (2012), are extraordi-narily diverse, and have a real potential to permanently impact therenewable energy and materials landscape. Moreover, in the bior-efinery context, butanol production from pentose sugar rich hemi-cellulose streams resulting from agricultural and wood processingplants is an attractive option given the broad substrate ranges ofsolventogenic clostridia, including pentose sugars (Green, 2011).For example, from the fractionation of corn stover, the Chinesecompany Jilin Songyuan Laihe Chemicals is producing celluloseas raw material for paper, polyether polyol and phenolic resinsfrom lignin, and butanol from the hemicellulose fraction (http://www.laihe.net/en.aspx).
Nevertheless, a technical aspect related to fermentation pro-cesses in general, and markedly present in the butanol processing,may have an important effect on the availability of biomass for eth-anol production. The fermentation to produce butanol is character-istically much diluted and, consequently, steam-consumingoperations such as sterilization of the sugar solution and down-stream product recovery (distillation) are energy-intensive (Vane,2008; Mariano and Maciel Filho, 2012). In this manner, by optingto use the pentoses stream for butanol production, the 2G ethanolproduction is expected to decrease due to (i) increased thermal en-ergy consumption in the biorefinery, and (ii) absence of the addi-tional biogas energy stream. In face of these technical aspects,critical questions must be addressed in order to evaluate the eco-nomics of the two competing options for pentoses utilization con-sidered in this study. Would the selling of additional products,butanol and the by-product acetone, bring economic advantagesdespite the reduction in second-generation ethanol production?What is the effect of the butanol plant on the excess power gener-ated by the biorefinery? And perhaps most importantly, given thata great deal of effort has been put into developing energy-efficienttechnologies for butanol processing, how much would a reductionin steam consumption in the butanol plant affect the profitabilityof the biorefinery? To answer these questions, this paper presentsa technical and economic assessment of greenfield projects of anintegrated first and second-generation sugarcane biorefinery (an-nexed plant model) in which pentose sugars obtained from sugar-cane biomass are used either for biogas or butanol production. Thebiorefinery concepts were assessed with regard to important tech-nical performance parameters, such as biomass utilization break-down (cogeneration and ethanol production), products output,steam and power consumption, and wastewater footprint. Revenuediversification, steam consumption in the butanol plant, and tech-
nology advances in butanol processing guided the discussions ofthe economic analysis.
2. Methods
2.1. Process description
In the base case scenario, the second-generation ethanol pro-duction is integrated to an annexed plant with a processing capac-ity of 503 tonnes of sugarcane stalks (TC) per hour in 167 days peryear (�2 million tonnes of sugarcane/year). After cleaning andcrushing the stalks, 122 kg of bagasse in dry basis are producedper TC (lower heating value – LHV of bagasse with 50 wt.% mois-ture content is 7.5 MJ/kg). Additionally, 50% of the sugarcane straw(tops and leaves) produced in the field is transported to the biore-finery, i.e. 68 dry kg/TC (LHV of straw with 15 wt.% moisture con-tent is 15.1 MJ/kg). Five percent of the bagasse is stockpiled forboiler start-ups. In this manner, 92 dry tonnes of biomass per hour(63% bagasse; 37% straw) are available for the biorefinery. In drybasis, the contents of cellulose, hemicellulose, and lignin in the bio-mass are 47, 28, 25 wt.%, respectively (Dias et al., 2011a, 2012).
The juice extracted from the sugarcane stalks (133 kg sucrose/TC + 6 kg reducing sugars/TC) is split into two equal streams usedfor the production of sugar and anhydrous ethanol (99.5 wt.%).Molasses (16 kg sucrose/TC + 3 kg reducing sugars/TC), the concen-trated residual solution obtained after sugar crystallization, is alsoused for ethanol production. Steam (12, 6, 2.5 bar) and power areobtained from the combustion of sugarcane bagasse and sugarcanestraw in the cogeneration system. In accordance with the currenttrend for new plants in Brazil, the cogeneration system of the bior-efinery has a 90-bar boiler (86% thermal efficiency in LHV basis)integrated with back pressure turbines. This boiler is more efficientthan the traditional 22-bar boilers (75% thermal efficiency) and al-lows for an excess of power, which is sold to the grid. The amountof bagasse and straw sent for cogeneration is determined by thesteam consumption of the biorefinery. Thus, lower steam demandin the production processes leads to higher amounts of bagasse andstraw available for second-generation ethanol production. Surplusbagasse and straw are converted into fermentable sugars throughpretreatment (steam explosion, 12-bar steam, 190 �C, 15 min)and enzymatic hydrolysis. By steam exploding the biomass, partof the hemicellulose is converted into pentoses and, simulta-neously, cellulose becomes available to enzymatic hydrolysis(Martín et al., 2002). In this operation, hemicellulose and cellulosehydrolysis yields are, respectively, 70% and 2%. In the enzymatichydrolysis step, it was assumed a hydrolysis yield of 60% and solidsloading of 10 wt.% according to the current technology for lignocel-lulosic ethanol production (Dias et al., 2011b). The hexose fractionobtained in the hydrolysis is mixed with sugarcane juice and, afterconcentration in multiple effect evaporators, fermented to ethanol.The pentose fraction is anaerobically digested to produce biogas,which is burnt in the cogeneration system. Unreacted solids ob-tained after filtration of the hydrolysis products are also used asfuel in the boiler, along with straw and bagasse. For the differentfuels, boiler efficiency was assumed to be 86%. In the competingscenario, the same design is considered, however, the pentose frac-tion is sent to a butanol plant integrated to the biorefinery. Thisplant produces butanol along with the by-products acetone andhydrous ethanol (85 wt.%). A block flow diagram with the majorprocessing steps and products of the biorefinery, along with thealternative uses for pentoses, is shown in Fig. 1.
Process parameters for the ethanol, sugar and cogenerationplants are representative of Brazilian industrial large scale plants(over 1 million L of ethanol per day) and were obtained from theliterature (Ensinas et al., 2007; Macedo et al., 2008) and interviews

Fig. 1. Schematic diagram of an integrated 1G–2G sugarcane biorefinery with sugar, power, and ethanol production (ethanol from sugarcane juice and hexoses from bagasse).Alternatives for pentoses use: (1) biodigestion of pentoses – resulting biogas is used for power and steam generation; (2) fermentation of pentoses for production of butanol,and the by-products acetone and hydrous ethanol.
392 A.P. Mariano et al. / Bioresource Technology 142 (2013) 390–399
with specialists. Since there is no industrial-scale 2G ethanol plantcurrently in Brazil, parameters for biomass pretreatment and enzy-matic hydrolysis were obtained from the literature (Leibbrandtet al., 2011; Ojeda et al., 2011) and information from specialists.It should be noted that the integrated 1G-2G production processconsiders the fermentation of mixed sugarcane juice and hydro-lyzed glucose liquor. Possible impacts on fermentation yields dueto the presence of potential inhibitors generated during pretreat-ment reactions were not considered given that their concentrationon the fermentation media would be very low. Thus, the same con-version that is observed nowadays in first generation ethanolindustrial plants (conversion of 90% of the C6 sugars to ethanol)was assumed. Ethanol is dehydrated in molecular sieves, and elec-tric drives are employed in the sugarcane preparation and juiceextraction systems. Additionally, it was assumed a 20% reductionon process steam (2.5 bar) consumption in the ethanol and sugarplants, which may be achieved by means of process integration(Dias et al., 2011a). Further details on the ethanol, sugar, andcogeneration processes may be found in previous studies (Diaset al., 2011b, 2012; Cavalett et al., 2012; CTBE, 2012).
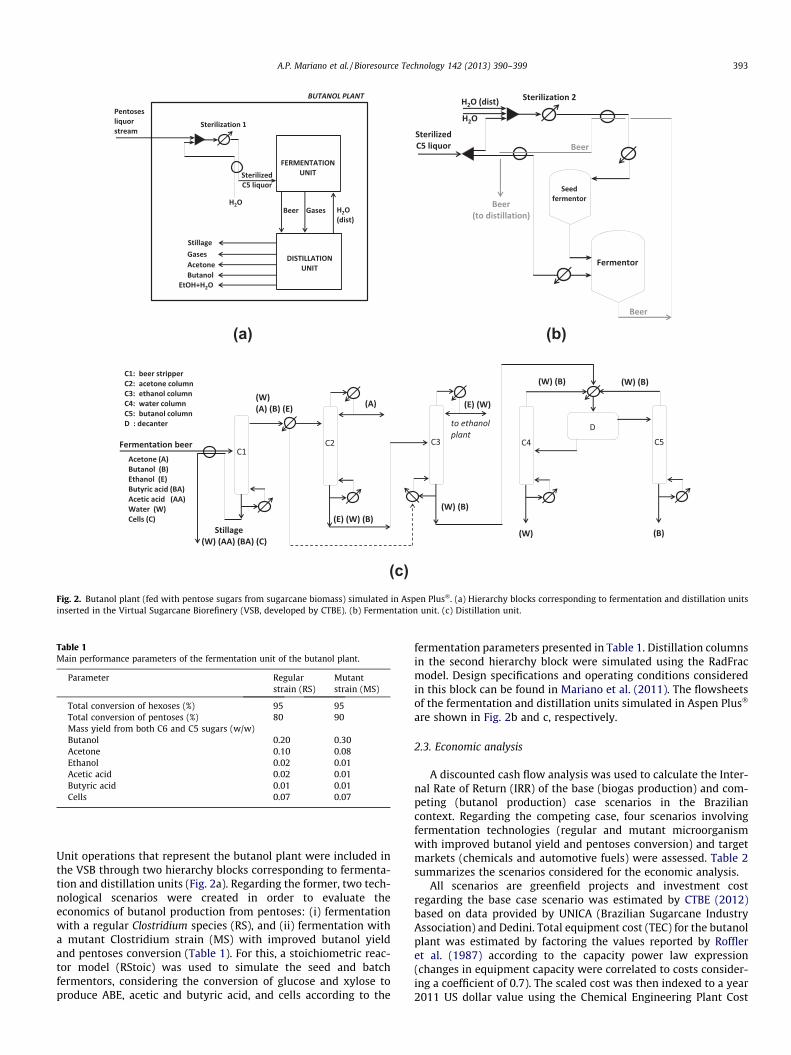
The pentoses liquor stream contains 142 g sugars/L (4.5% glu-cose; 10.9% sucrose – resulting from inefficiencies in the extractionof juice from the bagasse; 84.6% xylose). In the base-case scenario,the COD removal efficiency in the biodigestion reactor is 70%. Thisassumption is based on values obtained in the sugarcane industryfor vinasse (stillage) biodigestion, according to a personal commu-nication with Dedini, a Brazilian company who manufacturesequipment for sugarcane biorefineries. Biodigestion is conductedat 55 �C, yielding 0.35 Nm3 biogas per kg of reducing sugars. TheLHV of biogas is 21.3 MJ/Nm3. In the competing scenario, the pen-toses liquor stream is diluted to 50–60 g/L sugars (Fig. 2a) becausebutanol inhibition prevents the use of more concentrated sugarsolutions (Roffler et al., 1987). The diluted feed stream is continu-ously sterilized (100 �C) and sent to fermentation unit (Fig. 2b). Thefermentation process using solventogenic Clostridium cells con-sists of a continuous cell production stage (seed fermentors) anda second batchwise fermentation stage where acetone, butanol,ethanol (ABE) are produced (Afschar et al., 1990). As such, the pen-toses liquor stream is split in two streams (volume ratio 1.4:10)
and the smaller is fed to the seed fermentors after being dilutedto 20 g/L and sterilized at 130 �C (2.5-bar steam). The batch fer-mentors are operated at 32 �C on a staggered schedule and inocu-lated with actively growing cells. Main performance parameters ofthe fermentation stage are presented in Table 1 according to a reg-ular and a mutant microorganism with improved butanol yield andpentoses conversion. These parameters are based on experimentaldata obtained from different studies on the fermentation of hydrol-ysates of different biomass feedstocks to ABE (Yu et al., 1984; Way-man and Yu, 1985; Marchal et al., 1986; Ezeji et al., 2007; Ezeji andBlaschek, 2008; Qureshi et al., 2010; Liu et al., 2010).
The separation of the fermentation products (ABE) is conductedin a series of five continuous distillation columns (2.5-bar steam),with the last two responsible for the separation of butanol fromwater (Fig. 2c) (Roffler et al., 1987). The water stream is recycledto the fermentation unit for dilution of the C5 stream, and the hy-drous ethanol stream is dehydrated in the distillation unit of theethanol plant. The stillage (vinasse) from both ethanol and butanolplants are combined and, without any previous treatment, used forthe irrigation of sugarcane fields. A detailed description of the dis-tillation unit can be found in Mariano et al. (2011).
2.2. Process simulation
The integrated 1G-2G sugarcane biorefinery, as depicted inFig. 1, was simulated in Aspen Plus� (Aspentech, v. 7.1). The simu-lation of the ethanol (1G and 2G) and sugar plants, the co-genera-tion system, and the biodigestion unit was developed previouslyand is part of the Virtual Sugarcane Biorefinery (VSB) created bythe Technological Assessment Program of the Brazilian BioethanolScience and Technology Laboratory (CTBE). A comprehensivedescription of the parameters adopted in the construction of theVSB can be found in CTBE (2012) and Dias et al. (2011a).
The Aspen Plus model of the butanol plant (fermentation anddistillation units) was developed in this work based on labora-tory-scale experiments (Yu et al., 1984; Wayman and Yu, 1985;Marchal et al., 1986; Ezeji et al., 2007; Ezeji and Blaschek, 2008;Qureshi et al., 2010; Liu et al., 2010) and process configurations re-ported in the literature (Roffler et al., 1987; Afschar et al., 1990).
(a) (b)
(c)Fig. 2. Butanol plant (fed with pentose sugars from sugarcane biomass) simulated in Aspen Plus�. (a) Hierarchy blocks corresponding to fermentation and distillation unitsinserted in the Virtual Sugarcane Biorefinery (VSB, developed by CTBE). (b) Fermentation unit. (c) Distillation unit.
Table 1Main performance parameters of the fermentation unit of the butanol plant.
Parameter Regularstrain (RS)
Mutantstrain (MS)
Total conversion of hexoses (%) 95 95Total conversion of pentoses (%) 80 90Mass yield from both C6 and C5 sugars (w/w)Butanol 0.20 0.30Acetone 0.10 0.08Ethanol 0.02 0.01Acetic acid 0.02 0.01Butyric acid 0.01 0.01Cells 0.07 0.07
A.P. Mariano et al. / Bioresource Technology 142 (2013) 390–399 393
Unit operations that represent the butanol plant were included inthe VSB through two hierarchy blocks corresponding to fermenta-tion and distillation units (Fig. 2a). Regarding the former, two tech-nological scenarios were created in order to evaluate theeconomics of butanol production from pentoses: (i) fermentationwith a regular Clostridium species (RS), and (ii) fermentation witha mutant Clostridium strain (MS) with improved butanol yieldand pentoses conversion (Table 1). For this, a stoichiometric reac-tor model (RStoic) was used to simulate the seed and batchfermentors, considering the conversion of glucose and xylose toproduce ABE, acetic and butyric acid, and cells according to the
fermentation parameters presented in Table 1. Distillation columnsin the second hierarchy block were simulated using the RadFracmodel. Design specifications and operating conditions consideredin this block can be found in Mariano et al. (2011). The flowsheetsof the fermentation and distillation units simulated in Aspen Plus�
are shown in Fig. 2b and c, respectively.
2.3. Economic analysis
A discounted cash flow analysis was used to calculate the Inter-nal Rate of Return (IRR) of the base (biogas production) and com-peting (butanol production) case scenarios in the Braziliancontext. Regarding the competing case, four scenarios involvingfermentation technologies (regular and mutant microorganismwith improved butanol yield and pentoses conversion) and targetmarkets (chemicals and automotive fuels) were assessed. Table 2summarizes the scenarios considered for the economic analysis.
All scenarios are greenfield projects and investment costregarding the base case scenario was estimated by CTBE (2012)based on data provided by UNICA (Brazilian Sugarcane IndustryAssociation) and Dedini. Total equipment cost (TEC) for the butanolplant was estimated by factoring the values reported by Roffleret al. (1987) according to the capacity power law expression(changes in equipment capacity were correlated to costs consider-ing a coefficient of 0.7). The scaled cost was then indexed to a year2011 US dollar value using the Chemical Engineering Plant Cost
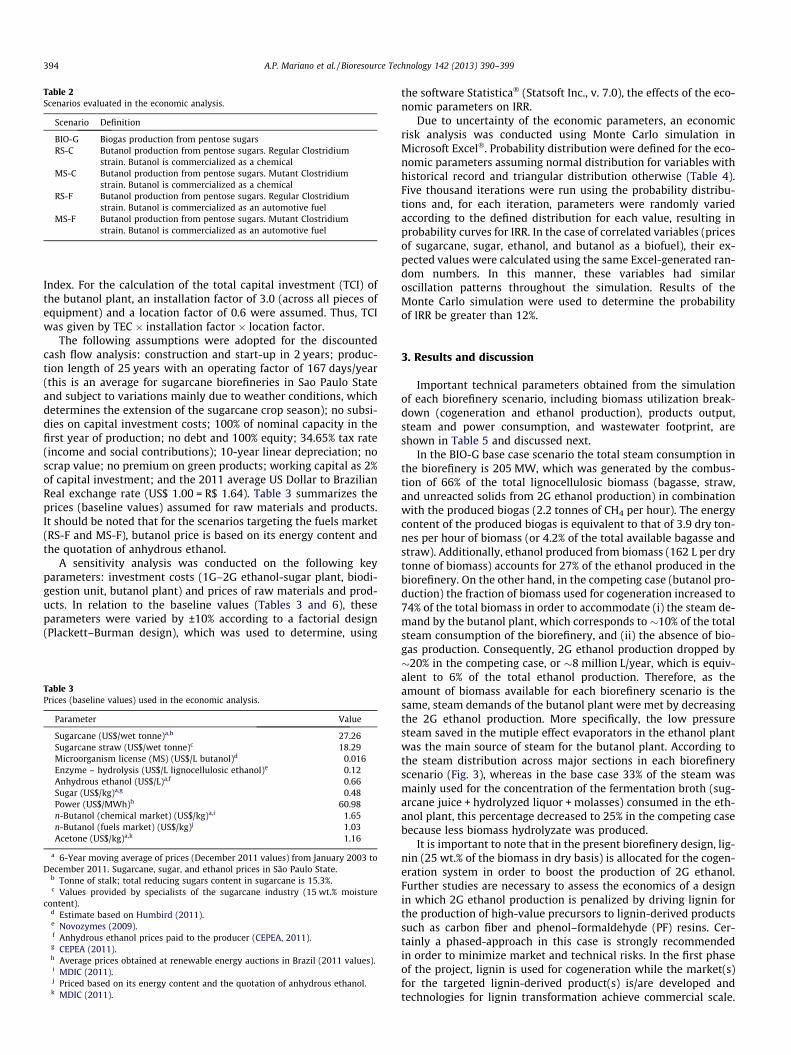
Table 2Scenarios evaluated in the economic analysis.
Scenario Definition
BIO-G Biogas production from pentose sugarsRS-C Butanol production from pentose sugars. Regular Clostridium
strain. Butanol is commercialized as a chemicalMS-C Butanol production from pentose sugars. Mutant Clostridium
strain. Butanol is commercialized as a chemicalRS-F Butanol production from pentose sugars. Regular Clostridium
strain. Butanol is commercialized as an automotive fuelMS-F Butanol production from pentose sugars. Mutant Clostridium
strain. Butanol is commercialized as an automotive fuel
394 A.P. Mariano et al. / Bioresource Technology 142 (2013) 390–399
Index. For the calculation of the total capital investment (TCI) ofthe butanol plant, an installation factor of 3.0 (across all pieces ofequipment) and a location factor of 0.6 were assumed. Thus, TCIwas given by TEC � installation factor � location factor.
The following assumptions were adopted for the discountedcash flow analysis: construction and start-up in 2 years; produc-tion length of 25 years with an operating factor of 167 days/year(this is an average for sugarcane biorefineries in Sao Paulo Stateand subject to variations mainly due to weather conditions, whichdetermines the extension of the sugarcane crop season); no subsi-dies on capital investment costs; 100% of nominal capacity in thefirst year of production; no debt and 100% equity; 34.65% tax rate(income and social contributions); 10-year linear depreciation; noscrap value; no premium on green products; working capital as 2%of capital investment; and the 2011 average US Dollar to BrazilianReal exchange rate (US$ 1.00 = R$ 1.64). Table 3 summarizes theprices (baseline values) assumed for raw materials and products.It should be noted that for the scenarios targeting the fuels market(RS-F and MS-F), butanol price is based on its energy content andthe quotation of anhydrous ethanol.
A sensitivity analysis was conducted on the following keyparameters: investment costs (1G–2G ethanol-sugar plant, biodi-gestion unit, butanol plant) and prices of raw materials and prod-ucts. In relation to the baseline values (Tables 3 and 6), theseparameters were varied by ±10% according to a factorial design(Plackett–Burman design), which was used to determine, using
Table 3Prices (baseline values) used in the economic analysis.
Parameter Value
Sugarcane (US$/wet tonne)a,b 27.26Sugarcane straw (US$/wet tonne)c 18.29Microorganism license (MS) (US$/L butanol)d 0.016Enzyme – hydrolysis (US$/L lignocellulosic ethanol)e 0.12Anhydrous ethanol (US$/L)a,f 0.66Sugar (US$/kg)a,g 0.48Power (US$/MWh)h 60.98n-Butanol (chemical market) (US$/kg)a,i 1.65n-Butanol (fuels market) (US$/kg)j 1.03Acetone (US$/kg)a,k 1.16
a 6-Year moving average of prices (December 2011 values) from January 2003 toDecember 2011. Sugarcane, sugar, and ethanol prices in São Paulo State.
b Tonne of stalk; total reducing sugars content in sugarcane is 15.3%.c Values provided by specialists of the sugarcane industry (15 wt.% moisture
content).d Estimate based on Humbird (2011).e Novozymes (2009).f Anhydrous ethanol prices paid to the producer (CEPEA, 2011).g CEPEA (2011).h Average prices obtained at renewable energy auctions in Brazil (2011 values).i MDIC (2011).j Priced based on its energy content and the quotation of anhydrous ethanol.k MDIC (2011).
the software Statistica� (Statsoft Inc., v. 7.0), the effects of the eco-nomic parameters on IRR.
Due to uncertainty of the economic parameters, an economicrisk analysis was conducted using Monte Carlo simulation inMicrosoft Excel�. Probability distribution were defined for the eco-nomic parameters assuming normal distribution for variables withhistorical record and triangular distribution otherwise (Table 4).Five thousand iterations were run using the probability distribu-tions and, for each iteration, parameters were randomly variedaccording to the defined distribution for each value, resulting inprobability curves for IRR. In the case of correlated variables (pricesof sugarcane, sugar, ethanol, and butanol as a biofuel), their ex-pected values were calculated using the same Excel-generated ran-dom numbers. In this manner, these variables had similaroscillation patterns throughout the simulation. Results of theMonte Carlo simulation were used to determine the probabilityof IRR be greater than 12%.
3. Results and discussion
Important technical parameters obtained from the simulationof each biorefinery scenario, including biomass utilization break-down (cogeneration and ethanol production), products output,steam and power consumption, and wastewater footprint, areshown in Table 5 and discussed next.
In the BIO-G base case scenario the total steam consumption inthe biorefinery is 205 MW, which was generated by the combus-tion of 66% of the total lignocellulosic biomass (bagasse, straw,and unreacted solids from 2G ethanol production) in combinationwith the produced biogas (2.2 tonnes of CH4 per hour). The energycontent of the produced biogas is equivalent to that of 3.9 dry ton-nes per hour of biomass (or 4.2% of the total available bagasse andstraw). Additionally, ethanol produced from biomass (162 L per drytonne of biomass) accounts for 27% of the ethanol produced in thebiorefinery. On the other hand, in the competing case (butanol pro-duction) the fraction of biomass used for cogeneration increased to74% of the total biomass in order to accommodate (i) the steam de-mand by the butanol plant, which corresponds to �10% of the totalsteam consumption of the biorefinery, and (ii) the absence of bio-gas production. Consequently, 2G ethanol production dropped by�20% in the competing case, or �8 million L/year, which is equiv-alent to 6% of the total ethanol production. Therefore, as theamount of biomass available for each biorefinery scenario is thesame, steam demands of the butanol plant were met by decreasingthe 2G ethanol production. More specifically, the low pressuresteam saved in the mutiple effect evaporators in the ethanol plantwas the main source of steam for the butanol plant. According tothe steam distribution across major sections in each biorefineryscenario (Fig. 3), whereas in the base case 33% of the steam wasmainly used for the concentration of the fermentation broth (sug-arcane juice + hydrolyzed liquor + molasses) consumed in the eth-anol plant, this percentage decreased to 25% in the competing casebecause less biomass hydrolyzate was produced.
It is important to note that in the present biorefinery design, lig-nin (25 wt.% of the biomass in dry basis) is allocated for the cogen-eration system in order to boost the production of 2G ethanol.Further studies are necessary to assess the economics of a designin which 2G ethanol production is penalized by driving lignin forthe production of high-value precursors to lignin-derived productssuch as carbon fiber and phenol–formaldehyde (PF) resins. Cer-tainly a phased-approach in this case is strongly recommendedin order to minimize market and technical risks. In the first phaseof the project, lignin is used for cogeneration while the market(s)for the targeted lignin-derived product(s) is/are developed andtechnologies for lignin transformation achieve commercial scale.

Table 4Input parameters for Monte Carlo simulation.
Economic parametera Distributionfunction
Most probableb Standarddeviation
Min. Max.
Ethanol price Normal (3r) US$0.66/L US$0.02/L – –Sugar price Normal (3r) US$0.48/kg US$0.04/kg – –Sugarcane price Normal (3r) US$27.26/tonne US$0.45/tonne – –n-Butanol (chemical) price Normal (3r) US$1.65/kg US$0.02/kg – –n-Butanol (biofuel) price Normal (3r) US$1.03/kg US$0.02/kg – –Enzyme pricec Triangular US$0.12/L 2G-
EtOH– �50% +100%
Power price Triangular US$60.98/MWh – �10% +10%Capital investment in the 1G–2G ethanol–sugar plant (for scenarios with butanol
production)Triangular 377 MUS$ – �25% +25%
Capital investment in the 1G–2G ethanol–sugar plant (for scenarios with biogasproduction)
Triangular 391 MUS$ – �25% +25%
Capital investment in the biodigestion unit Triangular 10 MUS$ – �25% +25%Capital investment in the butanol plant Triangular 20 MUS$ – �25% +25%
a Economic parameters with important effect on IRR, according to sensitivity analysis.b For normal distribution, most probable value is the 6-year moving average of prices (December 2011 values) from January 2003 to December 2011.c Price range based on Novozymes (2009).
A.P. Mariano et al. / Bioresource Technology 142 (2013) 390–399 395
In the second phase, the corresponding investment on the ligninplant would take place.
Interestingly, the introduction of the butanol plant had noimportant effect on the amount of power generated, consumed,and the balance sold to the grid. Power is mainly consumed bythe series of roller mills that crush the sugarcane, and since theamount of sugarcane processed is the same in both base and com-peting cases, changes in power consumption were not expected.On the other hand, power generation was unexpectedly the samein both cases. This can be explained due to the fact that the total
Table 5Main technical performance parameters of the biorefineries.
Parameter
Lignocellulosic biomass – for cogeneration (dry tonne/h)Lignocellulosic biomass – for ethanol production (dry tonne/h)Unreacted solids from 2G ethanol production – for cogeneration (dry tonne/h)Pentoses liquor (tonne sugars/h)Pentoses liquor stream (m3/h)Ethanol 1G (million L/y)Ethanol 2G (million L/y)Total ethanol (million L/y)a
Sugar (million tonne/y)n-Butanol (million L/y)Acetone (million L/y)Biogas (Nm3 CH4/h)Power generation (kWh/tonne sugarcane)Power consumption (kWh/tonne sugarcane)Power sold to the grid (kWh/tonne sugarcane)Steam consumption (MW) – biorefinerySteam consumption (MW) – ethanol plantSteam consumption (MW) – butanol plantSpecific energy (steam) consumption (MJ/kg ethanol) – ethanol plantSpecific energy (steam) consumption (MJ/kg butanol) – butanol plantEnergy – as automotive fuel products – generation by biorefinery (MW)b
Water consumption for dilution of the pentoses liquor (m3/h)c
Stillage (vinasse) from ethanol plant (m3/h)Stillage (vinasse) from biodigestion unit (m3/h)L stillage (vinasse)/L ethanol (ethanol plant) d
Stillage (vinasse) from butanol plant (m3/h)L stillage (vinasse)/L butanol (butanol plant)Total stillage generation by biorefinery (m3/h)Increase in stillage generation due to butanol plant (%)
a Includes ethanol produced in the butanol plant (million L/y): 0.91 (RS-C/RS-F) and 0b Ethanol plus butanol; respective LHV (MJ/kg): 27.0 and 33.4 (Pfromm et al., 2010).c Values do not include the water stream available from the distillation unit of the but
dilution.d Includes stillage from biodigestion unit in scenario BIO-G.
steam consumption as well as the consumption of each steam level(2.5, 6, 12 bar) were very similar in all cases (Fig. 3). This observa-tion sets the ground for an initial reflexion on the key questionraised in the Introduction section, i.e. how much would a reductionin steam consumption in the butanol plant affect power and etha-nol production and, consequently, the profitability of the biorefin-ery? Before answering this question, it is interesting to observethat the combination of the conventional batch fermentation withdownstream distillation makes butanol processing significantlymore energy-intensive (MJ/kg product) than ethanol processing.
Scenario
BIO-G RS-C/RS-F MS-C/MS-F
34.1 46.9 45.958.3 45.5 46.527.1 21.1 21.613.7 10.7 10.9110.8 86.3 88.3102.9 102.9 102.937.9 29.6 30.2140.8 133.4 133.6102 102 102– 8.8 14.8– 4.5 4.03045 – –124.5 124.5 124.034.0 34.0 34.090.5 90.5 90.0205 204 203151 128 129– 22 2020.8 18.8 18.9– 44.6 24.0208 212 224– 128 99375 353 356103 – –14 11 11– 214 180– 97 49478 567 536– 13 11
.50 (MS-C/MS-F).
anol plant (10.9 and 14.7 m3/h, respectively RS and MS), which is also employed for

Fig. 3. Steam consumption breakdown for each biorefinery scenario.
Fig. 4. Revenue breakdown for each biorefinery scenario.
396 A.P. Mariano et al. / Bioresource Technology 142 (2013) 390–399

A.P. Mariano et al. / Bioresource Technology 142 (2013) 390–399 397
Although the use of a mutant strain with improved butanol yieldcan result in important reduction of the specific steam consump-tion, the non-specific steam consumption (MW) barely changes(�20 MW distributed as 26% for sugar solution sterilization and74% for distillation) since it is related to the amount of water inthe sugar solution processed in the plant and the downstream sep-aration technology. As a result, a good number of research workhas been done on the development of fermentation technologiesthat would allow for fermentation of sugar streams without theneed of dilution, such as those that integrate product recovery tothe fermentor (Green, 2011; Mariano and Maciel Filho, 2012).Alternatively, or in combination, advanced energy-efficient down-stream separation technologies such as liquid–liquid extractioncan also bring significant steam saving (Vane, 2008; Kraemeret al., 2011). The effects of reducing steam consumption on theprofitability of the biorefinery project are presented following theeconomic analysis.
Another issue related to fermentation of diluted sugar streamsis the high wastewater footprint (L stillage/L product). While inthe ethanol plant, fermentors operate with an initial sugar concen-tration of 160 g/L and final ethanol titer of 80 g/L, in the butanolplant sugar concentration is 50–60 g/L and final butanol titer is9–17 g/L. As a result, the wastewater footprint in the butanol plantis 4–9 times greater, depending on the Clostridium strain used(regular or mutant). In the case of the fermentation with a regularstrain, 97 L of stillage were generated per each liter of butanol pro-duced. This impressive ratio is a critical element that supports thedevelopment of hyper-butanol producing strains and advanced fer-mentation technologies with integrated product recovery. Addi-tionally, as practiced in the past, part of the stillage (25–50%) canpotentially be recycled to the system without affecting the fermen-tation (Walton and Martin, 1979). However, this practice wasadopted in mills supplied with cornstarch and molasses and the
Table 6Investment and annual costs for biorefinery scenarios with processing capacity of two mi
Item Scenario
BIO-G
Investment costs (MUS$)1
Steam generation system 59Reception-extraction system 28Ethanol plant (1G) 29Ethanol plant (2G) 100Sugar plant 21Butanol plant –Biodigestion unit 10Turbines/power generators 24Other equipment 21Electromechanical assembly 16Civil works 30Electrical installations 18Instrumentation/automation 5Engineering services, thermal insulation and painting 23Power transmission lines (40 km) 12Heat exchange network 5Working capital 8
Total 409Annual costs (MUS$/y)b
Sugarcane 55.1Sugarcane straw 3.0Enzymes (hydrolysis) 5.5Microorganism license (mutant strain) –Other inputs 14.9Labor 3.5Tax over production (0.65%) 1.0Income Tax (34%) 10.7Total 94
a US$1.00 = R$ 1.64 (2011 average exchange rate).b First ten years of operation corresponding to the depreciation period.
effects of recycling stillage from fermentations of lignocellulosicfeedstocks are still unknown or not publically available. A compre-hensive list of fermentation technologies and expected wastewaterfootprint is presented in Mariano and Maciel Filho (2012).
The scale of the butanol plant was determined by the amount ofpentose sugars (11 tonne/h) resulting from the fractionation of46 dry tonnes per hour of biomass used for the production of 2Gethanol. With this amount of sugar, the plant with a regular strainhas a production capacity of 7.1 � 103 tonnes of butanol per yearand the fuels production (ethanol + butanol) in the biorefinery in-creases from 208 MW (base case) to 212 MW (Table 5). The useof a mutant strain with improved butanol yield resulted in an in-crease in butanol production of 69% or 4.9 � 103 tonnes/year (anincrease in gross income of MUS$ 8.1/year – chemical market orMUS$ 5.0/year – fuels market). Although these production capaci-ties can be considered relatively small in comparison to some ofthe biobutanol plants in China, whose capacities range from3 � 103 to 100 � 103 tonnes/year (Ni and Sun, 2009), the introduc-tion of butanol and acetone to the product portfolio of the biorefin-ery increased and diversified its revenues (Fig. 4). Most notably, therevenue contribution from ethanol decreased from 61% to �50%,giving room for the new products. This alteration improved therobustness of the biorefinery against expected market fluctuations,considered here through the Monte Carlo risk analysis and robust-ness measured by the probability of IRR be greater than a target va-lue of 12%. While the base case scenario has an IRR of 11.3% withprobability (P) of 0.26 to be greater than 12%, the scenario that con-siders a microorganism with improved butanol yield and targetsthe chemical market (MS-C) has an IRR of 15.2% and P equal to 1.Investment and annual costs are presented in Table 6. The otherscenarios with butanol production also have a profitability moreattractive than the base case, as indicated by the following results:RS-C (13.9% IRR, P = 0.95); RS-F (13.1% IRR, P = 0.80); and MS-F
llion tonnes of sugarcane per crop season.
RS-C RS-B MS-C MS-B
59 59 59 5928 28 28 2829 29 29 2986 86 86 8621 21 21 2120 20 20 20– – – –24 24 24 2421 21 21 2116 16 16 1630 30 30 3018 18 18 185 5 5 523 23 23 2312 12 12 125 5 5 58 8 8 8405 405 405 405
55.1 55.1 55.1 55.13.0 3.0 3.0 3.04.3 4.3 4.3 4.3– – 0.2 0.214.9 14.9 14.9 14.93.5 3.5 3.5 3.51.0 1.1 1.0 1.015.0 17.3 12.8 14.197 99 95 96

398 A.P. Mariano et al. / Bioresource Technology 142 (2013) 390–399
(13.9% IRR, P = 0.95). It is interesting to note that although the sell-ing price of butanol in the automotive fuels market is expected tobe significantly lower (�35%) than its current quotation in thechemical market, this alternative is still more attractive than pro-ducing biogas and enhance 2G ethanol production. The reader isreferred to Mariano et al. (2013) for additional insights into therisks associated with the chemical and fuels markets and withthe use of engineered microorganisms.
The sensitivity analysis performed by means of factorial design(Plackett–Burman design) estimated the effects of the economicparameters on the IRR of the biorefinery scenarios. Effects werecalculated considering a significance level of 95% and presentedin Pareto charts (Fig. 5). A negative effect means that there is a de-crease in IRR for every increase in the economic parameter and viceversa. An effect is considered statistically significant if its absolutevalue is greater than the value indicated by the vertical dotted linein the charts (P = 0.05). Due to similarity of results across the sce-narios with butanol production, only the scenario MS-C is pre-sented. For the base case scenario (BIO-G), the main economicparameters, in decreasing order of importance, were: ethanol price,sugarcane price, investment cost of the biorefinery without consid-ering the biodigestion unit, and sugar price. Prices of sugarcanestraw, power, hydrolytic enzyme, and investment cost of the biodi-gestion unit have no significant effect on IRR. In the competingcase, butanol price has an effect similar to power price, which isnow significant. As a result of the revenue diversification, ethanol
BIO-G (with biodigestion)
-1.59
-2.03
2.40
-2.43
15.3
-20.5
-20.6
27.8
p=.05
Standardized Effect Estimate (Absolute Value)
Enzyme price
Biodigestion invest.
Power price
Straw price
Sugar price
ES plant investment
Sugarcane price
Ethanol price
MS-C
-0.634
-0.794
0.823
-1.61
-1.95
4.86
6.68
13.9
-21.4
24.6
-25.5
p=.05
Standardized Effect Estimate (Absolute Value)
Straw price
Microorganism license
Acetone price
Enzyme price
ButOH plant investment
Power price
n-Butanol price
Sugar price
Sugarcane price
Ethanol price
ES plant investment
Fig. 5. Sensitivity analysis. Pareto charts of the effects of economic parameters onIRR for biorefinery scenarios BIO-G and MS-C. ES plant stands for the investment inthe biorefinery considering neither biodigestion unit nor butanol plant (ButOHplant).
price is no longer the most important economic parameter andits effect is closer to that of sugarcane price and investment costof the biorefinery without considering the butanol plant. Theinvestment cost of the butanol plant, acetone price, and microor-ganism license cost have no significant effect.
Returning to the question initially discussed during the energyanalysis of the biorefinery, it should be firstly noted that the steamconsumption in the butanol plant, mostly by the distillation unit, is1.3 (regular strain) and 0.7 (mutant strain) times the energy (LHV)found in the produced butanol. These numbers are relatively high,especially if compared to the ratio suggested by Vane (2008).According to this author, for an energy-efficient production of bio-fuels, the energy consumption at the process level should not ex-ceed 1/3 of the energy content of the product. Should this ratiobe attained in scenario RS-C, the steam consumption in the butanolplant would decrease from 22 to 5.5 MW. Since the steam con-sumption in the biorefinery determines the amount of biomassavailable for 2G ethanol production and, consequently, the amountof C5 sugars available for the butanol plant, for each MW saved theannual income of the biorefinery would increase by MUS$ 0.308,with the following breakdown: 0.170 – ethanol; (�)0.054 – power;0.142 – butanol; 0.050 – acetone. Thus, for a saving of 16.6 MW,the increase in income would be MUS$ 5.1/year, which is equiva-lent to 3% of the income of the biorefinery or 26% of the incomeof the butanol plant. Furthermore, if no additional capital was re-quired, which is very unlikely, IRR would change from 13.9% to14.7% (0.045%/MW). In more realistic terms, the capital investmentin the butanol plant could increase by up to 23 MUS$ before IRRwould start to be lower than the original 13.9%.
A reduction of 50–75% in steam consumption can potentially beachieved through the combination of heat integration projectswith advanced fermentation and energy-efficient downstreamtechnologies. However, besides the inherent risk related to thescale-up of new technologies, another important challenge inadopting advanced technologies is the fact that the bioethanolindustry and equipment suppliers heavily rely on the design andoperability of conventional fermentors in combination with down-stream distillation. In addition to this paradigm, the risk of enter-ing to a value chain different from that of the ethanol and sugarbusinesses is no less important. Therefore, the adoption of risk mit-igation strategies is crucial to the expansion of the product portfo-lio of sugarcane biorefineries and to turn the production ofchemicals from pentose sugars more attractive than the biogas op-tion, which has minimum technology risk and no market risk, sincebiogas replaces part of the biomass used for cogeneration. Efficientrisk mitigation strategies may include the project execution withan EPC (engineering, procurement, and construction) contractand negotiation of off-take agreements to secure sales.
In the competition between biogas and butanol production pro-posed in this work, butanol and the by-product acetone are ulti-mately competing against ethanol. The economic studiespresented here demonstrate that the choice for butanol is moreprofitable, even considering the lower margins of the automotivefuels market and the use of non-engineered microorganisms. Fur-thermore, in the sugarcane biorefinery context in Brazil, butanolproduction from a pentose stream resulting from the fractionationof bagasse and sugarcane straw can be considered a better optionthan the production from the sugarcane juice. In a previous study,Mariano et al. (2013) reported that the investment on a biorefinerythat uses 25%, 50%, and 25% of the sugarcane juice to produce,respectively, sugar, ethanol, and butanol, is more attractive thana 50:50 (ethanol:sugar) annexed plant only in the case butanol isproduced by an improved microorganism and traded as a chemical.The use of sugarcane juice for butanol production can be consid-ered a straight competition against sugar production, and this isa tough competition since the bull market in sugar prices in the last

A.P. Mariano et al. / Bioresource Technology 142 (2013) 390–399 399
five years has prompted producers to maximize sugar production(Cavalett et al., 2012). Nevertheless, independently of the sugarsource, the production of butanol or other chemicals in sugarcanebiorefineries certainly will expand the use of sugarcane. The tech-no-economic studies of these options are not only useful for theidentification and contextualization of technology bottlenecks,but also for supporting decision makers of an industrial sector thathas experienced an annual growth rate of 5% in the last 20 years,and according to this growth rate, 140 new greenfield projectsare expected to be implemented over the next decade (FernandoLandgraf, IPT, personal communication).
4. Conclusions
In the competition butanol versus biogas, the choice for butanolis more profitable even considering the lower margins of the auto-motive fuels market and the use of non-engineered microorgan-isms. The introduction of butanol and acetone to the productportfolio of the biorefinery led to increased and diversified reve-nues. Although a reduction of steam consumption in the butanolplant decreases the amount of excess power generated in the bior-efinery, the return on each MW saved is attractive owing to an in-crease in the amount of biomass available for ethanol productionand, consequently, the amount of sugar available for the butanolplant.
Acknowledgements
We thank Fundação de Amparo à Pesquisa do Estado de SãoPaulo (FAPESP) for the financial support (Contract grant number2007/00341-1 under the BIOEN Thematic project ‘‘An IntegratedProcess for Total Bioethanol Production and Zero CO2 Emission’’,Grant No. 08/57873-8).
References
Afschar, A.S., Vaz Rossell, C.E., Schaller, K., 1990. Bacterial conversion of molasses toacetone and butanol. Appl. Microbiol. Biotechnol. 34, 168–171.
Cavalett, O., Junqueira, T.L., Dias, M.O.S., Jesus, C.D.F., Mantelatto, P.E., Cunha, M.P.,Franco, H.C.J., Cardoso, T.F., Maciel Filho, R., Rossell, C.E.V., Bonomi, A., 2012.Environmental and economic assessment of sugarcane first generationbiorefineries in Brazil. Clean Technol. Environ. Policy 14, 399–410.
CEPEA – Center for Advanced Studies on Applied Economics, 2011. <http://www.cepea.esalq.usp.br> (retrieved 03.12.2011).
Chandel, A.K., Chandrasekhar, G., Radhika, K., Ravinder, R., Ravindra, P., 2011.Bioconversion of pentose sugars into ethanol: a review and future directions.Biotechnol. Mol. Biol. Rev. 6, 8–20.
CTBE – Brazilian Bioethanol Science and Technology Laboratory, 2012. The VirtualSugarcane Biorefinery (VSB). Technical Report 2012.
Dias, M.O.S., Cunha, M.P., Jesus, C.D.F., Rocha, G.J.M., Pradella, J.G.C., Rossell, C.E.V.,Maciel Filho, R., Bonomi, A., 2011a. Second generation ethanol in Brazil: can itcompete with electricity production? Bioresour. Technol. 102, 8964–8997.
Dias, M.O.S., Cunha, M.P., Maciel Filho, R., Bonomi, A., Jesus, C.D.F., Rossell, C.E.V.,2011b. Simulation of integrated first and second generation bioethanolproduction from sugarcane: comparison between different biomasspretreatment methods. J. Ind. Microbiol. Biotechnol. 38, 955–966.
Dias, M.O.S., Junqueira, T.L., Jesus, C.D.F., Rossell, C.E.V., Maciel Filho, R., Bonomi, A.,2012. Improving second generation ethanol production through optimization offirst generation production process from sugarcane. Energy 43, 246–252.
Ensinas, A.V., Nebra, S.A., Lozano, M.A., Serra, L.M., 2007. Analysis of process steamdemand reduction and electricity generation in sugar and ethanol productionfrom sugarcane. Energy Convers. Manag. 48, 2978–2987.
Ezeji, T., Qureshi, N., Blaschek, H.P., 2007. Butanol production from agriculturalresidues: impact of degradation products on Clostridium beijerinckii growth andbutanol fermentation. Biotechnol. Bioeng. 97, 1460–1469.
Ezeji, T., Blaschek, H.P., 2008. Fermentation of dried distillers’ grains and soluble(DDGS) hydrolysates to solvents and value-added products by solventogenicclostridia. Bioresour. Technol. 99, 5232–5242.
Green, E.M., 2011. Fermentative production of butanol – the industrial perspective.Curr. Opin. Biotechnol. 22, 1–7.
Humbird, D. et al., 2011. Process Design and Economics for Biochemical Conversionof Lignocellulosic Biomass to Ethanol – Dilute-Acid Pretreatment andEnzymatic Hydrolysis of Corn Stover. Report No. NREL/TP-5100-47764, 2011.
Kraemer, K., Harwardt, A., Bronneberg, R., Marquardt, W., 2011. Separation ofbutanol from acetone–butanol–ethanol fermentation by a hybrid extraction–distillation process. Comp. Chem. Eng. 35, 949–963.
Leibbrandt, N.H., Knoetze, J.H., Görgens, J.F., 2011. Comparing biological andthermochemical processing of sugarcane bagasse: an energy balanceperspective. Biomass Bioenergy 35, 2117–2126.
Liu, Z., Ying, Y., Li, F., Ma, C., Xu, P., 2010. Butanol production by Clostridiumbeijerinckii ATCC 55025 from wheat bran. J. Ind. Microbiol. Biotechnol. 37, 495–501.
Macedo, I.C., Seabra, J.E.A., Silva, J.E.A.R., 2008. Green house gases emissions in theproduction and use of ethanol from sugarcane in Brazil: the 2005/2006 averagesand a prediction for 2020. Biomass Bioenergy 32, 582–595.
Mariano, A.P., Keshtkar, M.J., Atala, D.I.P., Maugeri Filho, F., Wolf Maciel, M.R., MacielFilho, R., Stuart, P., 2011. Energy requirements for butanol recovery using theflash fermentation technology. Energy Fuel 25, 2347–2355.
Mariano, A.P., Maciel Filho, R., 2012. Improvements in biobutanol fermentation andtheir impacts on distillation energy consumption and wastewater generation.Bioenerg. Res. 5, 504–514.
Mariano, A.P., Dias, M.O.S., Junqueira, T.L., Cunha, M.P., Bonomi, A., Maciel Filho, R.,2013. Butanol production in a first-generation Brazilian sugarcane biorefinery:technical aspects and economics of greenfield projects. Bioresour. Technol. 135,316–323.
Martín, C., Galbe, M., Nilvebrant, N.-O., Jönsson, L.J., 2002. Comparison of thefermentability of enzymatic hydrolyzates of sugarcane bagasse pretreated bysteam explosion using different impregnating agents. Appl. Biochem.Biotechnol. 98–100, 699–716.
Mascal, M., 2012. Chemicals from biobutanol: technologies and markets. Biofuel.Bioprod. Biorefin. 6, 483–493.
Marchal, R., Ropars, M., Vandecasteele, J.P., 1986. Conversion into acetone andbutanol of lignocellulosic substrates pretreated by steam explosion. Biotechnol.Lett. 8, 365–370.
MDIC, 2011. System Information Analysis of Foreign Trade – Butanol and AcetonePrices. <http://aliceweb.desenvolvimento.gov.br> (retrieved 12.07.2011).
Ni, Y., Sun, Z., 2009. Recent progress on industrial fermentative production ofacetone–butanol–ethanol by Clostridium acetobutylicum in China. Appl.Microbiol. Biotechnol. 83, 415–423.
Novozymes, 2009. Enabling cost efficient enzymatic hydrolysis for biomass-to-ethanol conversion. In: 7th Global Clean Technology Conference, New York,USA.
Ojeda, K., Ávila, O., Suárez, J., Kafarov, V., 2011. Evaluation of technologicalalternatives for process integration of sugarcane bagasse for sustainablebiofuels production – Part 1. Chem. Eng. Res. Des. 89, 270–279.
Pfromm, P.H., Amanor-Boadu, V., Nelson, R., Vadlani, P., Madl, R., 2010. Bio-butanolvs. bio-ethanol: a technical and economic assessment for corn and switchgrassfermented by yeast or Clostridium acetobutylicum. Biomass Bioenergy 34, 515–524.
Qureshi, N., Saha, B.C., Hector, R.E., Dien, B., Hughes, S., Liu, S., Iten, L., Bowman, M.J.,Sarath, G., Cotta, M.A., 2010. Production of butanol (a biofuel) from agriculturalresidues: Part II – use of corn stover and switchgrass hydrolysates. BiomassBioenergy 34, 566–571.
Rabelo, S.C., Carrere, H., Maciel Filho, R., Costa, A.C., 2011. Production of bioethanol,methane and heat from sugarcane bagasse in a biorefinery concept. Bioresour.Technol. 102, 7887–7895.
Roffler, S., Blanch, H.W., Wilke, C.R., 1987. Extractive fermentation of acetone andbutanol: process design and economic evaluation. Biotechnol. Prog. 3, 131–140.
Vane, L.M., 2008. Separation technologies for the recovery and dehydration ofalcohols from fermentation broths. Biofuel. Bioprod. Biorefin. 2, 553–588.
Walton, M.T., Martin, J.L., 1979. Production of butanol-acetone by fermentation. In:Pepple, H.J., Perlman, D. (eds.), Microbial Technology, second ed., vol. 1. NewYork: Academic, pp.187–209.
Wayman, M., Yu, S., 1985. Acetone–butanol fermentation of xylose and sugarmixtures. Biotechnol. Lett. 7, 255–260.
Yu, E.K.C., Deschatelets, L., Saddler, J.N., 1984. The bioconversion of woodhydrolyzates to butanol and butanediol. Biotechnol. Lett. 6, 327–332.