calibrating performance measures in the challenging
TRANSCRIPT

Calibrating Performance Measures in the Challenging Economic Environment
Stephen Charlebois
Mercer, Geneva +41 22 918 1027

Contents
The Paradigm Shift Selecting the Right Performance Measures Setting the Appropriate Performance Targets Validating Pay-for-Performance Outcomes Closing Remarks

The Paradigm Shift
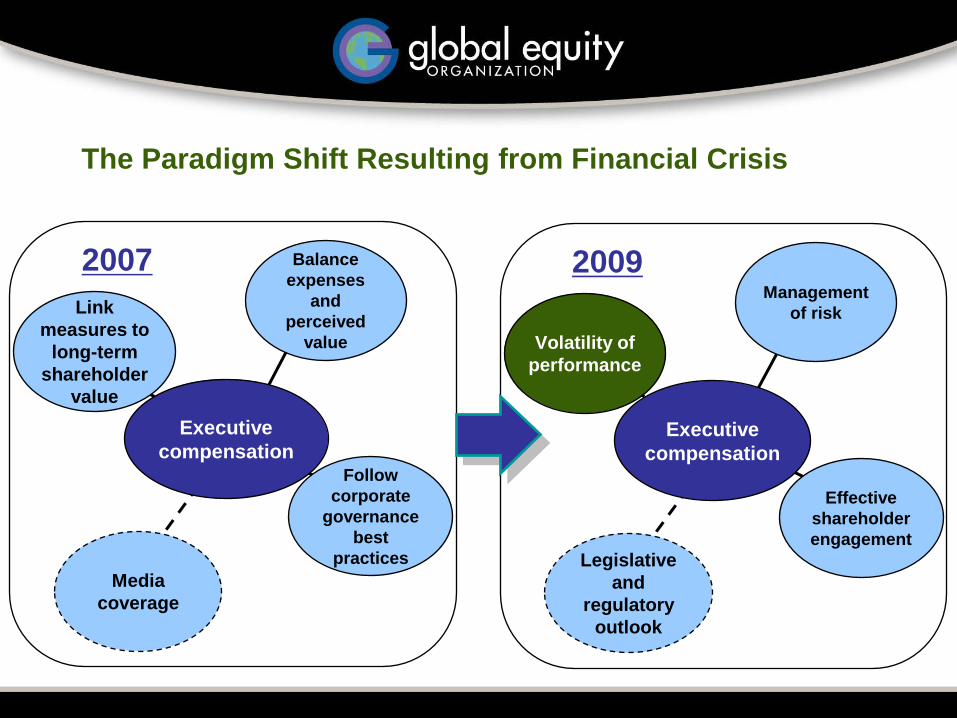
The Paradigm Shift Resulting from Financial Crisis
Follow corporate
governance best
practices
Balance expenses
and perceived
value
Executive compensation
Media coverage
Link measures to
long-term shareholder
value
2007
Effective shareholder engagement
Management of risk
Executive compensation
Legislative and
regulatory outlook
Volatility of performance
2009
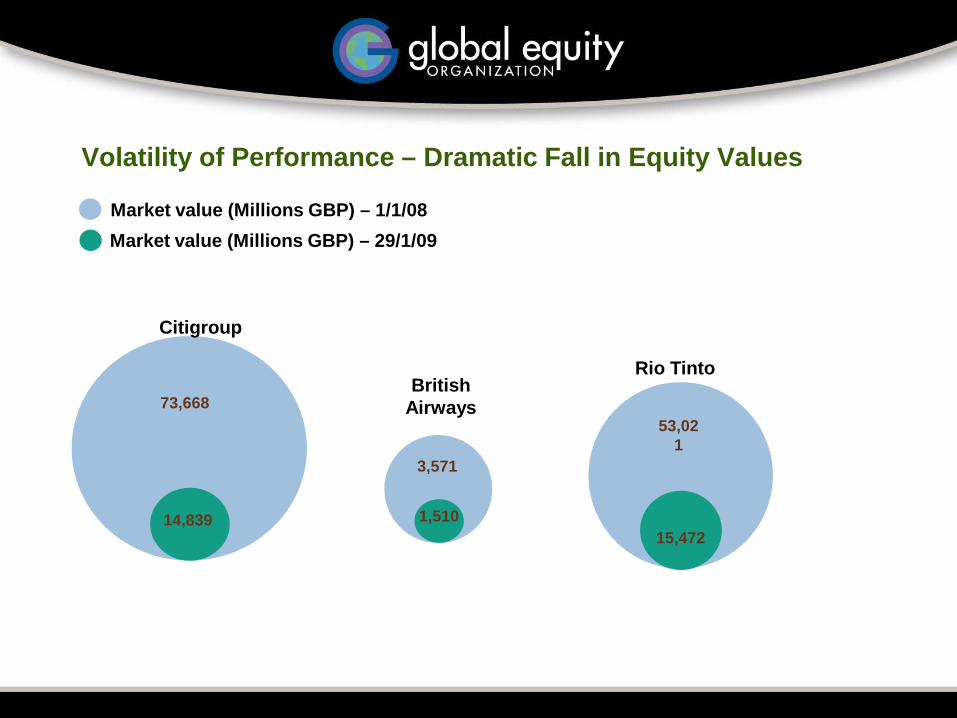
Volatility of Performance – Dramatic Fall in Equity Values
Market value (Millions GBP) – 1/1/08Market value (Millions GBP) – 29/1/09
73,668
Citigroup
British Airways
3,571
1,51014,839
53,021
15,472
Rio Tinto

Volatility of Performance – Impact of Economic Cycles
0
10
20
30
40
50
60
70
80
90
Year 1 Year 2 Year 3 Year 4 Year 5 Year 6 Year 7 Year 8 Year 9 Year 10
Time
Econ
omic
Out
put
Economic Cycle Industry Cycle Company Cycle

Volatility of Performance – Impact of Industry Segment
Utilities
Pharmaceuticals
Oil & Gas(up-stream exploratory)
Financial Services
TelecomsConsumer Goods
Construction and real estate
Mining
Travel & Leisure
Retail &
Aerospace and Defence
Reward
Vola
tility
of P
erfo
rman
ce

Volatility of Performance – Impact of Industry Segment
-5%
0%
5%
10%
15%
20%
25%
30%
35%
Y93 Y94 Y95 Y96 Y97 Y98 Y99 Y00 Y01 Y02 Y03 Y04 Y05 Y06 Y07 Y08
Year
3-Ye
ar S
ales
CA
GR
Source: S&P Research Insight, Mercer Analysis
LegendSample 75th %ileSample 50th %ileSample 25th %ileEnergy IndustryConsumer StaplesConsumer DiscretionaryHealth Care

Selecting the Right Performance Measures

Stakeholder Objectives of Performance Measurement
What Investors Want What the Board Wants What Management Wants
Strong line of sight to individual behaviour
Alignment with the business strategy and organizational culture (one size does not fit all)
Motivational goals that contain the right amount of stretch
Simplicity and ease of communication
Reasonable, defensible pay and performance outcomes
Flexibility to address both retention and measurement challenges as they rise
Clear and transparent disclosure of performance standards and compensation decisions
Direct linkage to shareholder value creation
Meaningful performance contingencies (no surprises) and fair calibration between results and payouts (no free rides)
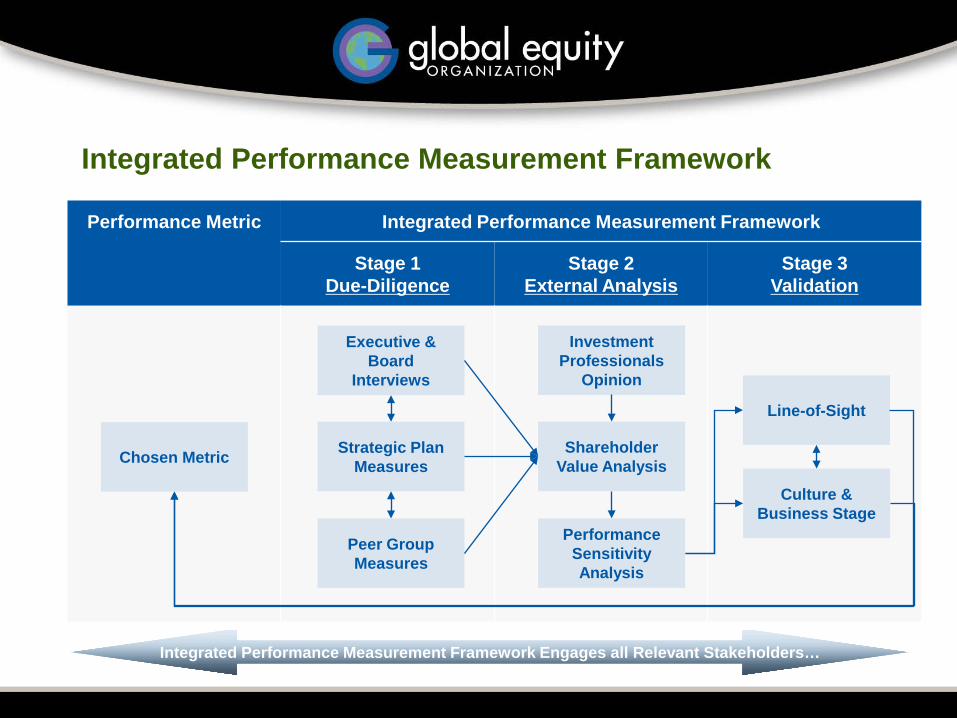
Integrated Performance Measurement Framework
Performance Metric Integrated Performance Measurement Framework
Stage 1Due-Diligence
Stage 2External Analysis
Stage 3Validation
Chosen Metric
Executive & Board
Interviews
Strategic Plan Measures
Peer Group Measures
Line-of-Sight
Culture & Business Stage
Investment Professionals
Opinion
Shareholder Value Analysis
Performance Sensitivity Analysis
Integrated Performance Measurement Framework Engages all Relevant Stakeholders…
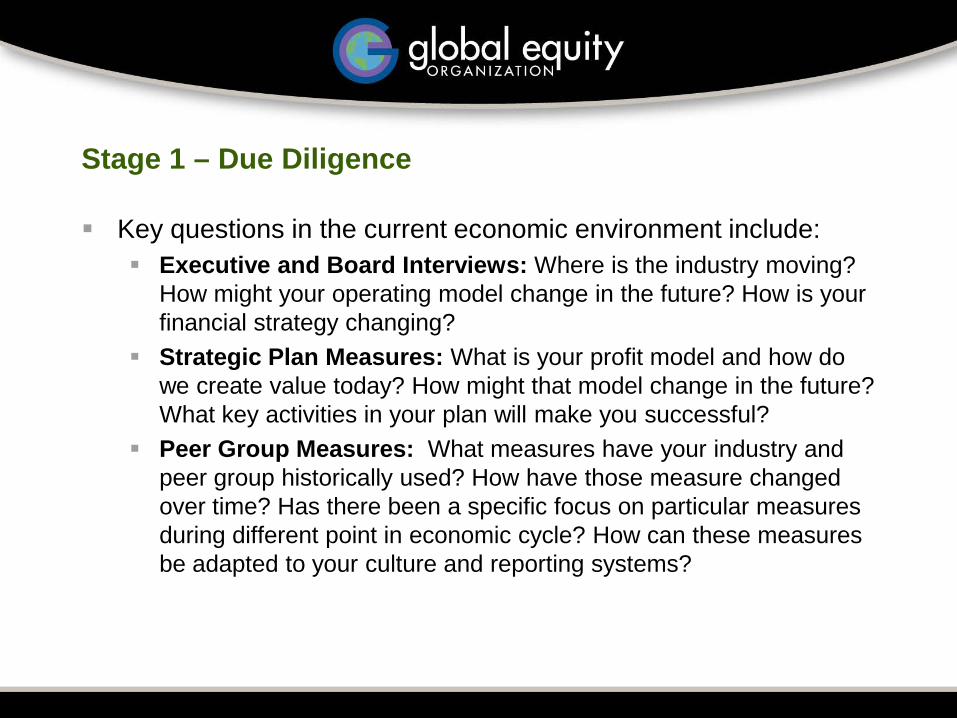
Stage 1 – Due Diligence
Key questions in the current economic environment include: Executive and Board Interviews: Where is the industry moving?
How might your operating model change in the future? How is your financial strategy changing?
Strategic Plan Measures: What is your profit model and how do we create value today? How might that model change in the future? What key activities in your plan will make you successful?
Peer Group Measures: What measures have your industry and peer group historically used? How have those measure changed over time? Has there been a specific focus on particular measures during different point in economic cycle? How can these measures be adapted to your culture and reporting systems?

Stage 2 – External Analysis
Shareholder Value Analysis - Uses regression analyses to determine key financial measures that drive shareholder value over time
Performance Sensitivity Analysis – Identifies underlying sources of share price volatility by measuring volatility of stock price that is attributable to stock market, peer group and company-specific factors

Stage 2 – External Analysis – Sample PSA Analysis
LTI Cash PlanShare Options + Performance SharesShare Options
Potential Long Term
Incentive Mix
Company Specific Volatility High LowMedium
0%
20%
40%
60%
80%
100%
Perc
ent o
f Mon
thly
Var
ianc
e in
TSR
Exp
lain
ed b
y:
Market Volatility
Peer Volatility
Company Specific Volatility

Stage 3 - Validation
This stage is comprised of a more qualitative review to ensure the metrics chosen are appropriate, key questions include: Line-of-Sight: Does the metric align with organizational level? Is
the metric relevant for a profit centre vs. investment centre? Culture & Business Stage: How do we ensure people understand
the metric and reinforce it in managerial decisions? Does this metric incentivise the appropriate risk taking behaviour?
This is the time to step back and reflect on the appropriateness of the metric…

Annual Bonus Performance Measures – Emerging Trends
Using a basket of measures reduces the incidences of bonus payouts at the extremes - zero and maximum bonuses have become less likely
Increased use of non-financial performance measures, i.e. customer satisfaction, employee engagement, health & safety, strategic objectives, etc.
Make changes to performance metrics used to reflect the new priorities for companies most affected, i.e. increased focus on cashflow, costs, etc.
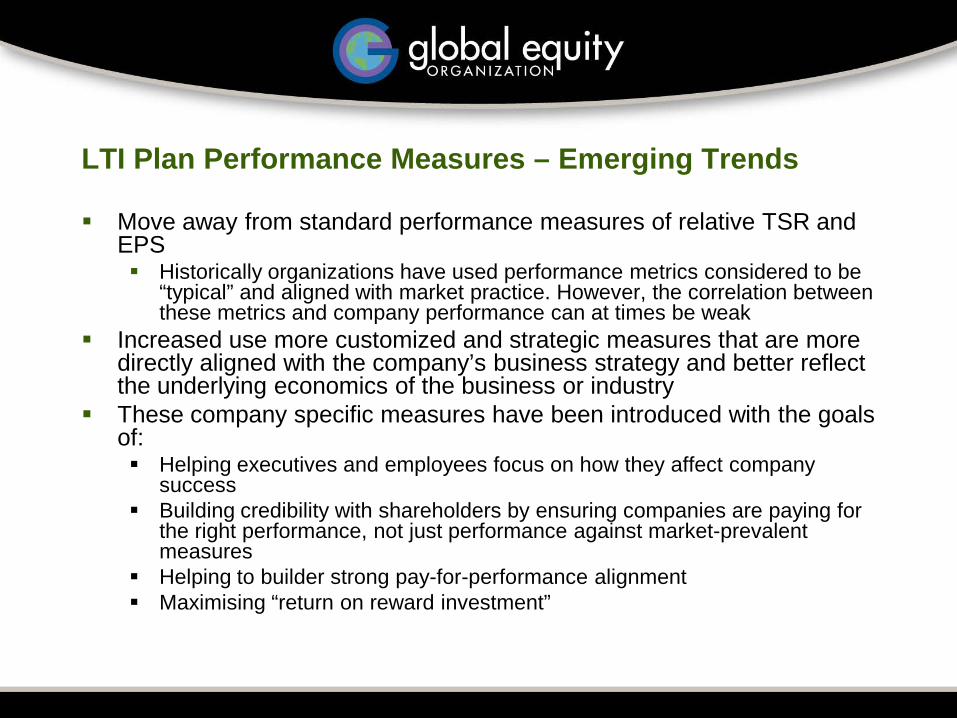
LTI Plan Performance Measures – Emerging Trends
Move away from standard performance measures of relative TSR and EPS Historically organizations have used performance metrics considered to be
“typical” and aligned with market practice. However, the correlation between these metrics and company performance can at times be weak
Increased use more customized and strategic measures that are more directly aligned with the company’s business strategy and better reflect the underlying economics of the business or industry
These company specific measures have been introduced with the goals of: Helping executives and employees focus on how they affect company
success Building credibility with shareholders by ensuring companies are paying for
the right performance, not just performance against market-prevalent measures
Helping to builder strong pay-for-performance alignment Maximising “return on reward investment”

Setting the Appropriate Performance Targets
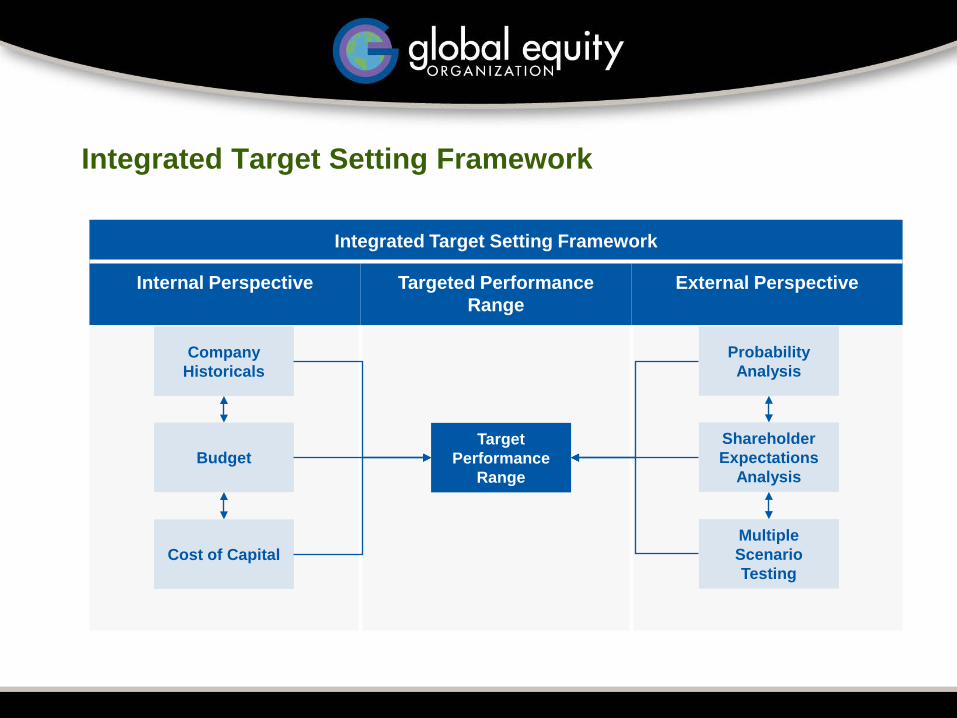
Integrated Target Setting Framework
Integrated Target Setting Framework
Internal Perspective Targeted Performance Range
External Perspective
Target Performance
Range
Probability Analysis
Shareholder Expectations
Analysis
Multiple Scenario Testing
Company Historicals
Budget
Cost of Capital

Target Setting - Internal Perspective
Companies that set performance targets by the internal approach alone usually place great stock in their ability to measure and analyze historical performance and use it as the principal basis for planning and predicting future performance
The internal perspective is generally a good starting point, however, solely relying on internal perspectives may lead to: Built-in, budgeted incentive payments even in a downturn Expected level of performance may not be achieved given general
or industry market opportunities Internally driven process can sometimes fail to incorporate
shareholder expectations, leading to goals that are not meaningful from a shareholder value creation perspective

Target Setting – External Perspective
The external perspective is generally used to complement the internal budgeting process and to re-confirm the assumptions made are correct and reflect economic, industry and company life-cycles. Typical analysis includes: Industry Analysts Expectations to directionally assess the
difficulty of a target. Macroeconomic Indicators to gauge the direction of demand for
products or growth in specific regions or industries. Shareholder Expectation Analysis for growth and option on the
company strategy and competitive positioning. Probability Analysis to test the relative difficulty of achieving a
certain level of performance. Scenario Testing to fully understand the potential implications of
“extreme” outcomes.

Target Setting – Emerging Trends
Increased use of forward looking scenario testing to determine the behaviour of the selected performance measures under different performance scenarios
Setting targets relative to external economic and market indices Review of typical 3-year performance periods
Some companies have moved to annual performance measurement, i.e. 3-year plan with 3 annual periods due to difficulty in setting 3-year targets in current economic environment

Calibrating Pay for Performance Outcomes

Calibrating Pay-for-Performance Outcomes
Calibrating incentive awards to performance results ensures that threshold, target and maximum payout opportunities are appropriate for commensurate performance results
2. Kinked (emphasis on target-max)
Steep slope above target
PerformancePerformance
Threshold
Target
Max
Rew
ard
Size
Threshold
Target
Max
Rew
ard
Size
1. Linear(equal emphasis on threshold-
max)
Executives receive a small bonus when performance is below target, with payments increasing in exact proportion as performance improves
The payout threshold is lower than under linear payout curve, but payments increase at a faster rate as performance exceeds the target

Review of Payout Curves – Emerging Trends
Flatter pay for performance correlation, less upside but lower targets for threshold performance
Increased use of an S-shaped payout curve: Provides reduced incentive for falling near the plan threshold and
maximum Motivates executives to reach target, but does not encourage them
to “shoot the lights out”

Closing RemarksStrategic Alignment
Right Performance Focus Do we have the right
measures? Are they consistent with our
strategic priorities? Do we have appropriate line of
sight?
Compensation Policy
How Much to Pay Pay Positioning
How to Pay Pay mix Leverage Vehicles Eligibility
For What to Pay Measures Targets Linkage Time-horizon
Right Behavior Are our performance goals
difficult enough? Does the compensation
program incent the appropriate risk- taking behavior?

Your Questions…