cadastral core data in montana: the cadastral data uses...
TRANSCRIPT
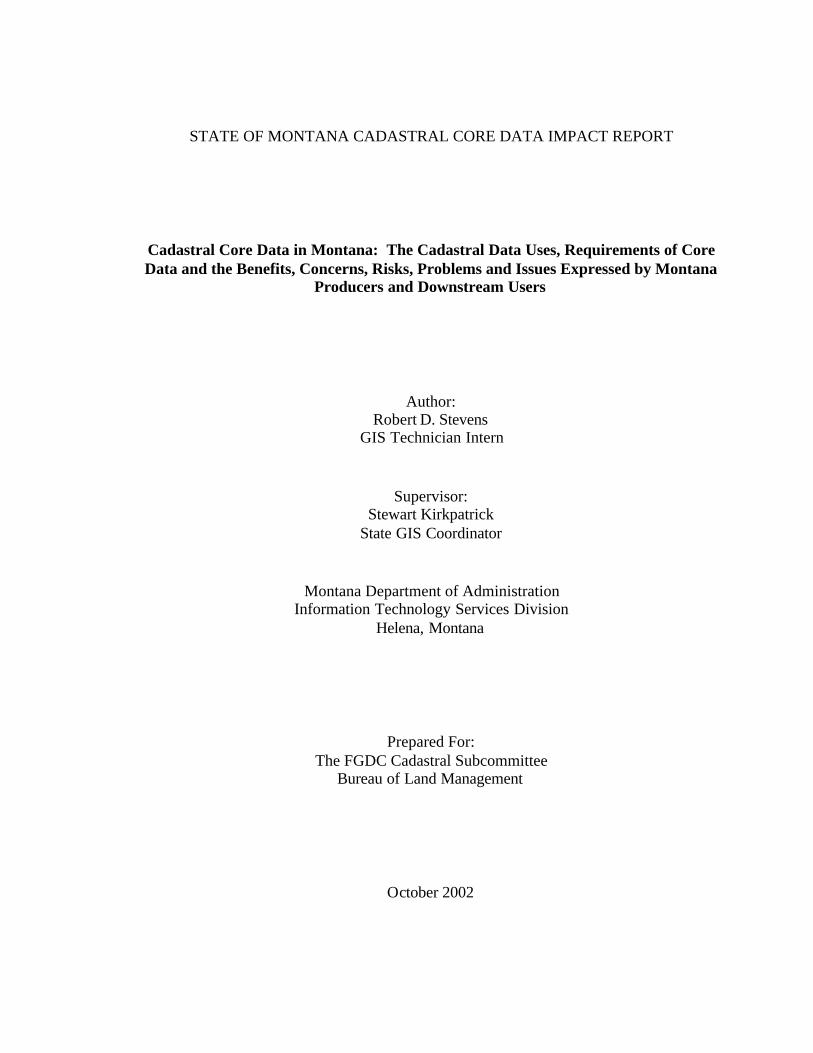
STATE OF MONTANA CADASTRAL CORE DATA IMPACT REPORT
Cadastral Core Data in Montana: The Cadastral Data Uses, Requirements of Core Data and the Benefits, Concerns, Risks, Problems and Issues Expressed by Montana
Producers and Downstream Users
Author: Robert D. Stevens
GIS Technician Intern
Supervisor: Stewart Kirkpatrick
State GIS Coordinator
Montana Department of Administration Information Technology Services Division
Helena, Montana
Prepared For: The FGDC Cadastral Subcommittee
Bureau of Land Management
October 2002

Table of Contents

ii
List of Tables

iii
List of Figures

Executive Summary
The Montana Department of Administration, Information Technology Services Division, Geographic Information Systems (GIS) Bureau began construction on a cadastral database in 1998 and completion is expected in 2002. At the present time the database is available via the Internet and is being transitioned to an Arc/PARCEL Geodatabase model. The bureau serves the role as cadastral data integrator. As the state integrator, the GIS Bureau integrates data maintained by the Montana Department of Revenue and eight other counties that produce their own parcel layer. (See figure 1)
The GIS Bureau was awarded a Bureau of Land Management (BLM) grant to fund a Montana pilot of the cadastral core data initiative, a project of the Federal Geographic Data Committee (FGDC) Cadastral subcommittee. Objectives of the Montana pilot are sevenfold.
• Determine the needs and/or requirements of cadastral core data for both producers, those who create and maintain data, and downstream users of the information. An objective of the Montana pilot is to determine the needs of core data for the economic development and emergency response communities.
• Use the requirements of producers and users in order to recommend modifications to the proposed FGDC Core Data Standard. Make the determination which
Figure 1 Distribution of Cadastral Data Maintenance Responsibility in Montana
Lincoln
Flathead
Sanders
Mineral
Lake
Missoula
Ravalli
Granite
Powell
Lewis &
Clark
Teton
Glacier TooleLiberty Hill
Blaine
Chouteau
Deer Lodge
Silver Bow
Jefferson
MadisonBeaverhead
GallatinPark
Sweet Grass Stillwater
Carbon
Yellowstone
Big Horn
Rosebud
Custer
Garfield
McCone
Roosevelt
Daniels Sheridan
Richland
Dawson
Prairie Wibaux
Fallon
ValleyPhillips
CascadeJudith Basin
FergusPetroleum
WheatlandGolden Valley
MusselshellMeagher
Broadwater Treasure
Pondera
Powder River
Carter
Parcels Maintained by County
Parcels Maintained by Montana Department of Revenue
2
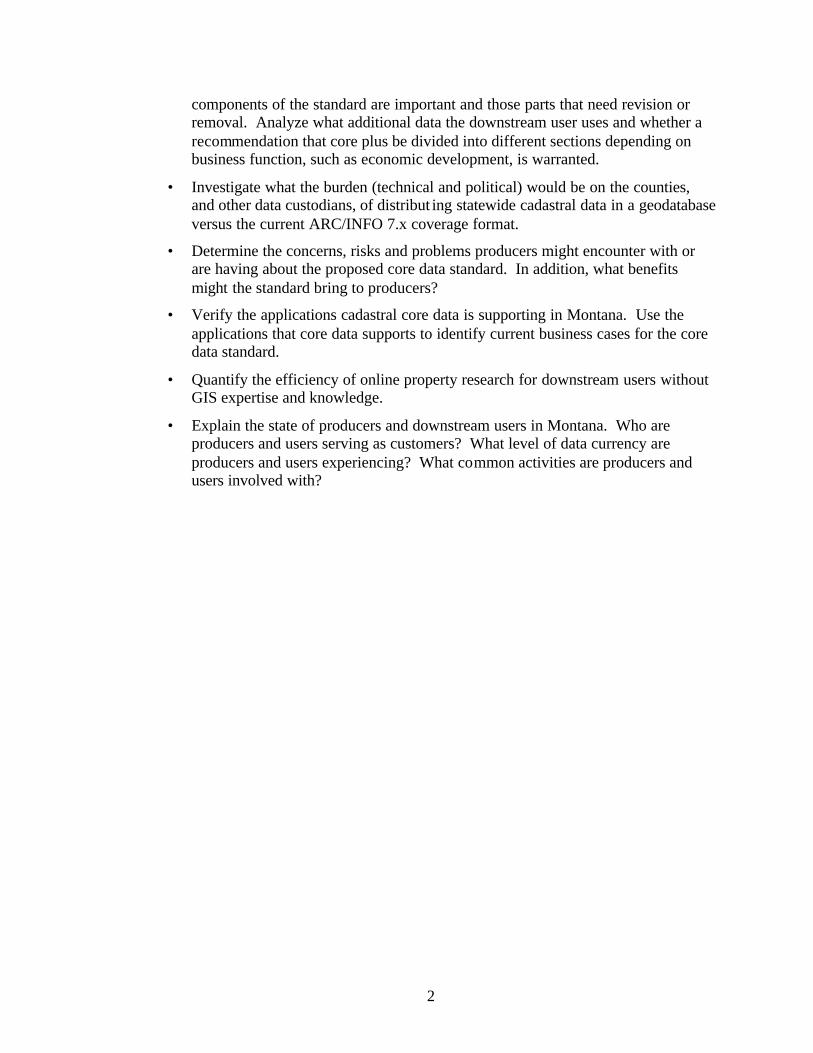
components of the standard are important and those parts that need revision or removal. Analyze what additional data the downstream user uses and whether a recommendation that core plus be divided into different sections depending on business function, such as economic development, is warranted.
• Investigate what the burden (technical and political) would be on the counties, and other data custodians, of distribut ing statewide cadastral data in a geodatabase versus the current ARC/INFO 7.x coverage format.
• Determine the concerns, risks and problems producers might encounter with or are having about the proposed core data standard. In addition, what benefits might the standard bring to producers?
• Verify the applications cadastral core data is supporting in Montana. Use the applications that core data supports to identify current business cases for the core data standard.
• Quantify the efficiency of online property research for downstream users without GIS expertise and knowledge.
• Explain the state of producers and downstream users in Montana. Who are producers and users serving as customers? What level of data currency are producers and users experiencing? What common activities are producers and users involved with?

3
Introduction
The Montana pilot of the cadastral core data initiative explored and determined what parts of the proposed Federal Geographic Data Committee (FGDC) core data standard are a necessity in this state and which elements, according to Montana producers and downstream users, are not needed in a state such as Montana. With these findings a series of recommendations were made that reflect the State of Montana’s overall needs from an FGDC core data standard. These recommendations have tried to take into account that other regions of the United States must have certain elements of the standard that are not a necessity in Montana.
Before a discussion of the findings of what downstream users, federal agencies and data producers have deemed important or not important; the general characteristics of data producers and downstream users must be summarized. These summaries will give an overall of the status and progress in Montana of the creation, dissemination, publication and use of cadastral data. With this in mind the report with be organized into eight parts
• Participants
• Methodology
• Summary of Montana Downstream Users of Cadastral Data
• Summary of Montana Cadastral Data Producers and Maintainers
• Downstream User Needs and/or Requirements of Core Data
• Federal Agency Needs and/or Requirements of Core Data
• Needs and/or Requirements of Core Data by Producers
• Technical Requirements of Distributing Core Data
• Recommendations
• Conclusion
Montana Pilot Participants
The following data producers were chosen for and participated in this pilot.
• Bureau of Land Management (BLM) Branch of Cadastral Survey
• Butte-Silver Bow GIS Department
• Cascade County GIS Department
• Gallatin County Clerk & Recorders Office
• Great Falls City/County Planning Office
• Lake County Clerk & Recorders Office
• Missoula County Mapping/GIS Department
• Montana Department of Administration, ITSD, GIS Bureau
• Montana Department of Revenue

4
• United States Forest Service Region 1
• Yellowstone County GIS Department
The following downstream users participated in the pilot.
• American Public Land Exchange
• Billings City/County Planning Office
• BLM Geographic Information Systems (GIS) Department
• Butte-Silver Bow Planning Office
• Confederated Salish-Kootenai Tribes GIS Program
• DJ & A Consulting
• DTM Consulting, LLC
• Geodata Services, Inc.
• Global Positions, LLC
• Governor’s Office of Economic Opportunity
• Great Falls City/County Planning Office
• Lake County Clerk & Recorders
• Lewis & Clark County GIS Department
• Lewis & Clark County Disaster and Emergency Services Office
• Missoula County Office of Emergency Management
• Missoula Department of Public Works
• Missoula Redevelopment Agency
• Montana Department of Military Affairs
• Montana Department of Natural Resources & Conservation Fire and Aviation Management
• Park County Planning Office
• Water Right Solutions, Inc.
Contact information for all producers and users can be found in Appendix A along with a map showing the geographic location of the participants.
Methodology
A personal interview with each participant was the method chosen to obtain the necessary information for this survey. Due to the complexity of the questions this was the best approach. Questionnaires were developed for the interviews and these can be located in Appendix C, D and E. Each interview began with the general questionnaire and than used one of two main questionnaires. The main questionnaire used was dependent on whether the agency/business involved was a producer or downstream user.

5
From the producer’s standpoint, most organizations that create and maintain cadastral data in Montana were interviewed. The exceptions were Flathead and Ravalli counties, for reasons that need not be discussed here. On the downstream user side, the main focus was to interview the economic development and emergency response communities. A total of seven interviews were done for each group, with two that overlapped both groups. Private sector companies were also questioned.
The interviews were conducted in almost the same way. A minimal amount of variation existed because in some interviews the individual needed more explanation.
Following the interviews the responses were summarized into tables and charts were produced for most questions in order to make visualization easier.
The determination of the State of Montana requirements for cadastral core data, presented later, was made by taking into account the characteristics of the producers and downstream users as well as which components of the standard received mostly mandatory and valuable rankings. Recommendations for components to eliminate or modify was made using these requirements and issues that producers mentioned.

6
Summary of Montana Pilot Participants
Downstream Users
In Montana the downstream user of cadastral data, in general, is using the information frequently in their daily work. The average user seems to be using good data, encountering only minor problems or concerns, applying imagery to their cadastral information and has incorporated parcel information into the services that are provided to their customers.
What the Downstream User Does
Specifically, the user of cadastral data is doing a lot. Applications that users are doing or will be doing shortly vary widely from automated queries to bio-terrorism to a database containing fire ratings for parcels. A more exhaustive list of applications includes: providing ownership information and papers upon request, using parcels in the creation of a Montana Business Network database, strategic planning, land use planning simulation, hazardous materials data linked with parcels on a password protected website, combining digital parcel maps with local comprehensive plans, overlaying land ownership and water right information, constructing historical maps based on a structures date of construction, plume modeling, web applications, and a permit use application linked with parcels. Roughly 80% of these applications are a cost-savings to the user. Montana is doing a lot with parcels.
A high percentage of users also are doing many of the small, daily activities commonly associated with cadastral mapping. (See figure 3) This includes basic spatial analysis,
finding parcels based on a query and manipulating or standardizing data. The two
Figure 3 What Downstream Users Are Doing
0% 20% 40% 60% 80% 100%
Maintain other Parcel related attributes
Publish parcel data
Produce hard-copy maps
Create Web Applications
Manipulate or Standardize
Merge data
Combine parcel data
Spatial Analysis
Make digital maps
Find a specific parcel
Provide data quality feedback

7
activities, combining parcel data with other types of information like a floodplain layer and producing hard-copy maps/reports, top the list with 100%. Spatial analysis, finding information based on a query and creating simple digital maps are done by most, over 80%. Only a small minority, just over 20%, publishes data on the Internet or creates web applications.
Are users satisfied with what their organization is doing? At a first glance the answer is yes. Only ten out of twenty-one users mentioned that there were applications they hoped to be doing. A majority of these ten, 60%, hoped to have an ArcIMS web application. Their limitations, in general, are the costs, lack of training, staff resources and hardware/software concerns. Given that over half the users did not respond indicates Montana downstream users are seem comfortable with what is being done with cadastral data.
How the Downstream User Uses Cadastral Data
An average user interacts with parcel information very frequently and there are several methods that a majority of them use to access, search or look-up cadastral information. Every user interviewed uses the owners name as one method to search for a parcel. (See figure 4) Approximately 70% of users use the address, property or owner, parcel outline
public land survey system (PLSS) or a block of addresses such as all addresses in a city block. Other than a property or building centroid, the remaining methods, parcel identifier, the subdivision name or census tract, are each used by around 50% of the users.
Figure 4 Methods Utilized to Access Parcel Information
0% 20% 40% 60% 80% 100%
Owner Name
Owner Address
Block Address
Street Address
Subdivision Name
Parcel ID
Parcel Outline
Census Tract
Property Centroid
Building Centroid
PLSS
Other Methods

8
The largest group of downstream users who use either owner name or parcel identifier use it on a daily basis. Those who utilize the parcel outline method the most use it at least several times a week. A majority of users that utilize any of the address, PLSS or census tract methods uses them several times a month, monthly or several times a year. Of those methods of accessing cadastral data that are used by the vast majority, only owner name, parcel identifier and parcel outline are used by a large number of them on at least a weekly basis.
Not only do users, in general, search for cadastral data frequently by some method, but most of the time these users are attempting to locate more than one parcel. (See figure 5) The total number of parcels, which are usually trying to be located, ranges from five to
one thousand. A typical amount is about twenty. The interviewees indicated that sometimes there are situations where one parcel is trying to be found and almost never is one parcel compared with another in a different jurisdiction. The complexity of these searches is not that high because almost every user only uses one data source.
Parcels and Imagery
All twenty-one users surveyed use imagery in some way with parcels. In the interview users were asked if there imagery was black and white, color infrared, ortho-photography, satellite or some other type. More than one imagery type could be used.
• Two agencies make use of standard black and white photography that is not rectified. The Billings City/County Planning Office gets theirs from Yellowstone County and the BLM receives the imagery from the United State Geological Survey (USGS). The Billings planning office indicated that the photography used is a scale of 1:24,000 and is updated every six to seven years. The ir planning office would desire a pixel size of one meter and yearly updates. BLM hopes to have the BW
Figure 5 How Spatial Analysis is Done
0%10%20%30%40%50%60%70%80%90%
100%
How Often Is OneParcel Located
How Often AreMultiple Parcels
Located
How Often AreParcels Compared
AcrossJurisdictions
AlwaysMost of the TimeSometimesRarelyNever

9
photography updated every five years. The Billings planning office rated the value of the imagery use with parcels as valuable and BLM indicated it was nice to have.
• Five agencies/businesses indicated that color infrared was used with cadastral data. Two got their imagery from Space Imagery. Another two received the imagery from USGS and the remaining users imagery is their own. The color infrared imagery is rectified for four of the five and is between one and five meter resolution. One interviewee indicated the imagery was updated every five years and another said every two to three years. The other users were not sure of the update cycle. Three of the five are content with the current resolution and update frequency. A total of three said the imagery was valuable to their use of cadastral data, another said it was mandatory and one indicated it is nice to have.
• Only one of the twenty-one users does not use ortho-photography. Everyone that uses ortho-photos has rectified imagery. The majority receives the imagery from the Montana State Library, Natural Resource Information System (NRIS) that originally came from USGS. Sixteen of the interviewees said that ortho-photography is a valuable tool for their use of parcels. Of the remaining responses, three indicated mandatory while two said nice to have.
• Four of the twenty-one participants indicated they used satellite imagery. Three of the participants said they were positive that the images were rectified. Each user received their satellite imagery from a different source. The sources are NRIS, Landsat, Space Imaging and Earth Resources Observation (EROS) Data Center. Of the users imagery is fifteen meter and another users is thirty meter. Most do not receive updates or are not sure of the update cycle. In addition, the majority of the participants indicated their desired resolution and update cycle would be one meter and annually, respectively. Except for one, everyone said satellite imagery was a valuable tool. The one exception said it was mandatory.
• An additional type of imagery that three participants have is color ortho-photography.
The general trend in Montana is that any kind of imagery is a valuable tool that can be applied toward cadastral mapping.

10
Data Currency
The vast majority of downstream users have data in which the parcel lines are current within a month and attributes that are current within six months. (See figure 6) Most
users receive their data off of the Montana Cadastral Mapping Project website and that is why most users responses were monthly and semi-annually. Around 10% of users are currently using data that is being maintained frequently enough that it is current, parcel lines and attributes, within a day or week. Daily and weekly being the best level of data currency.
In the worst-case scenario, most downstream users can stand to use data where the parcel lines and attributes are current within six months to a year. (See figure 7)
Figure 6 Downstream Users Present Level of Data Currency
0% 20% 40% 60% 80% 100%
Daily
Weekly
Monthly
2 or 3 Months
Quarterly
Semi-Annually
Annually
Historic
AttributesParcel Lines
Figure 7 Worst-Case Scenario for Data Currency of Users
0% 20% 40% 60% 80% 100%
Daily
Weekly
Bi-Weekly
Monthly
2 or 3 Months
Quarterly
Semi-Annually
Annually
Historic
AttributesParcel Lines

11
Almost 40% of users said their desired currency level for the parcel lines would be monthly and another almost 40% indicated daily. The majority indicated that in a perfect world the attributes should be current daily. (See figure 8)
Customers
Montana downstream users serve many different types of customers; these can be broken into four groups (private sector, policy makers, individual citizens and other government agencies). Seven categories can be created that describe the types of private sector businesses that 60% of the users surveyed have as customers. The categories are real estate, legal, energy companies, architects, title companies, land trusts and consulting. Specific energy companies given from the interviews include PPL Montana and Atlantic Richfield (ARCO). Types of policy makers that downstream users serve, in terms of cadastral data, are internal departments and the Montana Legislature. Many downstream users also serve the general public. Five categories that describe the types of other government agencies are tribes, other local governments, state agencies, federal agencies and public/private corporations. Examples of some local governments, from the interviews, are Madison and Big Horn Counties. Some state agencies that users serve are Department of Revenue, Fish Wildlife and Parks, Department of Natural Resources and Conservation and the Department of Transportation. Federal agencies that users serve are the U.S. Forest Service, BLM, Bureau of Reclamation, U.S. Census Bureau and the Federal Emergency Management Agency (FEMA).
Considering those users who do serve private sector businesses as customers, the largest percentage, 32%, spend only one to five percent of their time servicing these clients. (See figure 9)
Figure 8 Desired Data Currency Level for Downstream Users
0% 20% 40% 60% 80% 100%
Daily
3 Days
Weekly
Monthly
2 or 3 Months
Quarterly
Semi-Annually
Annually
Historic
AttributesParcel Lines

12
For policy makers, greater than 40% of users either spend one to five or six to ten percent of there time servicing lawmakers. (See figure 10) The largest percentages of downstream users do not even serve private sector companies or policy makers.
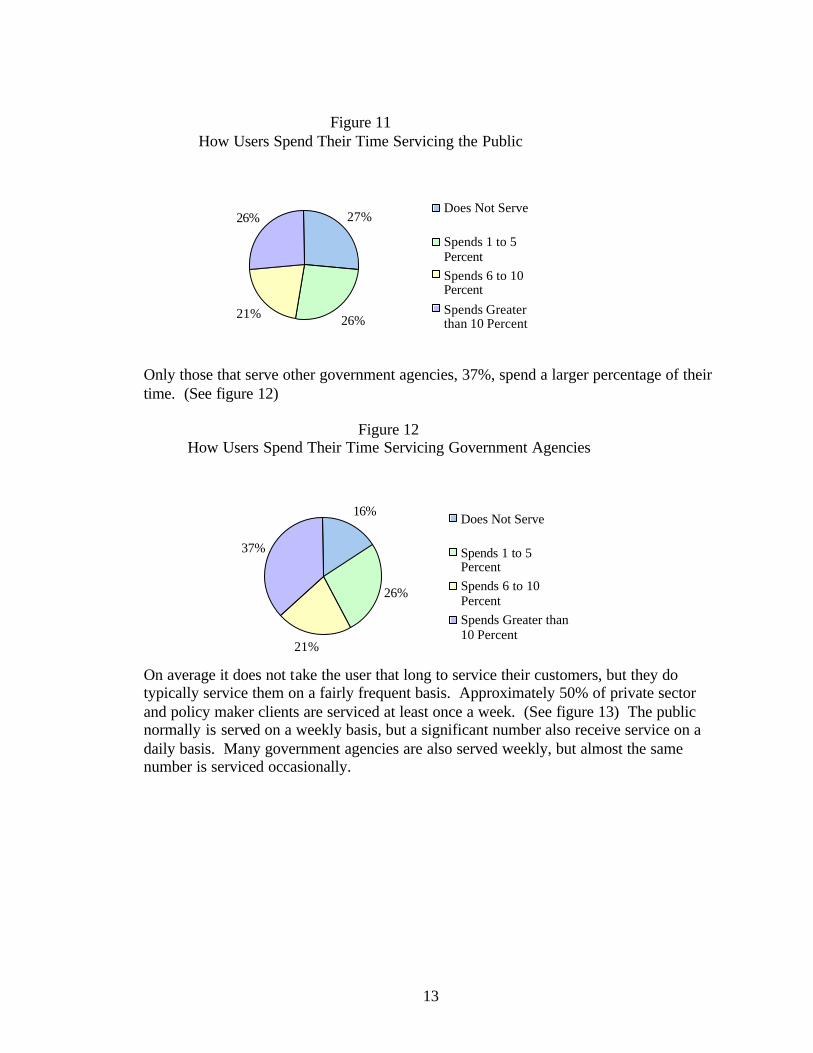
The numbers are all about the same when it comes to how much time those who serve the public spend. (See figure 11)
Figure 9 How Users Spend Their Time Servicing the Private Sector
36%
32%
11%
21%Does Not Serve
Spends 1 to 5PercentSpends 6 to 10PercentSpends Greater than10 Percent
Figure 10 How Users Spend Their Time Servicing Policy Makers
42%
21%
21%
16% Does Not Serve
Spends 1 to 5PercentSpends 6 to 10PercentSpends Greaterthan 10 Percent
13
Only those that serve other government agencies, 37%, spend a larger percentage of their time. (See figure 12)
On average it does not take the user that long to service their customers, but they do typically service them on a fairly frequent basis. Approximately 50% of private sector and policy maker clients are serviced at least once a week. (See figure 13) The public normally is served on a weekly basis, but a significant number also receive service on a daily basis. Many government agencies are also served weekly, but almost the same number is serviced occasionally.
Figure 11 How Users Spend Their Time Servicing the Public
27%
26%21%
26%Does Not Serve
Spends 1 to 5PercentSpends 6 to 10PercentSpends Greaterthan 10 Percent
Figure 12 How Users Spend Their Time Servicing Government Agencies
16%
26%
21%
37%
Does Not Serve
Spends 1 to 5PercentSpends 6 to 10PercentSpends Greater than10 Percent

14
Concerns, Problems or Risks and Benefits that have been Encountered
The downstream user in Montana is encountering only minor problems and has expressed only a few general concerns with their applications or the cadastral data itself. One general concern or problem that 24% of users are experiencing is applications that are not as efficient. A somewhat smaller 19% have indicated that privacy is a concern. Two users, or 10%, had no problems or concerns with their applications or with the parcel data. Additional concerns, problems or risks that are being encountered can be grouped into four categories, which are as follows.
• Data Duplication
• Data Currency
• Spatial Accuracy
• Accuracy and Completeness of the Department of Revenue’s Computer Assisted Mass Appraisal (CAMA) database
These concerns should be dealt in time as the data maintenance process moves forward.
Cadastral Data Producers/Maintainers
Montana cadastral data is maintained by the Department of Revenue or, in the case of eight counties, at the county level. All of the producers in the state except one create parcels. The exception being the BLM; instead BLM creates the Geographic Coordinate Data Base (GCDB). All producers publish the data to some extent and except for the BLM every producer also creates some value-added products. In Montana there is one integrator, the Department of Administration, Information Technology Services Division, GIS Bureau. The integrator compiles cadastral information for the entire state, and also creates, publishes and produces value-added products. Montana producers, including the state integrator, are performing most tasks associated with a cadastral data producer. The producers are creating and publishing current, accurate data to their clients; most without use of imagery.
Figure 13 Frequency that Customers are Served by Downstream Users
0%10%20%30%40%50%60%70%80%90%
100%
Client PolicyMakers
IndividualCitizens
GovernmentAgencies
DailyWeeklyMonthlyQuarterlyOccasionally

15
What the Data Producer Does
The top business functions (what is done in general terms in terms of cadastral production and maintenance) of producers are to serve the needs of the general public and other departments in their agency. As the state integrator, the business functions are to provide enterprise coordination for IT functions and provide efficient/effective access to framework spatial data. Additional business functions are as follows.
• Mandated by Legislature to Update Parcel Maps
• Initial GCDB Collection
• Maintaining Parcels Map in Digital and Hard-copy Format
• Combining Cadastral with Comprehensive Plan
• Compiling CAMA and Parcels
• Quality Control
• Providing Geodetic Control for Parcels
• Modifying to Comply with State Standard
• Producing Value-added from GCDB
Among the common tasks that producers do, all Montana data producers add new parcel identifiers or maintain existing ones, improve spatial accuracy (adjusting parcel locations) and making digital maps. (See figure 14) Tasks performed by at least 80% are production of hard-copy maps, the updating of parcel maps and maintenance of
additional parcel attributes. Publication of data is done by only about half. Adding and updating assessment information is not a producer task in Montana except at the Department of Revenue. The state integrator performs quality assurance/quality control (QA/QC), merges different data sources and standardizes or manipulates data from multiple sources.
Figure 14 What Producers are Doing
0% 20% 40% 60% 80% 100%
Add New Parcel ID’s
Add/Update Assessment InformationAdd/Update Addresses
Maintain other Parcel relatedAttributes
Improve Spatial AccuracyUpdate Parcel Maps
Make Digital MapsPublish Parcel Data
Produce Hard-Copy MapsCreate Web Applications

16
Most common tasks that producers do are done in this state, but 36% of producers, those who do not perform this task now, want the capacity to publish parcel data. A larger
number, 55%, want to develop web application. Few Montana producers update or add assessment information and not many want to start doing this task. (See figure 15) Montana’s integrator wants the capacity to add additional attributes to the parcels. Additional tasks mentioned as items that some producers, including the integrator, want to do are have automated QA/QC procedures, integrate CAMA with GIS, providing ownership (present and historic) more quickly upon request and display buildings on top of the parcel layer via the Internet. Note for the remainder of the report that producer includes the state integrator.
The top four barriers that hold most producers back from implementation of new tasks are funding, lack of staff, adequate training and reliance on outside agencies/businesses. (See figure 16)
Figure 15 What Producers Want to Do
0% 20% 40% 60% 80% 100%
Add/Update Assessment
Add/Update Address
Maintain other Parcel relatedattributes
Publish parcel data
Create Web Applications
Figure 16 Barriers Preventing Implementation
0%10%20%30%40%50%60%70%80%90%
100%
Funding Training Lack ofStaff
Software Reliance onOthers
DataQuality
TimeConstraints
No Barriers
17
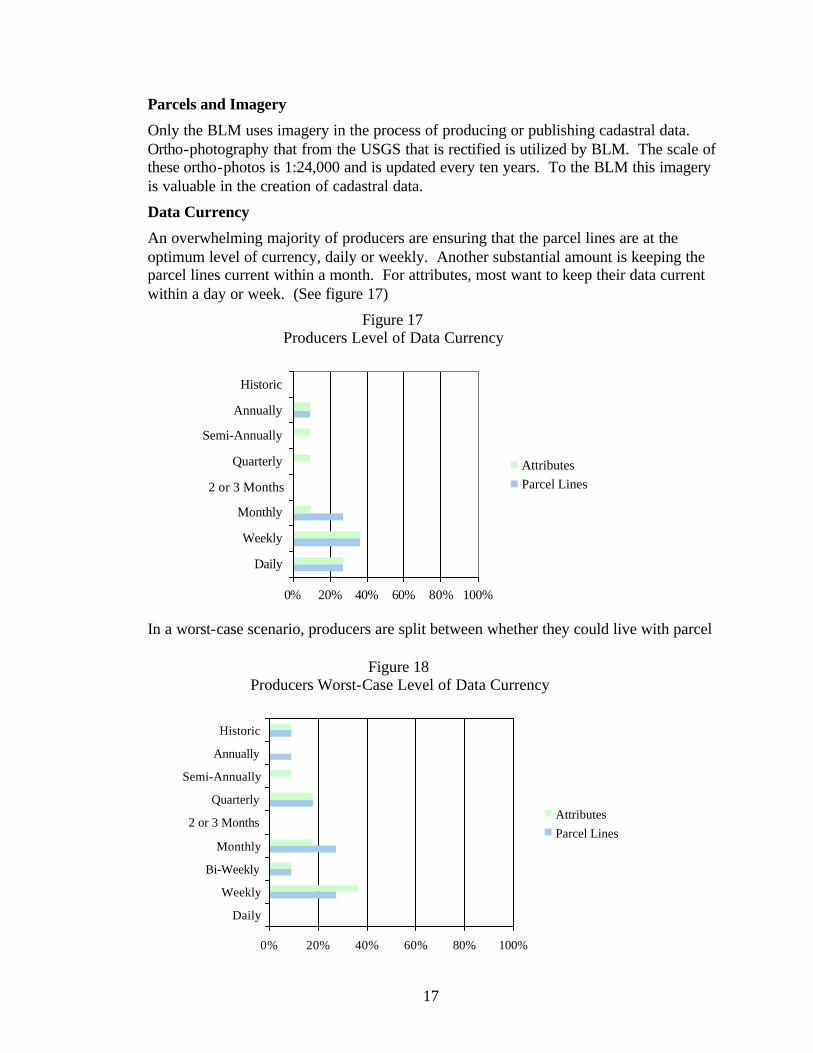
Parcels and Imagery
Only the BLM uses imagery in the process of producing or publishing cadastral data. Ortho-photography that from the USGS that is rectified is utilized by BLM. The scale of these ortho-photos is 1:24,000 and is updated every ten years. To the BLM this imagery is valuable in the creation of cadastral data.
Data Currency
An overwhelming majority of producers are ensuring that the parcel lines are at the optimum level of currency, daily or weekly. Another substantial amount is keeping the parcel lines current within a month. For attributes, most want to keep their data current within a day or week. (See figure 17)
In a worst-case scenario, producers are split between whether they could live with parcel
Figure 17 Producers Level of Data Currency
0% 20% 40% 60% 80% 100%
Daily
Weekly
Monthly
2 or 3 Months
Quarterly
Semi-Annually
Annually
Historic
AttributesParcel Lines
Figure 18 Producers Worst-Case Level of Data Currency
0% 20% 40% 60% 80% 100%
Daily
Weekly
Bi-Weekly
Monthly
2 or 3 Months
Quarterly
Semi-Annually
Annually
Historic
AttributesParcel Lines
18
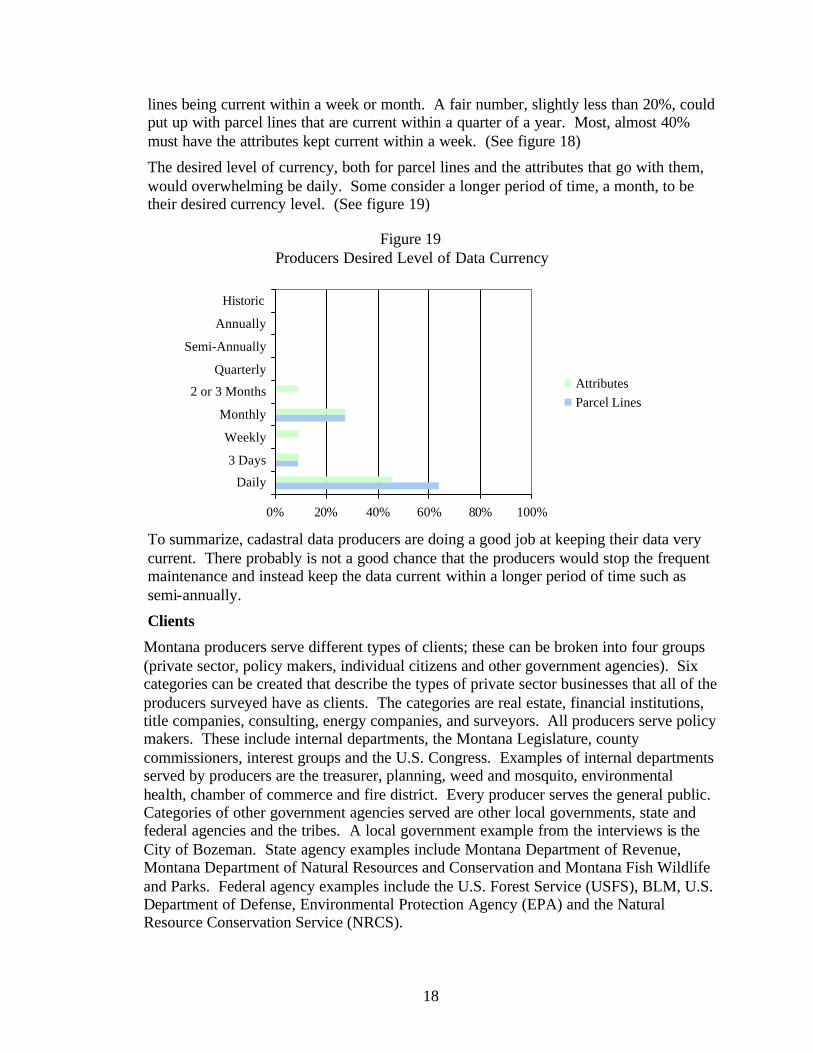
lines being current within a week or month. A fair number, slightly less than 20%, could put up with parcel lines that are current within a quarter of a year. Most, almost 40% must have the attributes kept current within a week. (See figure 18)
The desired level of currency, both for parcel lines and the attributes that go with them, would overwhelming be daily. Some consider a longer period of time, a month, to be their desired currency level. (See figure 19)
To summarize, cadastral data producers are doing a good job at keeping their data very current. There probably is not a good chance that the producers would stop the frequent maintenance and instead keep the data current within a longer period of time such as semi-annually.
Clients
Montana producers serve different types of clients; these can be broken into four groups (private sector, policy makers, individual citizens and other government agencies). Six categories can be created that describe the types of private sector businesses that all of the producers surveyed have as clients. The categories are real estate, financial institutions, title companies, consulting, energy companies, and surveyors. All producers serve policy makers. These include internal departments, the Montana Legislature, county commissioners, interest groups and the U.S. Congress. Examples of internal departments served by producers are the treasurer, planning, weed and mosquito, environmental health, chamber of commerce and fire district. Every producer serves the general public. Categories of other government agencies served are other local governments, state and federal agencies and the tribes. A local government example from the interviews is the City of Bozeman. State agency examples include Montana Department of Revenue, Montana Department of Natural Resources and Conservation and Montana Fish Wildlife and Parks. Federal agency examples include the U.S. Forest Service (USFS), BLM, U.S. Department of Defense, Environmental Protection Agency (EPA) and the Natural Resource Conservation Service (NRCS).
Figure 19 Producers Desired Level of Data Currency
0% 20% 40% 60% 80% 100%
Daily
3 Days
Weekly
Monthly
2 or 3 Months
Quarterly
Semi-Annually
Annually
Historic
AttributesParcel Lines
19
Except for the Montana Department of Revenue, BLM and the USFS, most producers are creating and maintaining cadastral information with 1 full-time equivalent (FTE). Two producers have less than 1 FTE devoted to cadastral production, with one at 0.1 FTE and another 0.75 FTE. The Montana Department of Administration is using 1.75 FTE. Among the three exceptions that are substantially above 1 FTE, the Department of Revenue has 4 FTE, BLM has 5 FTE and the USFS has 25 FTE.
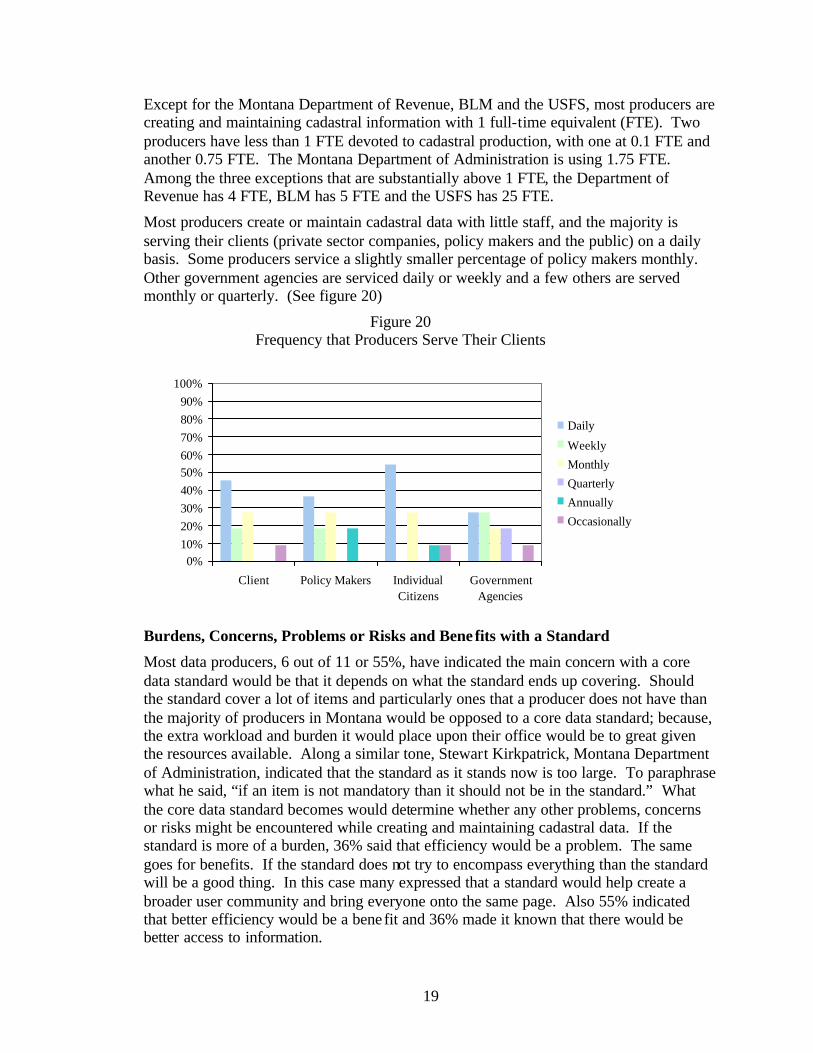
Most producers create or maintain cadastral data with little staff, and the majority is serving their clients (private sector companies, policy makers and the public) on a daily basis. Some producers service a slightly smaller percentage of policy makers monthly. Other government agencies are serviced daily or weekly and a few others are served monthly or quarterly. (See figure 20)
Burdens, Concerns, Problems or Risks and Bene fits with a Standard
Most data producers, 6 out of 11 or 55%, have indicated the main concern with a core data standard would be that it depends on what the standard ends up covering. Should the standard cover a lot of items and particularly ones that a producer does not have than the majority of producers in Montana would be opposed to a core data standard; because, the extra workload and burden it would place upon their office would be to great given the resources available. Along a similar tone, Stewart Kirkpatrick, Montana Department of Administration, indicated that the standard as it stands now is too large. To paraphrase what he said, “if an item is not mandatory than it should not be in the standard.” What the core data standard becomes would determine whether any other problems, concerns or risks might be encountered while creating and maintaining cadastral data. If the standard is more of a burden, 36% said that efficiency would be a problem. The same goes for benefits. If the standard does not try to encompass everything than the standard will be a good thing. In this case many expressed that a standard would help create a broader user community and bring everyone onto the same page. Also 55% indicated that better efficiency would be a benefit and 36% made it known that there would be better access to information.
Figure 20 Frequency that Producers Serve Their Clients
0%10%20%30%40%50%60%70%80%90%
100%
Client Policy Makers IndividualCitizens
GovernmentAgencies
Daily
Weekly
Monthly
Quarterly
Annually
Occasionally
20
Needs or Requirements of Core Data
The proposed FGDC Cadastral Core Data Standard would cover six sections. These are spatial reference, cadastral reference, core attributes, core plus attributes and assessment metadata. Spatial reference deals with the geodetic and geographic control necessary to reference the parcels to a real world coordinate system. Cadastral reference is concerned with fitting the parcels into a continuous and related fabric. Put simply the cadastral reference section would be concerned with referencing where one parcel is in comparison with a different parcel, PLSS section corner, road or stream. The core attributes are those that would be considered mandatory information that always is with the parcel and would permit cadastral data to be integrated across jurisdictions. These would be available with a join to an external database. Core plus attributes add value to parcels and the information is typically provided by an external database. Assessment metadata is additional information that should be provided in the metadata that indicates how the value of the property was established. Users where divided into those that are involved in economic development, emergency response and those who do not do either and are basic users. These users, producers and federal agencies were asked, in most sections, about having and the value for the different elements of that section. The purpose is to determine the requirements for core data. These requirements will help to establish what Montana’s recommendations are for the FGDC core data standard. Other information presented earlier, particularly the concerns expressed by the producers, played a role in the recommendations. Users were also presented with a question about what types of ancillary data they used in conjunction with parcels. Ancillary data uses can help in determining whether the core plus section should be expanded.
Basic Downstream Users
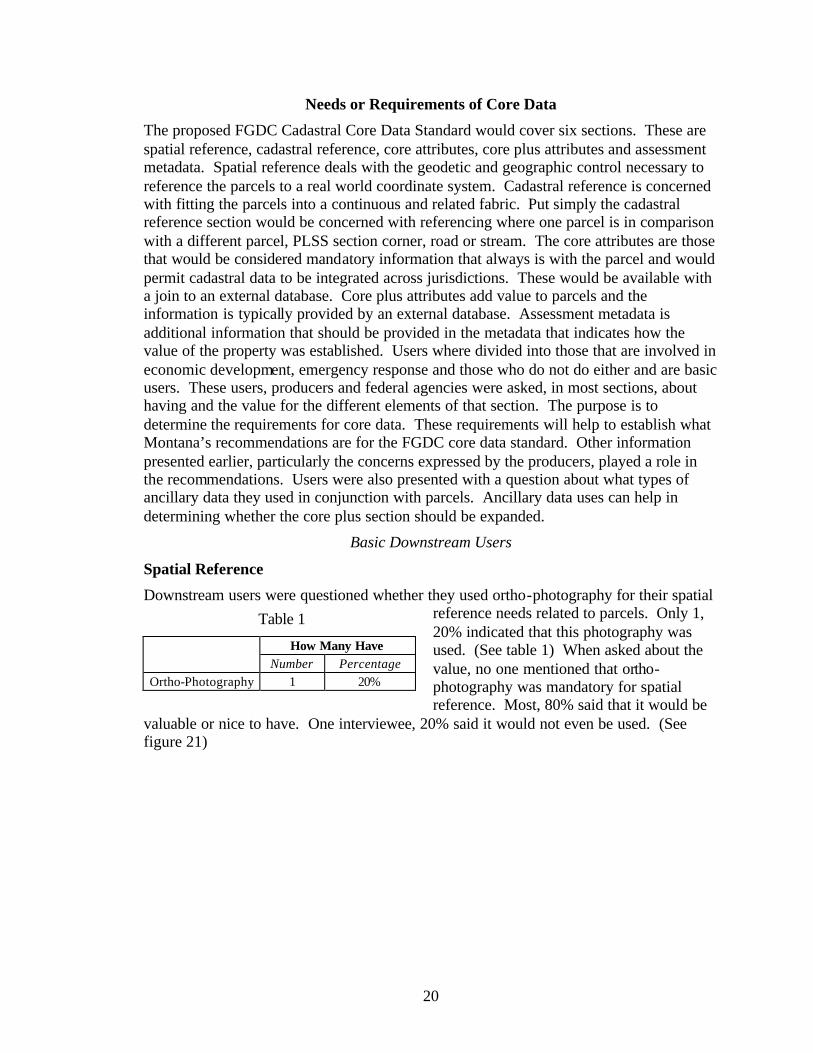
Spatial Reference
Downstream users were questioned whether they used ortho-photography for their spatial reference needs related to parcels. Only 1, 20% indicated that this photography was used. (See table 1) When asked about the value, no one mentioned that ortho-photography was mandatory for spatial reference. Most, 80% said that it would be
valuable or nice to have. One interviewee, 20% said it would not even be used. (See figure 21)
Table 1
How Many Have Number Percentage Ortho-Photography 1 20%

21
Cadastral Reference
The first subsection of cadastral reference deals with corners of common usage. Users were asked how important section or quarter-quarter section corners are to their business processes. None answered mandatory. Both for section and quarter-quarter section corners, the responses were 50% saying the item was valuable and 50% saying these would not be used. (See figure 22)
Subsection two is grid or cell reference systems. Downstream users gave responses to the value of the PLSS and census boundaries (tracts, block groups or blocks) as cadastral reference. The PLSS was mandatory for 60% and valuable for the remaining 40%. Census boundaries would not, on the other hand, be used for reference by anyone. (See figure 23)
Figure 21 Basic Downstream Users: Requirement for Spatial Reference
0% 20% 40% 60% 80% 100%
Ortho-Photography
Do Not Use
Nice to Have
Valuable
Figure 22 Basic Downstream Users: Requirements for Corners of Common Usage
(* = Only 4 Responses)
0% 20% 40% 60% 80% 100%
SectionCorners*
Quarter-QuarterSection
Corners*Do Not UseValuable

22
Third subsection was hydrography information. Rather than ask about the importance of hydrography features in general, the distinction was made between 1:24,000 and 1:100,000 scale data as well as GCDB meanders. The use of 1:24,000 data was valuable as reference for 60% and 1:100,000 data was nice to have for 40%. A majority, 60%, would not use the GCDB meanders. (See figure 24)
The final subsection of cadastral reference is significant cadastral reference features, such as county boundaries, transportation and school districts. In addition to these items the users were asked the value of subdivision boundaries and legislative districts. Similar to hydrography data, transportation was subdivided into 1:24,000 and 1:100,000 scale data as well as Global Positioning System (GPS) features. A total of 40% indicated that county boundaries are mandatory or valuable. The majority would not use school or legislative districts for cadastral reference. A subdivision boundary would be a nice to have feature for most, for cadastral reference. Any transportation feature is overwhelmingly a valuable item to have for reference. (See figure 25)
Figure 23 Basic Downstream Users: Requirements for Grid or Cell Reference Systems
0% 20% 40% 60% 80% 100%
Public LandSurvey System
CensusBoundaries
Do Not UseValuableMandatory
Figure 24 Basic Downstream Users: Requirements for Hydrography Features
0% 20% 40% 60% 80% 100%
1:24,000
1:100,000
GCDBmeanders
Do Not UseNice to HaveValuableMandatory

23
Core Attributes
Users were questioned whether they had and how important the following items are as core parcel attributes: Parcel Outline, Parcel Centroid, Parcel ID, Owner Type or
Classification and an Indicator of Parcel Improvement. All users said they had a parcel outline, parcel identifier and owner type information. Only 1 user, or 20%, had either a parcel centroid or indicator of parcel improvement. (See table 2) Not surprising, the value for all users of a parcel outline and identifier is mandatory. Most, 80%, indicate that an owner type or classification is mandatory. An indication of improvement would be a valuable
attribute for 40% of users and all users either said a parcel centroid was nice to have or they would not use a parcel centroid. (See figure 26)
Figure 25 Basic Downstream Users: Requirements for Significant Cadastral Reference
Features (* = Only 4 Responses)
0% 20% 40% 60% 80% 100%
County Boundaries
SubdivisionBoundaries*
LegislativeDistricts
School Districts
1:24,000Transportation*
1:100,000Transportation*
GPSTransportation*
Do Not UseNice to HaveValuableMandatory
Table 2
How Many Have Number Percentage Parcel Outline 5 100% Parcel Centroid 1 20%
Parcel ID 5 100% Owner Type 5 100%
Improved 1 20%

24
Core Plus Attributes
Downstream users were asked how important the owner name, owner address, property address, land value, total value and an improvement value are as value-added (core plus) attributes. To all users, the owner name is mandatory. The majority, 60%, also said that both the owner’s address and property address are mandatory. The remaining users expressed that either address is valuable. On all types of property value information (land, total or improved) an equal percentage, 40%, expressed that this is nice to have or information they would not use. (See figure 27)
Figure 26 Basic Downstream Users: Requirements for Core Attributes
0% 20% 40% 60% 80% 100%
Parcel Outline
ParcelCentroid
Parcel ID
Owner Type
Improved
Do Not Use
Nice to Have
Valuable
Mandatory

25
Assessment Metadata
The user was questioned about whether they had and how important metadata information about a property assessment is to their business processes. Three items make up assessment metadata: the basis for an assessment, factors that go into an assessment analysis and the date of assessment. One user, or 20%, had any of this information. The item was the date of assessment. (See table 3) A majority would not use, or would not find importance, with any of these assessment metadata items. (See figure 28)
Figure 27 Basic Downstream Users: Requirements for Core Plus
Attributes
0% 20% 40% 60% 80% 100
Owner Name
Improved Value
Land Value
Total Value
Owner Address
Property Address
Do Not UseNice to HaveValuableMandatory
Table 3
How Many Have Number Percentage
Basis of an Assessment 0 0%
Factors that go into an Assessment
Analysis 0 0%
Date of Assessment 1 20%

26
Ancillary Data Uses
Users were asked to indicate what additional types of data or information they use with parcels. The list provided to them included: information on the trend of a neighborhoods
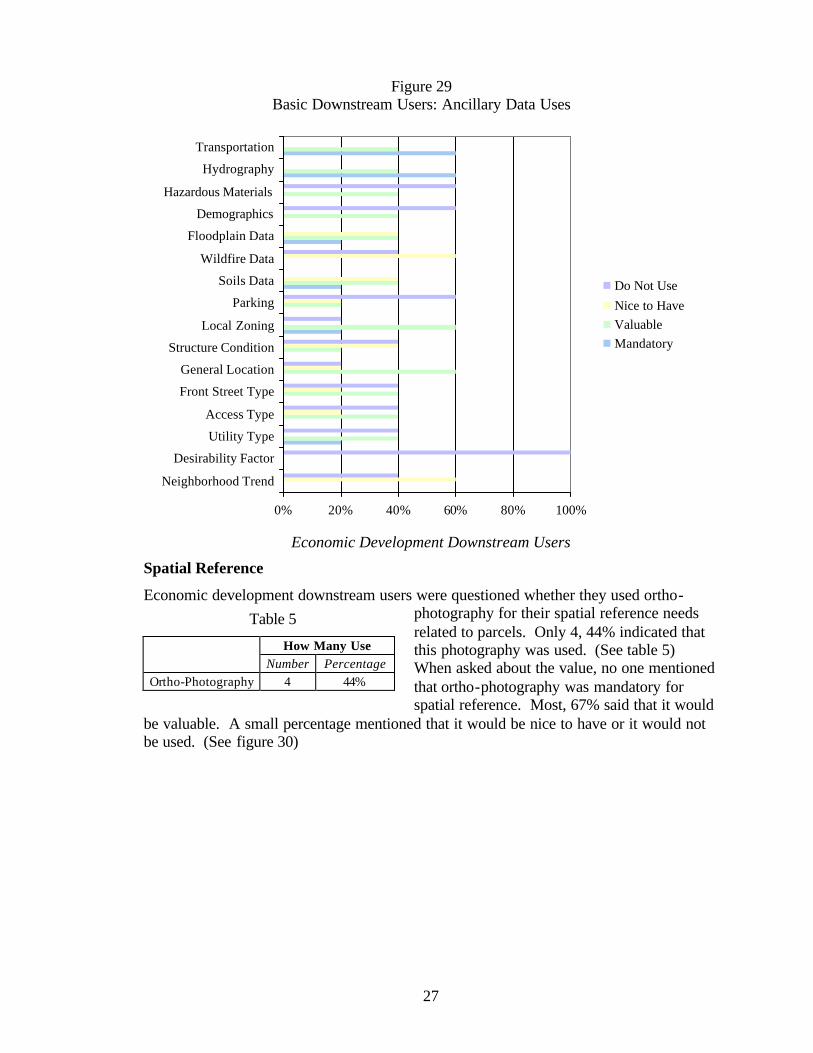
condition, a desirability factor or something that dealt with depreciation, utilities, property access information that dealt with the type of road, type of street in front of a parcel, general location, a structures condition, local zoning information, parking data, soils data, wildfire data, floodplain data, demographics, hazardous materials information, hydrography and transportation. Those used with parcels by 80% are front street, access, general location, soils, floodplain, hydrography and transportation. Most others are used, but not by as large a majority. (See table 4) To users the most important items are hydrography and transportation, which 60% said are mandatory and 40% indicated
were valuable. Local zoning information and a parcel’s general location were both seen as valuable to 60%. Parking and desirability factor are not important and not used by many. (See figure 29)
Figure 28 Basic Downstream Users: Requirements for Assessment Metadata
0% 20% 40% 60% 80% 100%
Basis of anAssessment
Factors thatgo into an
AssessmentAnalysis
Date ofAssessment
Do Not UseNice to HaveValuable
Table 4
Is The Ite m Used Number Percentage
Neighborhood Trend 1 20% Desirability Factor 1 20%
Utility Type 3 60% Access Type 4 80%
Front Street Type 4 80% General Location 4 80%
Structure Condition 2 40% Local Zoning 3 60%
Parking 1 20% Soils Data 4 80%
Wildfire Data 1 20% Floodplain Data 4 80% Demographics 1 20%
Hazardous Materials 0 0% Hydrography 4 80%
Transportation 4 80%
27
Economic Development Downstream Users
Spatial Reference
Economic development downstream users were questioned whether they used ortho-photography for their spatial reference needs related to parcels. Only 4, 44% indicated that this photography was used. (See table 5) When asked about the value, no one mentioned that ortho-photography was mandatory for spatial reference. Most, 67% said that it would
be valuable. A small percentage mentioned that it would be nice to have or it would not be used. (See figure 30)
Figure 29 Basic Downstream Users: Ancillary Data Uses
0% 20% 40% 60% 80% 100%
Neighborhood Trend
Desirability Factor
Utility Type
Access Type
Front Street Type
General Location
Structure Condition
Local Zoning
Parking
Soils Data
Wildfire Data
Floodplain Data
Demographics
Hazardous Materials
Hydrography
Transportation
Do Not UseNice to HaveValuableMandatory
Table 5
How Many Use Number Percentage Ortho-Photography 4 44%

28
Cadastral Reference
For the corners of common usage subsection of cadastral reference economic development users were asked how important section or quarter-quarter section corners are to their business processes. The largest group indicated that section corners were mandatory. In comparison, a majority, or 56%, said that the quarter-quarter section corners are valuable. (See figure 31)
Subsection two, grid or cell reference systems, economic development downstream users gave responses to the value of the PLSS and census boundaries (tracts, block groups or blocks) as cadastral reference. The PLSS was mandatory for 67% and valuable for the remaining 33%. Census boundaries received about equal percentages for each response
Figure 30 Economic Development Downstream Users: Requirement for Spatial
Reference
0% 20% 40% 60% 80% 100%
Ortho-Photography
Do Not UseNice to HaveValuable
Figure 31 Economic Development Downstream Users: Requirements for Corners of
Common Usage
0% 20% 40% 60% 80% 100%
Section Corners
Quarter-QuarterSection Corners
Do Not UseNice to HaveValuableMandatory

29
(mandatory, valuable, nice to have or do not use), but the highest responses were 33% indicating census boundaries are mandatory and 33% who would not use this item for reference. (See figure 32)
Third subsection, hydrography, asked about the importance of the different types of hydrography features. The use of 1:24,000 data or GCDB meanders would be nice to have as reference for 44%. A majority of 67% thinks that 1:100,000 data would be nice to have. (See figure 33)
The final subsection, significant cadastral reference features, asked the economic development users the value of county and subdivision boundaries, legislative and school districts and transportation data. Many economic development users consider each
Figure 32 Economic Development Downstream Users: Requirements for Grid or Cell Reference
Systems
0% 20% 40% 60% 80% 100%
Public LandSurvey System
CensusBoundaries
Do Not UseNice to HaveValuableMandatory
Figure 33 Economic Development Downstream Users: Requirements for Hydrography
Features
0% 20% 40% 60% 80% 100%
1:24,000
1:100,000
GCDBmeanders
Do Not UseNice to HaveValuableMandatory

30
significant cadastral reference feature a mandatory item. School districts with 78% indicating mandatory is the item with the largest percentage voicing mandatory. County boundaries also show most (56%) indicating mandatory. For most other items, it is a split between mandatory and valuable. (See figure 34)
Core Attributes
Economic development users were questioned whether they had and how important the following items are as core parcel attributes: Parcel Outline, Parcel Centroid, Parcel ID,
Owner Type or Classification and an Indicator of Parcel Improvement. All users said they had a parcel outline and parcel identifier. Two users, or 22%, had a parcel centroid. No one has an indicator of parcel improvement. (See table 6) Not surprising, the value for most economic development users (89%) of a parcel outline is mandatory. Everyone indicates that a parcel identifier is mandatory. Most, 89% indicate that
an improvement indicator would be valuable. An owner type is a mandatory attribute for 56% of economic development users and most said a parcel centroid would not be something they would use. (See figure 35)
Table 6
How Many Have Number Percentage
Parcel Outline 9 100% Parcel Centroid 2 22%
Parcel ID 9 100% Owner Type 7 78%
Improved 0 0%
Figure 34 Economic Development Downstream Users: Requirements for Significant Cadastral
Reference Features (* = 7 responses, ** = 8 responses)
0% 20% 40% 60% 80% 100%
CountyBoundaries
SubdivisionBoundaries*
LegislativeDistricts
School Districts
1:24,000Transportation**
1:100,000Transportation**
GPSTransportation**
Do Not UseNice to HaveValuableMandatory

31
Core Plus Attributes
Economic development downstream users were asked how important the owner name, owner address, property address, land value, total value and an improvement value are as value-added (core plus) attributes. To almost all, the owner’s name or address and the property address are mandatory. On all types of property value information (land, total or improved) most expressed that this is a valuable piece of information and a slightly smaller percentage, from those indicating valuable, said these are mandatory. (See figure 36)
Figure 35 Economic Development Downstream Users: Requirements for Core Attributes
0% 20% 40% 60% 80% 100%
Parcel Outline
Parcel Centroid
Parcel ID
Owner Type
Improved
Do Not Use
Nice to Have
Valuable
Mandatory

32
Assessment Metadata
The economic development user was questioned about whether they had and how important metadata information about a property assessment is to their business processes. These three items again are: the basis for an assessment, factors that go into an assessment analysis and the date of assessment. Two (22%) had the first and third items. Three (33%) had the second item, factors that go into an assessment analysis. (See table 7) A majority would find any of these items nice to have. A
smaller, but still respectable percentage, 33%, of economic development users finds the basis or date of assessment a valuable thing. (See figure 37)
Table 7
How Many Have Number Percentage
Basis of an Assessment 2 22%
Factors that go into an Assessment Analysis 3 33%
Date of Assessment 2 22%
Figure 36 Economic Development Downstream Users: Requirements for Core Plus
Attributes
0% 20% 40% 60% 80% 100%
Owner Name
Improved Value
Land Value
Total Value
Owner Address
Property Address
Do Not Use
Nice to Have
Valuable
Mandatory

33
Ancillary Data Uses
Economic development downstream users were asked to indicate what additional types of data or information they use with parcels. The list provided to them included:
information on the trend of a neighborhoods condition, a desirability factor or something that dealt with depreciation, utilities, property access information that dealt with the type of road, type of street in front of a parcel, general location, a structures condition, local zoning information, parking data, soils data, wildfire data, floodplain data, demographics, hazardous materials information, hydrography and transportation. Items used with parcels by the most (67%) economic development users are utilities, front street, hydrography and transportation. Many others are used by 44% or 56% of those users questioned. (See table 8) The most important items are hydrography, transportation and demographics that over 50% said are mandatory. Most other items have about an equal percentage of some
Table 8
Is It Used Number Percentage
Neighborhood Trend 4 44% Desirability Factor 2 22%
Utility Type 6 67% Access Type 5 56%
Front Street Type 6 67% General Location 5 56%
Structure Condition 4 44% Local Zoning 5 56%
Parking 3 33% Soils Data 4 44%
Wildfire Data 2 22% Floodplain Data 5 56% Demographics 5 56%
Hazardous Materials 3 33% Hydrography 6 67% Transportation 6 67%
Figure 37 Economic Development Downstream Users: Requirements for Assessment
Metadata
0% 20% 40% 60% 80% 100%
Basis of anAssessment
Factors that gointo an
AssessmentAnalysis
Date ofAssessment
Do Not Use
Nice to Have
Valuable
Mandatory

34
combination of mandatory, valuable or nice to have. Except for general location, the all other items have smaller percentages for do not use. (See figure 38)
Emergency Response Downstream Users
Spatial Reference
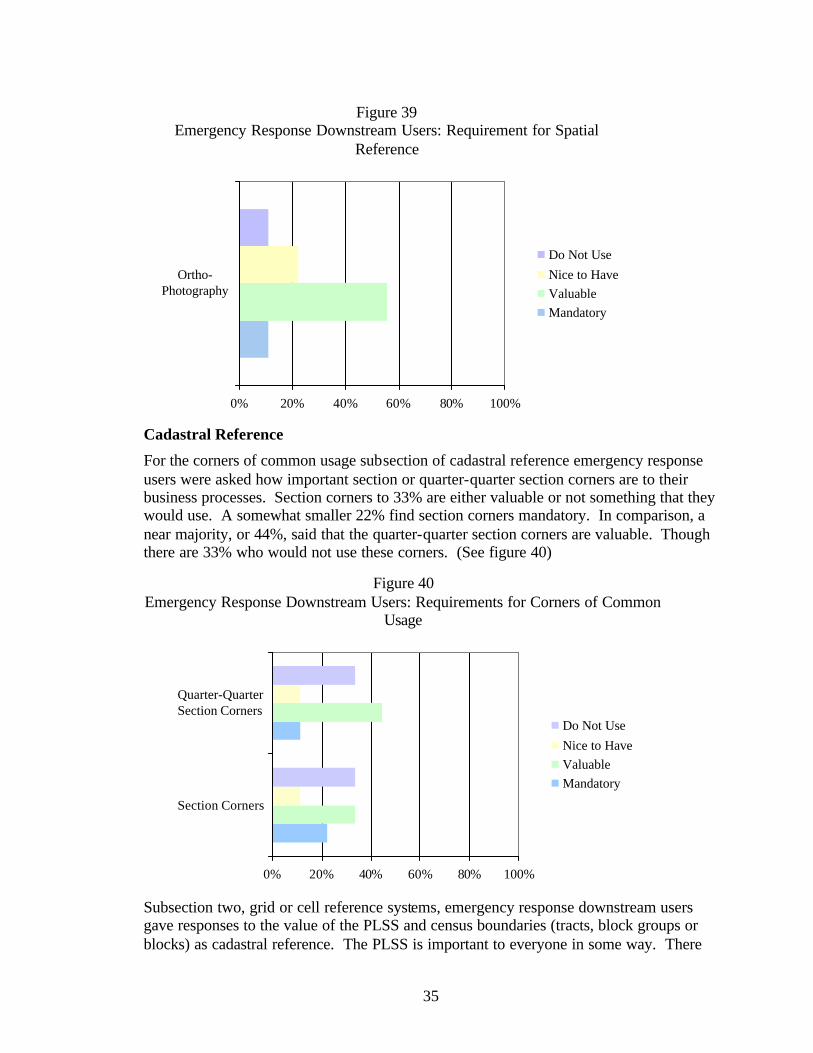
Emergency response downstream users were questioned whether they used ortho-photography for their spatial reference needs related to parcels. Only 4, 44% indicated that this photography was used. (See table 9) When asked about the value, only one (11%) mentioned that ortho-photography was
mandatory for spatial reference. A majority, 56%, said that it would be valuable. A smaller percentage (22%) mentioned that it would be nice to have. Few said they would not use it for spatial reference. (See figure 39)
Figure 38 Economic Development Downstream Users: Ancillary Data Needs
0% 20% 40% 60% 80% 100%
Neighborhood Trend
Desirability Factor
Utility Type
Access Type
Front Street Type
General Location
Structure Condition
Local Zoning
Parking
Soils Data
Wildfire Data
Floodplain Data
Demographics
Hazardous Materials
Hydrography
Transportation
Do Not UseNice to HaveValuableMandatory
Table 9
How Many Use Number Percentage Ortho-Photography 4 44%
35
Cadastral Reference
For the corners of common usage subsection of cadastral reference emergency response users were asked how important section or quarter-quarter section corners are to their business processes. Section corners to 33% are either valuable or not something that they would use. A somewhat smaller 22% find section corners mandatory. In comparison, a near majority, or 44%, said that the quarter-quarter section corners are valuable. Though there are 33% who would not use these corners. (See figure 40)
Subsection two, grid or cell reference systems, emergency response downstream users gave responses to the value of the PLSS and census boundaries (tracts, block groups or blocks) as cadastral reference. The PLSS is important to everyone in some way. There
Figure 39 Emergency Response Downstream Users: Requirement for Spatial
Reference
0% 20% 40% 60% 80% 100%
Ortho-Photography
Do Not UseNice to HaveValuableMandatory
Figure 40 Emergency Response Downstream Users: Requirements for Corners of Common
Usage
0% 20% 40% 60% 80% 100%
Section Corners
Quarter-QuarterSection Corners
Do Not UseNice to HaveValuableMandatory

36
are 33% for mandatory, 33% valuable and 33% nice to have. Emergency response users consider census boundaries important, unlike other users. Census boundaries had 44% that consider them mandatory. A total of 33% find this item valuable. Over 70% of emergency response finds them very important. (See figure 41)
Third subsection, hydrography, asked about the importance of the different types of hydrography features. Most (44%) consider the use of 1:24,000 data as nice to have for reference. A total of 33% think that 1:100,000 data and GCDB meanders would be nice to have or mandatory. A few more, 22%, would not choose to utilize GCDB meanders as a hydrography feature. (See figure 42)
Figure 41 Emergency Response Downstream Users: Requirements for Grid or Cell
Reference Systems
0% 20% 40% 60% 80% 100%
Public LandSurvey System
CensusBoundaries
Do Not UseNice to HaveValuableMandatory

37
The final subsection, significant cadastral reference features, asked the emergency response users the value of county and subdivision boundaries, legislative and school districts and transportation data. Emergency response users almost unanimously deem county and subdivision boundaries and GPS or 1:100,000 scale transportation features as mandatory cadastral reference items. The differences between responses on the other items are not as great. A noteworthy comment, 44% would not use legislative districts. (See figure 43)
Figure 42 Emergency Response Downstream Users: Requirements for Hydrography
Features
0% 20% 40% 60% 80% 100%
1:24,000
1:100,000
GCDBmeanders
Do Not UseNice to HaveValuableMandatory

38
Core Attributes
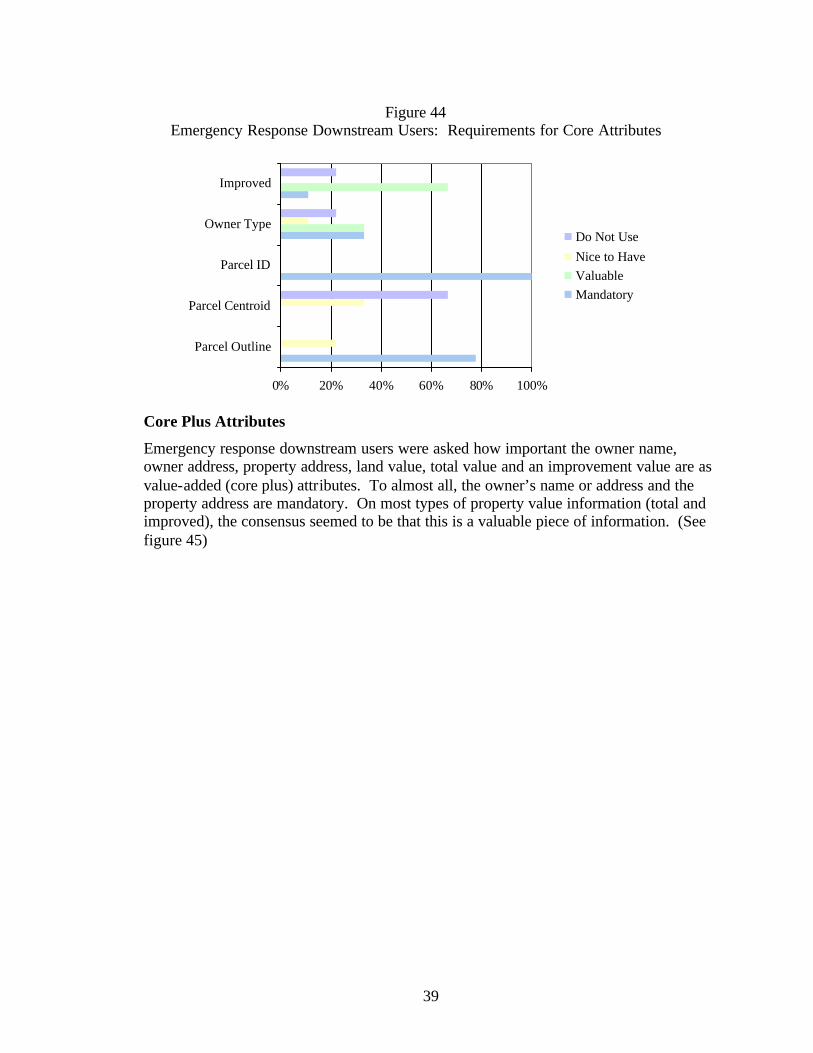
Emergency response users were questioned whether they had and how important the following items are as core parcel attributes: Parcel Outline, Parcel Centroid, Parcel ID,
Owner Type or Classification and an Indicator of Parcel Improvement. All users said they had a parcel identifier. Except for one user, all had a parcel outline. No one has a parcel centroid. Just one has an indicator of parcel improvement. Only some interviewees had an owner type. (See table 10) Not surprising, the value for most emergency response users (78%) of a parcel outline is mandatory. Everyone indicates that a parcel
identifier is mandatory. Most, 67% indicate that an improvement indicator would be valuable. These users are split between an owner type being mandatory or valuable. Most, 67%, say that a parcel centroid is not something their office would use. (See figure 44)
Table 10
How Many Have Number Percentage
Parcel Outline 8 89% Parcel Centroid 0 0%
Parcel ID 9 100% Owner Type 6 67%
Improved 1 11%
Figure 43 Emergency Response Downstream Users: Requirements for Significant Cadastral
Reference Features (* = 7 responses, ** = 8 responses)
0% 20% 40% 60% 80% 100%
County Boundaries
SubdivisionBoundaries*
Legislative Districts
School Districts
1:24,000Transportation**
1:100,000Transportation**
GPSTransportation**
Do Not UseNice to HaveValuableMandatory
39
Core Plus Attributes
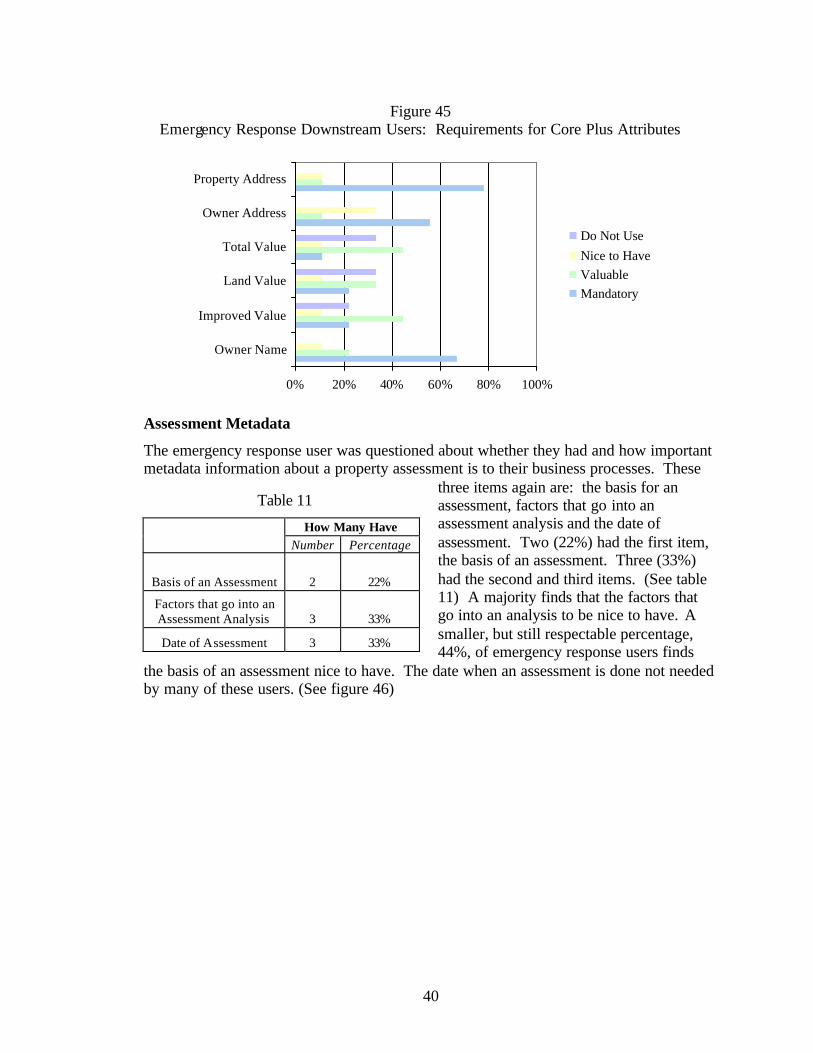
Emergency response downstream users were asked how important the owner name, owner address, property address, land value, total value and an improvement value are as value-added (core plus) attributes. To almost all, the owner’s name or address and the property address are mandatory. On most types of property value information (total and improved), the consensus seemed to be that this is a valuable piece of information. (See figure 45)
Figure 44 Emergency Response Downstream Users: Requirements for Core Attributes
0% 20% 40% 60% 80% 100%
Parcel Outline
Parcel Centroid
Parcel ID
Owner Type
Improved
Do Not UseNice to HaveValuableMandatory
40
Assessment Metadata
The emergency response user was questioned about whether they had and how important metadata information about a property assessment is to their business processes. These
three items again are: the basis for an assessment, factors that go into an assessment analysis and the date of assessment. Two (22%) had the first item, the basis of an assessment. Three (33%) had the second and third items. (See table 11) A majority finds that the factors that go into an analysis to be nice to have. A smaller, but still respectable percentage, 44%, of emergency response users finds
the basis of an assessment nice to have. The date when an assessment is done not needed by many of these users. (See figure 46)
Table 11
How Many Have Number Percentage
Basis of an Assessment 2 22%
Factors that go into an Assessment Analysis 3 33%
Date of Assessment 3 33%
Figure 45 Emergency Response Downstream Users: Requirements for Core Plus Attributes
0% 20% 40% 60% 80% 100%
Owner Name
Improved Value
Land Value
Total Value
Owner Address
Property Address
Do Not UseNice to HaveValuableMandatory

41
Ancillary Data Uses
Emergency response downstream users were asked to indicate what additional types of data or information they use with parcels. The list provided to them included:
information on the trend of a neighborhoods condition, a desirability factor or something that dealt with depreciation, utilities, property access information that dealt with the type of road, type of street in front of a parcel, general location, a structures condition, local zoning information, parking data, soils data, wildfire data, floodplain data, demographics, hazardous materials information, hydrography and transportation. Items used with parcels by all emergency response users are hydrography and transportation. Many others are used by 67% or 56% of those users questioned. (See table 12) The most important items are hydrography, transportation and floodplain data that over 50% said were mandatory. Several other items have about an equal percentage of some combination of mandatory, valuable or nice to have. Two
exceptions are local zoning and a desirability factor that over 40% said they would not use. (See figure 47)
Figure 46 Emergency Response Downstream Users: Requirements for Assessment Metadata
0% 20% 40% 60% 80% 100%
Basis of anAssessment
Factors that gointo an
AssessmentAnalysis
Date ofAssessment
Do Not UseNice to HaveValuable
Table 12
Is It Used Number Percentage
Neighborhood Trend 3 33% Desirability Factor 2 22%
Utility Type 6 67% Access Type 4 44%
Front Street Type 5 56% General Location 6 67%
Structure Condition 2 22% Local Zoning 3 33%
Parking 3 33% Soils Data 3 33%
Wildfire Data 4 44% Floodplain Data 5 56% Demographics 5 56%
Hazardous Materials 5 56% Hydrography 9 100% Transportation 9 100%

42
Data Producers
Spatial Reference
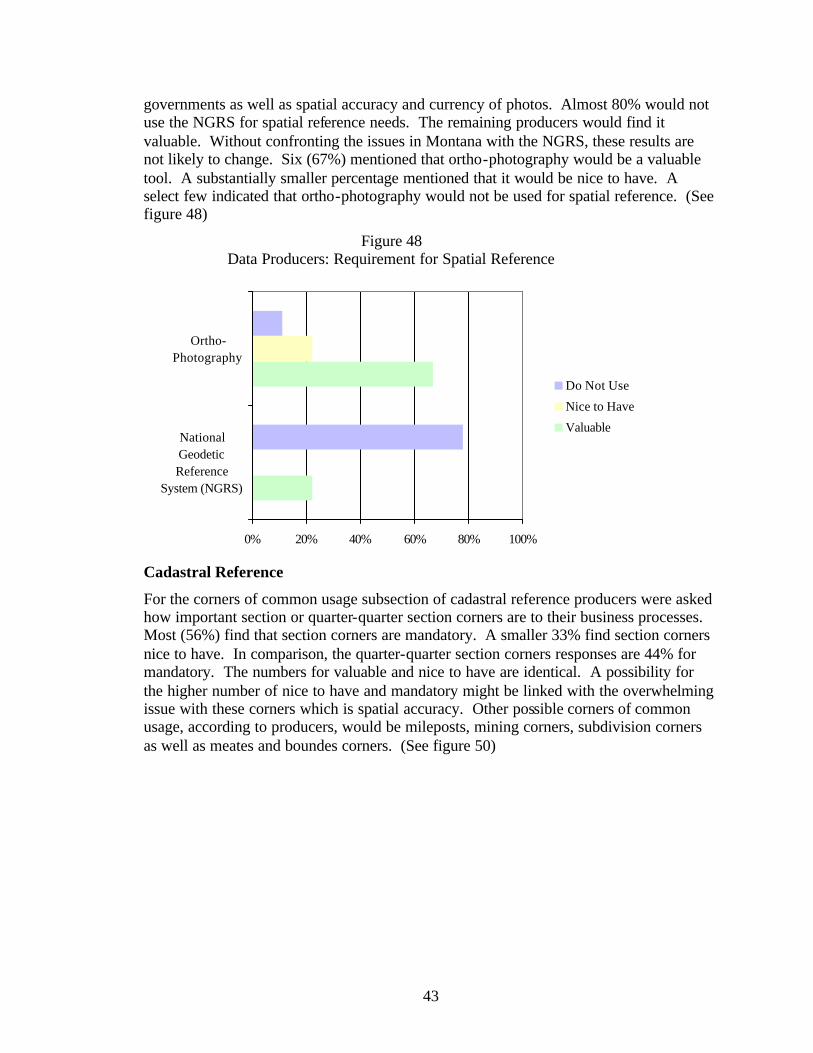
Cadastral data producers were questioned whether they used the National Geodetic Reference System (NGRS) or ortho-photography for their spatial reference needs related to parcels. None use the NGRS. Two issues producers have with NGRS is insuring good spatial control and having more densification of points. Also, with a few not being sure what NGRS is, explains the
lack of use in Montana. Only 4, 44% indicated that ortho-photography was used. (See table 13) Producers mention that the concerns with orthos are the affordability for local
Figure 47 Emergency Response Downstream Users: Ancillary Data Uses
0% 20% 40% 60% 80% 100%
Neighborhood Trend
Desirability Factor
Utility Type
Access Type
Front Street Type
General Location
Structure Condition
Local Zoning
Parking
Soils Data
Wildfire Data
Floodplain Data
Demographics
Hazardous Materials
Hydrography
Transportation
Do Not UseNice to HaveValuableMandatory
Table 13
How Many Use Number Percentage
NGRS 0 0% Ortho-Photography 4 44%
43
governments as well as spatial accuracy and currency of photos. Almost 80% would not use the NGRS for spatial reference needs. The remaining producers would find it valuable. Without confronting the issues in Montana with the NGRS, these results are not likely to change. Six (67%) mentioned that ortho-photography would be a valuable tool. A substantially smaller percentage mentioned that it would be nice to have. A select few indicated that ortho-photography would not be used for spatial reference. (See figure 48)
Cadastral Reference
For the corners of common usage subsection of cadastral reference producers were asked how important section or quarter-quarter section corners are to their business processes. Most (56%) find that section corners are mandatory. A smaller 33% find section corners nice to have. In comparison, the quarter-quarter section corners responses are 44% for mandatory. The numbers for valuable and nice to have are identical. A possibility for the higher number of nice to have and mandatory might be linked with the overwhelming issue with these corners which is spatial accuracy. Other possible corners of common usage, according to producers, would be mileposts, mining corners, subdivision corners as well as meates and boundes corners. (See figure 50)
Figure 48 Data Producers: Requirement for Spatial Reference
0% 20% 40% 60% 80% 100%
NationalGeodeticReference
System (NGRS)
Ortho-Photography
Do Not Use
Nice to Have
Valuable

44
Subsection two, grid or cell reference systems, data producers gave responses to the value of the PLSS and census boundaries (tracts, block groups or blocks) as cadastral reference. The PLSS is mandatory for all. All that good be mentioned about the PLSS that is a concern is the spatial accuracy. Some producers (33%) consider census boundaries mandatory, but over 40% would not use census boundaries. Those issues that must be dealt with concerning census boundaries is that they are not coincident with parcels and are not a true representation of reality. The comment was made that the census should build the data using local governments information. One producer said another grid reference system that could be used is latitude and longitude. (See figure 51)
Figure 50 Data Producers: Requirements for Corners of Common Usage
0% 20% 40% 60% 80% 100%
Section Corners
Quarter-QuarterSection Corners
Do Not UseNice to HaveValuableMandatory

45
Third subsection, hydrography, asked about the importance of the different types of hydrography features. Analyzing the information points out that 1:100,000 and 1:24,000 data are nice to have for many producers. If 1:24,000 were available statewide than an additional 44% would find these valuable. No one response stands out for GCDB meanders. One producer mentioned that watersheds could be used as a hydrography feature. (See figure 52) The issue with 1:100,000 data and GCDB meanders was the accuracy. Several mentioned that GCDB meanders are outdated and based on historic information, which is an issue and/or concern.
The final subsection, significant cadastral reference features, asked the producer the value of county and subdivision boundaries, legislative and school districts and transportation data. By a large margin, producers deem county and subdivision boundaries a mandatory
Figure 51 Data Producers: Requirements for Grid or Cell Reference Systems
0% 20% 40% 60% 80% 100%
Public LandSurvey System
CensusBoundaries
Do Not UseNice to HaveValuableMandatory
Figure 52 Data Producers: Requirements for Hydrography Features
0% 20% 40% 60% 80% 100%
1:24,000
1:100,000
GCDBmeanders
Do Not UseNice to HaveValuableMandatory

46
cadastral reference feature. School districts are also mandatory by many (56%). GPS collected transportation data would be important to all, but a significant percentage would not use 1:100,000 or 1:24,000 data. Some additional significant cadastral reference features could be building footprints and fire or water quality districts. Issues concerning county boundaries or legislative and school districts are the coincidence with parcels. For 1:100,000 or 1:24,000 data, the concern is the accuracy of the information. The current problem in Montana is statewide availability of good transportation data, but in the future that will change with the GPS collection of roads. (See figure 53)
Core Attributes
Producers were questioned whether they had and how important the following items are as core parcel attributes: Parcel Outline, Parcel Centroid, Parcel ID, Geometry Source Reference, Geometry Source Reference Date, Owner Source Reference, Owner Source Reference Date, Owner Type and an Indicator of Parcel Improvement. All producers said they had a parcel outline and identifier. Only one has a parcel centroid. Two had an indicator of parcel improvement. Most have an owner type. Almost all (78%)
Table 14
How Many Have Number Percentage
Parcel Outline 9 100% Parcel Centroid 1 11%
Parcel ID 9 100% Geometry Source Reference 7 78%
Geometry Source Reference Date 7 78% Owner Source Reference 1 11%
Owner Source Reference Date 0 0% Owner Type 7 78%
Improved 2 22%
Figure 53 Data Producers: Requirements for Significant Cadastral Reference Features
(* = 5 responses, ** = 8 responses)
0% 20% 40% 60% 80% 100%
County Boundaries
SubdivisionBoundaries*
Legislative Districts
School Districts
1:24,000Transportation**
1:100,000Transportation**
GPSTransportation**
Do Not UseNice to HaveValuableMandatory

47
have the Geometry Source Reference information, but Montana producers with one exception do not have any owner source attributes. (See table 14) Not surprising, the value for producers of a parcel outline and identifier is mandatory. Most would either find an improvement indicator valuable (44%) or would not use this information (33%). A majority (67%) finds an owner type valuable. A total of 56% indicate that a parcel centroid is nice to have. The geometry source information is important to a majority of producers, but not the owner source attributes. (See figure 54)
The issue with a parcel outline is overwhelmingly the spatial accuracy. Several issues were mentioned in the interviews, including: insuring standardization between jurisdictions, assigning the number locally rather than receive from MT Department of Revenue, the reuse for different polygons and being sure that the number is unique. A consistently stated issue by many about the owner source attributes is that this is redundant information and that it would be much quicker and easier with regards to maintenance to maintain in an external database. Some also mentioned this same concern with regard to the improvement indicator attribute.
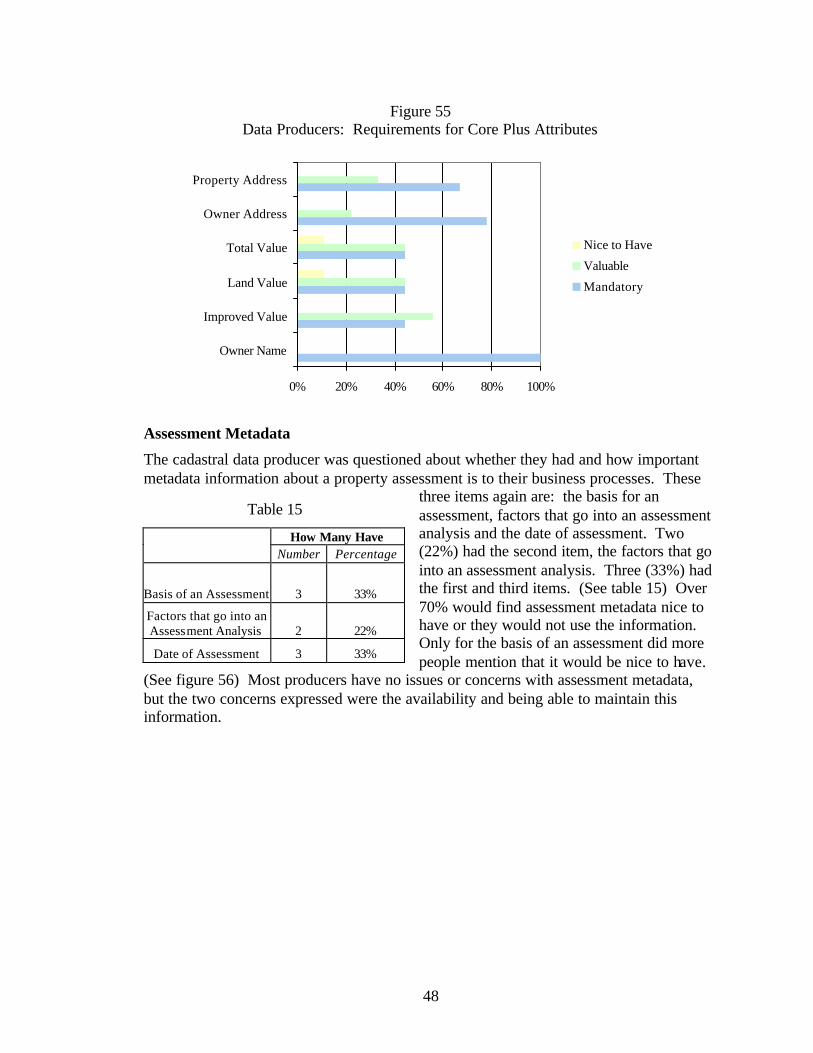
Core Plus Attributes
Data producers were asked how important the owner name, owner address, property address, land value, total value and an improvement value are as value-added (core plus) attributes. To all, the owners name is mandatory. Over 60% said that both a property and owner address is mandatory. Producers are mostly deadlocked between whether a property value (land, total or improved) being either mandatory or valuable. Issues expressed about the owner name were privacy concerns and the length of time to maintain. For property and owner address, privacy and time to maintain were issues, but the accuracy and currency of the information was also an issue. (See figure 55)
Figure 54 Data Producers: Requirements for Core Attributes
0% 20% 40% 60% 80% 100%
Parcel Outline
Parcel Centroid
Parcel ID
Geometry Source Reference
Geometry Source Reference Date
Owner Source Reference
Owner Source Reference Date
Owner Type
Improved
Do Not UseNice to HaveValuableMandatory
48
Assessment Metadata
The cadastral data producer was questioned about whether they had and how important metadata information about a property assessment is to their business processes. These
three items again are: the basis for an assessment, factors that go into an assessment analysis and the date of assessment. Two (22%) had the second item, the factors that go into an assessment analysis. Three (33%) had the first and third items. (See table 15) Over 70% would find assessment metadata nice to have or they would not use the information. Only for the basis of an assessment did more people mention that it would be nice to have.
(See figure 56) Most producers have no issues or concerns with assessment metadata, but the two concerns expressed were the availability and being able to maintain this information.
Table 15
How Many Have Number Percentage
Basis of an Assessment 3 33%
Factors that go into an Assessment Analysis 2 22%
Date of Assessment 3 33%
Figure 55 Data Producers: Requirements for Core Plus Attributes
0% 20% 40% 60% 80% 100%
Owner Name
Improved Value
Land Value
Total Value
Owner Address
Property Address
Nice to Have
Valuable
Mandatory

49
Federal Agencies
The three interviewees that are classified as federal agencies are the USFS Region 1 and the BLM Branch of Cadastral Survey and GIS Department. Those interview questions that dealt with core and core plus were not answered by Mike Birtles, BLM Branch of Cadastral Survey.
Spatial Reference
The three federal government cadastral data producers/users all use ortho-photography for spatial reference purposes. Two of the interviewees ranked the imagery as valuable and the other as nice to have. While the federal government offices in Montana all use ortho-photography for spatial reference, it is important to note that it is not a mandatory item to their cadastral data uses.
Cadastral Reference
All three of these federal offices indicated that section corners are mandatory. Two of these three also mentioned that quarter-quarter section corners are mandatory. The BLM GIS Department thought these corners are valuable and not mandatory.
For subsection two, grid or cell reference systems, the USFS and BLM Branch of Cadastral Survey said that the PLSS is mandatory and the one other response was valuable. The USFS indicated that census boundaries are nice to have, but both BLM offices would not use this data.
In regard to hydrography the only type to be considered mandatory was GCDB meanders, by two of the three. Two of the three would consider 1:24,000 to be valuable and 1:100,000 data as nice to have.
Figure 56 Data Producers: Requirements for Assessment Metadata
0% 20% 40% 60% 80% 100%
Basis of anAssessment
Factors that gointo an
AssessmentAnalysis
Date ofAssessment
Do Not Use
Nice to Have
Valuable
Mandatory

50
With regards to significant cadastral reference features, all three federal government interviewees agreed on the value of school districts as well as 1:24,000 and 1:100,000 transportation data. None would use school districts, which is not surprising. Both types of transportation data are valuable. Two of the three mentioned that county boundaries are mandatory, GPS transportation data is valuable and legislative districts are nice to have. Subdivision boundaries yielded three separate responses.
Core Attributes
Similar to all interviewees, both federal agencies have a parcel outline and identifier and find it mandatory. Only the GIS Department at the BLM has an owner classification. None have a parcel centroid or improvement indicator. The parcel centroid received rankings of valuable and nice to have. An owner type got one mandatory and one valuable from these two interviewees. Both indicated that an improvement indicator would be valuable.
Core Plus Attributes
Both federal agencies agree that an owner name is valuable. On the property value information (land, total and improved) and addresses (property and owner) both agencies are split between valuable and nice to have.
Assessment Metadata
When it comes to assessment metadata, none of the three federal government offices has any of the three pieces of information. These three items again are: the basis for an assessment, factors that go into an assessment analysis and the date of assessment. The GIS Department at the BLM and the USFS Region 1 both consider each of these items to be valuable. The BLM Branch of Cadastral Survey would not use any of this information.
Montana Cadastral Core Data Requirements and Recommendations for a Standard
Montana cadastral data producers and downstream users have and require most components of the proposed FGDC Cadastral Core Data Standard. The following are requirements and recommendations for a cadastral core data standard. Many of the recommendations are driven by the issue raised by many producers that the standard, if it covers to many things and requires them to have items that they do not, would cause more problems, concerns or risks and fewer benefits.
Spatial Reference
Almost no one uses ortho-photography for spatial reference needs. None use or would use the NGRS system, or at least not until there is an effort to create more control points in this region of the country. Spatial reference in Montana is taken care of by referencing to GCDB or for some counties to their own high-quality control points. Producers and downstream users in this state do not require the items within the spatial reference section of the proposed standard.
RECOMMENDATION: With this in mind, the recommendation is that the spatial reference component be split into two sections. One would include the spatial reference components that non-PLSS states should have and use. This section would contain ortho-photography and NGRS. The second section would include spatial components for PLSS

51
states. This section would contain the GCDB. A note should be included in both sections to indicate that if an agency has their own high-quality network of control points that should be used in place of the NGRS or GCDB.
Cadastral Reference
Most producers and downstream users have and use corners of common usage, grid or cell reference systems and significant cadastral reference features. For corners of common usage, the majority of rankings for section and quarter-quarter section corners are valuable or mandatory. Only PLSS is important enough as a grid or cell reference system. The census boundaries would not be used or would be nice to have by many, but certainly are not valuable or mandatory. Montana producers and downstream users in general require hydrography data and seem to deem it valuable, but each producer or user requires a different type of data (GCDB meanders, 1:100,000 or 1:24,000). This is the same way with transportation data. The only other significant cadastral reference features where a majority of responses are mandatory or valuable are county and subdivision boundaries.
RECOMMENDATION: The basic structure of the cadastral reference section should remain mostly the same. That is the corners of common usage, grid or cell reference system and significant cadastral reference features should be kept; except move the hydrography into the significant features. Within the corners of common usage it should be stated that section corners should be used, and if quarter-quarter section corners are available than those should be used also. The grid or cell reference system section should remain intact and based on Montana’s responses census boundaries should not be added. It needs to be mentioned that for significant cadastral reference features at least one of the following is used: county boundaries, subdivision boundaries and the best hydrography or transportation data that is available. School or legislative districts should not be included.
Core Attributes
Montana producers and users require from core data a parcel outline and identifier as well as an owner classification. The parcel centroid is not required and almost no one has a permanent centroid, but a parcel point (such as a label point) would be appropriate and many have. In Montana most have attributes in external databases that could be used as an improvement indicator, but most do not have one with the parcel layer. This is not something that most would require as a core attribute.
RECOMMENDATION: One recommendation is to change the parcel centroid to a parcel point. Another modification is to move the improvement indicator from core to core plus. It should be in the standard, but this attribute would be better in an external database. This would particularly be true for the producers who process parcel splits or combinations. It would make their maintenance a little simpler.
Assessment Metadata
It is not a requirement of core data to have an assessment metadata section. Almost no one has this information and few would consider it mandatory or valuable.
RECOMMENDATION: Based on the Montana pilot, this section should not be a part of the core data standard. At the very least the section should be recommended, but it

52
should not be required that producers and users have this information to be in compliance with a cadastral core data standard.
Core Plus Attributes
The majority of producers and downstream users have said that the owner name and address, property address and value information (total, land and improved) are things that are mandatory or valuable. More seem to indicate that the value information is valuable.
RECOMMENDATION: While a few might not use or only believe that value information is nice to have, it is the recommendation that the core plus attributes, as it stands now, should be the actual core plus section in the FGDC standard. Of course the improvement indicator should be moved to this section from core.
Additional Recommended Core Plus Sections

53
Technical Requirements of Producing, Distributing and Disseminating Core Data

54
Conclusion

55
Appendix A Contact Information for Interviewees
American Public Land Exchange Billings City/County Planning Mark Sommer Candy Beaudry [email protected] [email protected]
BLM GIS Butte-Silver Bow Planning Shelley Johnson Russ Connole [email protected] [email protected]
Confederated Salish-Kootenai Tribes GIS DJ & A Consulting Pete Gillard Mike Mcloud [email protected] [email protected]
DTM Consulting, LLC Geodata Services, Inc. Rene Van Hoven Ken Wall
Global Positions, LLC Governor’s Office of Economic Opportunity Jere Folgert Jason Hanson [email protected] [email protected]
Great Falls City/County Planning Lake County Clerk & Recorders Pat Halcro Diane Adams [email protected] falls.mt.us [email protected]
Lewis & Clark County GIS Lewis & Clark County DES R.J. Zimmer Paul Spenglar [email protected] [email protected]
Missoula County Emergency Management Missoula Department of Public Works Jane Ellis Dan Jordan [email protected] [email protected]
Missoula Redevelopment Agency MT Department of Military Affairs Tod Gass Jens Bolstad [email protected] [email protected]
MT DNRC Fire and Aviation Management Park County Planning John Pilsworth Carrie Harapat [email protected] [email protected]
Water Right Solutions, Inc. BLM Branch of Cadastral Survey David Baldwin Mike Birtles [email protected] [email protected]
Butte-Silver Bow GIS Cascade County GIS Tom Tully Eric Spangenburg [email protected] [email protected]
Gallatin County Clerk & Recorders Missoula County Mapping/GIS Brian Oevermann Doug Burreson [email protected] [email protected]

56
MT Department of Administration MT Department of Revenue Stu Kirkpatrick Ted Chase [email protected] [email protected]
US Forest Service Region 1 Yellowstone County GIS Don Patterson Annette Cabrera [email protected] [email protected]
The participants are located in the major metropolitan centers of Montana. (See figure 1)
Figure 1 Geographic Distribution of Survey Participants
Polson
Missoula
Helena
Great Falls
Butte
Bozeman
Livingston
Billings

57
Appendix B Cost Benefit Analysis of Montana Cadastral Mapping Project Website
Introduction
As a portion of the larger cadastral core data initiative in Montana, a cost-benefit analysis of the Montana Cadastral Mapping Project web page was perceived to be long overdue. The purpose of this study was threefold.
• Quantify what level of efficiency, on average, users of the web service have experienced.
• Demonstrate that the amount of efficiency benefits which have been realized have contributed towards a good return on investment, and short break-even period for the State of Montana.
• Make the point that thousands of individuals, from realtors to other state employees, continue to make use of the site on a daily basis.
Methodology
The chosen tool for this report was the Gillespie Cost-Benefit Model, which can produce both an effectiveness and efficiency benefit. Effectiveness benefits are those arising when Geographical Information System (GIS) applications are used to do a task(s) not previously attempted. Efficiency benefits come about when Geographic Information System (GIS) applications are used to reduce the costs to perform a task(s) previously accomplished by other means. In this instance property research has long been done by manual means; most often by research conducted at local courthouses.
Both types of benefits maybe calculated for a single incident of a GIS application, and one application that produces multiple outputs can create a result for both benefits. Only the efficiency equation was needed for this study, as the web application can only produce one distinct output.
Gillespie Model – Efficiency Equation
RATIO = 0.477 + (0.100INPLEX) – (0.001INTERACT) + (0.051OUTPLEX) + (0.377SMALL) + (0.232COST) – (0.186LAND)
where:
RATIO = ratio that indicates what percentage of the pre-GIS time has been saved by using the GIS application
INPLEX = measure of input complexity = LN (EXTENT)
• EXTENT represents the total study area, expressed in map units. A map unit is the physical area adjusted for the viewing scale. The determination of a map unit is to take the scale factor and divide by the number of square miles that the application covers. For 1:24,000 scale maps, the total number of square miles equals 50.
INTERACT = measure of analysis complexity

58
= 0.5 (MAX2 – MAX)
• MAX equals the total number of relevant data themes overlaid.
OUTPLEX = measure of output complexity = VARIETY/3 + LIKELIHOOD/25
• VARIETY equals the total number of groups of individuals interested in an applications result.
• LIKELIHOOD is the chance that the results of an application will be used in an unfavorably hearing (i.e. lawsuit or challenge of a zoning decision).
SMALL = dummy variable which reflects an applications overall complexity
= 0 or 1
• SMALL is determined by changing 5, including the 4 previous, parameters into a size class.
• SIZE equals the sum of all five size classes and SMALL equals 0 if SIZE is greater than 6, but 1 in all other cases.
• Size Class Determination:
S.C. (1) = LN (EXTENT)
S.C. (2) = LN (VOLUME)
• VOLUME is the quantity of relevant data, reported in megabytes.
S.C. (3) = INTERACT/3
• Note: round up answer to nearest digit
S.C. (4) = VARIETY/3
• Note: round up answer to nearest digit
S.C. (5) = 0,1,2 or 3
• S.C. (5) = 0 when LIKELIHOOD is 0
• S.C. (5) = 1 when LIKELIHOOD is between 1 and 50
• S.C. (5) = 2 when LIKELIHOOD is between 51 and 99
• S.C. (5) = 3 when LIKELIHOOD is 100
COST = dummy variable that indicates cost to perform application with manual (pre-GIS) methods.
• COST = 1 if pre-GIS cost is between $20,000 and $50,000
• COST = 0 in all other cases
LAND = dummy variable that indicates the subject area of an application
• LAND = 1 if application is concerned with economic value of the land

59
• LAND = 0 if application is concerned only with land because it is the location of other activities.
Placing a Dollar Figure on Efficiency Benefits
The result obtained from the Gillespie Model is a ratio indicating the percentage of manual time that is saved by using a GIS application. For example, if the result of the value of RATIO equals 0.75 then the GIS application results in a savings of 75% of the time that it took previously. To quantify this ratio as a dollar amount, divide the number by the per incident manual cost. The result is a net efficiency benefit, indicating how much money is saved on each run of the application. An annual benefit can be calculated by multiplying the frequency (number of times an application is run in a year) by the net benefit per incident.
Determination of a Benefit/Cost Ratio
Going beyond the efficiency benefits and calculating a benefit/cost ratio requires the net annual efficiency benefit be divided by the fixed, one-time installation costs. The fixed costs include any and all costs incurred in setting up an application; some of which are programming time, software and data development time. An example of a possible ratio would be 3.5; this means that for every $1.00 spent the expected return on investment is $3.50.
At What Point Does an Application Pay for Itself?
A break-even point is the year, in the future, when the level of cumulative net benefits exceeds the fixed costs incurred in the first year.
In year one, the net benefits are simply equal to the fixed costs. For year two and beyond, the net benefit is a result of subtracting the annual maintenance costs from the net annual efficiency benefits. A cumulative benefit, which is the running total from year-to-year, is calculated by adding the cumulative benefit from the previous year to the net benefit from the current year. When the cumulative benefit exceeds zero, the application has broken even. For the best determination of the break-even point, discounting must be considered for year two and beyond.
Methodology Approach Used
In order to determine the model parameters 40-45 users were interviewed. These users represent the vast majority of users; included in this group are realtors, financial institutions, state agencies and other private sector businesses. From all the users interviewed, the mean of their responses for each variable was used as the value for that particular parameter. In addition the manual cost, obtained in the interview, was needed to go beyond the equation result.
The frequency of use of the website was derived separate from the interviews. This was derived using web trends; supplied by the Internet Technologies Services Bureau at Information Technology Services Division (ITSD). Web trends are monthly statistics compiled for a particular website. These trends include such basic information as hits, document views and visits. Visits are subdivided into multiple and single visitors. More of the details included in web trends include what pages on a site are visited most, which are the most or least active days and technical data indicating what types of errors visitors

60
encountered and how many times a single error occurred. For the analysis, visitor was the appropriate category to employ since it tracks the length of use of the entire site and not every page view. A visit normally ranges from 3 to 12 minutes. In the case of those doing property research there would be a lot of page views every time the site is used. The appropriate statistic is visitor; because, it compiles only those visitors who use the site for an extended time period and disregards how many pages are viewed. This would be similar to one property researcher visiting a courthouse to research multiple property records.
Before using the visitor categories to calculate a frequency figure, the number of single visitors had to be subtracted from total visits. This also yielded the total times multiple visitors came to the site. The number of multiple visitors visits and total single visitors were then utilized to derive the frequency figure.
The fixed costs associated with getting the entire application ready for publication and the annual costs for maintaining the application were determined by Stewart Kirkpatrick, State GIS Coordinator.
Efficiency Benefits and Benefit/Cost Ratio
The following are the figures, derived both from interviews and web trends, which were inserted into the Gillespie Model. (See table 1)
Using the numbers in table 1, the ratio, net efficiency and net annual efficiency benefit as well as benefit/cost ratio were computed. (See table 2)
Table 1
Value Value INPLEX 0COST 0Extent (Map Units) 1Manual Cost $37.00
Scale 24,000LAND 0Square Miles 36Frequency 215,573INTERACT 0SMALL 1
Data Themes Overla id 1Size Class (1) 0OUTPLEX 0.0080Size Class (2) -5.915Variety 2Volume 0.0027
Likelihood 7Size Class (3) 0Fixed Cost $4,195,000.00Size Class (4) 1Annual Cost $125,000.00Size Class (5) 1
One-Time Cost $4,070,000.00Size -3.915
CAPS = Gillespie Model Variables Italics = Derived Values
Regular Font Style = Mean of Interview Responses

61
With a net annual efficiency benefit of $6.8 million, the annual maintenance costs of $125,000 per year were subtracted to determine a net benefit for year two of $6,238,000. When compared with the approximately $4 million spent to get the website and data set up, it becomes apparent that in year two the Montana Cadastral Mapping Project website will have paid for itself in its efficiency to the Department of Administration staff, other state employees and Montana businesses and taxpayers.
Considerations Noted and Dealt With
The following are considerations where subjectivity had to be employed while running this model, and what was done to correct those concerns.
• The frequency value was not the total number of visitors. Instead it was assumed, to be conservative, that only 70% of the multiple visitors visits were relevant to parcel research and that 35% of the single visitors visits were also relevant. The result was a total visitor count for a year of 215,573. The predicted, actual number of visitors, based on January to August, was 347,369. Even by seriously downplaying the number of visitors, the benefit/cost ratio is still over one.
• Many individuals provided an additional manual cost; which instead of being for trips to the local county courthouse were fo r trips farther away. These costs were dropped from the analysis. The costs dropped out ranged from $100.00 - $1000.00 with a median of $250.00. A more truthful benefit/cost ratio would assume a cost factoring in non- local research trips. In the interests of simplification and a conservative approach these costs were not used. Having kept the cost low by assuming businesses did research locally made the website look less efficient and beneficial than is actually the case.
• The Gillespie Model allows the LAND variable to be either 0 or 1. A change from 0, as was used, to 1 leads to a somewhat different ratio, net and net annual efficiency benefit and benefit/cost ratio. (See table 3) The results remain the same; the website is a highly efficient and valuable investment. Even with the change from 0 to 1 with
the LAND variable, the $5 million plus annual efficiency benefit minus the annual maintenance still results in the website breaking even in the second year. It should be noted that over 85% of responses were 0 for the LAND variable; because, the majority of users do not concern
Table 2
Value
Ratio 0.854Net Efficiency Benefits $31.60Net Annual Efficiency Benefits $6,811,671.70
Benefit/Cost Ratio 1.621
Table 3
Value
Ratio 0.668Net Efficiency Benefits $24.72Net Annual Efficiency Benefits $5,328,099.18
Benefit/Cost Ratio 1.263

62
themselves with the economic value of the property, but instead focus on structural characteristics or ownership, for example.
• When calculating a break-even period, it would not be appropriate to use a net benefit that is found simply by subtracting the annual maintenance from the annual efficiency benefit. For each year after the first year, the efficiency benefit becomes worth less and less. Discounting must be considered for a proper outcome. The answers, calculated earlier, for a break-even period factored in a 7% discount rate.
• In the Gillespie Model a certain extent that the application deals with must be calculated, as well as, how large the data for that area is in megabytes. The website allows a user to click on, research, only one parcel at a time and so a volume of data for a single parcel was plugged into the model equation. A geographical extent must also be specified; this being the area of a map that can be viewed at any one time. On the website when a parcel is researched only one township is vision able, thus the geographical extent is one township. Any results obtained, such as the ones in tables 2 and 3, are the benefits of researching a single parcel. If the application had been constructed to allow the whole state to be viewed at once and information to be calculated about all the parcels or a group of them, than the extent would be larger than a single parcel. Examples of the results from a hypothetical situation where the extent of data would be for all the parcels in Montana are in table 4. Examples of the
results from a hypothetical situation where the extent of data would be by a county are in table 5, using Silver Bow County as an example. These examples represent a higher level of complexity for an application; which, means more time spent processing, but the numbers remain similar to the
current situation. Most importantly, the return would still be substantial for the State of Montana. It should be noted that the LAND variable was zero in these examples.
• The cost benefit analysis was conducted by interviewing individuals and businesses utilizing the web for their work. To insure the survey included a variety of interviewees, individuals and companies were selected from not only major metropolitan areas, but also from rural communities. (See figure 1)
Table 4
Value
Ratio 0.973Net Efficiency Benefits $36.00Net Annual Efficiency Benefits $7,760,839.07
Benefit/Cost Ratio 1.836
Table 5
Value
Ratio 0.748Net Efficiency Benefits $27.68Net Annual Efficiency Benefits $5,966,194.89
Benefit/Cost Ratio 1.406
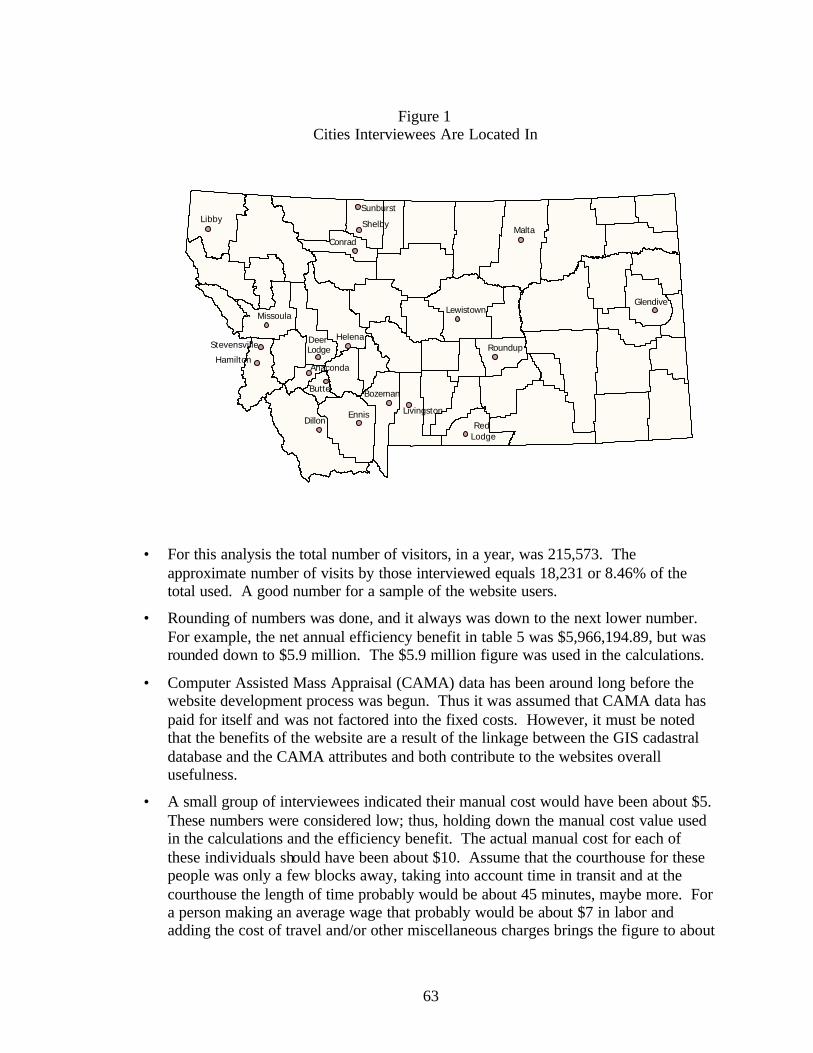
63
• For this analysis the total number of visitors, in a year, was 215,573. The approximate number of visits by those interviewed equals 18,231 or 8.46% of the total used. A good number for a sample of the website users.
• Rounding of numbers was done, and it always was down to the next lower number. For example, the net annual efficiency benefit in table 5 was $5,966,194.89, but was rounded down to $5.9 million. The $5.9 million figure was used in the calculations.
• Computer Assisted Mass Appraisal (CAMA) data has been around long before the website development process was begun. Thus it was assumed that CAMA data has paid for itself and was not factored into the fixed costs. However, it must be noted that the benefits of the website are a result of the linkage between the GIS cadastral database and the CAMA attributes and both contribute to the websites overall usefulness.
• A small group of interviewees indicated their manual cost would have been about $5. These numbers were considered low; thus, holding down the manual cost value used in the calculations and the efficiency benefit. The actual manual cost for each of these individuals should have been about $10. Assume that the courthouse for these people was only a few blocks away, taking into account time in transit and at the courthouse the length of time probably would be about 45 minutes, maybe more. For a person making an average wage that probably would be about $7 in labor and adding the cost of travel and/or other miscellaneous charges brings the figure to about
Figure 1 Cities Interviewees Are Located In
Missoula
Hamilton
Stevensville
Anaconda
Deer Lodge
Butte
DillonEnnis
Bozeman
Lewistown
Malta
RoundupHelena
LibbySunburst
Shelby
Conrad
Livingston
Glendive
Red Lodge

64
$10. Despite the logic against what a small group of interviewees mentioned, the cost that each indicated was used in the analysis. The final results are probably only slightly lower due to these numbers. This was an attempt to maintain a conservative approach; in the unlikely event that the logic behind the assumptions made was not completely correct and that the more realistic cost indeed was what each interviewee indicated.
• The majority of interviewees are realtors, appraisers or other state employees. Others include bankers and title companies. This list of categories of interviewees points out that there are many types of people who use the website.
Conclusion
Interpreting the numbers, in light of the considerations dealt with, indicates the Montana Cadastral Mapping Project website has been and will continue to be an excellent investment for state agencies, private businesses and the Montana taxpayers. No matter what assumptions are made, such as what the LAND parameter should be, changes the results much. The website saves users, on average, at least 65% of the time that it previously took to do the same task. In dollars this is at least $24. Over an entire year the total saved by all users, at least $5.3 million. For the state the return on every dollar spent on the project website is at least $1.25. To be conservative, these numbers are from table 3. It must be remembered that these numbers are very conservative and make the website look less efficient. The actual numbers would be much higher. The Montana Cadastral Mapping Project website is an outstanding investment.

65
Appendix C General Survey For All Interviewees
Cadastral Core Data Initiative Montana Pilot Project
Business Function Information Requirements
Brief Survey Description
We are conducting a cadastral core data survey in hopes of ascertaining the needs and/or requirements, for both producers and users, for cadastral core data. This will allow recommendations to be made for how to modify the present FGDC standard. In addition our hope is to determine any problems/risks or benefits users are having with their cadastral applications and what problems/burdens or benefits that producers would face if the standard were supported by their organization. For user’s applications, we are going to select several as examples that can be run though the Gillespie cost-benefit model. Generally, from a user’s standpoint we are trying to find out how they use cadastral information (parcels). Montana is one of four pilots across the country: the others are Colorado, Florida and North Carolina.
Organization Description
1) What organization is this? a) Name b) Address (Street, State, Zip Code) c) Classification (local, state, federal, private, tribal) d) Contact (Name, Phone, E-Mail)
2) Description of Jurisdiction (Parts b, c and d may not apply to everyone) a) Area Covered/Area of Interest
a. Geographical Extent b. Relative Size (i.e. number of square miles)
b) Population c) Total Number of Parcels d) Level of Growth (compare 1990-2000 Census data)
• High • Medium • Low
Organization’s Environment
3) Business Environment. a) Do you…
a. Create parcel data Yes No b. Publish data Yes No c. Compile data from multiple sources Yes No d. Receive data from others Yes No e. Create value-added products Yes No
66
Appendix D Survey for all Producers
Cadastral Core Data Initiative Montana Pilot Project
Business Function Information Requirements Producers, Publishers and Integrators
Organization Description
1) What are your organization’s top three (3) business functions that require the collection/use of cadastral data? (i.e. what your organizations does in regard to cadastral data?)
• Top Business Function
• Second Business Function
• Third Business Function
2) Specifically, what does this organization do? a) (Create) Update Individual Parcel Data
a. Add New Parcel ID’s or Maintain Existing Parcel ID Integrity b. Add/Update Assessment Information c. Add/Update Address Information d. Maintain other Parcel related attributes (i.e. deed information, land use or
zoning) b) (Create) Develop Parcel Maps
a. Improve Spatial Accuracy (i.e. re-adjusting parcel locations) b. Update Parcel Maps c. Make digital maps
c) (Publish) Provide Access to Parcel Data a. Publish parcel data through the Internet b. Produce hard-copy maps or reports c. Create Web Applications
d) (Integrate) Compile and Integrate Parcel Data from Multiple Sources a. Add additional attributes to information obtained from another source b. Manipulate or Standardize Data from other sources c. Merge data from multiple sources d. Combine parcel data with other information, such as natural resource data e. Perform Quality Control
e) Other

67
3) Data Currency What is your organization’s minimum, current and desired level of currency, both with map (i.e. parcel lines/ID) and attribute (i.e. additional information attached to parcel) data?
Possible Responses (D – Daily, W - Weekly, M - Monthly, SM – 2 or 3 Months, Q – Quarterly, SA – Semi-annual, A - Annually, H - Historic)
Map Data
Attribute Data
Minimum Currently Desired
4) Who are your principle clients? How much staff time is required to maintain/update your data/information so that your clients requests are met with quality data? How frequently do you service them? If you do not have any clients, than skip to question five (5).
Possible Frequency Responses (O - Occasionally, D - Daily, W - Weekly, M - Monthly, Q - Quarterly, A - Annually)
Type Example Staff Frequency Clients (for profit)
Policy Makers/Legislators
Individual Citizens
Other Government Agencies
5) In your role as (producer, publisher and/or integrator), what additional things would you like the capacity to do, but cannot do currently?
a. Add New Parcel ID’s or Maintain Existing Parcel ID Integrity b. Add/Update Assessment Information c. Add/Update Address Information d. Improve Spatial Accuracy (i.e. re-adjusting parcel locations) e. Maintain other Parcel related attributes (i.e. deed information, land use or zoning) f. Update Parcel Maps g. Publish parcel data through FTP or web site h. Produce hard-copy maps or reports i. Create Web Applications j. Add additional attributes to information obtained from another source k. Manipulate or Standardize Data from other sources l. Merge data from multiple sources m. Combine parcel data with other information, such as natural resource data n. Perform Quality Control o. Make digital maps

68
p. Other
6) Generally, what are some barriers that are holding your organization back from being able to do the things in question five?
Imagery Requirements
7) Do you use any type of imagery in your effort to maintain, publish or integrate cadastral data? Yes or No. If no, skip to question nine (9).
8) Answer the following questions for each type of imagery in the table below. a) Do you use this type of imagery? Yes No b) Where do you receive the imagery? c) Is this imagery rectified? Yes No d) What is the scale or pixel size that you use? e) How often is this updated? f) What is your desired scale or pixel size? g) How often would you desire that it be updated? h) How valuable is this to your business operations that use cadastral data? Use the
following scale.
M – Mandatory, V – Valuable, NH – Nice to Have
Type Use? Source Rectified? Scale Update Cycle
Desired Scale
Desired Update Cycle
Value
B & W Photography
Color IR Photography
Ortho-Imagery
Satellite Others
Core Data Components
For each item in the following table, answer question nine (9), ten (10) and eleven (11).
9) Do you have this item? Yes No
10) How important is this item to your business operation? Use the following scale. M – Mandatory, V – Valuable, NH – Nice to Have, DNU – Do Not Use
11) What issues do you see with gathering, converting and exporting this item?

69
(9) (10) (11)
Spatial Reference
National Geodetic Reference System (NGRS)
Ortho- imagery
Cadastral Reference
Corners of Common Usage (CCU) • Section
• Quarter-Quarter
• Other
Grid or Cell Reference System (GRS) • Public Land Survey System
(PLSS)
• Census Boundaries
• Other
Hydrography (Hydro) • 1:24,000 data
• 1:100,000 data
• GCDB meanders
• Other Significant Cadastral Reference Features (CRF)
• County Boundaries
• Subdivision Boundaries
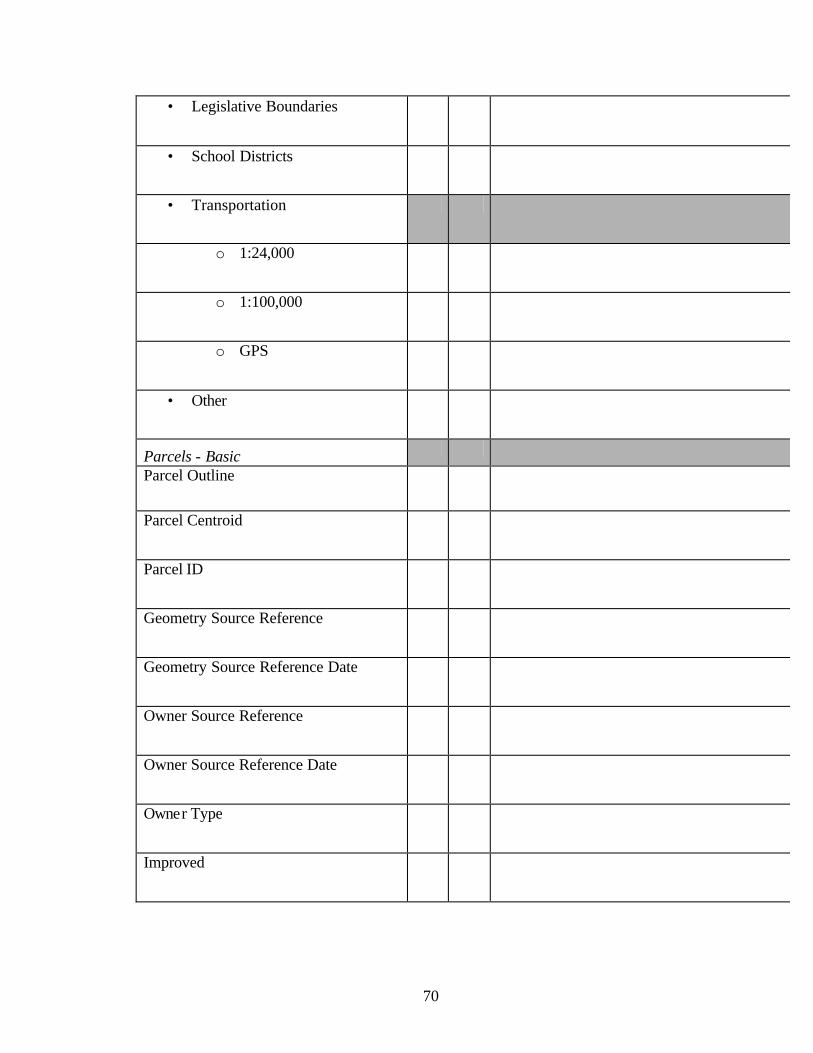
70
• Legislative Boundaries
• School Districts
• Transportation
o 1:24,000
o 1:100,000
o GPS
• Other
Parcels - Basic
Parcel Outline
Parcel Centroid
Parcel ID
Geometry Source Reference
Geometry Source Reference Date
Owner Source Reference
Owner Source Reference Date
Owner Type
Improved

71
Assessment Metadata
Assessment Basis
Values included in Assessment Analysis
When was Assessment Determined
Parcels - Enhanced
Owner Name
Assessment/Value Information • Improved Value
• Land Value
• Total Value
Owner Address
Property Address
12) If your organization were to agree (or support) the core data standard or already agrees (or supports) the standard, what risks would you face, in regard to your maintenance of cadastral data? Select all that apply or describe your problems/risks/concerns.
a. Efficiency (EFF) b. Effectiveness (EFFT) c. Would Hurt Efforts to Protect Privacy (PRIV) d. Providing Quality Documentation Would be a Problem (DOC) e. Would Not Allow Development of New Products f. No Problems (NOP) g. Other
72
13) If your organization were to agree (or support) the core data standard or already agrees (or supports) the standard, how would your maintenance of cadastral data be benefited? Select all that apply or describe your problems/risks/concerns.
a. Efficiency Benefits (EFFB) b. Effectiveness Benefits (EFFTB) c. Would Allow Better Access to Information (ACCESS) d. New Products Could be Developed e. No Benefits (NOB) f. Other
14) Parcel ID Based on National Grid a) If core data were to adopt a new parcel ID, using the National Grid, to replace the
current geocode, would you maintain this ID? Yes No Maybe b) What problems could you see with maintaining this ID or with this new ID, in
general?

73
Appendix E Survey for all Downstream Users
Cadastral Core Data Initiative Montana Pilot Project
Business Function Information Requirements Users
1) Are you involved with economic development or emergency response? a. More contacts in same area of interest
Business Operation Details
2) For each of your top three business operations (overriding principles), answer parts a, b and c for each. Use the table that follows for responding.
a) What are some specific applications of this particular operation? b) What do these applications allow you to do? c) Is this a cost-saving application? If so, approximating how much time does this
save? (i.e. if you now can access information from the web rather than going to the courthouse, how much time is saved?)
Business Operation
Application Allow You to Do Cost Saving?
74
3) What problems are you encountering with the applications? • Efficiency (EFF) • Effectiveness (i.e. you still are unable to do a task since the application has not
been perfected) (EFFT) • Protecting Privacy (PRIV) • Providing Quality Documentation (DOC) • No Problems (NOP) • Others
4) What benefits are you discovering about your applications? • Efficiency Benefits (i.e. tasks can be done faster and/or better) (EFFB) • Effectiveness Benefits (i.e. tasks were not possible before the application)
(EFFTB) • Accessibility to Information (ACCESS) • No Benefits (NOB) • Others
5) What do you do with cadastral data? • Maintain other Parcel related attributes (i.e. deed information, land use or zoning) • Publish parcel data through FTP or web site • Produce hard-copy maps or reports • Create Web Applications • Manipulate or Standardize Data from other sources • Merge data from multiple sources • Combine parcel data with other information, such as natural resource data • Spatial Analysis, such as buffers, mailing addresses or other • Make digital maps • Find a specific parcel or group of parcels based on a query • Provide data quality feedback to data provider • Other

75
6) Data Currency What is your organization’s minimum, current and desired level of currency, both with map (i.e. parcel lines/ID) and attribute (i.e. additional information attached to parcel) data?
Possible Responses (D – Daily, W - Weekly, M - Monthly, SM – 2 or 3 Months, Q – Quarterly, SA – Semi-annual, A - Annually, H - Historic)
Map Data
Attribute Data
Minimum Currently Desired
7) Who are your principle customers? What percentage of your time is spent servicing this type of customer? How frequently do you service them? If you do not have any customers, than skip to question eight (8).
Possible Responses for Frequency (O - Occasionally, D - Daily, W - Weekly, M - Monthly, Q - Quarterly, A - Annually)
Type Example Percentage of Workload
Frequency
Clients (for profit)
Policy Makers/Legislators
Individual Citizens
Other Government Agencies
8) What additional business operations would you like to provide and what would these be delivering to your customers? Who would be the customers and what barriers would you need to overcome in order to implement these things? Use the following table.
Business Operations Deliverables Customers Barriers

76
Spatial Analysis Description
9) For questions b, c and e use the following scale, to answer the question:
8 – Always, 6 – Most of the time, 4 – Sometimes, 2 – Rarely, 0 – Never
a) How many data sources do you use? b) How often do you locate information about just one parcel? c) How often do you locate information about multiple parcels? d) When you locate by multiple parcels, on average how many are you trying to
locate? e) How often do you compare parcels across jurisdictional boundaries?
Spatial Functional Description
10) For each of the following answer question (a) and question (b), if necessary. Use the table below.
20 – Hourly, 18 – Several Times a Day, 16 – Daily, 14 – Several Times a Week, 12 – Weekly, 10 – Several Times a Month, 8 – Monthly, 6 – Several Times a Year, 4 – Yearly, 2 – Less Frequent than Yearly
a) Do you access or search cadastral data by this method? Yes or No b) If yes, how often do you have to do this?
Method Do You Search? How often? Owner Name Owner Address Block Address Range Street Address Subdivision Name Parcel ID Parcel Outline Census Tract Property Centroid Building Centroid Public Land Survey System Other
Imagery Requirements
11) Do you use any type of imagery with cadastral data? Yes or No. If no, skip to question thirteen (13).

77
12) Answer the following questions for each type of imagery in the table below. i) Do you use this type of imagery? j) Where do you receive the imagery? k) Is this imagery rectified, yes or no? l) What is the scale or pixel size that you use? m) How often is this updated? n) What is your desired scale or pixel size? o) How often would you desire that it be updated? p) How valuable is this to your business operations that use cadastral data?
M – Mandatory, V – Valuable, NH – Nice to Have
Type Use? Source Rectified? Scale Update Cycle
Desired Scale
Desired Update Cycle
Value
B & W Photography
Color IR Photography
Ortho-Imagery
Satellite Others
Core Data Components
13) For each item in the list, do you have this item and what is your level of need or how important is it to your business? Using the following scale.
M – Mandatory, V – Valuable, NH – Nice to Have, DNU – Do Not Use
Have? Value
Spatial Reference
Ortho- imagery
Cadastral Reference
Corners of Common Usage (CCU)
• Section • Quarter-Quarter
Grid or Cell Reference System (GRS) • Public Land Survey System • Census Boundaries
Hydrography (Hydro) • 1:24,000 data • 1:100,000 data • GCDB meanders
Significant Cadastral Reference

78
Features (CRF) • County Boundaries • Subdivision Boundaries • Legislative Boundaries • School Districts • Transportation (Trans)
o 1:24,000 o 1:100,000 o GPS
Parcels - Basic
Parcel Outline Parcel Centroid Parcel ID Owner Type Improved
Assessment Metadata
Assessment Basis Values included in assessment analysis When was assessment determined
Parcels - Enhanced
Owner Name Assessment/Value Information
• Improved Value • Land Value • Total Value
Owner Address Property Address
Ancillary Data Needs
14) Answer the following questions for each item. a) Do you use this type of data with your parcels? Yes No b) According to your business functions, how important is this item, in connection
with your use of cadastral data? Using the following scale.
M – Mandatory, V – Valuable, NH – Nice to Have, DNU – Do Not Use Use? Value Neighborhood Trend
Desirability Factor
Utilities

79
Access
Fronting Street
Location
Physical Condition of Structure
Local Zoning Information
Parking
Soils Data
Wildfire Data
Floodplain Data
Demographics (i.e. Ethnicity, Income, etc.)
Hazardous Materials (Public Health Issues)
Hydrography
Transportation
Other