cache creek, bear creek, and harley gulch tmdl for mercury · the bear creek watershed consistently...
TRANSCRIPT
CALIFORNIA ENVIRONMENTAL PROTECTION AGENCY
REGIONAL WATER QUALITY CONTROL BOARD
CENTRAL VALLEY REGION
Cache Creek, Bear Creek, and Harley Gulch TMDL for Mercury
Staff Report
September 2004
State of California
California Environmental Protection Agency
REGIONAL WATER QUALITY CONTROL BOARD CENTRAL VALLEY REGION
Robert Schneider, Chair
Karl E. Longley, Vice Chair Alson Brizard, Member
Lucille Palmer-Byrd, Member Christopher Cabaldon, Member
Robert K. Fong, Member Cher A. Kablanow, Member
Mark Salvaggio, Member
Thomas Pinkos, Executive Officer
11020 Sun Center Drive #200 Rancho Cordova, California 95670-6114
Phone: (916) 464-3291
D I S C L A I M E R
This publication is a technical report by staff of the California Regional Water Quality Control Board, Central Valley Region.
No policy or regulation is either expressed or intended.

CALIFORNIA ENVIRONMENTAL PROTECTION AGENCY
REGIONAL WATER QUALITY CONTROL BOARD CENTRAL VALLEY REGION
Cache Creek, Bear Creek, and Harley Gulch TMDL for Mercury
Staff Report
September 2004
REPORT PREPARED BY:
JANIS COOKE, Environmental Scientist
CHRIS FOE, Senior Environmental Scientist
STACY STANISH, Environmental Scientist
And
PATRICK MORRIS Senior Water Quality Control Engineer

This page intentionally left blank

i
CACHE CREEK, BEAR CREEK, AND HARLEY GULCH MERCURY TMDL
EXECUTIVE SUMMARY
The Central Valley Regional Water Quality Control Board has determined that Cache Creek and Bear Creek are impaired because fish tissue and water from these water bodies contain elevated levels of mercury. Harley Gulch is impaired because of high aqueous concentrations of mercury. The Cache Creek, Bear Creek, and Harley Gulch Total Maximum Daily Load (TMDL) water quality management plan includes: establishment of water quality numeric targets, assessment of pollutant sources, linkage between the numeric target and loads, assignment of load reductions, margins of safety, and a monitoring plan. The goal of this TMDL is to lower mercury levels in the Cache Creek watershed such that human and wildlife health are protected. In addition, because Cache Creek is a primary source of mercury to the Sacramento-San Joaquin Delta Estuary, lowering mercury levels in the Cache Creek watershed will assist in protecting human and wildlife health in the Delta. The TMDL encompasses the 81-mile reach of Cache Creek between Clear Lake Dam and the outflow of Cache Creek Settling Basin, Bear Creek from its headwaters to its confluence with Cache Creek, and the 8-mile length of Harley Gulch.
Numeric Targets for Methylmercury
The beneficial uses of Cache Creek, Bear Creek, and Harley Gulch that are currently unmet due to elevated concentrations of mercury are safe fisheries for humans and wildlife. Methylmercury is the most toxic form of mercury. Methylmercury becomes increasingly concentrated in higher trophic levels of the food web, such that organisms feeding at the top of the food web incur the greatest risk of adverse effects. The methylmercury targets of this TMDL protect humans and wildlife eating fish from these water bodies. Wildlife species potentially at risk from methylmercury in Cache and Bear Creeks include bald eagle (listed federally as threatened) and peregrine falcon (listed by the State as endangered), river otter, American mink, mergansers, grebes and kingfishers. Wildlife species potentially consuming fish from Harley Gulch include small mammals, herons and kingfishers. The numeric targets identified for Cache Creek and Bear Creek are in the form of average methylmercury concentrations in trophic level 3 and 4 fish consumed by raptors and humans:
0.12 mg/kg wet weight in trophic level 3 (TL3) fish 0.23 mg/kg wet weight in trophic level 4 (TL4) fish.
These target concentrations are the averages in fish greater than 150 mm in length. TL3 fish species include bullhead, sunfish, and suckers. TL4 species include catfish, bass, and Sacramento pikeminnow. For humans, the targets would permit safe consumption of about 22-40 gm/day of Cache or Bear Creek fish (3 to 5.4 meals/month).

ii
Because Harley Gulch has no large fish, the above targets are not used. The Harley Gulch preliminary methylmercury target is 0.05 mg/kg wet weight for trophic level 2 and 3 fish that are 50-150 mm in length.
Mercury Sources
Sources of mercury entering the watershed include waste rock and tailings from historic mercury mines, erosion of naturally mercury-enriched soils, geothermal springs and atmospheric deposition. There are multiple inactive mercury mines in the Cache Creek watershed. The Sulphur Bank Mercury Mine contributes mercury to Cache Creek at the Clear Lake outflow. The Sulphur Creek mining district includes eight mines that drain predominately to Bear Creek via Sulphur Creek and four mines in the Bear Creek basin. Harley Gulch receives inputs from the Turkey Run and Abbott mines. The Reed Mine drains to Davis Creek, which is a tributary to Cache Creek. Mercury can be transformed to methylmercury in sediment by sulfate-reducing bacteria.
Cache Creek In Cache Creek, the watershed above Rumsey was the major source of methylmercury. The highest concentrations and production rates were observed below the mercury mines in Harley Gulch, and Sulphur and Bear Creeks and in the canyon above Rumsey. Lower methylmercury concentrations in water were measured in the North Fork and main stem of Cache Creek, which were sites with lower inorganic mercury concentrations in sediment. Sources of total mercury in Cache Creek largely parallel the sources of methylmercury. Most mercury derives from the watershed upstream of Rumsey. Mercury loads from the major and mine-related tributaries (North Fork Cache Creek, Clear Lake outflow, Bear Creek, Harley Gulch, and Davis Creek) contribute 12 percent of the mercury loads measured in Cache Creek at Rumsey. The majority of the inorganic mercury loads are from unnamed sources, which include smaller, unmeasured tributaries and mercury in the creek bed and banks. Existing data indicate that inactive mercury mines located above Rumsey are important secondary sources but do not account for the large volume of highly contaminated material now appearing at Rumsey. Clean sediment entering the watershed below Rumsey acts to dilute sediment mercury concentrations.
Bear Creek The Bear Creek watershed upstream of all mine inputs contributes minimally to the loads of methylmercury and total mercury in Bear Creek. The highest methylmercury concentrations in the Bear Creek watershed consistently occur in Sulphur Creek downstream of the mines and geothermal springs. Sulphur Creek contributes about 40-50% of the methylmercury load in Bear Creek. Most of the remainder of the Bear Creek methylmercury loads appear to be produced within the Bear Creek channel. Approximately half of the total mercury load in Bear Creek comes from Sulphur Creek. Concentrations of mercury in suspended sediment suggest that much of the rest of the mercury load in Bear Creek derives from remobilization of mine waste deposited in the stream bank and

iii
bed. Bear Creek contributes an estimated 17 percent of methylmercury and four percent of total mercury to the Cache Creek loads measured at Rumsey.
Harley Gulch Much of the methylmercury in Harley Gulch is likely produced in a wetland area in the West Branch Harley Gulch, downstream of the inactive mercury mines. Over ninety percent the total mercury load in Harley Gulch is estimated to come from the West Branch. Total mercury loads from the mines may be underestimated due to a lack of data collected during heavy rainfall events. An alluvial fan, possibly containing mine waste, at the Harley Gulch confluence with Cache Creek may contribute to the unknown source of mercury in the Cache Creek canyon. Although concentrations of methylmercury and total mercury are high within Harley Gulch, the watershed contributes less two percent of each of the loads of methylmercury and total mercury in Cache Creek at Rumsey.
Linkage Analysis
The linkage analysis describes the relationship between methylmercury concentrations in water and in large fish. Data collected in 2000 and 2001 show statistically significant relationships between concentrations of methylmercury in water and in benthic invertebrates and between benthic invertebrates and large fish. Regional Board staff calculated an aqueous concentration of methylmercury that corresponds to the numeric target for large TL4 fish based on these relationships. For Cache Creek, the methylmercury concentration goal of 0.06 ng/L represents the best estimate of the annual, median aqueous concentration of methylmercury needed to attain the target of 0.23 mg/kg wet weight in TL4 fish. The same methylmercury aqueous goal is used to attain the targets in Bear Creek. Harley Gulch has no TL4 fish, so the above relationships could not be used. Based on bioaccumulation factors specific to Harley Gulch, the aqueous methylmercury goal for Harley Gulch is 0.09 ng/L. Methylmercury concentrations in the water column are influenced by multiple factors. Significant factors that may be addressed in the Cache Creek watershed are the concentration of total mercury in sediment, rates of methylation versus demethylation, concentrations of sulfate, the relative methylation potential of various mercury compounds, and area of wetlands and water impoundments.
Load Allocations
This TMDL identifies the reduction in methylmercury levels needed to meet the fish tissue targets and the aqueous methylmercury goal. Reductions in existing methylmercury loads were assigned by first determining the reduction needed to attain the aqueous goal within each sub-watershed and then by adjusting loads to ensure that the goals are attained in lower Cache Creek (Table ES-1). The TMDL presents a preliminary plan to reduce mercury and methylmercury loads. Reducing the methylmercury loads will require a multi-faceted approach that includes controlling
iv
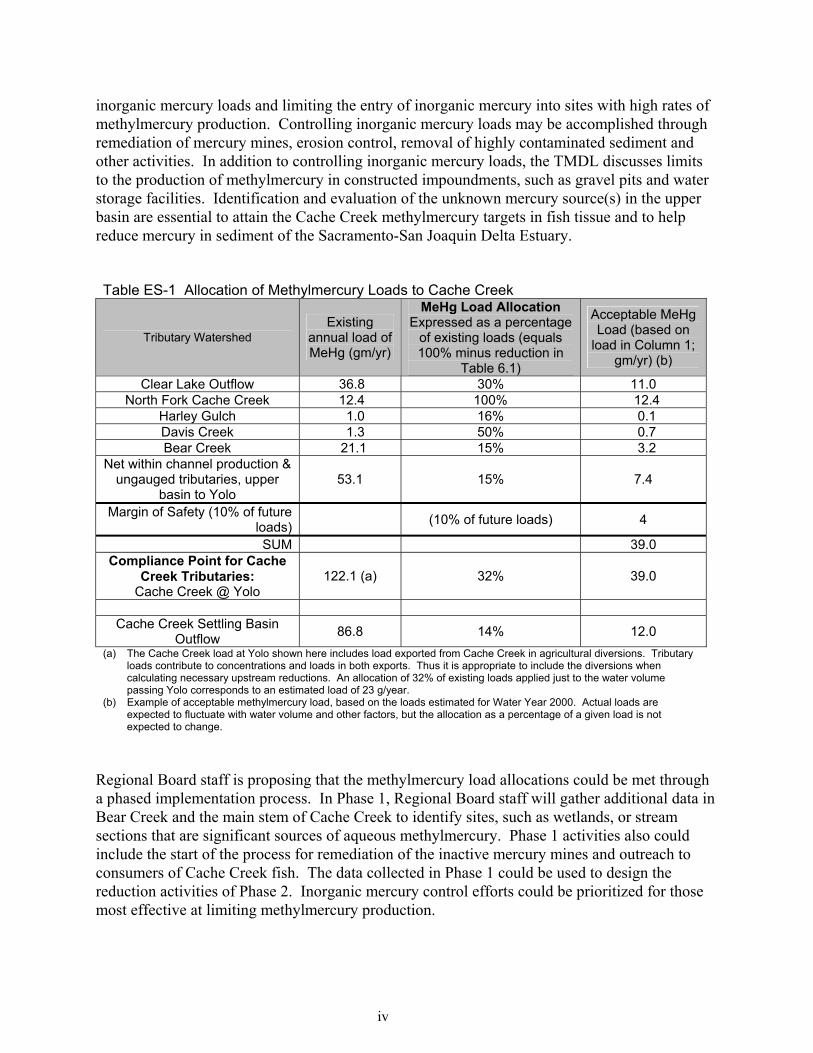
inorganic mercury loads and limiting the entry of inorganic mercury into sites with high rates of methylmercury production. Controlling inorganic mercury loads may be accomplished through remediation of mercury mines, erosion control, removal of highly contaminated sediment and other activities. In addition to controlling inorganic mercury loads, the TMDL discusses limits to the production of methylmercury in constructed impoundments, such as gravel pits and water storage facilities. Identification and evaluation of the unknown mercury source(s) in the upper basin are essential to attain the Cache Creek methylmercury targets in fish tissue and to help reduce mercury in sediment of the Sacramento-San Joaquin Delta Estuary. Table ES-1 Allocation of Methylmercury Loads to Cache Creek
Tributary Watershed Existing
annual load of MeHg (gm/yr)
MeHg Load Allocation Expressed as a percentage
of existing loads (equals 100% minus reduction in
Table 6.1)
Acceptable MeHg Load (based on
load in Column 1; gm/yr) (b)
Clear Lake Outflow 36.8 30% 11.0 North Fork Cache Creek 12.4 100% 12.4
Harley Gulch 1.0 16% 0.1 Davis Creek 1.3 50% 0.7 Bear Creek 21.1 15% 3.2
Net within channel production & ungauged tributaries, upper
basin to Yolo 53.1 15% 7.4
Margin of Safety (10% of future loads) (10% of future loads) 4
SUM 39.0 Compliance Point for Cache
Creek Tributaries: Cache Creek @ Yolo
122.1 (a) 32% 39.0
Cache Creek Settling Basin
Outflow 86.8 14% 12.0 (a) The Cache Creek load at Yolo shown here includes load exported from Cache Creek in agricultural diversions. Tributary
loads contribute to concentrations and loads in both exports. Thus it is appropriate to include the diversions when calculating necessary upstream reductions. An allocation of 32% of existing loads applied just to the water volume passing Yolo corresponds to an estimated load of 23 g/year.
(b) Example of acceptable methylmercury load, based on the loads estimated for Water Year 2000. Actual loads are expected to fluctuate with water volume and other factors, but the allocation as a percentage of a given load is not expected to change.
Regional Board staff is proposing that the methylmercury load allocations could be met through a phased implementation process. In Phase 1, Regional Board staff will gather additional data in Bear Creek and the main stem of Cache Creek to identify sites, such as wetlands, or stream sections that are significant sources of aqueous methylmercury. Phase 1 activities also could include the start of the process for remediation of the inactive mercury mines and outreach to consumers of Cache Creek fish. The data collected in Phase 1 could be used to design the reduction activities of Phase 2. Inorganic mercury control efforts could be prioritized for those most effective at limiting methylmercury production.

v
Methylmercury load allocations for Bear Creek are 20%, 15%, and 10% of the existing loads from Upper Bear Creek, Sulphur Creek, and within-channel production of lower Bear Creek, respectively. The methylmercury load allocation for Harley Gulch in Table ES-1 (16%) applies to the entire length of the stream. To address the inorganic loads entering the stream, Regional Board staff is assigning a load allocation for inorganic mercury to the mine sites. The load allocation assigned to the Abbott and Turkey Run mines is five percent of the existing inputs of total mercury. The allocation is applied to the sum of inputs from both mine areas. The proposed Basin Plan Amendment for mercury in San Francisco Bay assigns a reduction in total mercury loads from the Sacramento-San Joaquin River Delta of 110 kg/yr. Cache Creek is a major source of mercury to the Delta. In order to attain the San Francisco Bay reduction, loads of total mercury exiting Cache Creek should be reduced. Reductions in total mercury loads to the inactive mines in Harley Gulch and the Bear Creek watershed assigned by this TMDL and proposed changes to the Cache Creek Settling Basin, which would increase the mass of mercury retained in the basin, would create significant reductions in loads from Cache Creek.
Margin of Safety
The methylmercury load allocations for Cache Creek and Bear Creek set aside 10% of the future loads of methylmercury as explicit margins of safety to protect the beneficial uses. The recommended numeric targets also contain margins of safety for consumers of fish from Cache Creek, Bear Creek, and Harley Gulch. The USEPA recommended fish tissue criterion is based on consumption of 17.5 g/day of locally caught fish. The proposed TMDL targets would allow consumption of about 22-40 g/day of local fish. The higher consumption rates provide a margin of safety for human consumers.
Basin Planning
The Cache Creek, Bear Creek, and Harley Gulch TMDL will be enacted when amended into the Water Quality Control Plan for the Central Valley Region (Basin Plan). The Regional Board will consider adoption of amendments to the Basin Plan after a public review process. The proposed Basin Plan amendment will include site-specific fish tissue water quality objectives and an implementation plan for reductions of inputs of methylmercury and total mercury. Regional Board staff anticipates proposing a Basin Plan amendment to the Regional Board by June 2005.

vi
TABLE OF CONTENTS
CACHE CREEK, BEAR CREEK, AND HARLEY GULCH MERCURY TMDL ................... i
EXECUTIVE SUMMARY .............................................................................................................. i Numeric Targets for Methylmercury........................................................................................... i Mercury Sources......................................................................................................................... ii Linkage Analysis .......................................................................................................................iii Load Allocations........................................................................................................................iii Margin of Safety ......................................................................................................................... v Basin Planning ............................................................................................................................ v
LIST OF TABLES .......................................................................................................................... ix
List of Acronyms............................................................................................................................. xi
1 Problem statement .................................................................................................................... 1 1.1 Introduction ......................................................................................................................... 1 1.2 Regulatory Background....................................................................................................... 1
1.2.1 Clean Water Act 303(d) Listing and Total Maximum Daily Load Development ..... 1 1.2.2 Porter-Cologne Basin Plan Amendment Process and Time Schedule....................... 2
1.3 Units and Terms Used in this Report .................................................................................. 2 1.4 TMDL Scope and Watershed Characteristics ..................................................................... 5 1.5 Toxicity of Mercury ............................................................................................................ 7
1.5.1 Mercury Accumulation in Biota ................................................................................ 7 1.5.2 Human Health ............................................................................................................ 7 1.5.3 Wildlife Health......................................................................................................... 10
1.6 Beneficial Uses and Applicable Standards........................................................................ 10 1.6.1 Beneficial Uses ........................................................................................................ 10 1.6.2 Water Quality Objectives......................................................................................... 11
1.7 Available Monitoring Data................................................................................................ 13 1.7.1 Fish Tissue Data....................................................................................................... 14 1.7.2 Water Data ............................................................................................................... 14
2 Numeric Targets ..................................................................................................................... 16 2.1 Selection of the Type of Target ......................................................................................... 16
2.1.1 Fish Tissue ............................................................................................................... 16 2.1.2 Other Biota, Water and Sediment ............................................................................ 16
2.2 Fish Tissue Target Equation and Development................................................................. 17 2.2.1 Fish Target Equation and Variables......................................................................... 17 2.2.2 Comparison of Human and Wildlife Targets........................................................... 18
2.3 Wildlife Health Targets ..................................................................................................... 19 2.3.1 Reference Doses....................................................................................................... 19 2.3.2 Body weights and Consumption Rates .................................................................... 19 2.3.3 Safe Fish Tissue Levels of Mercury for Wildlife Protection................................... 22
2.4 Wildlife Health Targets for Cache and Bear Creeks ......................................................... 28 2.5 Human Health Targets for Cache and Bear Creeks........................................................... 29
2.5.1 Acceptable Daily Intake Level ................................................................................ 30
vii
2.5.2 Body Weight and Portion Size................................................................................. 30 2.5.3 Consumption Rate.................................................................................................... 31 2.5.4 Consumption of Fish from Various Trophic Levels and Sources............................ 31 2.5.5 Estimated Safe Human Consumption Rates in Cache and Bear Creeks.................. 32
2.6 Harley Gulch Numeric Target ........................................................................................... 33 2.7 Numeric Targets Summary................................................................................................ 35
3 Source Analysis ....................................................................................................................... 36 3.1 Introduction ....................................................................................................................... 36 3.2 Water Budget..................................................................................................................... 36
3.2.1 Cache Creek ............................................................................................................. 37 3.2.2 Bear Creek ............................................................................................................... 41 3.2.3 Harley Gulch............................................................................................................ 43
3.3 Methylmercury Budget...................................................................................................... 44 3.3.1 Cache Creek ............................................................................................................. 44 3.3.2 Bear Creek ............................................................................................................... 48 3.3.3 Harley Gulch............................................................................................................ 49
3.4 Total Mercury Budget ....................................................................................................... 50 3.4.1 Atmospheric Deposition .......................................................................................... 50 3.4.2 Cache Creek Tributary Mercury Loads ................................................................... 53 3.4.3 Bear Creek ............................................................................................................... 58 3.4.4 Harley Gulch............................................................................................................ 60
3.5 Sediment Budget ............................................................................................................... 61 3.5.1 Cache Creek ............................................................................................................. 61 3.5.2 Bear Creek ............................................................................................................... 65
3.6 Mercury to suspended sediment ratio................................................................................ 66 3.6.1 Cache Creek ............................................................................................................. 67 3.6.2 Bear Creek ............................................................................................................... 72 3.6.3 Harley Gulch............................................................................................................ 73
3.7 Source Analysis Summary ................................................................................................ 73
4 Linkage Analysis..................................................................................................................... 75 4.1 Methylmercury Production................................................................................................ 75
4.1.1 Sulfate in the Mercury Cycle ................................................................................... 76 4.1.2 New Water Impoundments ...................................................................................... 76 4.1.3 Sediment Mercury Concentrations .......................................................................... 77 4.1.4 Forms of Mercury .................................................................................................... 78
4.2 Biomagnification ............................................................................................................... 79 4.2.1 Linkage Calculations – Cache Creek....................................................................... 82 4.2.2 Linkage Calculations – Bear Creek ......................................................................... 83 4.2.3 Linkage Calculations – Harley Gulch...................................................................... 85
4.3 Other Mercury Control Programs...................................................................................... 85 4.4 Linkage Analysis Summary .............................................................................................. 86
5 Margin of Safety and Seasonal Variability .......................................................................... 88 5.1 Margin of Safety................................................................................................................ 88
5.1.1 Explicit Margin of Safety ........................................................................................ 88 5.1.2 Implicit Margin of Safety for Humans in Targets ................................................... 88
viii
5.1.3 Implicit Margin of Safety for Humans and Wildlife in North Fork and Upper Main Stem Cache Creek .............................................................................. 88
5.2 Seasonal Variability .......................................................................................................... 89
6 Load Allocations and Implementation Plan for Meeting Loads ........................................ 91 6.1 Methylmercury Load Allocations...................................................................................... 91
6.1.1 Cache Creek Methylmercury Load Allocations ...................................................... 91 6.1.2 Bear Creek Methylmercury Load Allocations......................................................... 95 6.1.3 Harley Gulch Methylmercury Load Allocations ..................................................... 96
6.2 Total Mercury Load Allocations ....................................................................................... 96 6.2.1 Cache Creek Total Mercury Allocations ................................................................. 96 6.2.2 Bear Creek Total Mercury Allocations.................................................................... 97 6.2.3 Harley Gulch Total Mercury Allocations ................................................................ 97
6.3 TMDL Implementation ..................................................................................................... 98 6.3.1 Cache Creek and Tributaries.................................................................................. 101 6.3.2 Bear Creek ............................................................................................................. 104 6.3.3 Harley Gulch.......................................................................................................... 105 6.3.4 New Water Impoundments .................................................................................... 106 6.3.5 Atmospheric Inputs................................................................................................ 106
7 Monitoring Program ............................................................................................................ 107 7.1 Implementation Phase 1 Studies...................................................................................... 107 7.2 Determination of Harley Gulch Background .................................................................. 107 7.3 Fish Tissue....................................................................................................................... 107 7.4 Sediment and Water ........................................................................................................ 109
8 Public Participation.............................................................................................................. 112
9 References.............................................................................................................................. 113
LIST OF APPENDICES
Appendix A. Cache Creek Fish Tissue Data Appendix B. Total Mercury, Methylmercury and TSS Concentrations in Water Appendix C. Peregrine Falcon and Bald Eagle Exposure Parameters Used in Calculation of the
Numeric Targets Appendix D. Annual Sulfate Loads to Cache Creek Appendix E. US Fish and Wildife Service Comments on the Draft Cache Creek TMDL Numeric
Targets
LIST OF FIGURES
Figure 1-1 The Cache Creek Watershed.......................................................................................6 Figure 1-2 Mercury Cycling Conceptual Model...........................................................................9 Figure 3-1 Cache Creek Watershed between Clear Lake and North Fork Confluence..............39 Figure 3-2 North Fork Cache Creek Watershed .........................................................................40
ix
Figure 3-3 Bear Creek Watershed ..............................................................................................42 Figure 3-4 Harley Gulch Watershed...........................................................................................43 Figure 3-5 Relationship Between Total (Unfiltered) Mercury Concentrations and Flow...........54 Figure 3-6 Relationship Between the Mercury Load from Unknown Source(s) in Upper Cache
Creek and Annual Discharge at the Rumsey Gauge..................................................56 Figure 3-7 Relationship Between Total Suspended Sediment Concentration and Flow in the
Cache Creek Basin.....................................................................................................63 Figure 3-8 Inorganic Mercury (ppm, dry weight) Concentrations in Fine Grain Sediment
Collected from Cache Creek by the US Geological Survey (Domagalski et al., 2004).....................................................................................................................................71
Figure 4-1 Invertebrate Methylmercury versus Aqueous Raw Methylmercury.........................81 Figure 4-2 Large Fish Total Mercury versus Invertebrate Methylmercury................................81
LIST OF TABLES Table ES-1 Allocation of Methylmercury Loads to Cache Creek .......................................................iv Table 1.1 Existing and Potential Beneficial Uses of Cache Creek......................................................11 Table 1.2 Mercury in Cache Creek Water Samples...........................................................................15 Table 2.1 Exposure Parameters for Fish-Eating Wildlife ..................................................................20 Table 2.2 Methylmercury Concentrations in Total Diet to Protect Cache Creek Wildlife Species ........22 Table 2.3 Food Chain Multipliers and Trophic Level Ratios for Delta Target Development................24 Table 2.4 Safe Concentrations of Methylmercury in Fish to Protect Wildlife .....................................27 Table 2.5 Comparisons of Safe Levels and Targets with Existing Fish Methylmercury Concentrations in
Cache and Bear Creeks...................................................................................................28 Table 2.6 Safe Rates of Fish Consumption for Humans ....................................................................32 Table 3.1 Cache Creek Water Budget (acre-feet/year) for Water Years 1996 to 2000. ........................38 Table 3.2 Bear Creek Water Budget (acre-ft/yr) for Water Years 1996-2001......................................41 Table 3.3 Cache Creek Methylmercury Budget (grams/yr) for Water Year 2000. ...............................47 Table 3.4 Methylmercury Concentrations in Cache Creek Settling Basin Inflow and Outflow.............47 Table 3.4 Bear Creek Methylmercury Budget (grams/yr) for Water Years 2000 and 2001. .................49 Table 3.5 Atmospheric Deposition of Mercury to Surface of Cache Creek.........................................51 Table 3.6 Cache Creek Total Mercury Budget (kg/yr) for Water Years 1996 through 2000.................57 Table 3.7 Bear Creek Total Mercury Budget (kg/yr) for Water Years 2000 and 2001. ........................59 Table 3.8 Harley Gulch Tributary Loads .........................................................................................61 Table 3.9 Cache Creek Sediment Budget (kg/yr x 106) for Water Years 1996 through 2000................64 Table 3.10 Bear Creek Sediment Budget (kg/yr x 106) for Water Years 2000 and 2001.......................66 Table 3.11 Five-Year Average Mercury and Suspended Sediment Load and the Associated Mercury to
Suspended Sediment Ratio for Selected Locations in the Cache Creek Drainage. ...............67 Table 3.12 Median Mercury to Suspended Sediment Ratios for Small Tributaries in Cache Creek and
Bear Creek.....................................................................................................................68 Table 3.13 Two-Year Average Mercury and Suspended Sediment Loads and the Associated Mercury to
Suspended Sediment Ratio for Select Locations in Bear Creek. .........................................72 Table 4.1 Field Studies Demonstrating a Positive Correlation Between Total and Methylmercury in
Freshwater Surficial Sediment ........................................................................................78 Table 4.2 Bioaccumulation Factors and Safe Water Concentrations for Bear Creek............................84

x
Table 4.3 Bioaccumulation Factor and Safe Water Concentration for Harley Gulch ...........................85 Table 4.3 Change in Fish Tissue Mercury Concentration After Remediation Efforts. .........................87 Table 6.1 Reductions in Aqueous Methylmercury Concentrations to Meet Numeric Targets in Cache
Creek ............................................................................................................................92 Table 6.2 Allocation of Methylmercury Loads to Cache Creek .........................................................93 Table 6.3 Reductions in Aqueous Methylmercury Concentrations to Meet Numeric Targets in Bear Creek
.....................................................................................................................................95 Table 6.4 Allocation of Methylmercury Loads to Bear Creek ...........................................................96 Table 6.5 Potential Implementation Options for Reducing Methylmercury and Mercury in Cache Creek,
Bear Creek and Harley Gulch .......................................................................................100 Table 7.1 Additional Studies ........................................................................................................110

xi
LIST OF ACRONYMS
303(d) List Clean Water Act 303(d) List of Impaired Water Bodies BAF Bioaccumulation Factor Basin Plan Water Quality Control Plan for the Central Valley Region Bwt Body Weight CTR California Toxics Rule CWA Federal Clean Water Act DFG California Department of Fish and Game DHS California Department of Health Services GLWQI Great Lakes Water Quality Initiative Final Rule Hg Mercury MRC Mercury Study Report to Congress NAS National Academy of Sciences NPDES National Pollutant Discharge Elimination System NRC National Research Council OEHHA Office of Environmental Health Hazard Assessment PBCF Practical Bioconcentration Factor Regional Board Central Valley Regional Water Quality Control Board RfD Reference Dose SBMM Sulphur Bank Mercury Mine State Board State Water Resources Control Board TL3 Trophic Level 3 TL4 Trophic Level 4 TMDL Total Maximum Daily Load TMDL Report Cache Creek, Bear Creek and Harley Gulch TMDL for Mercury UC Davis University of California-Davis USEPA U.S. Environmental Protection Agency USFDA U.S. Food and Drug Administration USFS U.S. Forest Service USFWS U.S. Fish and Wildlife Service
1
1 PROBLEM STATEMENT
1.1 Introduction
The Central Valley Regional Water Quality Control Board (Regional Board) determined that Cache Creek (Lake, Yolo, and Colusa Counties) and two of its tributaries, Bear Creek (Colusa County) and Harley Gulch (Lake County), are impaired by mercury. Fish in Cache Creek and Bear Creek have elevated fish tissue mercury levels. In addition, water column concentrations of mercury greatly exceed the California Toxics Rule (CTR) water quality criterion at numerous sampling sites in Cache Creek and its tributaries during storm events. Cache Creek, Bear Creek, and Harley Gulch are on the federal 303(d) list of impaired water bodies. The Federal Clean Water Act (CWA) requires States to identify impaired water bodies and to develop programs to correct the impairments through the Total Maximum Daily Load (TMDL) program. This report describes the TMDLs for Cache Creek, Bear Creek and Harley Gulch.
1.2 Regulatory Background
1.2.1 Clean Water Act 303(d) Listing and Total Maximum Daily Load Development
Section 303(d) of the Federal Clean Water Act requires States to:
1. Identify those waters not attaining water quality standards (referred to as the “303(d) list”).
2. Set priorities for addressing the identified pollution problems.
3. Establish a “Total Maximum Daily Load” for each identified water body and pollutant to attain water quality standards.
The 303(d) list for the Central Valley is prepared by the Regional Board and approved by the State Water Resources Control Board (State Board) and the United States Environmental Protection Agency (USEPA). Water bodies on the 303(d) list are not expected to meet water quality objectives even if dischargers of point sources comply with their current discharge permit requirements. A TMDL represents the maximum load (usually expressed as a rate, such as grams methylmercury per year) of a pollutant that a water body can assimilate and not result in impairments. A TMDL describes the reductions needed to meet water quality objectives and allocates those reductions among the sources in the watershed. In order to meet State and Federal requirements, TMDLs must include the following elements: description of the problem (Section 1), numerical water quality target (Section 2), analysis of current loads (Section 3), load reductions needed to eliminate impairments and plan and program of implementation to achieve the needed load reductions (Section 6), and monitoring to document program progress (Section 7).

2
1.2.2 Porter-Cologne Basin Plan Amendment Process and Time Schedule
The Porter-Cologne Water Quality Control Act (Section 13240) requires that the Regional Board develop a water quality management strategy for each water body and pollutant in the Central Valley that is not meeting its beneficial uses. The Cache Creek, Bear Creek, and Harley Gulch TMDLs will be enacted when amended into the Water Quality Control Plan for the Central Valley Region (Basin Plan). The Basin Plan is a legal document adopted by the Regional Board that describes beneficial uses of waters to be protected, water quality objectives to protect those uses, and a program of implementation needed for achieving the objectives (CVRWQCB, 1998). The water quality management strategy for Cache Creek, Bear Creek, and Harley Gulch will include several phases:
• TMDL Development involves the technical analysis of the sources of pollutant, the fate and transport of those pollutants, the numeric target(s), and the amount of pollutant reduction that is necessary to attain the target. (Report completed Fall 2004)
• Implementation Planning involves an evaluation of the practices and technology that can be applied to meet the necessary load reductions, the identification of potentially responsible parties, a description of the implementation framework (e.g., incentive-based, waste discharge requirements, and prohibitions), a time schedule for meeting the target(s), and a consideration of cost.
• Basin Planning focuses on the development of a Basin Plan amendment and a Functionally Equivalent Document for Regional Board consideration. The Basin Plan amendment will likely include site-specific water quality objectives for Cache Creek and Harley Gulch and an implementation plan to achieve those objectives. The Functionally Equivalent Document will include information and analyses required to comply with the California Environmental Quality Act. (Regional Board staff anticipates proposing a Basin Plan amendment to the Regional Board by June 2005.)
• Implementation focuses on the performance of the cleanup activities and other actions as described in the implementation plan to achieve the water quality objectives. Guidance for implementation practices is provided by the Porter Cologne Water Quality Act (§13241 and §13242) and the Federal TMDL requirements (CWA Section 303(d)).
The Basin Plan amendment is legally applicable once it has been adopted by the Regional and State boards and approved by the Office of Administrative Law and the USEPA. Regional Board staff intends to seek public input throughout the TMDL Development and Implementation Planning phases. The Basin Plan amendment will be adopted under a structured process involving public participation and state environmental review. As Regional Board staff prepares the proposed Basin Plan amendment, formal public workshops and hearings will be held.
1.3 Units and Terms Used in this Report
In this document, aqueous concentrations of mercury and methylmercury are reported in units of nanograms per liter (ng/L). Concentrations of suspended sediment are analyzed as total

3
suspended solids (TSS) and use units of milligrams per liter (mg/L). In the Source Analysis, the concentration of mercury in suspended sediment is calculated as the ratio of concentrations of mercury to suspended sediments (Hg/TSS). Units for the concentration of mercury in suspended sediment are part per million (ppm; equivalent to ng/mg or mg/kg). Mercury levels in sediment and soil are presented as part per million on a dry weight basis. The units for loads of methylmercury and mercury are grams per year (gm/yr) and kilograms per year (kg/yr), respectively. Sediment loads are given in terms of millions of kilograms per year (kg/yr x 106). Water flow is presented in units of acre-feet per year for annual rates and cubic feet per second (cfs) for instantaneous flow measurements. Concentrations of mercury in fish tissue are reported as milligrams/kilogram (mg/kg) on a wet weight basis. Rates of consumption of fish are reported as grams of fish eaten per day (gm/day) or meals per month. One adult meal is assumed to be eight ounces (227 grams) of fish. For this TMDL report, water quality targets are as defined as the endpoints to attain water quality standards. Water quality targets will be proposed as one option for water quality objectives during the development of the Basin Plan amendment to implement the TMDL. As discussed in the Numeric Targets Section, the numeric targets for this TMDL are methylmercury concentrations in fish tissue. Regional Board staff will follow guidance from the USEPA and the USFWS, as well as site-specific information, such as fish consumption surveys, in determining whether to recommend changes to the mercury water quality objectives. The term water quality goal in this report refers to aqueous methylmercury concentrations. The aqueous goals are linked to the numeric targets of methylmercury in fish tissue and they are used to determine the load reductions and allocations needed to meet the numeric targets. The goals are based on the best scientific information available to date and could change as more information is gathered. The aqueous methylmercury goals may be discussed in the proposed Basin Amendment as guidance for load reductions; however, the aqueous goals will not be proposed as water quality objectives. Staff will review new data and update the aqueous goals if necessary as part of a regular review of implementation activities.

4
Figure 1-1 The Cache Creek Watershed

5
1.4 TMDL Scope and Watershed Characteristics
Cache Creek drains a 0.7 million-acre watershed in the Coast Range of California (Figure 1.1). Cache Creek flows to the Cache Creek Settling Basin, which discharges to the Yolo Bypass and flows into the Sacramento-San Joaquin Delta Estuary. The scope of this TMDL report includes three 303(d) listed waters, including: 1) Cache Creek: 81-mile reach between Clear Lake and the output of the Cache Creek Settling
Basin (adjacent to the Yolo Bypass), 2) Harley Gulch: eight miles from headwaters to Cache Creek, and 3) Bear Creek: 39 miles from headwaters to Cache Creek. The upper Cache Creek basin (above the town of Rumsey) is mostly undeveloped land that contains chaparral and scrub oak habitat and is primarily used as rangeland (Foe and Croyle, 1998). The upper basin is naturally divided into three sub-basins: North Fork (Cache Creek), Cache Creek between Clear Lake and the North Fork confluence, and Bear Creek. The three water bodies flow year round. Dams at Indian Valley and on Cache Creek below Clear Lake control flows in the North Fork and main stem Cache Creek, respectively. Both Clear Lake and the Indian Valley Reservoir trap winter storm runoff for release during the irrigation season. Annual irrigation storage from the two reservoirs may be as much as 393,000 acre-feet with Clear Lake providing 80 percent of the water (Sorensen and Elliott, 1981). Bear Creek flows from its headwaters (north of Indian Valley Reservoir) to the confluence with Cache Creek. No dams are present in the Bear Creek watershed. The gradient of Cache Creek along the 33-mile reach between Clear Lake (~1,320 feet above sea level [asl]) and Rumsey (420 feet asl) drops approximately 27 feet per mile (USGS, 1958-1992). This drop is sufficient to ensure good sediment transport during all but the lowest flow periods. Large areas of the upper basin are highly erosive (Foe and Croyle, 1998). There are three inactive mercury-mining districts in the upper watershed area: Clear Lake, Sulphur Creek, and Knoxville mining districts (Montoya and Pan, 1992; Buer et al., 1979). The Clear Lake district includes the Sulphur Bank Mercury Mine at Clear Lake. The Sulphur Creek mining district includes the Elgin, Empire, Manzanita, West End, Central, Cherry Hill, and Wide Awake mines that drain to Bear Creek via Sulphur Creek and the Petray and Rathburn mines that discharge to Bear Creek. The Turkey Run and Abbott mines that drain to Harley Gulch are also in the Sulphur Creek mining district. The Knoxville District spans the Putah and Cache Creek watersheds. The Reed Mine is in the Knoxville District and discharges to Davis Creek, a tributary to Cache Creek above the confluence of Bear Creek. Harley Gulch drains a 3,412-acre watershed in the upper Cache Creek basin. Harley Gulch is an ephemeral stream with flowing water between October and June (USGS, 2001). At other times it is reduced to a series of isolated standing pools. The inactive Turkey Run and Abbott mercury mines are on the west branch Harley Gulch. The mines were constructed in the 1860s and 1870s and were worked intermittently through the early 1970s (Churchill and Clinkenbeard, 2002). The Abbott and Turkey Run mine complex was the most productive in the Sulphur Mining District with an estimated yield of 1.8 million kg of mercury (Churchill and Clinkenbeard, 2002).

6
The confluence of Bear Creek with Cache Creek can be observed on Highway 16, about midway through the Cache Creek Canyon. The Bear Creek watershed is sparsely populated. Much of the Bear Creek watershed, including Bear Valley, is rangeland. The lower portion of the watershed is rugged and lies within the USBLM Cache Creek management area. The lower Cache Creek basin (downstream of Rumsey) is intensely farmed with mostly row, orchard, and rice cultivation (Foe and Croyle, 1998). An inflatable dam is constructed at Capay (approximately 15 miles downstream of Rumsey) during each irrigation season so that water may be diverted into the Winters and Adams canals. During the peak of the irrigation season, much of Cache Creek below Capay Dam is dry except where the groundwater table is high (Foe and Croyle, 1998). The streambed is broad and flat in the 30-mile reach between Capay Dam (~220 feet asl) and the Settling Basin (40 feet asl), dropping approximately six feet per mile. The broad, flat flood plain experiences continuous erosion and redeposition of sediment to the streambed and banks during all but the highest flows. Irrigation return flows enter above the town of Yolo providing some discharge from the lower basin to the Yolo Bypass during the dry season. Several towns and small communities are located within the Cache Creek watershed. Clear Lake and its surrounding communities are located in the upper basin. The Cache Creek Canyon Natural Area is also within the upper basin. Rumsey, Guinda, Brooks, Capay, Esparto, Woodland, and Yolo are located in the lower basin. In addition, the Rumsey Band of the Wintun Indians owns the Rumsey Rancheria approximately 15 miles south of Rumsey in the Capay Valley. The local economy is heavily dependent upon agriculture and tourism. Industrial plants and distribution centers are located in Woodland, which is the largest town in the watershed. Precipitation at Brooks for the 1996 to 2000 period averaged 20 inches per year and at Indian Valley Reservoir averaged 28 inches per year (DWR, 2001). The majority of rain typically falls between November and March. During the winter, snow occasionally falls in the mountains above the 3,000-foot elevation. The Cache Creek watershed is located in the northern Coast Range geomorphic province. Bedrock in the area consists of a structurally complex group of rocks known as the Franciscan Formation and the Great Valley Sequence, a sequence of deep marine siliciclastic sediments. A magmatic intrusion that underlies the region likely relates to the geothermal fluid activity and the associated mercury deposits in the Cache watershed (McLaughlin et al., 1989). The U.S. Geological Survey (USGS) has mapped numerous hot springs discharging in the area. A large number of these springs flow directly into drainages in the Cache Creek watershed. The Cache Creek watershed provides habitat for diverse populations of wildlife. Raptors that forage in the riparian area include bald eagle, golden eagle, osprey, and peregrine falcon. Other birds that inhabit the riparian zone include great blue heron, snowy egret, green heron, belted kingfisher, and common merganser. Northern river otter, raccoon, American marten, American mink, tule elk, mountain lion, and black bear are also found in the watershed (USBLM, 2002).

7
Clear Lake and Indian Valley Reservoir allow for year round flow to Cache Creek upstream of Capay, providing essential habitat for the local fish species. Cache Creek is home to warm water and cold water, game and non-game fish, which include rainbow and brown trout, channel catfish, smallmouth bass, pikeminnow, Sacramento sucker, carp, and California roach. Anadromous fish such as steelhead trout and Pacific lamprey once made their way up Cache Creek to spawn in Clear Lake tributaries prior to the construction of the Clear Lake dam (Moyle, 2002). It is unknown whether anadromous fishes still ascend Cache Creek.
1.5 Toxicity of Mercury
1.5.1 Mercury Accumulation in Biota
Both inorganic mercury and organic mercury can be taken up from water, sediments, and food by aquatic organisms (Figure 1.2). Because organic mercury uptake rates are generally much greater than rates of elimination, methylmercury concentrates within organisms. Low trophic level1 species such as phytoplankton obtain most mercury directly from the water. Bioconcentration describes the net accumulation of mercury directly from water. Piscivorous (fish-eating) fish and birds obtain most mercury from contaminated prey rather than directly from the water (USEPA, 1997b). A bioaccumulation factor describes the degree to which mercury accumulates from water and prey, relative to the mercury concentration in the water. Repeated consumption and accumulation of mercury from contaminated food sources results in tissue concentrations of mercury that are higher in each successive level of the food chain. This process is termed biomagnification. The proportion of total mercury that exists as the methylated form generally increases with level of the food chain (Nichols et al., 1999). This occurs because inorganic mercury is less well absorbed and/or more readily eliminated than methylmercury.
1.5.2 Human Health
Mercury is a potent neurotoxicant, with methylmercury being is the most toxic form. The aquatic food web provides more than 95% of humans’ intake of methylmercury (USEPA, 1997b). Adverse effects from ingestion of methylmercury include impairments to peripheral vision, speech, hearing, walking and other nervous system functions. Adverse neurological effects in children appear at dose levels five to ten times lower than dose levels associated with toxicity in adults (NRC, 2000). Epidemiological studies indicate that children born of mothers who consume large amounts of fish during pregnancy are most at risk for methylmercury toxicity. 1 Trophic levels are the hierarchical strata of a food web characterized by organisms that are the same number of steps removed
from the primary producers. The USEPA’s 1997 Mercury Study Report to Congress used the following criteria to designate trophic levels based on an organism’s feeding habits:
Trophic level 1: Phytoplankton. Trophic level 2: Zooplankton and benthic invertebrates. Trophic level 3: Organisms that consume zooplankton, benthic invertebrates, and TL2 organisms. Trophic level 4: Organisms that consume trophic level 3 organisms.

8
Three multi-year epidemiological studies are presently underway to evaluate the neurological development of children exposed to low levels of methylmercury in utero and during early childhood. The studies are being conducted in the Seychelles and Faroe Islands and in New Zealand (Davidson et al., 1998; Grandjean et al., 1999; Kjellstrom et al., 1998). Results to date from both the Faroe Islands and from New Zealand demonstrate that long-term, low level methylmercury exposure from consumption of mercury contaminated fish is associated with measurable decreases on performance tests evaluating neurological development (Grandjean et al., 1999; Kjellstrom et al., 1998). No effects have been observed to date in the Seychelles Islands study (Davidson et al., 1998). In a national survey the United States Center for Disease Control and Prevention (Schober et al., 2003) measured blood methylmercury levels in 2,414 women and children to determine methylmercury exposure levels in the United States. The study concluded that methylmercury levels in blood were approximately four-fold higher in women who reported eating fish three or more times during the last month than in women who did not consume fish during the same time period. The study also found that blood mercury levels were three times higher in women than in children. Eight percent of American women of childbearing-age had blood mercury levels above the USEPA recommended safe level placing prenatal neurological development of their offspring at potential risk.2 No children appeared to be threatened by elevated methylmercury levels. Effects of methylmercury are dependent upon the dose received. There is no evidence of acute or chronic methylmercury toxicity to humans due to consumption of fish from Cache Creek, Bear Creek, or Harley Gulch. Extensive fish consumption or exposure studies, however, have not been conducted. The results of the United States Center for Disease Control and Prevention study suggest that while no incidents of mercury poisoning have been reported for Cache Creek, that residents should exercise caution when consuming contaminated fish from the watershed3. A fish consumption advisory for Cache and Bear Creeks is being developed by the California Office of Environmental Health Hazard Assessment.
2 The recommended safe level, or reference dose, is ten times less than the benchmark dose, or level observed to cause adverse
effects (USEPA, 2001). Blood levels between the reference dose and the threshold level indicate a risk of adverse health effects (NRC, 2000).
3 The national mean mercury tissue concentrations in large piscivorous fish range between 0.1 and 0.26 ppm (as reviewed in USEPA, 1999a). By comparison, mean concentrations in piscivorous fish (TL4) range from 0.1 to 1.5 in Cache Creek and 0.5 to 6.4 in Bear Creek.

9
Figure 1-2 Mercury Cycling Conceptual Model

10
1.5.3 Wildlife Health
Wildlife species may also experience neurological, reproductive or other detrimental effects from methylmercury exposure. Although a few studies indicate that methylmercury impairs reproduction of fish species (Matta et al., 2001), the greatest concern for toxicity is in organisms that consume fish. Behavioral effects including impaired learning, reduced social behavior and impaired physical abilities have been observed in mice, otter, mink and macaques exposed to methylmercury. Reproductive impairment following methylmercury exposure has been observed in multiple species, among them common loons and western grebe (Wolfe et al., 1998). Adverse reproductive effects have been observed in loons and mink after feeding on fish containing concentrations of methylmercury similar to those found in Cache Creek (0.3-0.5 mg/kg; Barr, 1986; Halbrook et al., 1997). There have been no studies conducted to date showing adverse effects of methylmercury on wildlife species in the Cache Creek watershed. Estimates of methylmercury intake by piscivorous species eating fish from Cache Creek, however, are higher than safe levels of intake for these species as derived from published literature (see Numeric Targets Section).
1.6 Beneficial Uses and Applicable Standards
1.6.1 Beneficial Uses
Both the Federal Clean Water Act and the State Water Code (Porter-Cologne Water Quality Act) require identification and protection of beneficial uses. Table 1.1 lists the existing and potential beneficial uses of Cache Creek. Cache Creek provides habitat for warm water species of fish and their associated aquatic communities. Cache Creek and its riparian areas provide valuable wildlife habitat. There is significant use of Cache Creek for swimming, fishing, rafting, and picnicking. In addition, water is diverted from Cache Creek for agricultural use. The beneficial uses of Cache Creek that are impaired due to high mercury levels are recreational fishing (REC-1), municipal and domestic supply (MUN), and wildlife habitat (WILD). High mercury levels in fish from Cache Creek pose risks for humans and wildlife that consume fish from the creek. Beneficial uses are not specified in the Basin Plan for Bear Creek or Harley Gulch. According to the Basin Plan, “beneficial uses of any specifically identified water body generally apply to its tributary streams.”4 By application of this policy, beneficial uses for Cache Creek are applicable to both Bear Creek and Harley Gulch. Under the Sources of Drinking Water Policy (State Water Resources Control Board Resolution 88-63), the municipal and domestic supply designation (MUN) applies to these water bodies. 4 This policy is commonly called the tributary rule. The Basin Plan states the following: “The beneficial uses of any
specifically identified waterbody generally apply to its tributary streams. In some cases, a beneficial use may not be applicable to the entire body of water. In these cases, the Regional Board’s judgment will be applied”. Waterbodies within the Basins that do not have beneficial uses designated…are assigned MUN designations in accordance with the provisions of State Water Resources Control Board Resolution No. 88-63…” (CVRWQCB 1998, Chapter 2). This resolution states that, “All surface and ground waters of the State are considered to be suitable, or potentially suitable, for municipal ‘or domestic water supply and should be so designated by the Regional Boards…”

11
Table 1.1 Existing and Potential Beneficial Uses of Cache Creek
Beneficial Use (CVRWQCB, 1998) Status
Municipal and domestic supply (MUN) Existing (a)
Agriculture – irrigation and stock watering (AGR) Existing
Industry – process (PROC) and service supply (IND) Existing
Recreation – contact, canoeing, and rafting (REC-1) Existing (a)
Other non-contact (REC-2) Existing
Freshwater habitat (Warm) Existing
Freshwater habitat (Cold) Potential
Spawning (SPWN) – warm and cold Existing
Wildlife habitat (WILD) Existing (a) (a) (a). Beneficial uses impaired by mercury in Cache Creek
1.6.2 Water Quality Objectives
Because methylmercury concentrates to the greatest extent in the aquatic food web, organisms that eat fish and other aquatic life are exposed to the highest levels of methylmercury. Protecting the most sensitive endpoints, that is developing embryos of humans and wildlife, should result in protection of the rest of the aquatic environment from toxicity due to mercury. Section 2 of this report discusses in detail the development of numeric targets to protect human and wildlife species consuming fish from Cache and Bear Creeks and Harley Gulch. Existing goals for methylmercury in fish tissue are presented below for comparison. Other water quality criteria that can be applied to the Cache Creek watershed are also discussed below. There are several different goals for aqueous concentrations of inorganic (total recoverable) mercury and one for methylmercury. Beneficial uses of drinking water for humans, livestock and wildlife species and for aquatic life are expected to be protected by targets to protect the more sensitive uses of safe fish consumption. After the fish tissue targets are achieved, the Regional Board will reevaluate criteria to protect drinking water, aquatic life and any other beneficial uses to ensure that these are also attained in Cache Creek.
Fish Tissue Goals
The USEPA recently published a recommended criterion for the protection of human health of 0.3 mg/kg methylmercury in the edible portions of fish (USEPA, 2001). At the time Cache Creek was designated as impaired on the 303(d) list, fish tissue concentrations were compared with guidelines from the National Academy of Sciences (NAS) and the US Food and Drug Administration (USFDA). The NAS guideline for wildlife protection was 0.5 mg/kg methylmercury (NAS, 1973) applied to whole, freshwater fish and marine shellfish. The USFDA set an action level of 1.0 mg/kg methylmercury to protect human health (USFDA, 1984). The USFDA level applies to the edible portion of commercially caught freshwater and marine fish. Because research published since 1994 shows that methylmercury

12
produces toxicity at levels lower than previously supposed, Regional Board staff no longer uses the NAS and USFDA guidelines to evaluate water quality impairments. This TMDL focuses on water quality goals for methylmercury in fish as being most protective of beneficial uses. As described in the Numeric Target Section, Regional Board staff used the USEPA method for obtaining a fish tissue criterion to develop numeric targets that protect humans and wildlife consuming fish in Cache and Bear Creeks and Harley Gulch.
Aqueous Criteria and Goals
The USEPA has issued a safe level of total methylmercury in drinking water to protect humans of 70 ng/L (Marshack, 2003). This level is released through USEPA’s Integrated Risk Information System (IRIS) and is based on USEPA’s current reference dose of methylmercury. For comparison, levels of methylmercury in Cache Creek, Bear Creek and Harley Gulch are typically below 1.0 ng/L (see Appendix B). The maximum recorded in the watershed was 20 ng/L in Sulphur Creek (Slotton et al, 2004a). The USEPA drinking water level is not expected to be exceeded in Cache and Bear Creeks and in Harley Gulch. Although not issued specifically for California waters, a guidance level to protect the drinking water for livestock has been developed by the United Nations (Ayers and Westcot, 1985). This guidance level is 10,000 ng/L total mercury. Livestock and wildlife species can use Cache and Bear Creeks and Harley Gulch for drinking water. Water samples have not been found to exceed the livestock guidance level in Cache Creek (Table 1.2). During extreme runoff events, Harley Gulch has exceeded the 10,000 ng/L level. The USEPA promulgated the California Toxic Rule (CTR) in April 2000 (USEPA, 2000a). The CTR contains a water quality criterion of 0.05 µg/L (50 ng/L) total recoverable mercury for freshwater sources of drinking water.5 The CTR criterion protects humans from exposure to mercury in drinking water and contaminated fish. The CTR criterion is enforceable for all waters with a municipal and domestic water supply beneficial use designation, including Cache Creek. Applicability of the CTR is discussed further in the section on Numeric Targets. The CTR is likely exceeded during the winter in the main stem of Cache Creek, in North Fork Cache Creek and in Bear Creek, especially during high water years. The CTR should be compared with averages of aqueous concentrations of total recoverable mercury occurring over 30-day periods. In the Cache Creek watershed mercury samples have been collected up to three or four times in a 30-day period, but have not been collected continuously. Data therefore do not exist to show whether the CTR is actually exceeded. We conclude that the main stem of Cache Creek (at Rumsey) likely exceeds the CTR by performing a regression analysis of flow and concentration for the days on which both were measured, then using the resulting regression
5 The federal rule did not specify duration or frequency terms. However, the Regional Board has previously employed a 30-day
averaging interval with an allowable exceedance frequency of once every three years for protection of human health, which is recommended for application of this criterion (Personal communication from P. Woods, USEPA Region 9 to J. Marshack, CVRWQCB, 12/04/01).

13
equation to calculate mercury concentration for the remaining flow measurements. Estimates of monthly average concentrations of mercury in Cache Creek in the winter were greater than 50 ng/L. During non-storm periods, mecury concentrations in Cache and Bear Creeks do not exceed 50 ng/L. Exceedances of the CTR are driven by sheer volumn of sediment transported in storms, as well as concentration of mercury in suspended sediment. For example, the mercury concentration in soil and fine-grained sediment in the North Fork Cache Creek is at the regional background level (around 0.2 ppm; Churchill and Clinkenbeard, 2004). There are no mercury mines in the North Fork drainage. Erosion of this low-level mercury soil in the North Fork watershed, however, produces aqueous concentrations of total mercury up to 1380 ng/L (See Table 1.2). Multiple storms in a 30-day period would very likely cause North Fork to exceed the CTR. As described in the implementation section, erosion control measures will be needed to reduce water concentrations and loads of total mercury. Concentrations of mercury in North Fork Cache Creek could exceed the CTR during periods with high runoff events. Mercury concentrations in water from Indian Valley Reservoir are typically low (median 5 ng/L), but contributions of mercury and suspended sediment from tributaries to North Fork can be high following storms. We estimate that the CTR is very unlikely to be exceeded in Cache Creek between the Cache Creek dam and North Fork, as the maximum concentration recorded is less than 50ng/L. Based on regressions of flow versus aqueous mercury, Bear Creek may not exceed the CTR during low or normal water years, but likely exceeds the CTR during winter flows of high water years. Concentrations of mercury in Harley Gulch are generally above 50 ng/L, even during non-storm periods. Thus the CTR is probably exceeded in Harley Gulch.
1.7 Available Monitoring Data
Since 1976, several agencies have monitored mercury in Cache Creek by collecting water, fish tissue, and other biota samples. No fish tissue data are available for Harley Gulch. Levels of mercury in fish are presented as wet weight concentrations. The sections below summarize the available environmental data. Summary statistics and raw fish tissue concentration data are presented in Appendix A. Aqueous concentration data are in Appendix B. Much of the data used in this report was made available through research supported by the California Bay-Delta Authority (Churchill and Clinkenbeard, 2002; Domagalski et al., 2004; Slotton et al., 2004a,b; Suchanek et al., 2004; Tetra Tech, 2004). Regional Board staff and contractors conducted monitoring and analysis of data funded with a two-year CALFED mercury contract (CALFED Directed Action #99-B06) to provide source information necessary for the Cache Creek TMDL control program. Portions of this work are incorporated into the Numeric Targets and Source and Linkage Analysis sections of this report.

14
1.7.1 Fish Tissue Data
High levels of mercury in fish are of concern to humans and wildlife that eat fish from Cache Creek. The Regional Board based its decision to list Cache Creek as impaired due to fish tissue data that indicated that mercury levels might be too elevated for human consumption. Between 1976 and 1988, the Toxic Substances Monitoring Program analyzed samples of three TL3 fish and seven TL4 fish collected from Cache Creek at Brooks, which is approximately seven miles upstream of Capay Dam in the lower basin (SWRCB, 1996; Wyels, 1987). The TL3 fish had mercury levels ranging from 0.33 to 0.47 mg/kg. The TL4 fish had mercury levels ranging from 0.15 to 0.68 mg/kg. In 1997 Yolo County contracted with researchers from the University of California, Davis (UC Davis) to determine mercury levels in Cache Creek fish (Davis, 1998). UC Davis researchers collected 64 mature TL3 and TL4 fish from twelve species found in the lower watershed during a five-day period. The fish-tissue samples had methylmercury concentrations ranging between 0.02 mg/kg and 1.25 mg/kg. Although most of the fish sampled were small (<0.5 kg), thirteen samples (20 %) had tissue concentrations that exceeded 0.5 mg/kg. Two samples had mercury concentrations above 1.0 mg/kg. White crappie (12 samples), Sacramento pikeminnow (one sample), and smallmouth bass (two samples) had the highest mercury levels. These TL4 fish had average mercury concentrations of 0.49 mg/kg, 0.50 mg/kg, and 0.94 mg/kg wet weight, respectively. In December 2000, UC Davis researchers collected tissue samples from approximately 200 fish at diverse locations in the Cache Creek watershed as part of the CALFED mercury grant (Slotton et al., 2004a). Tissue samples collected from smallmouth bass in Cache Creek at Rumsey had mercury concentrations as high as 1.5 mg/kg.
1.7.2 Water Data
The Regional Board, UC Davis and USGS have collected water samples throughout Cache Creek and its tributaries. Regional Board staff collected water samples from several locations along Cache Creek during the summer irrigation season (April through October) and during non-storm runoff and storm runoff events in the winter season (November through March) between February 1996 and February 1998. Regional Board staff determined that storm runoff events accounted for the majority of the mercury exported from the Cache Creek watershed (Foe and Croyle, 1998). Typical total recoverable mercury concentrations range between 2 and 4,000 ng/L with the highest values occurring in winter storm runoff. Periodic exceedances of the CTR criterion, MCL, and USEPA freshwater aquatic life criterion occurred in wet years. Regional Board staff is currently collecting additional water data from Cache Creek, Harley Gulch and other tributaries to Cache Creek to refine load estimates made in this TMDL. Suchanek and colleagues (2004) collected water samples from Harley Gulch and Sulphur Creek to estimate loading from mine sites and geothermal springs. Water samples from runoff that passed through mine sites ranged from 1,000 to 6,800 ng/L.

15
Domagalski and colleagues (2004) sampled throughout Cache Creek and its tributaries, including Harley Gulch, to determine mass loads of mercury and methylmercury between January 2000 and May 2001. The purpose of the study was to collect water samples during storm events and non-storm events to identify the seasonality of mercury transported down the basin. The largest loads of mercury occurred during storm events and the highest concentrations were found at Harley Gulch, Cache Creek at Rumsey and Cache Creek into the Cache Creek Settling Basin. Table 1.2 shows the median and range of concentrations of total recoverable mercury in Cache Creek and tributaries. The total recoverable and methylmercury concentration data mentioned above were used to develop the load estimates given in the Source Analysis. Table 1.2 Mercury in Cache Creek Water Samples
Sampling Location (upstream to downstream)
Number of
Samples
(a)
Range of Concentrations
Total Recoverable
Mercury (ng/L)
Median Concentration of Total Recoverable
Mercury (ng/L)
Cache Creek @ Cache Creek Dam 26 0.3 to 34.9 7.5 Upper Basin and
North Fork & North Fork Cache Creek @ Hwy 20 29 1.3 to 1,381 5.1
Harley Gulch at USGS Gauge (near Highway 20) 20 29.5 to 831 197
Sulphur Creek at USGS Gauge (tributary to Bear Creek) 23 376 to 8,402 1,051
Mine Site Tributary
Inputs Davis Creek at USGS Stream
Gauge (downstream of Davis Creek Reservoir dam)
6 3.1 to 29.8 7.4
Upper Basin Bear Creek at USGS Gauge 16 18.5 to 1,290 81.9
Cache Creek @ Rumsey 65 2.3 to 2,248 17.6
Cache Creek @ Capay Dam 4 5.7 to 3,004 25.8 Lower Basin
Cache Creek @ Road 102 (upstream of Settling Basin) 44 1.2 to 1,295 29.3
(a) Sources: Foe & Croyle (1998), Suchanek, et al. (2004), Domagalski, et al. (2004)

16
2 NUMERIC TARGETS
This section describes the derivation of water quality targets for mercury that are designed to protect beneficial uses of the water and resources of Cache Creek and its tributaries, Bear Creek, and Harley Gulch. The targets are intended to reduce the risks to humans and wildlife that consume fish or other aquatic prey containing methylmercury. Numeric targets are in the form of concentrations of methylmercury in fish. The same methods were used to derive targets for the three water bodies in this TMDL. Because Cache and Bear Creeks have similar fish species, targets for Cache and Bear Creeks are identical (see sections 2.4 and 2.5). The fish target for Harley Gulch was selected to correspond to the more narrow range of small fish in this stream (see section 2.6). The targets developed in this section are preliminary and will be proposed as one option for water quality objectives during development of the Basin Plan amendment to implement this TMDL. Establishment of final numeric targets and water quality objectives will depend on the evaluation of a number of factors. These factors include: the environmental characteristics of the watershed; water quality conditions that could be reasonably achieved through the coordinated control of all factors which affect water quality in the area; economic considerations; the need for developing housing in the region; and the need to develop and use recycled water (§13241; Porter-Cologne Water Quality Act). The final numeric targets for this TMDL will be determined based on the water quality objectives adopted by the Regional Board through a Basin Plan amendment.
2.1 Selection of the Type of Target
2.1.1 Fish Tissue
Concentration of methylmercury in fish tissue was identified as the target for Cache Creek, Bear Creek, and Harley Gulch. The major beneficial uses of Cache and Bear Creeks and Harley Gulch that are currently unmet are as a safe fishery for humans and wildlife. A target of mercury in fish tissue was selected because it provides a direct assessment of fishery conditions and improvement. Existing data for fish species consumed by humans and wildlife provide a baseline against which future improvements can be measured. Methylmercury targets are developed in fish tissue because methylmercury is the most toxic form of mercury. Of the mercury measured in fish, 90-100% is methylmercury (Bloom, 1992; Becker and Bigham, 1995). Similar ratios of methylmercury to total mercury were confirmed for Cache Creek fish (Slotton et al., 2004a).
2.1.2 Other Biota, Water and Sediment
Tissues of macroinvertebrates, birds, and mammals that consume fish are also potential types of targets. Mammalian and avian tissue samples have not been collected in the Cache Creek

17
watershed. Trapping fish-eating mammals is difficult. Analyses in feathers and eggs are well-established methods for evaluating exposure of birds to mercury (Eisler, 1987) but lack of data does not allow for developing this type of target for Cache Creek. Mercury levels in macroinvertebrates of Cache and Bear Creeks and Harley Gulch have been measured. However, literature on impairment to macroinvertebrates is limited and no methylmercury criteria for macroinvertebrates have been developed. The California Toxics Rule (CTR) mercury criterion applies to the Cache Creek watershed. This criterion of 50 ng/L total recoverable mercury in water is intended to protect the health of humans consuming contaminated organisms and drinking water (USEPA, 2000a). When applied to discharge permits, the CTR is interpreted as a 30-day running average concentration that may be exceeded only once in three years (personal communication from J. Marshack, CVRWQCB). Using this interpretation, total mercury concentrations in Cache Creek frequently exceed the CTR criterion during winter storm flows. A numeric target based on levels of mercury fish from the Cache Creek watershed is believed by Regional Board staff to be more protective than the CTR6. Although the CTR criterion may be less stringent than the fish tissue targets discussed below, the TMDL was developed to also meet the CTR mercury criterion. Attainment of the CTR criterion through the TMDL is discussed in the source analysis and load allocation sections of this report. Concentrations of mercury or methylmercury in sediment are not as closely related to measures of impairment, as are measures of methylmercury in water or fish tissue. A good correlation exists between total mercury load and sediment load in the form of total suspended solids (Foe and Croyle, 1998). This correlation is important for identifying sources and control options for reducing mercury loads.
2.2 Fish Tissue Target Equation and Development
2.2.1 Fish Target Equation and Variables
Key variables that are incorporated into the calculation of fish tissue targets are: • acceptable daily dose level of methylmercury; • body weight (bwt) of the consumer; • trophic level or size of fish consumed; and • rate of fish consumption
These components can be related using a basic equation (OEHHA, 2000; USEPA, 1995c) as follows: 6 The weighted average practical bioconcentration factor (PBCF) used to develop the CTR mercury criterion is 7342.6 (USEPA,
2000a). For Cache and Bear Creeks, bioaccumulation factors (BAF) between average concentrations in large trophic level 3 or 4 fish and median total recoverable aqueous mercury levels are in the range of 28,000 to 650,000. These BAF indicate that large fish in Cache and Bear Creeks accumulate higher concentrations of mercury than USEPA’s PBCF.
18
(2.1) Safe daily intake * Consumer’s body weight = Acceptable fish tissue mercury level Consumption rate
At or below the safe daily intake of methylmercury, consumers are expected to be protected from adverse effects. Acceptable intake levels are also called reference doses (RfD). A RfD is expressed as an average, daily rate (micrograms of mercury per kilogram body weight per day) of mercury intake. In general, a RfD is calculated by using studies of exposure in specific populations to determine a threshold level of exposure, below which adverse effects did not occur. The threshold level is then divided by uncertainty factors that lower the value to the final reference dose. Uncertainty factors account for differences in metabolism and sensitivity between individuals, lack of toxicity information in available studies, or other unknowns. In calculation of its recommended methylmercury criterion to protect human health, USEPA added a relative source contribution (RSC) component to the equation to account for methylmercury from other sources (USEPA, 2001). Humans are exposed to methylmercury from commercial fish as well as locally caught fish. Human intake of methylmercury from all other sources (air, drinking water, soil, and foods other than fish and seafood) is negligible. The RSC represents the portion of the methylmercury exposure that cannot be controlled by local cleanup actions. For piscivorous wildlife species, their direct intake of methylmercury from air or water is also negligible, when compared to intake from prey (USEPA, 1997c). Because piscivorous wildlife species are assumed to obtain all of their fish or other aquatic prey from the local water body, no RSC adjustment is used for the wildlife calculations. The consumption rate can be separated into rates of consumption of fish from each trophic level. Adjusting for multiple consumption rates and the RSC, the basic Equation 2.1 appears as follows. Fish Tissue Target Equation: (2.2) (Safe intake – intake from other sources) * body weight = Safe level of mercury in fish
(CRateTL2 + CRateTL3 + CRateTL4) Where: CRateTL2 = consumption rate of fish from Trophic Level 2
CRateTL3 = consumption rate of fish from Trophic Level 3 CRateTL4 = consumption rate of fish from Trophic Level 4
2.2.2 Comparison of Human and Wildlife Targets
Methylmercury targets to protect human and wildlife were determined separately and compared. Safe levels of mercury in fish depend upon the amount of fish consumed. For piscivorous wildlife species, average consumption rates for each species were used to determine safe fish levels. Human fish consumption, though, varies widely by individual. The USEPA developed a recommended methylmercury criterion for the protection of human health using a consumption rate of 17.5 gm/day of locally caught fish (one eight-ounce fish meal in a two week period) (USEPA, 2001). This consumption rate corresponds to a safe concentration mercury in fish tissue of 0.3 mg/kg. As shown below, the recommended wildlife targets for Cache and Bear

19
Creeks were lower than the USEPA methylmercury criterion for human health. Therefore, the wildlife targets were selected as being most protective of wildlife and humans. Following a description of the calculation of the wildlife targets, the human consumption rates that correspond to the concentrations of methylmercury in fish needed to protect wildlife are shown.
2.3 Wildlife Health Targets
Fish-eating birds and mammals are potentially at risk for impairments caused by consumption of mercury-contaminated fish. Acceptable fish tissue levels of mercury for wildlife species can be calculated by incorporating daily intake levels, body weights and consumption rates. Mercury studies conducted in the laboratory and field are used to derive safe intake levels (RfD) for birds and mammalian wildlife. The following section uses these RfDs to calculate fish tissue targets that would protect wildlife species feeding in the Cache Creek watershed.
2.3.1 Reference Doses
An acceptable daily intake level determined for mink is used as the RfD for mammalian wildlife species (USEPA, 1995a; USEPA, 1997d). The mammalian RfD of 0.018 mg/kg-bwt-day is based on studies in which mink were fed methylmercury at varying doses and evaluated for neurological damage, growth and survival. Studies of mallard growth and reproduction following methylmercury exposure were used to determine an avian reference dose of 0.021 mg/kg-bwt-day (USEPA, 1997d).
2.3.2 Body weights and Consumption Rates
Wildlife species most likely at risk for mercury toxicity are primarily or exclusively piscivorous. Authors of the Mercury Study Report to Congress (MSRC) selected two mammal species (mink and river otter) and four bird species (bald eagle, common loon, kingfisher and osprey) typically at risk from methylmercury in fish (USEPA, 1997c). According to the California Department of Fish and Game (DFG) list of species occurring in the Cache Creek watershed (DFG, 2002), all of these species except the common loon occur regularly at Cache Creek. The following species possibly at risk in the Cache Creek watershed were added to the basic list from the MSRC: western grebe, common merganser, peregrine falcon and double crested cormorant. Exposure parameters needed to estimate daily methylmercury exposures and safe levels of methylmercury in prey for wildlife are given in Table 2.1. Because the most sensitive endpoints of toxicity of methylmercury are related to reproductive success, average body weights of adult females are used. The USFWS provided guidance to Regional Board staff regarding the accuracy of the exposure parameters used (USFWS, 2002; 2003; USFWS; 2004. USFWS comments on the draft Cache Creek TMDL targets are provided in Appendix E).

20
Table 2.1 Exposure Parameters for Fish-Eating Wildlife
Species (a)
Body weight
(b)
Total Food Ingestion Rate (c)
Trophic level 2 aquatic
prey
Trophic level 3 aquatic
prey
Trophic level 4 aquatic
prey
Piscivorous bird prey
Omnivorous bird prey
Other foods (d) Size of prey
kg g/day, wet wt
g/day (as % of diet)
g/day (as % of diet)
g/day (as % of diet)
g/day (as % of diet)
g/day (as % of diet)
g/day (as % of diet)
Mink 0.60 140 - 140 (100%) - - - - most prey 50-150mm; females catch smaller prey than males (USEPA 1995b)
River otter 6.70 1124 - 899 (80%) 225 (20%) - - - heterogeneous, 20-500 mm (USEPA 1995b); majority <150 mm but commonly catch large TL4 fish.
Belted kingfisher 0.15 68 - 68 (100%) - - - generally less than 105 mm; up to
180 mm (Hamas 1994) Common merganser (e)
1.23 302 - 302(100%) - - - - most prey <150 mm (USEPA 1995b; Hatch and Weseloh, 1999)
Double-crested cormorant (f)
1.74 390 - 390 (100%) - - - - generally 100-300 mm length; up to 360mm (Mallory and Metz 1999)
Western grebe (g) 1.19 296 - 296 (100%) - - - - USFWS assumed similar to
merganser (USFWS 2004)
Bald eagle (h) 5.25 566 - 328 (58%) 74 (13%) 28 (5%) 74 (13%) 62 (11%)
fish 75-500+ mm; most will be >150 mm (Jackman 1999; USEPA 1995b).
Osprey (i) 1.75 350 - 315 (90%) 35 (10%) - - - fish 100-450 mm; most will be >200 mm.
Peregrine falcon (j) 0.89 134 - - - 6.7 (5%) 13.4 (10%) 114 (85%) Does not eat fish.

21
Table 3.1 continued. a) Italics denote species listed as threatened or endangered by State or Federal authorities. b) Average female body weights are from Trophic Level and Exposure Analyses for Selected Piscivorous Birds and Mammals Volume II (USEPA, 1995b),
USFWS (2003, 2004), and as noted below c) Total food ingestion rates are from USEPA (1995b) and USFWS (2003; 2004) and as noted below. d) Other foods are mainly terrestrial mammal, bird, reptile and invertebrate prey that are presumed to provide negligible amounts of methylmercury. e) Merganser body weight and ingestion rate from Schwarzbach and colleagues (2001). f) Cormorant body weight is the average for female birds cited in Hatch and Weseloh (1999). This paper also reports daily consumption at 20-25% of body
mass. Total ingestion rate of 390 g/day is 22.5% of average female bodyweight. g) Female western grebe body weight from Storer and Nuechterlein (1992). h) Bald eagle parameters provided by the USFWS (2004). Diet of bald eagles in northern California includes fish, mammals and birds. Using dietary data from
Jackman and colleagues (1999), the USFWS estimated the average proportions of prey types. TL3 and TL4 fish comprised 58% and 13% of the total bald eagle diet, respectively. Piscivorous birds, such as gulls, grebes, and mergansers, comprised approximately 5% of the total diet. An additional 13% of the total diet was comprised of other aquatic birds, such as coots, that feed mainly on TL2 organisms. Bald eagles are scavengers and thus consume fish of large sizes (Jackman et al., 1999).
i) Osprey catch and eat large fish, the majority of which are >200 mm (USEPA, 1995b). In a water body where TL4 sport fish are readily available, osprey diet is assumed to be 10% TL4 fish (USFWS, 2002). Prey size is limited to the maximum size that an osprey can lift out of water
j) Peregrine falcons eat a wide variety of birds, including grebes, herons, shorebirds, mergansers, gulls and other birds that accumulate methylmercury from the aquatic food web. USFWS (2004) supports the assumption by Regional Board staff that approximately 15% of peregrine prey in the Cache Creek watershed is comprised of piscivorous birds. See the Appendix for further analysis of peregrine prey and habitat.

22
Kingfishers, ospreys, grebes and mergansers are known to nest in the riparian area along Cache Creek. Cormorants forage in lower Cache Creek. Peregrine falcons have been observed while foraging, but are not known to nest in the watershed (Linthicum, 2003; USBLM, 2002). The Cache Creek watershed hosts a large wintering population of bald eagles. Wintering bald eagles feeding in Cache and Bear Creeks consume almost exclusively large, non-game fish species (USBLM, 2002; Slotton et al., 2004a). Nesting by bald eagles in the Cache canyon has been observed since 2000 (USBLM, 2002). Cache and Bear Creeks support river otters and mink. Bear Creek also provides habitat for kingfishers, herons and mergansers (CVRWQCB, 2003b; 2003c). The aquatic resources of Harley Gulch are limited and are likely consumed by small mammals and piscivorous birds (see Section 2.6).
2.3.3 Safe Fish Tissue Levels of Mercury for Wildlife Protection
Safe Methylmercury Levels in Total Diet
Levels of mercury in fish tissue that would result in methylmercury intakes by piscivorous wildlife at or below safe intake levels are calculated in two steps. In the first step, safe levels of methylmercury in the total diet of each wildlife species are calculated (Table 3.2). The total diet safe level represents the concentration of methylmercury, as an average in all prey consumed, needed to keep the organism’s daily intake of methylmercury below the reference dose. Total diet safe levels were calculated using the exposure parameters for wildlife species and Equation 3-1. In the second step, the total diet safe level is translated into protective levels of methylmercury in various components of an organism’s diet (Table 3.4). Example calculations are shown below. Table 2.2 Methylmercury Concentrations in Total Diet to Protect Cache Creek Wildlife Species
RfD (µg/kg bwt-day)
Body weight (kg)
Total food ingestion rate
(g/day)
Safe methylmercury concentration in total diet (mg/kg in diet)
Mink 18 0.60 140 0.077 River otter 18 6.70 1124 0.107 Belted kingfisher 21 0.15 68 0.046 Common merganser 21 1.23 302 0.086 Double-crested cormorant 21 1.74 390 0.094 Western grebe 21 1.19 296 0.084 Bald eagle 21 5.25 566 0.195 Osprey 21 1.75 350 0.105 Peregrine falcon 21 0.89 134 0.139
Example calculation of total safe diet level for mink:
Mammalian reference dose * Mink body weight = Safe methylmercury in total diet Mink consumption rate 18 µg MeHg/kg day * 0.60 kg = 0.077 µg MeHg/g total diet (0.077 mg/kg) 140 g/day

23
Calculation of Safe Fish Tissue Levels from Total Diet Values
Wildlife species consume fish and other aquatic prey from various size ranges and trophic levels. In the second step of wildlife target development, safe fish tissue levels are identified for different prey classifications. Table 3.4 shows safe fish tissue concentrations needed by the wildlife species and developed for prey within the following size ranges: trophic level 2 fish less than 50 mm in length, Trophic level 2 and 3 fish of 50-150 mm, TL3 fish of 150-350 mm, and TL4 fish greater than 150 mm. In cases in which an organism’s prey is fairly uniform and from one trophic level, the total diet safe level becomes the average, safe tissue concentration. For organisms that feed from different trophic levels, the proportions of each trophic level in the diet (Table 3.1) are used to determine safe tissue levels for each component of the diet. The species whose prey falls generally into one size category are: mink, double crested cormorant, western grebe, kingfisher and common merganser. For these species, the total diet safe level becomes the safe fish tissue level matched to the size and trophic level of prey consumed. Average, safe fish tissue concentrations for kingfisher, cormorant and mink are proposed for the size range of 50-150 mm. Although kingfishers typically consume fish less than 105 mm in length, they can eat fish as long as 180 mm (Hamas, 1994; USEPA, 1995b). The range for cormorant prey is 30-400 mm, with most fish eaten being less than 150 mm (Hatch and Weseloh, 1999). Most fish caught by mink are in the range of 50-150 mm (USEPA, 1995b). As the size ranges of prey caught by these three species are similar, one category of TL2/3 fish is appropriate for their protection (USFWS, 2004). A second category of TL3 fish in the range of 150-350 mm incorporates safe fish tissue concentrations for prey of common mergansers and western grebes. Most prey caught by mergansers is in the range of 100-300 mm, with catches of fish up to 360 mm observed (Mallory and Metz, 1999). Information regarding prey size of western grebes was unavailable. Because body size and foraging strategy of western grebes are similar to those of the merganser, the same size range was assumed for grebe prey (USFWS, 2004). Otter, bald eagle and osprey eat fish from multiple trophic levels. Methylmercury concentrations vary as a function of size and trophic level of prey. Therefore, different trophic levels of prey will have different acceptable concentrations of methylmercury. For these wildlife species, the total diet safe level (TDSL) can be described as: Equation 3-3
TDSL = (% dietTL2* TL2conc) (% dietTL3* TL3conc) + (% dietTL4* TL4conc) Where: % diet TL2 = percent of trophic level 2 biota in diet
% diet TL3 = percent of trophic level 3 biota in diet % diet TL4 = percent of trophic level 4 biota in diet TL2conc = concentration of methylmercury in TL2 biota TL3conc = concentration of methylmercury in TL3 biota

24
TL4conc = concentration of methylmercury in TL4 biota
In order to solve the above equation for the desired concentrations in TL2, TL3 and TL4 biota, concentrations in two trophic levels are put in terms of the concentration in the lowest trophic level. Equation 3-3 is then rearranged to solve for the lowest trophic level concentration. To express the concentration in a higher trophic level (i.e., TL4) in terms of TL2 concentrations, Staff used two types of translators: food chain multipliers (FCM) and trophic level ratios (TLR)7. FCM and TLR used in the calculation of Cache and Bear Creek targets are shown in Table 3.3. Where possible, site-specific, existing fish concentration data was used to develop the ratios. A similar table of safe fish tissue concentrations to protect wildlife species using a national average bioaccumulation factor (BAF) between TL3 and TL4 of 5 is presented in Chapter 6 of Mercury Study Report to Congress Vol. 7 (USEPA, 1997b). Details regarding the calculation of the translators and their use were provided by the USFWS (2003; 2004). Table 2.3 Food Chain Multipliers and Trophic Level Ratios for Delta Target Development
Translator Value Source Relevant wildlife species (a)
Trophic Level Ratio (TLR)
TLR 4/3 2.0
Ratio between existing MeHg concentrations in large TL4 fish (>150 mm length) and large TL3 fish (>150 mm length). Calculated from Cache and Bear Creek average fish tissue levels; See Appendix
Bald eagle, osprey
Food Chain Multipliers (FCM)
FCM 4/3 5.0
Ratio between existing MeHg concentrations in large TL4 fish (150-350 mm length) and small TL3 fish (50-150 mm). Calculated from Cache and Bear Creek average fish tissue levels; See Appendix
River otter
FCM 3/2 5.7 Ratio between MeHg concentrations in large TL3 fish and small TL2 fish. From USFWS (2004) based on national averages.
Bald eagle, peregrine falcon
FCM piscivorous birds (FCM PB) 12.5 Ratio between MeHg in piscivorous bird tissue and
in small TL3 prey fish. From USFWS (2003). Bald eagle, peregrine
falcon
FCM omnivorous birds (FCM OB) 10
Ratio between MeHg in omnivorous bird tissue and in small, TL2/3 prey fish and other aquatic organisms. From USFWS (2003).
Bald eagle, peregrine falcon
a). Wildlife species for which the translator is used to determine safe tissue levels River otter safe tissue levels To calculate the safe concentrations for otter, there are two variables to be determined, which are the safe concentrations in TL3 and TL4 fish. In order to solve for both variables, the TL4 fish
7 A food chain multiplier (FCM) is the ratio of methylmercury concentrations in fish of different trophic levels. A FCM
represents the biomagnification of mercury between 2 successive levels of the food chain. The FCM is determined using mercury concentration data in fish in a predator-prey relationship. Example: the FCM for trophic level 4 fish is the ratio of methylmercury in large TL4 fish to methylmercury in small TL3 fish. A trophic level ratio (TLR) is the ratio of methylmercury concentrations in fish of different trophic levels, but is derived using data for fish in the same size classification. For example, an osprey may consume sunfish (TL3) and bass (TL4). A 350 mm sunfish, though, is too large to be preyed upon by an equivalently-sized smallmouth bass. Therefore, the ratio of mercury concentration in TL4 to TL3 fish eaten by osprey is termed a TLR rather than a FCM.
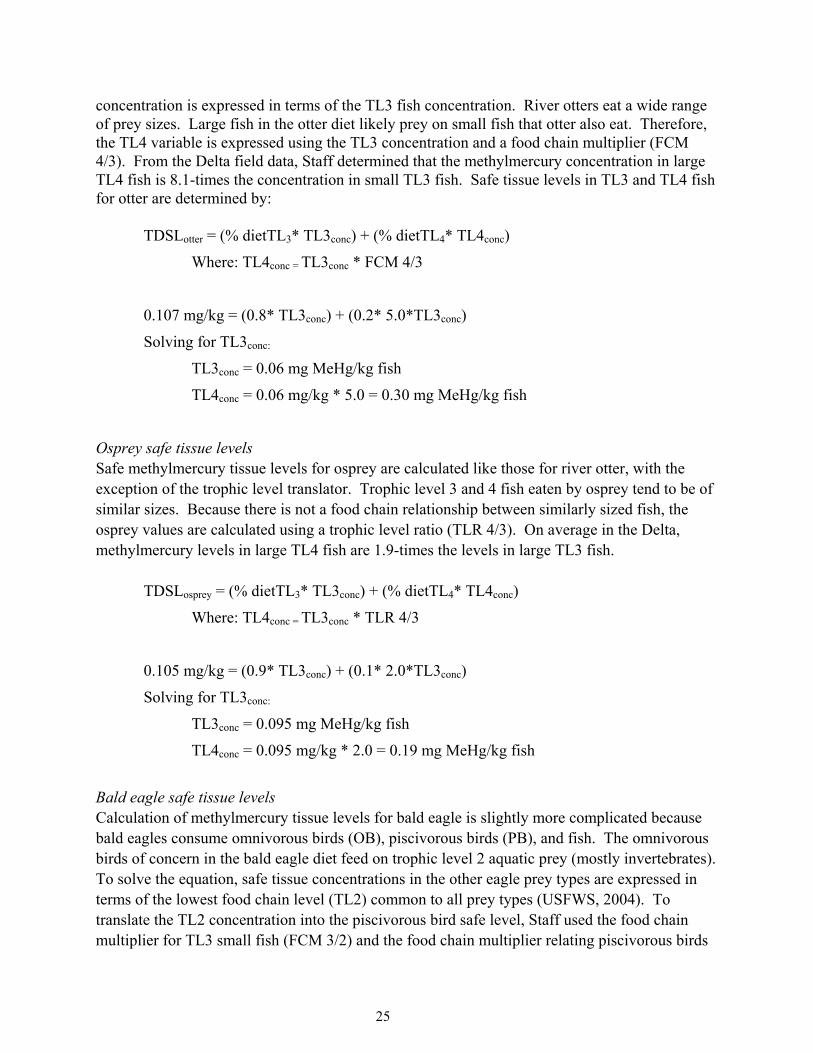
25
concentration is expressed in terms of the TL3 fish concentration. River otters eat a wide range of prey sizes. Large fish in the otter diet likely prey on small fish that otter also eat. Therefore, the TL4 variable is expressed using the TL3 concentration and a food chain multiplier (FCM 4/3). From the Delta field data, Staff determined that the methylmercury concentration in large TL4 fish is 8.1-times the concentration in small TL3 fish. Safe tissue levels in TL3 and TL4 fish for otter are determined by:
TDSLotter = (% dietTL3* TL3conc) + (% dietTL4* TL4conc)
Where: TL4conc = TL3conc * FCM 4/3
0.107 mg/kg = (0.8* TL3conc) + (0.2* 5.0*TL3conc)
Solving for TL3conc:
TL3conc = 0.06 mg MeHg/kg fish
TL4conc = 0.06 mg/kg * 5.0 = 0.30 mg MeHg/kg fish
Osprey safe tissue levels Safe methylmercury tissue levels for osprey are calculated like those for river otter, with the exception of the trophic level translator. Trophic level 3 and 4 fish eaten by osprey tend to be of similar sizes. Because there is not a food chain relationship between similarly sized fish, the osprey values are calculated using a trophic level ratio (TLR 4/3). On average in the Delta, methylmercury levels in large TL4 fish are 1.9-times the levels in large TL3 fish.
TDSLosprey = (% dietTL3* TL3conc) + (% dietTL4* TL4conc)
Where: TL4conc = TL3conc * TLR 4/3
0.105 mg/kg = (0.9* TL3conc) + (0.1* 2.0*TL3conc)
Solving for TL3conc:
TL3conc = 0.095 mg MeHg/kg fish
TL4conc = 0.095 mg/kg * 2.0 = 0.19 mg MeHg/kg fish
Bald eagle safe tissue levels Calculation of methylmercury tissue levels for bald eagle is slightly more complicated because bald eagles consume omnivorous birds (OB), piscivorous birds (PB), and fish. The omnivorous birds of concern in the bald eagle diet feed on trophic level 2 aquatic prey (mostly invertebrates). To solve the equation, safe tissue concentrations in the other eagle prey types are expressed in terms of the lowest food chain level (TL2) common to all prey types (USFWS, 2004). To translate the TL2 concentration into the piscivorous bird safe level, Staff used the food chain multiplier for TL3 small fish (FCM 3/2) and the food chain multiplier relating piscivorous birds

26
and small TL3 fish (FCM PB). Like osprey, bald eagles tend to eat TL3 and TL4 fish of similar size, hence the use of the TL4/3 ratio.
TDSLbald eagle = (% dietTL3* TL3conc)+ (% dietTL4* TL4conc) +(%dietOB*OBconc) +(%dietPB*PBconc)
Where: TL3conc large fish = TL2conc * FCM 3/2
TL4conc large fish = TL2conc * FCM 3/2 * TLR 4/3
OBconc = TL2conc * FCM OB
PBconc = TL2conc * FCM 3/2 * FCM PB
0.195 mg/kg = (0.58*5.7*TL2conc) + (0.13*5.7*2.0*TL2conc) + (0.13 *10*TL2conc) + (0.05* 5.7*12.5*TL2conc)
Solving for TL2conc:
TL2conc = 0.020 mg MeHg/kg TL2 prey (not eaten by eagles; used to determine other safe levels)
TL3conc large fish = 0.020 * 5.7 = 0.12 mg MeHg/kg fish
TL4conc large fish = 0.020 * 5.7 * 2.0 = 0.23 mg MeHg/kg fish
OBconc = 0.020 * 10 = 0.20 mg MeHg/kg omnivorous birds PBconc = 0.020 * 5.7 * 12.5 = 1.45 mg MeHg/kg piscivorous birds
Peregrine falcon safe tissue levels Peregrine falcons consume almost exclusively avian prey, some of which is aquatic-dependent. To solve for safe concentrations in omnivorous and piscivorous bird prey, these terms are expressed as functions of the lowest trophic level common to the birds’ food web, which is TL2 aquatic prey (USFWS, 2004).
TDSLperegrine = (%dietOB*OBconc) + (%dietPB*PBconc)
Where: OBconc = TL2conc * FCM OB
PBconc = TL2conc * FCM 3/2 * FCM PB
0.139 mg/kg = (0.10 * 10 * TL2conc) + (0.05 * 5.7* 12.5 * TL2conc)
Solving for TL2conc:
TL2conc = 0.030 mg MeHg/kg TL2 prey (not eaten by falcons; used to determine other safe levels)
OBconc = 0.030 * 10 = 0.30 mg MeHg/kg omnivorous birds
PBconc = 0.030 * 5.7 * 12.5 = 2.2 mg MeHg/kg piscivorous birds

27
Table 2.4 Safe Concentrations of Methylmercury in Fish to Protect Wildlife
Species (a) Fish Trophic
Level 3, length 50-150 mm
Fish Trophic level 3, length 150-350 mm
Fish Trophic Level 4, length
>150 mm
Omnivorous birds Piscivorous birds
Mink 0.08 River otter 0.06 0.30 Belted kingfisher 0.05 Double-crested cormorant 0.09 Common merganser 0.09 Western grebe 0.08 Bald eagle (b) 0.12 0.23 0.20 1.35 Osprey (c) 0.096 0.18 Peregrine falcon (d) (0.17) 0.30 2.17 (a) Italics denote species that are listed as threatened or endangered by federal or State authorities (b) Bald eagle safe levels should be compared with large TL3 and TL4 fish, >150 mm. (c) Osprey safe levels should be compared with large TL3 and TL4 fish, >150 mm. (d) Parentheses denote the TL3 fish level corresponding to the piscivorous bird safe concentration for peregrines. To protect wildlife species, Regional Board staff recommends selection of targets of 0.12 mg/kg and 0.23 mg/kg in large TL3 and TL4 fish, respectively (>150 mm in length). These values are the levels calculated to protect bald eagles. Safe levels for other wildlife species feeding on fish from the same size range are within +0.05 mg/kg of the bald eagle levels. Table 3.4 also shows safe levels for smaller TL2 or TL3 fish (less than 150 mm). As the TMDL is implemented, methylmercury concentrations are expected to decline in small and large fish. When concentrations in large TL3 and TL4 fish are near the target levels, monitoring should be conducted in small fish as well, to verify that the mercury levels have declined sufficiently to protect other wildlife species. This is particularly important for the listed species8. Note that the safe fish tissue levels in Table 3.4 are partially watershed-dependent and are specific to Cache Creek. The acceptable, average fish tissue concentrations for wildlife consuming from one trophic level will be consistent across different water bodies. This is because all of the parameters used to calculate the safe fish levels (species body weight, consumption rate and reference dose) are taken from published literature and apply to a national or regional scale (See Table 3.2). For species consuming fish from two trophic level classifications or piscivorous birds, translators (FCM or TLR) were used to calculate the safe concentrations in prey fish and piscivorous birds. These translators should be derived from site-specific data when possible and may differ between watersheds. For the Cache and Bear Creek targets, the TLR and FCM between trophic level 4 to and 3 fish were specific to the Cache Creek watershed. The FCMs for piscivorous birds, omnivorous birds and trophic level 3 fish were literature-derived average values.
8 For the linkage analysis, we selected the most statistically significant relationships between methylmercury in water and
trophic level2/3 biota and between trophic level 2/3 biota and large, TL4 fish. These relationships produced the Cache Creek goal of 0.06 ng/L. Using other methylmercury water-biota relationships prepared by Slotton and colleagues, the range of safe, median, aqueous methylmercury concentrations is 0.03 – 0.13 ng/L.

28
Regional Board Staff is not proposing safe tissue levels in piscivorous or omnivorous birds as TMDL targets. By lowering methylmercury concentrations in fish and aquatic prey to safe levels shown in Table 3.4, Staff anticipates that concentrations in birds feeding in the aquatic food web will decline to safe levels as well. Data are lacking to compare safe levels in bird prey with existing conditions. In particular for peregrine falcon, the desired safe level in piscivorous bird prey is 2.2 mg/kg. Dividing the safe piscivorous bird level by 12.5 (FCM PB) results in a safe level in TL3 prey fish (150-350 mm length) of 0.17 mg/kg, which is greater than the proposed target for large TL3 fish.
2.4 Wildlife Health Targets for Cache and Bear Creeks
Table 2.5 shows safe fish tissue levels for wildlife in comparison with existing concentrations in fish from Cache and Bear Creeks. The existing concentrations are averages of fish data presented in Appendix A (SWRCB, 1996; Domagalski et al., 2004; Slotton et al., 1997; 2004a; Slotton and Ayers, 2001; CDFG, 2003). Average concentrations of mercury in TL3 and TL4 fish greater than 150 mm from North Fork Cache Creek include data collected in 2003 by CDFG. The 2003 sampling was conducted to verify that concentrations in large, trophic level 4 fish in North Fork are below the safe level. Table 2.5 Comparisons of Safe Levels and Targets with Existing Fish Methylmercury
Concentrations in Cache and Bear Creeks
Fish Trophic Level 3, length 50-150 mm (for kingfisher, otter
and cormorant exposure)
Fish Trophic level 3, length 150-350 mm (for grebe and
merganser exposure)
TL3 target >150 mm (for bald eagle, osprey, &
human exposure)
TL4 target >150 mm (for bald eagle, osprey, &
human exposure)
Safe Levels 0.05 0.08 0.12 0.23 Cache Creek: Clear Lake to North Fork 0.06 0.09 0.18 0.31
North Fork Cache Creek (a) 0.07 0.14 0.19 0.16
Cache Creek @ Rumsey 0.10 0.36 0.36 0.54 Cache Creek d/s Capay Dam 0.08 0.26 0.28 0.44
Bear Creek u/s Sulphur Creek 0.12 0.24 0.24 0.72
Bear Creek d/s Sulphur Creek 0.69 1.31 1.31 3.15
a. The fish concentration in large TL3 fish sampled from North Fork Cache Creek is greater than the concentration in large TL4 fish. The TL3 fish sampled were larger than the TL4 fish. TL4 fish (pikeminnow and smallmouth bass) would have been feeding on the small, TL2 and TL3 fish and not the large TL3 fish. Size, as an indicator of age and prey type is the most likely explanation for the similarities in large TL3 and TL4 concentrations. Concentrations of methylmercury in Sacramento suckers (large TL3 category) in North Fork are comparable to concentrations of suckers in the main stem Cache Creek. It is likely that the suckers reside in the main stem Cache Creek and enter the North Fork during spawning (Personal communication from D. Slotton, UC Davis, to C. Foe, CVRWQCB, 6/03). The average concentration in large resident TL3 fish is 0.12 mg/kg, equivalent to the safe level.
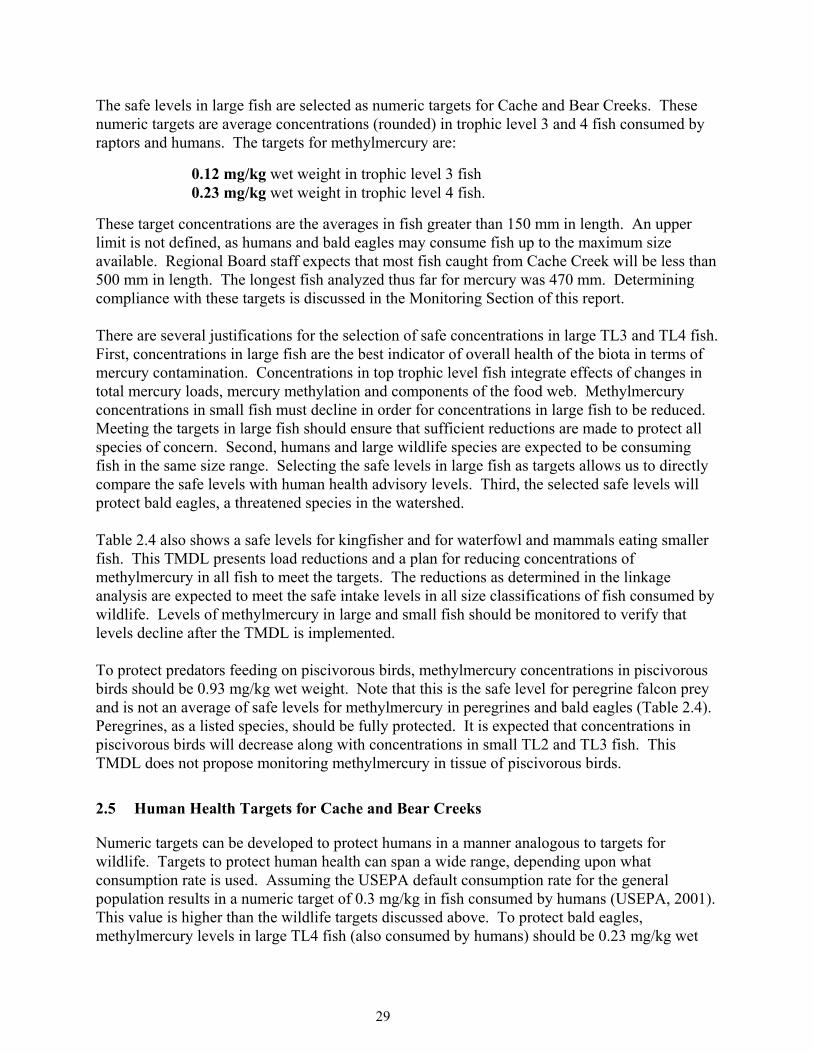
29
The safe levels in large fish are selected as numeric targets for Cache and Bear Creeks. These numeric targets are average concentrations (rounded) in trophic level 3 and 4 fish consumed by raptors and humans. The targets for methylmercury are:
0.12 mg/kg wet weight in trophic level 3 fish 0.23 mg/kg wet weight in trophic level 4 fish.
These target concentrations are the averages in fish greater than 150 mm in length. An upper limit is not defined, as humans and bald eagles may consume fish up to the maximum size available. Regional Board staff expects that most fish caught from Cache Creek will be less than 500 mm in length. The longest fish analyzed thus far for mercury was 470 mm. Determining compliance with these targets is discussed in the Monitoring Section of this report. There are several justifications for the selection of safe concentrations in large TL3 and TL4 fish. First, concentrations in large fish are the best indicator of overall health of the biota in terms of mercury contamination. Concentrations in top trophic level fish integrate effects of changes in total mercury loads, mercury methylation and components of the food web. Methylmercury concentrations in small fish must decline in order for concentrations in large fish to be reduced. Meeting the targets in large fish should ensure that sufficient reductions are made to protect all species of concern. Second, humans and large wildlife species are expected to be consuming fish in the same size range. Selecting the safe levels in large fish as targets allows us to directly compare the safe levels with human health advisory levels. Third, the selected safe levels will protect bald eagles, a threatened species in the watershed. Table 2.4 also shows a safe levels for kingfisher and for waterfowl and mammals eating smaller fish. This TMDL presents load reductions and a plan for reducing concentrations of methylmercury in all fish to meet the targets. The reductions as determined in the linkage analysis are expected to meet the safe intake levels in all size classifications of fish consumed by wildlife. Levels of methylmercury in large and small fish should be monitored to verify that levels decline after the TMDL is implemented. To protect predators feeding on piscivorous birds, methylmercury concentrations in piscivorous birds should be 0.93 mg/kg wet weight. Note that this is the safe level for peregrine falcon prey and is not an average of safe levels for methylmercury in peregrines and bald eagles (Table 2.4). Peregrines, as a listed species, should be fully protected. It is expected that concentrations in piscivorous birds will decrease along with concentrations in small TL2 and TL3 fish. This TMDL does not propose monitoring methylmercury in tissue of piscivorous birds.
2.5 Human Health Targets for Cache and Bear Creeks
Numeric targets can be developed to protect humans in a manner analogous to targets for wildlife. Targets to protect human health can span a wide range, depending upon what consumption rate is used. Assuming the USEPA default consumption rate for the general population results in a numeric target of 0.3 mg/kg in fish consumed by humans (USEPA, 2001). This value is higher than the wildlife targets discussed above. To protect bald eagles, methylmercury levels in large TL4 fish (also consumed by humans) should be 0.23 mg/kg wet
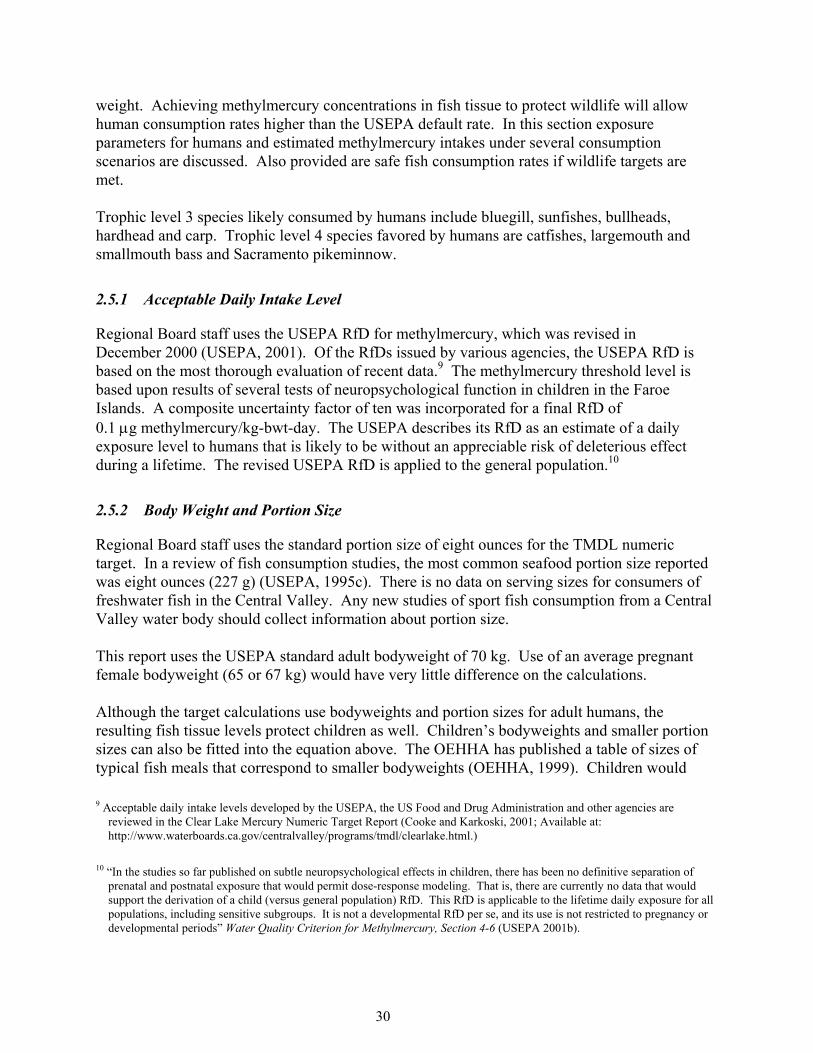
30
weight. Achieving methylmercury concentrations in fish tissue to protect wildlife will allow human consumption rates higher than the USEPA default rate. In this section exposure parameters for humans and estimated methylmercury intakes under several consumption scenarios are discussed. Also provided are safe fish consumption rates if wildlife targets are met. Trophic level 3 species likely consumed by humans include bluegill, sunfishes, bullheads, hardhead and carp. Trophic level 4 species favored by humans are catfishes, largemouth and smallmouth bass and Sacramento pikeminnow.
2.5.1 Acceptable Daily Intake Level
Regional Board staff uses the USEPA RfD for methylmercury, which was revised in December 2000 (USEPA, 2001). Of the RfDs issued by various agencies, the USEPA RfD is based on the most thorough evaluation of recent data.9 The methylmercury threshold level is based upon results of several tests of neuropsychological function in children in the Faroe Islands. A composite uncertainty factor of ten was incorporated for a final RfD of 0.1 µg methylmercury/kg-bwt-day. The USEPA describes its RfD as an estimate of a daily exposure level to humans that is likely to be without an appreciable risk of deleterious effect during a lifetime. The revised USEPA RfD is applied to the general population.10
2.5.2 Body Weight and Portion Size
Regional Board staff uses the standard portion size of eight ounces for the TMDL numeric target. In a review of fish consumption studies, the most common seafood portion size reported was eight ounces (227 g) (USEPA, 1995c). There is no data on serving sizes for consumers of freshwater fish in the Central Valley. Any new studies of sport fish consumption from a Central Valley water body should collect information about portion size. This report uses the USEPA standard adult bodyweight of 70 kg. Use of an average pregnant female bodyweight (65 or 67 kg) would have very little difference on the calculations. Although the target calculations use bodyweights and portion sizes for adult humans, the resulting fish tissue levels protect children as well. Children’s bodyweights and smaller portion sizes can also be fitted into the equation above. The OEHHA has published a table of sizes of typical fish meals that correspond to smaller bodyweights (OEHHA, 1999). Children would 9 Acceptable daily intake levels developed by the USEPA, the US Food and Drug Administration and other agencies are
reviewed in the Clear Lake Mercury Numeric Target Report (Cooke and Karkoski, 2001; Available at: http://www.waterboards.ca.gov/centralvalley/programs/tmdl/clearlake.html.)
10 “In the studies so far published on subtle neuropsychological effects in children, there has been no definitive separation of
prenatal and postnatal exposure that would permit dose-response modeling. That is, there are currently no data that would support the derivation of a child (versus general population) RfD. This RfD is applicable to the lifetime daily exposure for all populations, including sensitive subgroups. It is not a developmental RfD per se, and its use is not restricted to pregnancy or developmental periods” Water Quality Criterion for Methylmercury, Section 4-6 (USEPA 2001b).

31
only be at risk of mercury toxicity if they consumed more than the average portion for their body size.
2.5.3 Consumption Rate
The fourth variable needed to determine a fish tissue target is the consumption patterns for people eating fish from Cache or Bear Creeks. The amount of methylmercury ingested is highly dependent on the amount of fish and the sizes and species of fish consumed. Consumption of fish from neither creek has been studied. It is necessary, then, to examine national and other localized seafood consumption studies. Regional and nationwide fish consumption studies have been reviewed by the CVRWQCB (Cooke and Karkoski, 2001), OEHHA (OEHHA, 2001), and in the Mercury Study Report to Congress (USEPA, 1997d). Discussion of mercury levels in local and commercial fish and consumption of fish from various trophic levels follows. A purpose of the TMDL target is to set a level of mercury in fish that is safe for human consumption. The Clean Water Act requires that waters be maintained such that they are fishable and swimable. Restoring the beneficial use of sport fishing requires that the Regional Board identify the desired amount of fish that could be caught and consumed from Cache and Bear Creeks. Phrased differently, the TMDL seeks to determine a functional definition of what it means for Cache and Bear Creeks to be “fishable”. The desired level of consuming fish from Bear or Cache Creek lies somewhere between a prohibition on fishing and a upper bound consumption rate of a very high consumer (i.e., the 99th percentile in United States consumption studies). Unless the mercury concentration was reduced to zero, people who eat unlimited quantities of fish from Cache Creek would incur a health risk. Beneficial use protection in the case of mercury pollution, therefore, must be accomplished by a combination of cleanup and education. During the very long implementation phase, education is needed to encourage consumers to eat smaller fish and species with lower mercury concentrations.
2.5.4 Consumption of Fish from Various Trophic Levels and Sources
Species and size of fish as well as consumption rate affect methylmercury intake. It is difficult to estimate amounts of various species of sport fish that might be consumed from Cache or Bear Creeks. The USEPA methylmercury water quality criterion uses results from a national food survey that found that on average, humans eat fish from TL2, TL3 and TL4 in proportions of 21%, 46%, and 33% of total fish intake, respectively (USEPA, 2001). Due to the lack of medium or large-sized TL2 fish, Regional Board staff assumes that humans consume no TL2 fish from Cache or Bear Creeks. Table 2.4 shows safe human consumption rates based on consumption of equal amounts ofTL3 and TL4 fish and of only TL4 fish. Many fish consumers eat a combination of locally caught and commercially bought fish (see also Section 2.2.1). The average consumption rate of marine fish reported by all respondents in the national food survey was 12.5 gm/day (three meals every two months; USEPA, 2000b). Below

32
are calculated safe consumption rates for people eating only Cache or Bear Creek fish and for people eating locally caught and an average amount of commercial fish.
2.5.5 Estimated Safe Human Consumption Rates in Cache and Bear Creeks
Safe concentrations of methylmercury in large trophic level 3 and 4 fish needed to protect wildlife are 0.10 and 0.28 mg/kg wet weight, respectively (Table 2.2). Using the Fish Target Equation 2.2, it is possible to estimate the amount of fish that can safely be consumed by humans when these levels are attained (Table 2.6). Table 2.6 Safe Rates of Fish Consumption for Humans
Methyl-mercury in
TL3 fish (mg/kg wet wt)
Methyl-mercury in TL4
fish (mg/kg wet wt)
Body weight
(kg)
Safe Daily Intake
(µg/kg-bwt-day) (a)
Acceptable Consumption Rate TL3 fish
(gm/day)
Acceptable Consumption Rate TL4 fish
(gm/day)
Total Consumption
Rate (gm/day)
Equivalent meals/mo.
Assuming only Cache Creek Fish are Consumed, equal amounts TL3 and TL4 fish
0.12 0.23 70 0.10 20 20 40 5.4 Assuming only Cache Creek Fish are Consumed, only TL4 fish
0.23 70 0.10 na 30 30 4 Assuming Cache Creek fish (equal amounts TL3 and TL4) and Commercial Fish are Consumed
0.12 0.23 70 0.073 14.5 14.5 29 4 Assuming Cache Creek fish (only TL4) and Commercial Fish are Consumed
0.23 70 0.073 na 22 22 3 a) Consumption of 12.5 gm/day commercial fish results in an average daily intake of 0.027 µg methylmercury/kg bwt per day.
The RfD of 0.1 µg/kg bwt per day minus 0.027 µg/kg bwt per day equals the safe intake level for people eating local and commercial fish of 0.073 µg/kg bwt per day.
Comparison with Other Consumption Rates The USEPA recommends default consumption rates for the general population and various subpopulations. These rates were released in October 2000 as part of the revised Methodology for Deriving Water Quality Criteria for Protection of Human Health (USEPA, 2000b). Default consumption rates are derived from food survey data collected nationwide in 1994-96 by the U.S. Department of Agriculture. In the Methodology document, rates are reported separately for consumption of freshwater and marine fish. The USEPA recommends a default fish intake rate of 17.5 gm/day (one meal every two weeks) to adequately protect the general population consuming freshwater and estuarine fish. This value represents the 90th percentile consumption rate for all survey participants, including those who do not eat fish.11 In selecting the 90th 11 In the analysis of results of the food survey, fish consumed were classified as from marine (oceans), estuarine, or fresh waters.
Most commercial fish is from the ocean (i.e., tuna). USEPA assumed that the marine fish represented the intake of fish from commercial sources. Estuarine and freshwater species are more likely to be caught locally or obtained from non-commercial

33
percentile, rather than the mean or median, the USEPA intended to recommend a consumption rate that is protective of a majority of the entire population of consumers and non-consumers. The USEPA recommends default fish intake rates of 142 gm/day (4.4 meals/week) for subsistence fishers (USEPA, 2000b). A detailed survey of consumption by anglers in San Francisco Bay was conducted in 1998 and 1999 (SFEI, 2001a). The mean consumption rate for anglers having consumed Bay fish at least once in the prior four weeks was 23 gm/day.12 Consumption rates for the 50th and 90th percentiles were 16 and 48 gm/day, respectively. The extent of angling in Cache and Bear Creeks is unknown. While collecting water samples, Regional Board staff has observed anglers catching fish from lower Cache Creek. Few anglers use the lower Bear Creek (USBLM, 2002). The Cache Creek canyon has limited access (CVRWQCB, 2003b). Regional Board staff will work with staff of DHS and OEHHA to gather additional information on angling in Cache and Bear Creeks. The consumption rates that will be safe when the TMDL goals are attained, 22-40 gm/day depending on species and commercial fish consumed, are greater than the USEPA default value for the general population of 17.5 gm/day. These rates are near or higher than the mean consumption rate by recent consumers in San Francisco Bay. The Cache and Bear Creek safe consumption rates, however, are less than the USEPA recommended rate (142 gm/day) to protect subsistence angers.
2.6 Harley Gulch Numeric Target
Harley Gulch is an ephemeral stream with some pools that remain wet through the year. Regional Board staff surveying the stream in March and September 2003 observed small, standing pools of water supporting small fish, turtles, newts and invertebrates. Dry stretches of the stream and a natural rock wall approximately two miles from the mouth are barriers to larger fish moving from Cache Creek into Harley Gulch except during flooding. Deer, livestock and other species utilize Harley Gulch for drinking water. Cache Creek wildlife beneficial uses applicable to Harley Gulch are warm freshwater habitat and wildlife habitat. Wildlife habitat, specifically consumption of aquatic organisms by wildlife species, is the beneficial use that is most impacted by mercury. Harley Gulch has limited habitat for piscivorous birds or mammals. Wildlife species likely feeding at the stream are kingfisher, small herons, and raccoon. Because of the ephemeral character of the stream and the mobility of these predators, it is likely that these species do not feed exclusively in Harley Gulch.
sources. Therefore, USEPA assumed that the estuarine and freshwater fish intake represents the amount of fish caught locally. Ninety percent of people surveyed ate 17.5 gm/day or less of estuarine and freshwater fish.
12 These consumption rates were adjusted for avidity bias. In an otherwise random sampling design, avidity bias describes the increase in probability that data will be gathered from anglers fishing very frequently, as opposed to anglers who fish only rarely.

34
Methylmercury exposures of wildlife feeding on organisms from Harley Gulch have not been investigated. Macroinvertebrates in Harley Gulch downstream of the inactive mines contain high levels of mercury and methylmercury, relative to other sites in the Cache Creek watershed not directly impacted by mines (Slotton et al., 1997; 2004a). Within Harley Gulch, concentrations of inorganic mercury in benthic invertebrates decreased with distance from the mine (average 15.5 mg/kg dry weight at a site approximately 3/4 mile downstream of the mines, compared with 0.5 mg/kg dry weight at the confluence with Cache Creek; Slotton et al., 1997). The aquatic species assemblage and levels of methylmercury in aquatic organisms in Harley Gulch prior to opening of the mines are unknown. A major intent of this TMDL is to remove mercury inputs from the mine sites and restore the stream to background conditions. Regional Board staff assumes that levels of methylmercury will be reduced as well. As part of the monitoring program for the TMDL, mercury and methylmercury concentrations in water and methylmercury in fish in Harley Gulch will be evaluated. Human use of water in Harley Gulch is limited. Although designated for municipal and domestic supply, there are currently no drinking water intakes within Harley Gulch. The small size and number of fish observed by Regional Board staff suggest that humans are unlikely to eat fish from Harley Gulch.
Fish Tissue Target
The numeric target for Harley Gulch is a level of methylmercury in fish tissue to protect wildlife species consuming aquatic species from Harley Gulch. The Harley Gulch numeric target for methylmercury is:
0.05 mg/kg, wet weight, in fish less than 150 mm in length.
Because only small fish (likely TL2 or TL3) fish have been observed in Harley Gulch, the safe fish level for small, TL2/3 fish is used as the target (Table 2.2). The California Department of Fish and Game sampled fish in Harley Gulch in September 2003 (CDFG, 2004). Small fish, average size two inches, were collected from four pools located between Highway 20 and the confluence with Cache Creek. One composite sample was analyzed from each pool. The average methylmercury concentration was 0.34 mg/kg, with a range of 0.11 to 0.73 mg/kg. Fish with the highest concentration of methylmercury were found in the most upstream of the pools sampled. Regional Board staff anticipates that it may take several decades after remediation of the Abbot and Turkey Run mines for the numeric target for Harley Gulch to be attained. Sediment downstream that is contaminated by mercury from the mines likely contributes to methylmercury concentrations in Harley Gulch fish and inorganic mercury loads entering Cache Creek. Fish, water and sediment in Harley Gulch should be monitored after the mines are remediated and after contaminated sediment within the streambed has been buried or washed downstream.

35
Although Regional Board staff believes that the fish tissue target will be attained, we acknowledge that background levels of mercury in soil Harley Gulch could preclude reaching the target. The Harley Gulch watershed is naturally enriched in mercury. Mercury in undisturbed, mineralized soil of the Sulphur Creek Mining District, which includes the Harley Gulch mines, averages 93 parts per million (ppm), whereas regional background soil in non-mineralized areas averages 0.19 ppm (Churchill and Clinkenbeard, 2002). Concentrations of mercury in water samples collected in the west branch Harley Gulch, upstream of runoff from the inactive mercury mines, and in the east branch, which lacks mines, are higher than concentrations downstream in Cache Creek and in Cache Creek tributaries outside of the mercury mining districts (Appendix B; unpublished data collected by the Regional Board). Should monitoring indicate that the numeric target has not been attained after the TMDL has been implemented, the Regional Board would develop a natural background target for Harley Gulch. A determination that the target cannot be reached would only be made after the mine sites are remediated and any other anthropogenic contributions of mercury (such as road development and maintenance) have been controlled. Such a determination should also come after sediment conditions downstream of the mine have equilibrated following remediation. A natural background target would likely be in the form of the water column concentration of total recoverable mercury or mercury per unit suspended sediments. Regional Board staff is working with staff from the California Department of Fish and Game to collect additional data to help define background conditions in Harley Gulch. A natural background target may not meet the standards for protecting a water body as a source of drinking water for humans. If a natural background target were developed, beneficial use designations for Harley Gulch may have to be adjusted. In particular, Harley Gulch would not be assigned a drinking water beneficial use. Designating beneficial uses designations is a public process and requires a specific assessment of the watershed (Use Attainability Assessment). Any changes in beneficial use designations would be adopted in a public hearing of the Regional Board and would require approval by the State Board and USEPA. RB staff is unaware of any direct municipal and domestic supply use of water from within Harley Gulch. Harley Gulch contributes less than one percent of the water volume in Cache Creek.
2.7 Numeric Targets Summary
The recommended fish tissue targets for large, trophic level 3 and 4 fish in Cache and Bear Creeks are 0.12 and 0.23 mg/kg methylmercury in wet weight tissue, respectively. These methylmercury concentrations in fish will protect the most sensitive beneficial uses in both creeks, that is, consumption of local fish by wildlife and humans. Harley Gulch is an ephemeral stream with isolated, deep pools that support small, trophic level 2 and/or 3 fish. A fish tissue target of 0.05 mg/kg methylmercury, wet weight, is proposed for the small fish in Harley Gulch. This target is intended to protect wildlife species consuming fish from Harley Gulch. Because of the small fish size (less than four inches), humans are not expected to eat fish from Harley Gulch.

36
3 SOURCE ANALYSIS
3.1 Introduction
Cache Creek is in a region naturally enriched in mercury. Active geothermal vents and hot springs have deposited mercury, sulfur, and other minerals at or near the earth’s surface. Sources of inorganic mercury now entering Cache Creek include mine waste from historic mercury mining operations, erosion of naturally enriched mercury soils, runoff from geothermal springs, and atmospheric deposition of mercury. As a result, sediment in the bed and bank of Cache Creek is contaminated with inorganic mercury. The sum of all these mercury sources has led to elevated concentrations of methylmercury in fish tissue. Methylmercury is produced in sediment by sulfate reducing bacteria. Factors promoting methylmercury formation by sulfate reducing bacteria are complex and not completely understood. However, the inorganic mercury content of sediment is one factor positively correlated with methylmercury production in sediment and its flux into the overlying water column and into fish (see the Linkage Analysis). In this section are water, methylmercury, inorganic mercury, and sediment budgets for Cache Creek, Bear Creek and Harley Gulch. These are used to determine the source of each constituent and to explain how concentrations and loads change with distance downstream. The information is also used to determine where load reductions are required to meet the methylmercury fish tissue targets. Loads were calculated using all available mercury and flow data. Mercury data are included in Appendix B.
3.2 Water Budget
Mercury and sediment budgets were calculated by multiplying water volume by the concentration of each constituent. Accurate water budgets, therefore, were necessary to determine reliable mass balances for other constituents. Tributary inflows, agriculture diversions and rainfall data for water years 1996 through 200013 were used to calculate a water budget for Cache Creek. These years were selected because most of the flow gauges in the basin were not operational prior to 1995. Water year 2001 was not used because there was a calibration problem with the Rumsey gauge and it was impossible to calculate an accurate budget for the year (Domagalski et al., 2004). Flow gauges (Figure 1.1) are located on the three main inputs to Cache Creek (Cache Creek Dam outflow, North Fork Cache Creek at the Indian Valley Reservoir outflow, and Bear Creek near the confluence with Cache Creek), below the mercury mines (on Sulphur Creek, Harley Gulch, and Davis Creek) and on the main stem of Cache Creek (at Rumsey and Yolo).14 Cache Creek
13 A water year is defined as 1 October of the previous year through 30 September of the specified year. For example, the 1996
water year is defined as 1 October 1995 through 30 September 1996. 14 All flow gauges, except Rumsey, are operated by the US Geological Survey . The flow data are available from the USGS
homepage (http://water.wr.usgs.gov/). Data for Rumsey is available from the California Department of Water Resources web site (http://cdec.water.ca.gov/).

37
has many small tributaries that are not metered. The annual water yield of the ungauged tributaries was estimated using Equation 3.1:
(3.1) Q=CIA
Where: Q = Flow C = Runoff coefficient (estimated at 0.2 for Cache Creek)15 I = Rainfall A = Area of the watershed
The Department of Water Resources (DWR) operates rainfall gauges at Brooks and at Indian Valley Reservoir.16 Rainfall data from these sites were used to estimate flow in non-metered tributaries. The accuracy of this method of flow estimation was evaluated by testing it on Bear Creek. The predicted annual discharge using watershed size and rainfall totals (Equation 3.1) was compared with measured flow at the Bear Creek gauge site at the confluence with Cache Creek. The accuracy of the predicted annual flow was quite variable but averaged 87 percent of the measured value for the 6-year time period.17 The accuracy of unmeasured annual flow estimates for other tributaries in the basin is likely to be similar to Bear Creek because the tributaries have similar slopes and land uses. The Yolo County Flood Control and Water Conservation District provided data on agricultural diversions at the Capay inflatable dam (YCFCWCD, 2002a). The majority of water is diverted from Cache Creek for irrigation between March and October resulting in little release of Cache Creek water below the dam in summer. Summer flow downstream of Capay Dam at Yolo is a combination of agricultural tail water, operational spill water from the District, and surfacing groundwater.
3.2.1 Cache Creek
The Cache Creek water budget for years 1996 through 2000 is summarized in Table 3.1. These water years were all classified in the Sacramento Watershed as being “wet” or having “above average” rainfall. Therefore, water yield, sediment and mercury loads for the Cache Creek basin
15 The runoff coefficient was determined from the average for unimproved areas based on the coefficient table provided in
Bedient and Huber (1988). 16 Rainfall data can be obtained from the California Department of Water Resources Data Exchange Center at
(http://cdec.water.ca.gov/). 17 The greatest difference occurred in the very wet 1998 water year. Gauged flows were twice the predicted value suggesting
that a higher runoff coefficient may be needed in wet years.
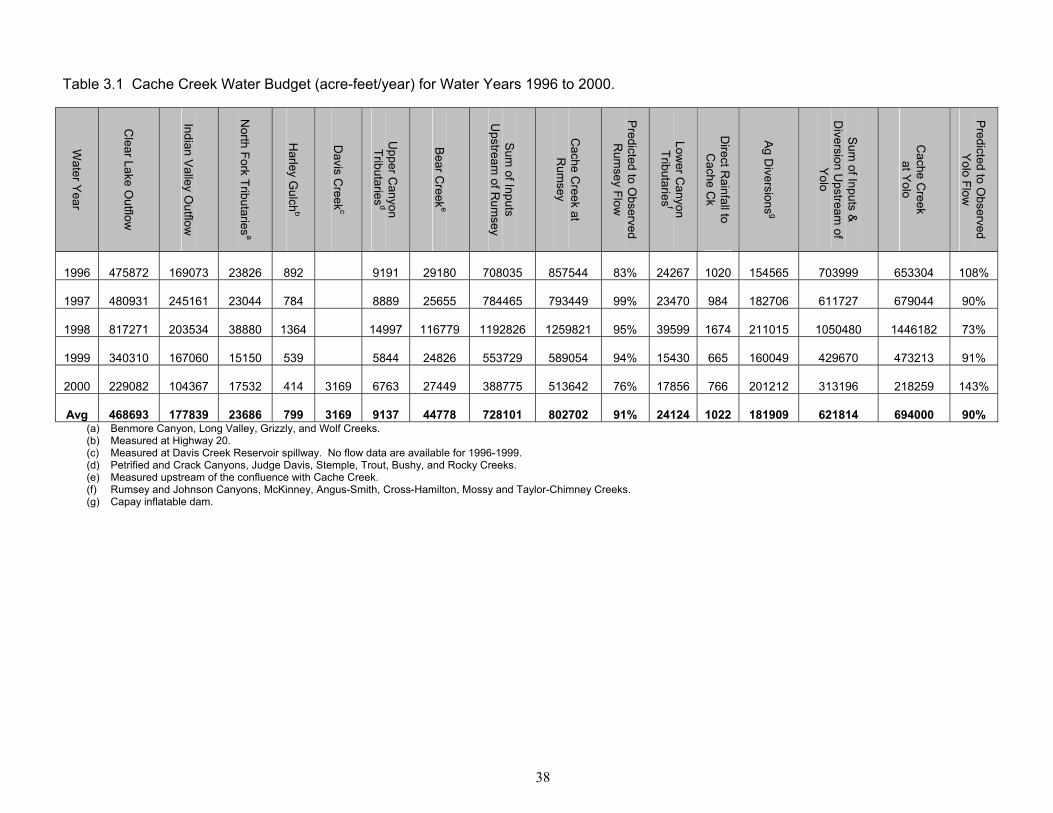
38
Table 3.1 Cache Creek Water Budget (acre-feet/year) for Water Years 1996 to 2000.
Water Y
ear
Clear Lake O
utflow
Indian Valley O
utflow
North Fork Tributaries
a
Harley G
ulchb
Davis C
reekc
Upper C
anyon Tributaries
d
Bear C
reeke
Sum
of Inputs U
pstream of R
umsey
Cache C
reek at R
umsey
Predicted to O
bserved R
umsey Flow
Lower C
anyon Tributaries
f
Direct R
ainfall to C
ache Ck
Ag D
iversionsg
Sum
of Inputs &
Diversion U
pstream of
Yolo
Cache C
reek at Y
olo
Predicted to O
bserved Y
olo Flow
1996 475872 169073 23826 892 9191 29180 708035 857544 83% 24267 1020 154565 703999 653304 108%
1997 480931 245161 23044 784 8889 25655 784465 793449 99% 23470 984 182706 611727 679044 90%
1998 817271 203534 38880 1364 14997 116779 1192826 1259821 95% 39599 1674 211015 1050480 1446182 73%
1999 340310 167060 15150 539 5844 24826 553729 589054 94% 15430 665 160049 429670 473213 91%
2000 229082 104367 17532 414 3169 6763 27449 388775 513642 76% 17856 766 201212 313196 218259 143%
Avg 468693 177839 23686 799 3169 9137 44778 728101 802702 91% 24124 1022 181909 621814 694000 90% (a) Benmore Canyon, Long Valley, Grizzly, and Wolf Creeks. (b) Measured at Highway 20. (c) Measured at Davis Creek Reservoir spillway. No flow data are available for 1996-1999. (d) Petrified and Crack Canyons, Judge Davis, Stemple, Trout, Bushy, and Rocky Creeks. (e) Measured upstream of the confluence with Cache Creek. (f) Rumsey and Johnson Canyons, McKinney, Angus-Smith, Cross-Hamilton, Mossy and Taylor-Chimney Creeks. (g) Capay inflatable dam.

39
are all likely higher than average. Flows from Indian Valley and Clear Lake are both metered and are believed to be the most accurate components of the supply side of the budget while discharges from the many small creeks throughout the basin are the least reliable. Indian Valley and Clear Lake (Figures 3.1 and 3.2) are the major sources of water in the basin, averaging 24 and 58 percent, respectively, of the measured flow at Rumsey during the five-year period. The estimated delivery of water from the many small, non-gauged tributaries appears negligible. Ungauged creeks in the upper Cache Creek canyon and in the North Fork are estimated to have yielded one and three percent, respectively, of the flow at Rumsey, while discharge from small tributaries below Rumsey averaged four percent of the Yolo flow. Bear Creek is estimated to have provided six percent of the Rumsey flow. Agricultural diversions at Capay removed about 23 percent of the annual flow at Rumsey. The reliability of the water budget is quite variable between years but on average accounted for 90-94 percent of the measured annual flow at Yolo and Rumsey. Evaporation, groundwater recharge, and consumption by riparian vegetation probably account for most of the water loss.
Figure 3-1 Cache Creek Watershed between Clear Lake and North Fork Confluence

40
Figure 3-2 North Fork Cache Creek Watershed

41
3.2.2 Bear Creek
A water budget for Bear Creek for years 1996-2001 is shown in Table 3.2. Bear Creek has a watershed area of 100 square miles (Figure 3.3). The watershed has two flow gauges. One gauge is on Sulphur Creek at the confluence with Bear Creek. This gauge is downstream of all known mercury mines that discharge to Sulphur Creek. Another gauge is on Bear Creek upstream of the confluence with Cache Creek.18 Annual flow at the upper Bear Creek monitoring station was estimated from rainfall totals and from the size of the upstream watershed using Equation 3.1. This upstream site, at the Bear Valley Road crossing, was selected because it is upstream of all mercury mine inputs and was a collection point for water and fish samples.19
Table 3.2 Bear Creek Water Budget (acre-ft/yr) for Water Years 1996-2001
Water Year Upper Bear Creek a,b Sulphur Creek a
Bear Creek at Confluence with
Cache Ck c
Sulphur to Bear Ck Flow
1996 13657 2509 29180 9% 1997 14659 2700 25655 11% 1998 24732 4556 116779 4% 1999 9637 1775 24826 7% 2000 11183 2054 27449 7% 2001 8826 1439 18311 8% Avg 13782 2506 40367 6%
(a) Flow estimated using Q=CIA (b) Bear Creek upstream of Bear Valley Road (c) Flow data retrieved from Bear Creek at Holsten Valley gauge
Spatially, about half the watershed (and half the water) originates above the most upstream monitoring site at Bear Valley Road (Upper Bear Creek, Figure 3.3). Sulphur Creek provided about six percent of the flow in the Bear Creek watershed. On an annual basis, Bear Creek flow varied six-fold during the study period. The highest flow recorded at the confluence with Cache Creek (116,779 acre-feet/yr) occurred in 1998, a very wet year, while the lowest (16,311 acre-feet/yr) was measured in 2001, a much drier year. Such large variations in flow occur because the watershed does not have a reservoir. Large changes in flow may alter interannual mercury loading patterns in Bear Creek and concentrations downstream in Cache Creek.
18 The USGS Bear Creek gauge is located above Holsten Chimney Canyon, approximately three miles upstream of the
confluence with Cache Creek. 19 Bear Valley Road crosses Bear Creek at two points. Water and fish samples were collected at the southern crossing, near
Deadshot Canyon. The southern crossing is about 12 miles upstream of the Bear Creek gauge.

42
Figure 3-3 Bear Creek Watershed

43
Figure 3-4 Harley Gulch Watershed
3.2.3 Harley Gulch
The gauge at Harley Gulch is immediately downstream of Highway 20 (Figure 3.4). Flow rates at this gauge for years 1996-2000 are shown in Table 3.1. The water body is largely ephemeral with little or no flow in summer. Harley Gulch divides into east and west branches just upstream of the gauge. The west branch contains the mercury mines. It is assumed that precipitation is the main source of water in both tributaries. Discharge at the gauge was divided between the

44
two branches in proportion to the size of the upstream watersheds. The west and east branches are 0.6 and 2.1 square miles in size, respectively, and are assumed to carry 22 and 78 percent of the gauged flow. All the water measured at the gauge was assumed to flow four miles downstream to Cache Creek. This assumption slightly underestimates winter discharge, as there are several small, unmetered tributaries that enter Harley Gulch downstream of the flow gauge.
3.3 Methylmercury Budget
Total (unfiltered) methylmercury budgets were developed for Cache and Bear Creeks and Harley Gulch. Methylmercury budgets are needed to determine where the methylmercury originated and to allocate load reductions. The methylmercury budgets are important because there is a direct correlation between water and fish tissue methylmercury concentrations in the basin (see Linkage Analysis). Methylmercury is produced in sediment and may diffuse out into the water column and be taken up by biota or be oxidized back to inorganic mercury in either water or sediment (see the Linkage Analysis). Methylmercury concentrations in water represent the combination of upstream tributary inputs and net in-channel production. Net production from the main stem channel and from ungauged tributaries was estimated by summing upstream, gauged tributary inputs and subtracting the sum from the measured downstream load. The difference between predicted and measured loads at key in-stream locations was assumed to represent net in-channel methylmercury production and the contribution from ungauged tributaries. The methylmercury source analysis is based on limited data. More monitoring will be required to confirm these loading patterns and to provide more detailed temporal and spatial information on the sources of the methylmercury within Cache Creek and the tributaries. The latter information is critical for the development of a successful methylmercury control program to reduce methylmercury concentrations in water and fish tissue.
3.3.1 Cache Creek
Aqueous methylmercury concentrations were collected in Cache Creek in 2000 and 2001 (Domagalski et al., 2004; Slotton et al., 2004a). However, as noted previously, the Rumsey gauge failed in 2001. A water budget for 2001 is not reliable; therefore, only the 2000 methylmercury budget for Cache Creek is presented (Table 3.3). Regressions were run at all sites to ascertain whether there were statistically significant relationships between flow and aqueous methylmercury concentration. Significant relationships were not found for any location. Average concentrations, therefore, were used to calculate loads. The average methylmercury concentration (about ten samples per site) was multiplied by the daily flow rate and then summed over one year to calculate site-specific, annual loads. All methylmercury concentration data are presented in Appendix B. Methylmercury data are not available for any of the ungauged tributaries or for atmospheric input. The watershed above Rumsey was the major source of methylmercury in water year 2000 (Table 3.3). The estimated methylmercury load at Rumsey was 125.7 gm/year. At Yolo,

45
35 miles downstream of Rumsey, the methylmercury load had decreased to 72.5 gm/year. The reduction was caused by the removal of agricultural water (and the associated methylmercury) at Capay Dam in summer for irrigation. The conclusion that production in the upper basin determines methylmercury concentrations throughout the watershed is consistent with observations of Slotton et al. (2004a) and Domagalski et al. (2004). There are three main sources of methylmercury above Rumsey (Table 3.3). The largest appears to be in-channel production. The difference between the sum of upstream inputs and measured methylmercury loads at Rumsey was 53 gm/yr. This represented 42 percent of the total load measured at Rumsey. No studies have been undertaken to determine the precise location where the majority of in-channel methylmercury production is occurring. Clear Lake was the second largest source of methylmercury and was estimated to have discharged 36.8 gm/yr (29% of the load measured at Rumsey). The highest concentrations and loads were exported during the summer irrigation season20 (Slotton et al., 2004a). The Sulphur Bank Mercury Mine is located in the Oaks Arm of Clear Lake and is known to have caused elevated concentrations of methyl and total mercury in Clear Lake sediment (Suchanek et al., 1997). The State of California adopted a TMDL control program for mercury in Clear Lake that is predicted to reduce total and methylmercury concentrations in the lake by 70 percent (CVRWQCB, 2002). The third largest source of methylmercury to Cache Creek was Bear Creek. Bear Creek exported 21.1 gm/yr of methylmercury or 17 percent of the Rumsey load in water year 2000 (Table 3.3). Methylmercury loads from Bear Creek to Cache Creek are most important after the irrigation season when reservoir releases are curtailed and Bear Creek becomes a major downstream source of water (Slotton et al., 2004a). The North Fork, Harley Gulch, and Davis Creek are minor sources of methylmercury to Cache Creek (Table 3.3). North Fork contributed about 10% of the methylmercury load at Rumsey. Harley Gulch and Davis Creek both have mercury mines located in their watersheds and elevated concentrations of methylmercury in their water and sediment (Slotton et al., 1995, 2004a). However, neither contributes a significant load to Cache Creek because of their small flow rates. Cache Creek between the town of Yolo and the outflow of the Settling Basin was a small net source of methylmercury (Table 3.3). Methylmercury concentrations increased by 14.3 gm/yr in this reach.21 The increase may occur in the six miles of Cache Creek between Yolo and the Settling Basin inflow and/or the Settling Basin itself. The USGS (Domagalski et al., 2004) and Regional Board staff have collected several paired datasets of methylmercury at the inflow and outflow of the Settling Basin (Table 3.4). During storm flows, concentrations of methylmercury are lower in the outflow than the inflow. The storm data suggest that in high flows with limited residence time of the water in the Settling
20 March to October (YCFCWCD, 2002a). 21 86.8 g/yr at the Settling Basin outflow – 72.5 g/yr at Yolo = 14.3 gm methylmercury/yr

46
Basin, methylmercury concentrations stay the same or decline slightly. The storm-related concentration decline likely occurs because methylmercury adsorbed to particulates descends to the bottom. In non-storm and low flow events, methylmercury concentrations were 1.3 to 3 times higher in the outflow than the inflow. These data suggest that in low-flow periods, when water slowly exits the basin, the Settling Basin increases methylmercury loads.

47
Table 3.3 Cache Creek Methylmercury Budget (grams/yr) for Water Year 2000.
Wat
er Y
ear
Cac
he C
reek
: Cle
ar
Lake
to N
orth
For
ka
Nor
th F
ork
Cac
he
Cre
ekb
Har
ley
Gul
chc
Dav
is C
reek
d
Bea
r Cre
ek
Sum
of I
nput
s U
pstre
am o
f R
umse
y
With
in C
hann
el
Pro
duct
ion
abov
e R
umse
y e
Cac
he C
reek
at
Rum
sey
Ag
Div
ersi
ons
f
Sum
of I
nput
s &
D
iver
sion
Ups
tream
of
Yol
o
With
in C
hann
el
Pro
duct
ion
betw
een
Rum
sey
and
Yol
o
Cac
he C
reek
at
Yol
o
Set
tling
Bas
in
Out
flow
2000 36.8 12.4 1.0 1.30 21.1 72.6 53.1 125.7 - 49.6 76.1 - 3.6 72.5 86.8
(a) Based on flow from Clear Lake and samples collected at the Cache Creek dam outflow and at the confluence with North Fork Cache Creek. (b) Based on flow from Indian Valley Reservoir and estimated flow from North Fork tributaries and samples collected at Highway 20 and at the confluence with main stem Cache Creek. (c) Based on flow and samples collected at Harley Gulch at Highway 20. (d) Based on flow from Davis Creek Reservoir and samples collected at the dam outflow and upstream of the confluence with Cache Creek. (e) Difference between Cache Ck at Rumsey and sum of inputs upstream of Rumsey. (f) Based on Rumsey concentration and reported diversions at Capay Dam. Table 3.4 Methylmercury Concentrations in Cache Creek Settling Basin Inflow and
Outflow Data source Date MeHg (ng/L) Percent Difference
inflow outflow Domagalski et al., 2004 3/1/2000 * 0.58 0.44 77 Domagalski et al., 2004 3/18/2000 0.088 0.20 230 Domagalski et al., 2004 2/22/2001 * 0.49 0.36 73 CVRWQCB 2/17/2004 * 0.63 0.62 98 CVRWQCB 3/24/2004 0.15 0.38 250 CVRWQCB 4/28/2004 0.24 0.32 130 CVRWQCB 6/11/2004 0.263 0.803 305 * Storm event

48
Long-Term Estimate of Loads from the Settling Basin
Regional Board staff working on the mercury TMDL for the Sacramento-San Joaquin River Delta has estimated methylmercury loads leaving the Cache Creek Settling Basin, based on a twenty-year average. Average methylmercury concentrations (collected 2000-2004) were multiplied by annual discharge from the Settling Basin during Water Years 1984-2003. As total mercury concentrations and other factors affecting methylation rates in Cache Creek have not changed significantly over this period, staff assumed that the methylmercury concentrations collected in recent years could be applied to the longer time period. The estimate of average annual water volume discharged is more robust by being calculated from 20 years of flow data. Numbers of wet and dry years in the previous two decades are approximately equivalent. The twenty-year annual average of methylmercury loads leaving the Settling Basin is 270 g/year. The long-term estimate is higher than the Settling Basin outflow load in Table 3.3, maily because of because discharge from the Settling Basin in water year 2000 was low compared to other years. The long-term estimate of methylmercury loads exported from the Settling Basin is included here in order to provide information comparable to the Delta TMDL technical report. Reductions in the Settling Basin exports that may be needed in order to reduce methylmercury concentrations in the Yolo Bypass and Delta are discussed in Section 6.
3.3.2 Bear Creek
A total methylmercury budget was also developed for Bear Creek (Table 3.4). Methylmercury concentrations were measured almost monthly by Slotton et al. (2004a) between January 2000 and May 2001 at the gauge stations on Sulphur Creek and on Bear Creek.22 An additional water quality station was added on Bear Creek upstream of Sulphur Creek at Bear Valley Road in the summer of 2000 when it became apparent that biotic concentrations of methylmercury were higher there than might be expected for a background site.23 Methylmercury loads for Bear Creek were calculated by multiplying the average methylmercury concentration at each site by annual flow to obtain annual loads. In-stream production between Bear Valley Road and the confluence with Cache Creek was estimated as the difference in the loads at Bear Valley Road and the Cache Creek confluence after subtracting out the input from Sulphur Creek. The highest methylmercury concentrations in the Bear Creek watershed were consistently observed downstream of mercury mines in Sulphur Creek. The average concentration in Sulphur Creek was 3.1 ng/L. While it is difficult with only a year and a half of data to determine seasonal patterns, the highest concentrations in Sulphur Creek occurred in July and August (18-20 ng/L). A secondary peak was seen during winter runoff in January (2.5 ng/L). Peak methylmercury concentrations in Clear Lake also occurred in August (Suchanek et al., 1997), possibly suggesting similar controls on methylmercury production. Much lower concentrations
22 Thirteen methylmercury measurements were collected in Sulphur Creek and 15 in Bear Creek. 23 Nine methylmercury samples were collected at Bear Valley Road.

49
were observed in upper Bear Creek at Bear Valley Road. The average concentration in upper Bear Creek was 0.12 ng/L, which is less than a tenth of the Sulphur Creek value. Bear Creek above the confluence with Cache Creek had an average methylmercury concentration of 0.64 ng/L. As in Sulphur Creek, the highest concentrations occurred in August (1.09 ng/L). Concentrations in Bear Creek also tended to increase with increasing winter flow.
Table 3.4 Bear Creek Methylmercury Budget (grams/yr) for Water Years 2000 and 2001. Water Year
Upper Bear Creek
Sulphur Creek
In-stream Production between Upper Bear Creek and Cache Ck Confluence
Bear Creek at Confluence
with Cache Ck
Sulphur to Bear Ck
Load 2000 1.7 8.0 11.4 21.1 38% 2001 1.3 5.6 3.9 10.8 52% Avg 1.5 6.8 7.7 16.0 45%
The primary source of methylmercury in Bear Creek appears to be in-channel production (Table 3.4). Ninety one percent of the methylmercury discharged to Cache Creek (18.9 gm/yr) originated in the 18 miles between Bear Valley Road and the gauge near the confluence with Cache Creek. Most of the methylmercury was probably produced below Sulphur Creek although no data exist at present for synthesis rates in the Bear Creek channel above and below the mine sites. Half of the Bear Creek watershed is located above the Bear Valley Road crossing. The watershed above Bear Valley Road is estimated to have produced about seven percent of the methylmercury in Bear Creek. Sulphur Creek was a minor input and accounted for 0.29 gm/yr or less than two percent of the load measured downstream at the Bear Creek gauge. More intensive sampling is required in other water years to better determine the source(s) and range of methylmercury loads from Bear Creek.
3.3.3 Harley Gulch
A methylmercury budget was estimated for Harley Gulch using the same method as was used for Cache Creek. Methylmercury loads were calculated by multiplying the average methylmercury concentration by the daily flow at the USGS gauge and then summed to determine annual loads.24 Aqueous methylmercury concentrations in Harley Gulch were among the highest in the basin. The largest single value was 8.3 ng/L in May 2001. The median concentration measured between January 2000 and August 2001 was 1.0 ng/L (Slotton et al., 2004a). Very limited spatial sampling has occurred in Harley Gulch. No information exists on exports from the east and west branches. However, a significant amount of the methylmercury production may occur in the wetland just downstream of the inactive mines on the west branch Harley Gulch. The estimated methylmercury load exported from Harley Gulch is about one gm/yr (Table 3.3). This load is relatively small in comparison to other Cache Creek inputs because of the small flow rate of Harley Gulch. 24 Ten methylmercury measurements were taken in Harley Gulch.

50
3.4 Total Mercury Budget
Total (unfiltered) mercury budgets were developed for Cache Creek, Bear Creek and Harley Gulch. The total mercury budgets are coupled in the next section with sediment budgets to estimate sources and export rates of mercury-contaminated material. Most mercury in water and sediment is in an inorganic form. The inorganic mercury content of sediment is an important factor in controlling the rate of methylmercury production and flux to overlying water (see the Linkage Analysis). A primary goal of the implementation program is to reduce mercury concentrations in sediment above Rumsey, as the upper basin is the main location for methylmercury production in the Cache Creek watershed. Mercury inputs evaluated for Cache Creek were atmospheric deposition, tributary inputs and in-channel erosion. There are no NDPES permitted discharges to Cache Creek, Bear Creek or Harley Gulch. Exports included agricultural diversions and deposition in the Cache Creek bed. Net in-channel erosion or deposition was estimated by summing all inputs and exports and comparing the result to measured values at the Rumsey and Yolo gauge sites.
3.4.1 Atmospheric Deposition
Atmospheric loads of mercury derive from global, regional , and local sources. Atmospheric input is the sum of wet and dry deposition falling directly to water surfaces and indirect deposition on the terrestrial watershed with subsequent runoff during storms. Estimating the atmospheric inputs is important to understand the significance of atmospheric deposition relative to other sources. Atmospheric deposition, however, is beyond the regulatory ability of the Regional Board. Equation 3.2 was used to determine an annual direct deposition rate for mercury on surface water in Cache Creek:
(3.2) Dt = (CwPyA)(1+Kd)
Dt = Total annual mercury deposition to Cache Creek (kg/yr) Cw = Concentration of mercury in precipitation (ng/L) Py = Annual precipitation at Cache Creek (0.622 meters/yr) A = Surface water area of Cache Creek (2x10⁶ meters2) Kd = Dry deposition coefficient (ratio of dry to wet deposition; assumed to be 1.0)
Direct wet atmospheric loads were calculated using both a lower and an upper estimate of mercury concentrations in rain in California as no information has been collected in Cache Creek. The smaller value of 3.9 ng/L in Table 3.5 is the average concentration measured in rain between 1998 and 1999 at Covelo, California. Covelo is located about a hundred miles north of San Francisco in the Coast range in Mendocino County. The site is part of the National Mercury Deposition Network (NADP, 2000a,b) and is believed to represent mercury concentrations in air

51
masses blowing on shore off the North Pacific Ocean. The upper value of 8.0 ng/L is the average concentration from three locations in the San Francisco Bay Area between September 1999 and August 2000 (SFEI, 2001b). The San Francisco Bay area, like other urban areas (USEPA, 1997h), has been found to have higher atmospheric concentrations of mercury. Dry atmospheric deposition data are not available; therefore it was estimated as a percentage of wet deposition as was done in SFEI (2001b) and NADP (2000a) (Equation 3.2). Dry deposition was calculated assuming it was equal to the wet deposition value (Table 3.5). Direct deposition of mercury on the surface of Cache Creek was estimated to be 0.009 to 0.02 kg/yr (Table 3.5). Direct atmospheric deposition on Cache Creek accounts for less than 0.01 percent of the total annual mercury load carried in the water body. These estimates are similar to other national values for mercury deposition (USEPA, 1997a). Modeling predicts that mercury deposition rates in the arid western United States should range between 0.86 and 8.00 µg Hg/m2-yr (10th and 90th percentiles of deposition, respectively) or between 4 and 30 x 10-6 kg/ac-yr (USEPA, 1997a). In comparison, the Cache Creek TMDL estimates a direct atmospheric deposition rate between 12 and 40 x 10-6 kg/ac-yr. Table 3.5 Atmospheric Deposition of Mercury to Surface of Cache Creek
Wet Deposition Hg Concentration (ng/L) (a,b)
Average Precipitation (m/yr) (c)
Area of Cache Creek (m2)
Annual Wet Hg Deposition (kg/yr)
Lower limit wet 3.9 0.622 2x10⁶ 0.0049
Upper limit wet 8.0 0.622 2x10⁶ 0.0101
Annual Wet Hg Deposition (kg/yr) Dry Deposition Percent of Wet Deposition Total Annual Hg Deposition Wet and Dry (kg/yr)
Lower limit wet 0.0049 100% 0.009
Upper limit wet 0.0101 100% 0.020 (a) Lower limit of 3.85 ng/L is average wet deposition recorded by the National Mercury Deposition Network at its
Covelo, CA station (NADP, 2000a) (b) Upper limit of 8.0 ng/L is average wet deposition at three stations in San Francisco Bay Area (SFEI, 2001b). (c) Measured at the Indian Valley Reservoir rain gauge operated by DWR. There are no major industrial sources in the Cache Creek watershed that emit mercury to the atmosphere, but mercury may be emitted from mine waste, geothermal sources, or disturbed rock that is naturally enriched with mercury. Based on measurements of mercury fluxing from soil at 22 locations at the Sulphur Bank Mercury Mine (SBMM) in nearby Clear Lake, Gustin and colleagues estimated an annual flux of 6.5 kg mercury from the mine site (Gustin et al., 2000). The flux estimates were of mercury emitted from the soil; levels of redeposition were not measured. Comparable estimates of the amount of emitted mercury that redeposits in the Cache Creek watershed have not been made. Mercury fluxing from the soil may be in the form of elemental mercury, which is relatively stable and can travel long distances in air, or reactive gaseous mercury, which is more likely to be deposited soon after emission (Gustin et al., 2000).

52
Predominant westerly winds may transport mercury to Cache Creek from flux at the SBMM in nearby Clear Lake. Remediation of waste rock by revegetation or capping is expected to reduce the flux of mercury into air. The importance of indirect atmospheric deposition on the Cache Creek watershed with subsequent transport to surface water in rain runoff has not been measured, but can be estimated from transport studies conducted elsewhere. In Ontario, researchers applied a known amount of a stable isotope of mercury (202Hg) to the terrestrial area of a watershed and measured the quantity of isotope that reached a reservoir after rain [Hintelmann, 2002 #333]. A maximum of 0.2% of the added mercury and 0.5% of the native mercury in was transported into the reservoir from the terrestrial area, which was comprised of forested and open areas on gentle slopes. In the Lake Superior watershed, Dolan and colleagues (1993) estimated that about 10% of contaminants that are wet or dry deposited in the watershed reach the lake in runoff. These estimates were derived by comparing rates of deposition of lead, mercury and PCBs to the watershed with lake loads. To estimate the amount of mercury from the atmosphere to the watershed that reaches Cache Creek, Regional Board staff applied the rates of wet and dry mercury deposition and average annual precipitation shown in Table 3.5 to the area of the entire Cache Creek watershed. The watershed area of 0.7 million acres is estimated to receive 14-28 kg/year (range comes from maximum and minimum rainfall concentration rates in Table 3.5). Assuming 10% of the terrestrial load is transported into waterways, the atmospheric contribution to loads in all of Cache Creek and tributaries is 1.4-2.8 kg/year. The atmospheric contribution entering in runoff is not shown in Table 3.6, because loads should not be counted twice (i.e., the runoff of atmospheric mercury into Bear Creek is already accounted for in Table 3.6 as part of the Bear Creek load at the Holsten Chimney gauge). In comparison with loads of mercury from mine sites or erosion of stream bed and banks, estimated atmospheric contributions of mercury, from both direct deposition to the water surface and runoff after deposition in the watershed, are quite small. As shown in Table 3.6, the estimated average, annual load of mercury in Cache Creek at Yolo is 786 kg. The maximum estimated contribution to the watershed from direct deposition to water and runoff of mercury deposited to the watershed is 0.2 + 2.8 kg/yr, which is less than 0.4% of the total mercury load at Yolo. Texas A&M University intends to measure wet and dry atmospheric deposition in the Coast Range. In addition, Moss Landing Marine Laboratory will measure surficial sediment mercury concentrations in Coast Range lakes and reservoirs not impacted by mercury mining. The two data sets should provide quantitative information on terrestrial atmospheric deposition and runoff rates in the Cache Creek Basin. Regional Board staff will evaluate this data as it becomes available. No separate, wet atmospheric deposition estimates were made for Bear Creek and Harley Gulch. The assumption is that atmospheric inputs for these smaller watersheds, like for Cache Creek,

53
are proportionally as small as for the Cache Creek watershed and account for less than one percent of the total load for each of these water bodies. In a watershed that is naturally enriched in mercury, it is understandable that the atmospheric contribution to creek loads is small. Based on cores taken in Clear Lake (Suchanek et al., 1997) and around mine sites in the Sulphur Creek watershed25, pre-industrial concentrations of mercury in soil of the Cache Creek watershed are 0.1-0.2 mg/kg. In contrast, pre-industrial concentrations in cores from Lake Tahoe are 0.03-0.04 mg/kg (Heyvaert et al., 2000). Erosion of soil from the Cache Creek watershed, even under pre-industrial conditions, would contain significantly more mercury than eroded from a Lake Tahoe-type watershed. Loss of mercury by volatilization from the Cache Creek water column to the atmosphere has not been estimated. Mercury in its elemental form (Hg0) is able to volatilize to the atmosphere. Rate of loss depends upon temperature, concentration of elemental mercury in the water column, and the background atmospheric concentration of mercury. Mercury flux to the atmosphere from Cache Creek is considered insignificant.
3.4.2 Cache Creek Tributary Mercury Loads
Tributary mercury loads were calculated in one of two ways. First, correlations were run between mercury concentration and flow to determine whether tributary-specific relationships existed. Positive relationships26 were found for Cache Creek at Rumsey and at Yolo and for the outflows from Clear Lake and from the Settling Basin (Figure 3.5). The relationships were used to calculate flow-weighted concentrations to estimate daily loads. Annual loads were calculated for each of these sites by multiplying the mean daily flow by the estimated flow-weighted mercury concentration and summing over the year.
25 Information on rock samples collected by drilling during ore prospecting in the Sulphur Creek watershed obtained from
Churchill and Clinkenbeard (2003) and personal communication from R. Atkinson, CVRWQCB to J. Cooke. 26 P<0.05

54
Figure 3-5 Relationship Between Total (Unfiltered) Mercury Concentrations and Flow.
C lear Lake Out f lo w ( Sout h Fo rk C ache)
y = 0.005x + 5.4R2 = 0.32
n = 26 p = 0.003
0
5
10
15
20
25
30
35
40
0 1000 2000 3000 4000
Fl ow ( C FS )
C ache C reek at R umsey
y = 0.12x - 75.2R2 = 0.57
n = 65 p < 0.0001
0
500
1000
1500
2000
2500
0 2000 4000 6000 8000 10000 12000
Fl ow ( CFS )
C ache C reek at Y o lo
y = 0.07x - 14.4R2 = 0.88
n = 44 p < 0.0001
0
200
400
600
800
1000
1200
1400
0 5000 10000 15000 20000 25000
Fl ow ( CFS )
Hg (n
g/L)
Cache Creek Settling Basin Outflow
y = 0.05x - 41.5 R2 = 0.83
n = 18 p < 0 0001
0
200
400
600
800
1000
1200
0 5000 10000 15000 20000 25000
Flow (CFS)

55
Alternatively to the regression method, if no correlation was observed, then the average annual mercury concentration was multiplied by the daily flow rate and summed to estimate an annual load. This second method was applied to Bear, Sulphur and Davis Creeks, Harley Gulch and the North Fork of Cache Creek. In most instances the lack of a statistically significant relationship was attributed to a small number of mercury concentration measurements. Load estimates are not available for any of the small, ungauged creeks located throughout the Cache Creek watershed because of the lack of concentration and flow data. Together these creeks are estimated to discharge about five percent of the flow and to comprise about 11% of the surface area of the basin. Loads from the ungauged tributaries in the Cache Creek Canyon are included in the category of unidentified sources as described below. Transport of mercury in Cache Creek is a function of water year. Over 1,000 kg of mercury was exported from Cache Creek at Yolo to the Settling Basin in 1998, a very wet water year (Table 3.6). In contrast, only 37 kg was discharged in 2000, a much drier year. Overall, an average of 369 kg of mercury was exported from the watershed to the Settling Basin during the five years of record. As will be discussed later, slightly less than half this material was captured in the Cache Creek Settling Basin. For comparison, the entire Central Valley of California below all major reservoirs27 is estimated to have exported 382 kg/yr of mercury to San Francisco Bay during the same time period (McKee and Foe, 2002). Cache Creek upstream of Rumsey was the major source of mercury in the watershed. The average load transported past Rumsey during the five-year period was 400 kg/yr (Table 3.6). In contrast, a slightly smaller load (369 kg/yr) was measured at the Yolo gauge and was discharged to the Settling Basin during the same time period. The decrease is attributed to removal of irrigation water (and associated mercury) at Capay Dam in summer. There were three main sources of mercury in the upper basin. The largest was an unidentified source(s) in the Cache Creek canyon. On average, only 13 percent28 of the mercury transported past Rumsey was measured in upstream tributary loads. In contrast, the water budget accounts for 94 percent of the Rumsey flow suggesting that the discrepancy lies in the mercury portion of the balance. Other mass balance studies have also concluded that the upper watershed is a net source of mercury (Foe and Croyle, 1998; Domagalski et al., 2004). The load from the unknown source(s) in the upper basin increases in wet years (Figure 3.6) implying that the source(s) are either ephemeral streams that mainly flow in wet weather or that the loads originate from erosion of bed and bank sediment not normally underwater and available for scour. Several instantaneous mass load studies have been conducted on individual days. These demonstrated that the unknown source(s) is located on or discharges to the main stem of Cache Creek between the North and Fork and Bear Creek (Foe and Croyle, 1998). Access to this reach of the Cache Creek canyon is difficult. Two float trips were undertaken several days after large storms to identify source(s) but flow, mercury and suspended sediment concentrations had decreased and
27 This is an area 20.5-times larger than Cache Creek or 23,382 versus 1,139 square miles. 28 See Table 3.6. Loads in Cache Creek at Rumsey averaged 400 kg/yr, while the sum of loads from major tributaries was
49 kg/yr [ (49/400) = 12 %].

56
the trips were not successful (Foe and Croyle, 1998). As will be discussed later, the mercury to suspended sediment ratio (Hg/TSS) of the unknown source(s) is 1.3 ppm, suggestive of mercury mine waste. Studies will be undertaken prior to the Basin Plan amendment to again attempt to identify the location of this material. The second largest source of mercury was North Fork Creek (Table 3.6). The North Fork transported an average of 18 kg/yr of mercury. North Fork Cache Creek is very erosive (see Section 3.5) and contributes a substantial amount of sediment averaging 0.2 ppm mercury to Cache Creek. The next largest source of mercury was Bear Creek, which transported an average of 15 kg/yr of mercury. Bear Creek drains the Sulphur Creek Mercury Mining District and was also a major exporter of methylmercury. Total mercury loads in Bear Creek are discussed further below.
y = 0.001x - 493.7R2 = 0.95
0100200300400500600700800900
1000
500000 700000 900000 1100000 1300000Rumsey Flow (acre-ft/yr)
Load
from
Ukn
own
Mer
cury
S
ourc
e(s)
(kg/
yr)
Figure 3-6 Relationship Between the Mercury Load from Unknown Source(s) in Upper Cache Creek and Annual Discharge at the Rumsey Gauge.

57
Table 3.6 Cache Creek Total Mercury Budget (kg/yr) for Water Years 1996 through 2000.
Water Y
ear
Cache C
reek: C
lear Lake to N
orth Fork a
North Fork C
ache C
reek b
Harley G
ulch c
Davis C
reek d
Bear C
reek e
Sum
of Inputs U
pstream of
Rum
sey
Unknow
n Sources
Above R
umsey f
Cache C
reek at R
umsey
Atm
ospheric D
eposition g
Ag D
iversions
Sum
of Inputs &
Diversion
Upstream
of Yolo
Erosion/
Deposition
between R
umsey
and Yolo h
Cache C
reek at Y
olo
Settling B
asin O
utflow
Deposition in the C
ache Creek
Settling B
asin i
1996 9 17 7 8 41 332 373 0.02 - 31 343 - 110 233 135 42%
1997 11 23 8 9 51 456 507 0.02 - 36 471 - 38 433 269 38%
1998 24 22 13 39 98 809 907 0.02 - 42 865 159 1024 643 37%
1999 6 16 5 8 33 108 143 0.02 - 32 112 7 119 65 46%
2000 3 11 4 0.04 9 27 41 68 0.02 - 40 28 9 37 19 50%
Avg 10 18 7 0.04 15 50 349 400 0.02 - 36 364 - 5 369 226 39% a) Based on flow from Clear Lake and samples collected at the Cache Creek dam outflow and at the confluence with North Fork Cache Creek. b) Based on flow from Indian Valley Reservoir and estimated flow from North Fork tributaries and samples collected at Highway 20 and at the confluence with main stem
Cache Creek. c) Based on flow and samples collected at Harley Gulch at Highway 20. The geothermal spring at Turkey Run mine contributes an estimated 0.005-0.006 kg/year of
mercury to Harley Gulch (Churchill and Clinkenbeard, 2003) d) Based on flow from Davis Creek Reservoir and samples collected at the dam outflow and upstream of the confluence with Cache Creek. e) Based on flow and samples from Bear Creek at Holsten Canyon gauge. f) Estimated by subtracting the sum of inputs upstream of Rumsey from the estimated load at Rumsey. g) Maximum estimate of wet and dry deposition of mercury to the surface of Cache Creek and tributaries. A portion of the mercury that deposits from the atmosphere to
the terrestrial areas of the watershed is expected to enter the creek through erosion; this load is incorporated within the tributary and unknown source estimates. h) Estimated by subtracting the sum of inputs and diversion at Yolo from the estimated load at Yolo. i) Estimated by subtracting the Settling Basin outflow from the Cache Creek at Yolo load.

58
The next largest source of mercury in the upper basin was Indian Valley and downstream tributaries on the North Fork (Table 3.6). On average these carried 18 kg/yr of mercury. Other studies have demonstrated that the largest tributary loaders were Benmore and Grizzly Creeks (Foe and Croyle, 1998). As shown by the sediment budget, the North Fork watersheds are very erosive and also contribute large amounts of sediment containing relatively low concentrations of mercury. Overall, sediment from the North Fork tributaries dilutes the high mercury concentration of sediment at Rumsey. Cache Creek between Clear Lake and the confluence with North Fork was a small source exporting on average 10 kg/yr of mercury (Table 3.6). Loads for this stretch were calculated using data collected from the Cache Creek Dam and just upstream of the confluence with North Fork. Several tributaries flow into Cache Creek between the dam and its confluence with the North Fork (Figure 3.1). No known mines or geothermal springs are located on these tributaries. Harley Gulch and Davis Creek were small sources of mercury and together accounted for about one percent of the Rumsey load (Table 3.6). Harley Gulch is discussed more fully below. The Davis Creek watershed contains the Harrison and Reed mercury mines and the McLaughlin gold mine. In 1984, the Homestake Mining Company constructed the Davis Creek Reservoir as a local water source for the gold mine. The Harrison and Reed mercury mines are a short distance upstream of the reservoir and drain directly to it (Montoya and Pan, 1992). Historically, the Reed Mine discharged metal-rich anoxic water directly into Davis Creek. In addition, Reed Mine tailings were deposited on a steep slope and extended down to Davis Creek where the tailings formed the stream bank for several hundred yards (Montoya and Pan, 1992). The Homestake Mining Company plugged the Reed Mine adit, covered the tailings with imported soil, and revegetated the area (Montoya and Pan, 1992). In spite of these reclamation activities, Davis Creek Reservoir has been documented to continue to trap up to 300 kg/yr of mercury waste in wet years (Reuter et al., 1996). Davis Creek Reservoir only spills into Cache Creek when it is full at the end of the rainy season in wet years. Therefore, most of the inorganic mercury that previously went into Cache Creek is now captured and contained in Davis Creek Reservoir. Davis Creek Reservoir was placed on the Clean Water Act 303(d) list because of high concentrations of methylmercury in fish tissue and will be the subject of a future TMDL. The Cache Creek Settling Basin can be both a sink and a source for mercury leaving the Cache Creek basin and entering the Yolo Bypass. Instantaneous measurements demonstrate that the Settling Basin traps about half the mercury entering it at flows greater than 150 cfs while being a net source of mercury at lower discharge rates (Foe and Croyle, 1998). Over the five years of measurement, the Settling Basin was found to capture 143 kg/yr or 40 percent of the mercury entering it (Table 3.6). Engineering feasibility studies are being undertaken in the Settling Basin (see the Implementation Section) to ascertain whether it can be redesigned to trap and remove more mercury before discharge to the Yolo Bypass and the Bay-Delta Estuary.
3.4.3 Bear Creek
Total mercury loads for Bear Creek were calculated in the same manner as for Cache Creek. First, a correlation was run between mercury concentration and flow to determine whether site-

59
specific relationships might exist. No relationship was found, so the average mercury concentration was multiplied by the annual discharge rate to estimate site-specific loading rates. Total mercury loads for Bear Creek are presented in Table 3.7. Sulphur Creek is a major source of mercury to Bear Creek. Regional Board staff estimated an average annual mercury load from Sulphur Creek of 3.4 kg/yr in 2000 and 2001.29 The load represents 48 percent of the total load exported from Bear Creek to Cache Creek. The loads estimated by Regional Board are within the range estimated by Suchanek and colleagues (2004)30 who monitored Sulphur Creek in 2000 and 2001 and estimated that mercury loads ranged between 0.2 and 10.7 kg/yr. In both years, the greatest loads were exported between January and April. The Sulphur Creek loads derive from a combination of mine waste and geothermal spring activity. Churchill and Clinkenbeard (2002) estimated that runoff from the mine wastes contributes between 4.4 and 18.4 kg/yr of mercury to Sulphur Creek in a typical year. Some mercury from the mines may become deposited in the stream bed prior to reaching the Sulphur Creek gauge. This mercury may then be remobilized during very high flow events. Sulphur Creek sources are detailed in a separate TMDL report.
Table 3.7 Bear Creek Total Mercury Budget (kg/yr) for Water Years 2000 and 2001.
Water Year
Upper Bear Creek a
Sulphur Creek
Sources between Bear Valley Rd and the Cache
Creek Confluence b
Bear Creek at Confluence
with Cache Ck
Sulphur to Bear Ck
Load 2000 0.5 4.0 4.8 9.3 43% 2001 0.4 2.8 1.6 4.8 58% Avg 0.5 3.4 3.2 7.1 48%
(a) Bear Creek at Bear Valley Road. (b) Estimated by subtracting the sum of Upper Bear Creek and Sulphur Creek loads from Bear Creek
at the confluence.
Forty-five percent of the Bear Creek load derives from sources between Bear Valley Road and the confluence with Cache Creek. Part of this mercury is assumed to come from the inactive mines on the west side of Bear Vally (North and South Petray, Rathburn, and Rathburn-Petray mines). Churchill and Clinkenbeard (2004) estimated that 1-24 kg mercury/yr erodes from these sites. Although mine waste can be observed in drainages leading from the sites to Bear Creek, loads in these ephemeral tributaries have not been measured. In 2004-2005, staffs from the Regional Board and USBLM intend to monitor to further evaluate mercury transport from the watershed. Additional sources of mercury in this reach of Bear Creek are resuspension of material from the Sulphur and Bear Creek mines that was previously deposited in the floodplain and thermal springs. Suspended sediment mercury concentrations suggest that much of this material is from the remobilization of historic mercury mine waste deposited below Sulphur Creek (Table 3.12). 29 The average mercury concentration in Sulphur Creek at the gauge is based on 23 samples collected in 1997-2002. This
average concentration was multiplied by annual flow in 2000 and 2001 to obtain annual loads shown in Table 3.7. 30 Suchanek et al. (2004) used a different method of estimating annual loads than did Regional Board staff. Suchanek and
colleagues multiplied a monthly mercury measurement (collected in 2000 and 2001) by the minimum and maximum daily flow rate at the USGS gauge to obtain minimum and maximum monthly loads of mercury. The monthly values were then summed to obtain minimum and maximum annual loads.

60
Finally, the smallest mercury loads came from the non-mine impacted watershed above Bear Valley Road. As previously noted, about half the watershed is located upstream of Bear Valley Road. The upper watershed contributed about seven percent of the Bear Creek mercury load.
3.4.4 Harley Gulch
Regional Board staff estimated that the load of mercury in Harley Gulch at the gauge site averaged 7 kg/yr between 1996 and 2000. Annual loads were calculated by multiplying the average aqueous concentration of total mercury by the daily flow rate and then summing over the year. Sources of mercury entering Harley Gulch include erosion of naturally mercury-enriched soils and excavated overburden and tailings from historic mining operations. A geothermal spring below Abbott Mine contains small amounts of mercury and has low flow. Harley Gulch splits into two branches just upstream of the gauge site, with the inactive mercury mines on the west branch. Regional Board staff estimated the percent mercury contributions from the east and west branches (Table 3.8). These estimates are based on mercury concentrations in samples collected simultaneously at the bottom of each Branch and relative watershed sizes of each Branch. The west branch Harley Gulch contributed between 81 and 95% of the total mercury load seen downstream at the gauge. The Regional Board estimates are in agreement with observations by Suchanek and colleagues (2004) that the mines were the primary source of mercury of mercury loads measured at the gauge (below Highway 20). Suchanek and others (2004) measured flow and total mercury concentrations at multiple points around the mercury mine complex during two storms in 2001. The east branch, consistent with its larger size, carried three to four times as much water as the west branch. However, mercury loads were four times higher on the west branch. A primary source of mercury in the west branch is a 220,000-ton calcine pile located just below Abbott Mine that forms the north bank and is eroding into the creek. The mercury content of the pile averages 60 ppm with a range of 20-220 ppm (Churchill and Clinkenbeard, 2002). Churchill and Clinkenbeard (2002) estimated that the two mines contribute 1.2 to 10.2 kg/yr of mercury to Harley Gulch.31 They noted that the mercury content of soil around mine deposits can be naturally high. Erosion of this soil or of mine waste could result in loads greater than these estimates in very wet years. The estimate of loads from the west branch of Harley Gulch includes a small load from the Turkey Run geothermal spring. The spring flows from the collapsed, lower adit at Turkey Run, approximately 175 m from the stream and has a flow rate of 50-60 l/min (Goff et al., 2001; Tetra Tech, 2004). Using mercury concentration data reported by Rytuba (2000), Churchill and Clinkenbeard (2004) estimated that the Turkey Run Spring discharges 0.005-0.006 kg/yr of mercury. The load from the thermal spring is about 0.1% of the load measured at the Harley Gulch gauge. The spring also delivers sulfate (estimated 50,000-159,000 kg/yr; Tetra Tech, 2004), which may facilitate methylation of mercury downstream.
31 Data are available for estimating loads from each mine site but is combined here as the entire complex is owned by the same
landowners. Churchill and Clinkenbeard (2002) estimated loads using average precipitation, surface area, soil type, slope of mine waste and tailings piles and mercury content of the soil and waste piles in a soil loss equation.

61
The Regional Board staff estimate of mercury loads in Harley Gulch at the gauge does not include any estimate of loads added downstream of the gauge to the confluence at Cache Creek. There is an estimated 3.4-acre alluvial fan at the confluence of Harley Gulch and Cache Creek that contains an estimated 10,000 cubic yards of eroded material. This alluvial fan likely contains mercury mine waste. The fan is a possible source of mercury measured at Rumsey and is part of the large source currently labeled as “unknown”. Staff from the Regional Board and California Department of Fish and Game collected samples from the Harley Gulch watershed downstream of the gauge and in the alluvial fan in September 2003. The results from this study will be considered in the Basin Plan amendment staff report. Table 3.8 Harley Gulch Tributary Loads
Total Mercury Concentrations (ng/L) Sample Date West branch Harley
(mine side) (0.6 miles2) East branch Harley
(2.1 miles2)
Contribution of west branch Harley to the total mercury load
based on watershed areaa 02/14/2000 2070 135 81% 12/03/2001 889 23.7 91% 01/02/2002 2976.4 43.1 95% (a) Gauged flow is not available for the west and east branches of Harley Gulch. Based on Equation 3.1 (Q=CIA), area is related to flow. A relative source contribution equation was used to determine percent mercury contribution from each branch. For example: __ 2070(0.6) = 81% 2070(0.6) + 135(2.1)
3.5 Sediment Budget
A primary method to reduce fish methylmercury concentrations is to reduce inorganic mercury levels in sediment (see Linkage Analysis). To accomplish this, it is necessary to understand the dynamics of both mercury and sediment in a basin. Sediment budgets for Cache and Bear Creeks are presented below. Insufficient data are available to develop a sediment budget for Harley Gulch. In the next section, the sediment budgets are combined with the mercury budgets to determine how mercury and sediment loads interact to produce observed downstream changes in sediment mercury concentrations in depositional areas. The two budgets can also be used to predict how reducing upstream loads of either mercury or sediment will change downstream sediment mercury concentrations.
3.5.1 Cache Creek
The sediment budget (Table 3.9) for Cache Creek was calculated in a manner analogous to the mercury budget. Tributary inputs were estimated by regressing flow against suspended sediment concentrations. Positive relationships were found for Cache Creek at Rumsey and at Yolo, outflow from both Clear Lake and from the Settling Basin, and Harley Gulch at Highway 20 (Figure 3.7). The relationships were used to calculate flow-weighted suspended sediment concentrations to estimate loads. Annual loads were calculated for each of these sites by multiplying the mean daily flow by the estimated flow-weighted suspended sediment concentration and summing over the year. If no correlation was observed, then the average suspended sediment concentration at the site was multiplied by the annual discharge rate to

62
estimate a load. This procedure was used at Davis and Bear Creeks and at North Fork Cache Creek. The principal sources and sinks for sediment were summed to estimate export rate at Rumsey, Yolo and the Settling Basin Outflow. The principal sources were tributary inputs and within channel scour. Major sinks were deposition in the Cache Creek Settling Basin and diversion of irrigation water at Capay Dam. Erosion above Rumsey from unknown sources was estimated as the difference between the sum of upstream tributary inputs and the load at Rumsey. Similarly, erosion between Rumsey and Yolo was estimated as the difference between the loads at these two gauge sites. Deposition in the Cache Creek Settling Basin was calculated from the difference in suspended sediment loads at Yolo and exiting the Settling Basin.

63
C ache C reek at Y o lo
y = 0.13x + 67.7R2 = 0.69
n= 41 p < 0.0001
0
500
1000
1500
2000
2500
3000
0 5000 10000 15000 20000 25000
Fl ow ( CFS )
Figure 3-7 Relationship Between Total Suspended Sediment Concentration and Flow in the Cache Creek Basin.
C lear Lake Out f lo w ( So ut h F o rk C ache)
y = 0.028x + 18.2R2 = 0.29
n= 23 p=0.009
0
50
100
150
200
250
0 1000 2000 3000 4000
Fl ow ( CFS )
Har ley Gulch
y = 86.19x - 396.0R2 = 0.85
n = 17 p < 0.0001
0
1000
2000
3000
4000
5000
6000
7000
8000
0 20 40 60 80
Fl ow ( CFS )
C ache C reek at R umsey
y = 0.11x - 18.7R2 = 0.58
n = 26 p < 0.0001
0
200
400
600
800
1000
1200
1400
1600
1800
0 2000 4000 6000 8000 10000 12000
Fl ow ( CFS )
C ache C reek Set t l ing B asinOut f lo w
y = 0.082x + 6.0R2 = 0.81
n = 15 p < 0.0001
0
200
400
600
800
1000
1200
1400
1600
1800
2000
0 5000 10000 15000 20000 25000
Fl ow ( CFS )
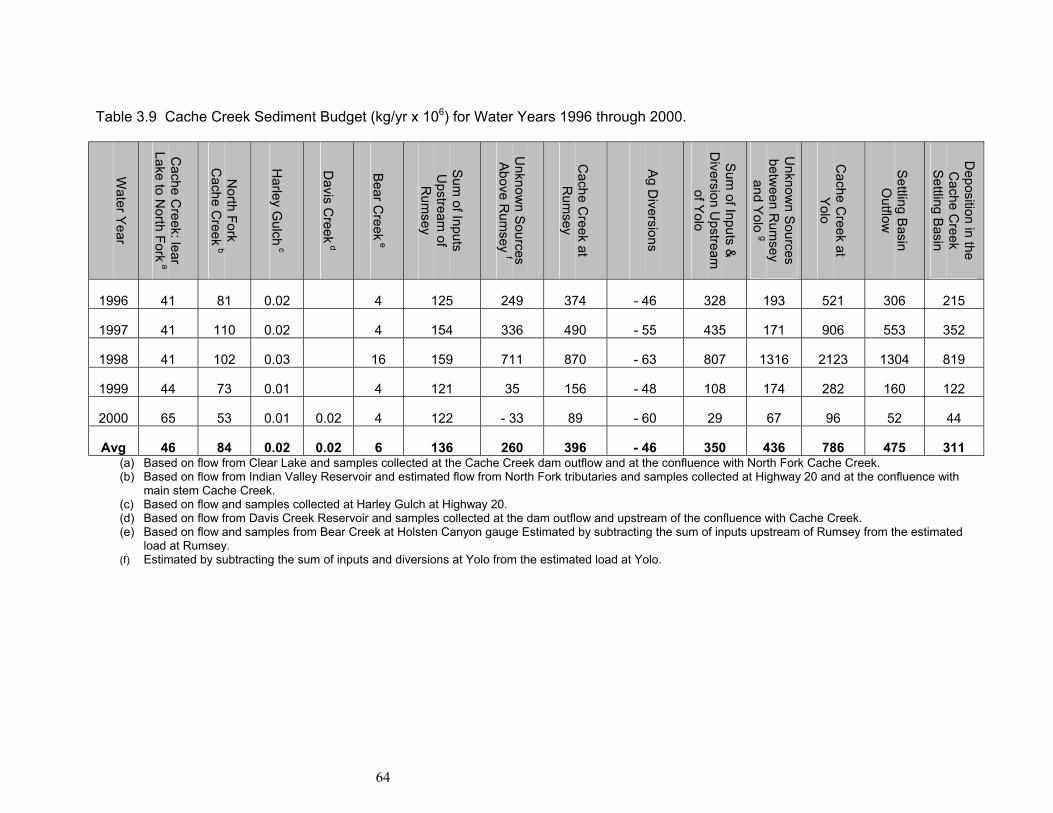
64
Table 3.9 Cache Creek Sediment Budget (kg/yr x 106) for Water Years 1996 through 2000.
Water Y
ear
Cache C
reek: lear Lake to N
orth Fork a
North Fork
Cache C
reek b
Harley G
ulch c
Davis C
reek d
Bear C
reek e
Sum
of Inputs U
pstream of
Rum
sey
Unknow
n Sources
Above R
umsey f
Cache C
reek at R
umsey
Ag D
iversions
Sum
of Inputs &
Diversion U
pstream
of Yolo
Unknow
n Sources
between R
umsey
and Yolo g
Cache C
reek at Y
olo
Settling B
asin O
utflow
Deposition in the C
ache Creek
Settling B
asin
1996 41 81 0.02 4 125 249 374 - 46 328 193 521 306 215
1997 41 110 0.02 4 154 336 490 - 55 435 171 906 553 352
1998 41 102 0.03 16 159 711 870 - 63 807 1316 2123 1304 819
1999 44 73 0.01 4 121 35 156 - 48 108 174 282 160 122
2000 65 53 0.01 0.02 4 122 - 33 89 - 60 29 67 96 52 44
Avg 46 84 0.02 0.02 6 136 260 396 - 46 350 436 786 475 311 (a) Based on flow from Clear Lake and samples collected at the Cache Creek dam outflow and at the confluence with North Fork Cache Creek. (b) Based on flow from Indian Valley Reservoir and estimated flow from North Fork tributaries and samples collected at Highway 20 and at the confluence with
main stem Cache Creek. (c) Based on flow and samples collected at Harley Gulch at Highway 20. (d) Based on flow from Davis Creek Reservoir and samples collected at the dam outflow and upstream of the confluence with Cache Creek. (e) Based on flow and samples from Bear Creek at Holsten Canyon gauge Estimated by subtracting the sum of inputs upstream of Rumsey from the estimated
load at Rumsey. (f) Estimated by subtracting the sum of inputs and diversions at Yolo from the estimated load at Yolo.

65
The Cache Creek watershed above Rumsey was the source of significant amounts of sediment during the period of 1996-2000 (Table 3.9). The watershed above Rumsey was estimated to have exported 396 million kg/yr of sediment. The major source(s) above Rumsey, as for mercury, remain unidentified. On average these unknown source(s) contributed 66 percent of the Rumsey load or 260 million kg/yr of sediment. Two candidate sources of sediment, as for mercury, are erosion from ephemeral tributaries in the Cache Creek Canyon between the North Fork Cache Creek and Bear Creek, and erosion of bed and bank sediment in the same reach of the main stem Cache Creek channel. The North Fork was the second largest sediment source measured at Rumsey and exported 84 million kg/yr of material. Major inputs to the North Fork are Benmore and Grizzly Creeks. Cache Creek between the Cache Creek dam and North Fork was the next largest source and exported 46 million kg/yr of sediment. Harley Gulch, Davis Creek and Bear Creek were minor inputs of sediment to Cache Creek. The Cache Creek watershed below Rumsey also appears to be erosional. Between Rumsey and Yolo, the erosion rate was calculated32 as 390 million kg/yr. The two possible source(s) of sediment below Rumsey are the many ephemeral creeks draining into Cache Creek above Yolo and bed and bank scour in the main stem channel. Finally, the Settling Basin trapped 311 million kg/yr of sediment or 40 percent of the material entering it. In the previous section, the Basin was found to have trapped a similar portion of the mercury fluxing through it.
3.5.2 Bear Creek
Suspended sediment loads for Bear Creek were calculated in the same fashion as they were for Cache Creek. First, a regression analysis was run between suspended sediment and flow to determine if site-specific relationships existed. No significant relationships were found, so the average suspended sediment concentration was multiplied by the annual flow rate to estimate a site-specific loading rate. The major source of suspended sediment in Bear Creek was in-channel erosion and small tributary inputs between Bear Valley Road and the confluence with Cache Creek. These contributed an average of 1.8 million kg/yr of sediment in 2000 and 2001 (Table 3.10). This represents 60 percent of the sediment exported from the watershed. The next most important source was the Bear Creek watershed above Bear Valley Road. The upper watershed provided about 30 percent of the sediment load. Finally, Sulphur Creek averaged about ten percent of the annual sediment budget.
32 786 million kg/yr in Cache Creek at Yolo – 396 million kg/yr at Rumsey = 390 million kg/yr net input of sediment from
unknown sources between Rumsey and Yolo.

66
Table 3.10 Bear Creek Sediment Budget (kg/yr x 106) for Water Years 2000 and 2001. Water Year
Upper Bear Creek a
Sulphur Creek
Erosion between Bear Valley Rd and the Cache
Creek Confluence b
Bear Creek at Confluence
with Cache Ck
Sulphur to Bear Ck
Load 2000 1.0 0.3 2.6 3.9 8% 2001 0.8 0.2 1.0 2.0 10% Avg 0.9 0.3 1.8 3.0 10%
(a) Bear Creek at Bear Valley Road. (b) Estimated by subtracting the sum of Upper Bear Creek and Sulphur Creek loads from Bear Creek at the
confluence.
3.6 Mercury to suspended sediment ratio
The ratio of concentrations of mercury to suspended sediment (Hg/TSS) in water is a measure of surficial sediment mercury contamination. By comparing mercury levels in suspended sediment at multiple points in the streambed and tributaries, this ratio can be used to identify mercury sources. Note that all sources of mercury contribute to the levels of mercury in suspended sediment downstream of the sources, including inputs from mine waste, mercury-containing soil, geothermal springs or atmospheric deposition. While mercury from geothermal springs or air may enter the water primarily in unbound or dissolved form, much of the mercury will rapidly attach to particles (Rytuba, 2000). The following section contains three parts. The first part describes the mercury to suspended sediment ratios in Cache and Bear Creeks and Harley Gulch. In the next section, the ratios of mercury to suspended sediment and the measurements of mercury in bed sediment are compared. Finally, an equation is developed to calculate the concentration of mercury in suspended sediment using mercury and sediment concentrations from upstream inputs. This equation can be used to predict changes in suspended sediment concentrations after control actions take place to reduce upstream loads. A positive correlation exists between the mercury content of sediment and its methylmercury production rate (see the Linkage Analysis). The efficiency with which methylmercury is created from inorganic mercury has been found to be a function of a number of site specific factors including the form of the inorganic mercury, its sulfate and organic content, and the type of aquatic habitat where it is deposited. It is not possible at present to determine a scientifically defensible sediment mercury concentration that will protect the beneficial uses of Cache Creek. However, the San Francisco Bay mercury control program (San Francisco Regional Water Quality Control Board, 2003) has set a sediment goal of 0.2 ppm mercury for material exported from the Central Valley to San Francisco Bay. To meet this objective, the Central Valley Regional Board must minimize the export of material with more than this amount of mercury. Identification of sources and establishment of control programs to remove material contaminated with greater than 0.2 ppm mercury will be used to meet the San Francisco goal. The same control programs should also lower methylmercury production and its subsequent bioaccumulation in fish.
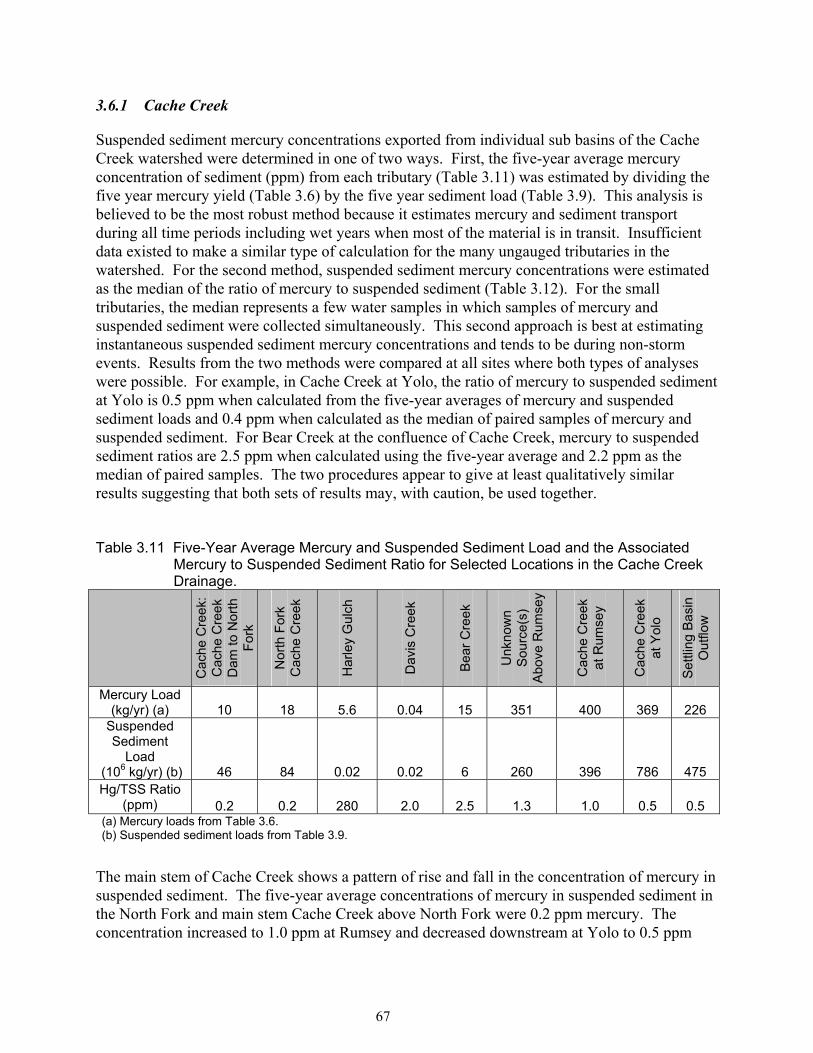
67
3.6.1 Cache Creek
Suspended sediment mercury concentrations exported from individual sub basins of the Cache Creek watershed were determined in one of two ways. First, the five-year average mercury concentration of sediment (ppm) from each tributary (Table 3.11) was estimated by dividing the five year mercury yield (Table 3.6) by the five year sediment load (Table 3.9). This analysis is believed to be the most robust method because it estimates mercury and sediment transport during all time periods including wet years when most of the material is in transit. Insufficient data existed to make a similar type of calculation for the many ungauged tributaries in the watershed. For the second method, suspended sediment mercury concentrations were estimated as the median of the ratio of mercury to suspended sediment (Table 3.12). For the small tributaries, the median represents a few water samples in which samples of mercury and suspended sediment were collected simultaneously. This second approach is best at estimating instantaneous suspended sediment mercury concentrations and tends to be during non-storm events. Results from the two methods were compared at all sites where both types of analyses were possible. For example, in Cache Creek at Yolo, the ratio of mercury to suspended sediment at Yolo is 0.5 ppm when calculated from the five-year averages of mercury and suspended sediment loads and 0.4 ppm when calculated as the median of paired samples of mercury and suspended sediment. For Bear Creek at the confluence of Cache Creek, mercury to suspended sediment ratios are 2.5 ppm when calculated using the five-year average and 2.2 ppm as the median of paired samples. The two procedures appear to give at least qualitatively similar results suggesting that both sets of results may, with caution, be used together. Table 3.11 Five-Year Average Mercury and Suspended Sediment Load and the Associated
Mercury to Suspended Sediment Ratio for Selected Locations in the Cache Creek Drainage.
Cac
he C
reek
: C
ache
Cre
ek
Dam
to N
orth
Fo
rk
Nor
th F
ork
Cac
he C
reek
Har
ley
Gul
ch
Dav
is C
reek
Bea
r Cre
ek
Unk
now
n S
ourc
e(s)
A
bove
Rum
sey
Cac
he C
reek
at
Rum
sey
Cac
he C
reek
at
Yol
o
Set
tling
Bas
in
Out
flow
Mercury Load
(kg/yr) (a) 10 18 5.6 0.04 15 351 400 369 226 Suspended Sediment
Load (106 kg/yr) (b) 46 84 0.02 0.02 6 260 396 786 475 Hg/TSS Ratio
(ppm) 0.2 0.2 280 2.0 2.5 1.3 1.0 0.5 0.5 (a) Mercury loads from Table 3.6. (b) Suspended sediment loads from Table 3.9.
The main stem of Cache Creek shows a pattern of rise and fall in the concentration of mercury in suspended sediment. The five-year average concentrations of mercury in suspended sediment in the North Fork and main stem Cache Creek above North Fork were 0.2 ppm mercury. The concentration increased to 1.0 ppm at Rumsey and decreased downstream at Yolo to 0.5 ppm
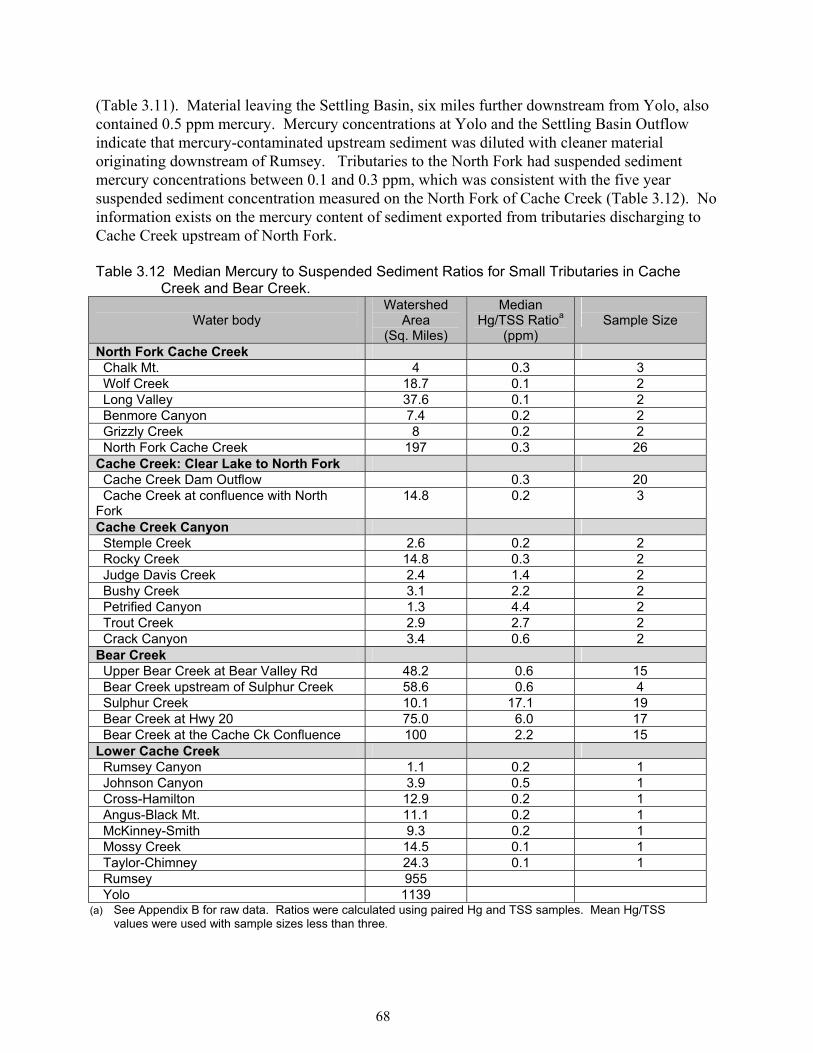
68
(Table 3.11). Material leaving the Settling Basin, six miles further downstream from Yolo, also contained 0.5 ppm mercury. Mercury concentrations at Yolo and the Settling Basin Outflow indicate that mercury-contaminated upstream sediment was diluted with cleaner material originating downstream of Rumsey. Tributaries to the North Fork had suspended sediment mercury concentrations between 0.1 and 0.3 ppm, which was consistent with the five year suspended sediment concentration measured on the North Fork of Cache Creek (Table 3.12). No information exists on the mercury content of sediment exported from tributaries discharging to Cache Creek upstream of North Fork. Table 3.12 Median Mercury to Suspended Sediment Ratios for Small Tributaries in Cache
Creek and Bear Creek.
Water body Watershed
Area (Sq. Miles)
Median Hg/TSS Ratioa
(ppm)
Sample Size
North Fork Cache Creek Chalk Mt. 4 0.3 3 Wolf Creek 18.7 0.1 2 Long Valley 37.6 0.1 2 Benmore Canyon 7.4 0.2 2 Grizzly Creek 8 0.2 2 North Fork Cache Creek 197 0.3 26 Cache Creek: Clear Lake to North Fork Cache Creek Dam Outflow 0.3 20 Cache Creek at confluence with North Fork
14.8 0.2 3
Cache Creek Canyon Stemple Creek 2.6 0.2 2 Rocky Creek 14.8 0.3 2 Judge Davis Creek 2.4 1.4 2 Bushy Creek 3.1 2.2 2 Petrified Canyon 1.3 4.4 2 Trout Creek 2.9 2.7 2 Crack Canyon 3.4 0.6 2 Bear Creek Upper Bear Creek at Bear Valley Rd 48.2 0.6 15 Bear Creek upstream of Sulphur Creek 58.6 0.6 4 Sulphur Creek 10.1 17.1 19 Bear Creek at Hwy 20 75.0 6.0 17 Bear Creek at the Cache Ck Confluence 100 2.2 15 Lower Cache Creek Rumsey Canyon 1.1 0.2 1 Johnson Canyon 3.9 0.5 1 Cross-Hamilton 12.9 0.2 1 Angus-Black Mt. 11.1 0.2 1 McKinney-Smith 9.3 0.2 1 Mossy Creek 14.5 0.1 1 Taylor-Chimney 24.3 0.1 1 Rumsey 955 Yolo 1139
(a) See Appendix B for raw data. Ratios were calculated using paired Hg and TSS samples. Mean Hg/TSS values were used with sample sizes less than three.

69
The increase in suspended sediment concentrations at Rumsey resulted from a combination of inputs from mines and unknown source(s) in the upper basin. The average mercury concentrations of sediment exported from Harley Gulch, Bear and Davis Creeks were 280, 2.5, and 2.0 ppm mercury, respectively. The unknown source(s) are estimated to have an average mercury concentration of 1.3 ppm. The mercury content of this material appears similar to concentrations in Davis and Bear Creeks, watersheds known to contain mercury mine waste. As previously noted, possible candidates for the unknown source(s) include the many small ephemeral tributaries in the Cache Creek Canyon or erosion of bed and bank sediment in the same reach of the main stem Creek. The mercury to suspended sediment ratios of tributaries in the Cache Creek canyon vary between 0.2 and 4.4 ppm mercury (Table 3.12), consistent with some tributaries being candidate sources. Alternatively, the unknown material may be historic mercury mining waste that has been deposited along the high water bank in the main channel during active mercury mining and is gradually eroding away. No detailed spatial information exists on the mercury distribution of bedded sediment in the canyon. This information could help identify the source and present location of the unknown material. The inactive mine sites may also contribute additional mercury-contaminated material during severe runoff events. The five-year average suspended sediment mercury concentration at Yolo was 0.5 ppm or half the Rumsey concentration (Table 3.11). The mercury and sediment budgets suggest that the decrease in the suspended sediment mercury concentration at Yolo was caused by a combination of deposition of a portion of the more contaminated material somewhere below Rumsey and input of cleaner material diluting the remaining, contaminated sediment continuing to move downstream. The mercury budget (Table 3.6) demonstrates a small, average net gain (5 kg/yr) of mercury between Rumsey and Yolo. In contrast, the net contribution of suspended sediment from unknown sources in this stretch was large (436 kg/yr; Table 3.9), implying that the sediment source(s) within this stretch must have a low mercury concentration. One likely source of the diluting material is the many small ephemeral creeks in the lower watershed. These have, with the exception of Johnson Canyon, a suspended sediment mercury concentration of 0.2 ppm or less (Table 3.12). Suspended sediment from Johnson Canyon had 0.5 ppm mercury. If the average mercury concentration of the incoming sediment was 0.2 ppm, then the predicted mercury contribution from the unknown sources between Rumsey and Yolo33 would be about 87 kg/yr. The fact that mercury loads only increase by 5 kg/yr implies that some upstream mercury is being deposited below Rumsey. The depositional area is likely located between Rumsey and Capay Dam, as the slope of the watershed attenuates and the canyon opens up into a broad flood plain in this reach. Finally, the mercury concentrations of suspended sediment entering (near Yolo) and exiting the Settling Basin were similar, suggesting that there was no preferential settlement of mercury contaminated material within the Settling Basin. Suspended sediment concentrations at depositional areas in the basin can be calculated from the sum of upstream mercury loads divided by the sum of suspended sediment (TSS) loads:
33 (0.2 ppm mercury) (436 million kg sediment) = 87 kg mercury

70
(3.3) Sediment concentration = ∑ Upstream Hg Loads ∑ Upstream TSS Loads
Equation 3.3 can be used to predict how downstream suspended sediment concentrations would change if one or more upstream inputs were reduced. One goal of the implementation plan will be to identify and reduce the inputs of the unknown source(s) of mercury in the Cache Creek canyon. The load of mercury from the unknown source(s) is large, relative to the known loads from the tributaries. If, for example, the load of the unknown source in the upper basin was reduced by 65 percent, then suspended sediment concentrations at Rumsey34 and Yolo35 would decrease to 0.76 and 0.23 ppm mercury, respectively. The results emphasize the importance of identifying the unknown source and evaluating how to immobilize or remove it from the active channel if the San Francisco Bay TMDL sediment goal of 0.2 ppm mercury is to be met. In contrast to the unknown source, existing data suggest that eliminating all sediment and mercury export from Harley Gulch, Davis and Bear Creeks would not appreciably change downstream sediment concentrations at Rumsey36 or Yolo.37 This is because the mining districts export a relatively small proportion of the total amount of mercury and sediment transported in the watershed (Tables 3.6 and 3.9). The importance of the mine sites should not be completely minimized. Of the mercury and suspended sediment analyses used to derive the average load estimates, few of the samples were collected during peak runoff events, when most of the mercury and suspended sediment is expected to be mobilized from the mine sites. Because the drainage areas of the mine sites are relatively small, timing the collection of samples to capture the height of the runoff is difficult. Churchill and Clinkenbeard (2002) estimated long-term average loading rates for the Harley Gulch and Sulphur Creek mines that were similar to or somewhat higher than average loads estimated using concentration data at the gauges (Tables 3.6 and 3.4).38 They also suggested that present load estimates may underestimate loads during severe storm events.
34 Values in the numerator and denominator are load estimates from inputs to Rumsey for mercury (Table 3.6) and suspended
sediment (Table 3.9), respectively. To illustrate the effect on suspended sediment concentrations at Rumsey, loads from the unknown source are assumed to be reduced by 65% of the estimated loads (i.e., 351 kg/yr mercury * 0.35 = 123 kg/yr).
10 + 18 + 5.6 + 0.04 + 15 +123 = 172 = 0.76 ppm mercury 46 + 84 + 0.02 + 0.02 + 6 + 91 227
35Loads at Rumsey, agricultural diversions and the unknown inputs between Rumsey and Yolo are used in Equation 3 to estimate
the effect on sediment concentrations at Yolo of reducing unknown sediment and mercury loads in the Cache Canyon by 65%. 172 –36 + 5 = 0.23 ppm mercury 227- 46 + 436
36 Substituting values from Table 3.11 into Equation 3.3 yields 10 + 18 + 351 = 379 = 0.97 ppm mercury 46 + 84 + 260 390
37 Similarly for Yolo, 379 – 36 –5 = 0.43 ppm mercury. 390 – 46 + 436 38 The Churchill and Clinkenbeard estimate of long-term annual loads for mines in the Sulphur Creek watershed was 4.4 to
18.6 kg/yr, which is higher than the Regional Board load estimate of 3.4 kg/yr at the Sulphur Creek gauge. Mine waste may
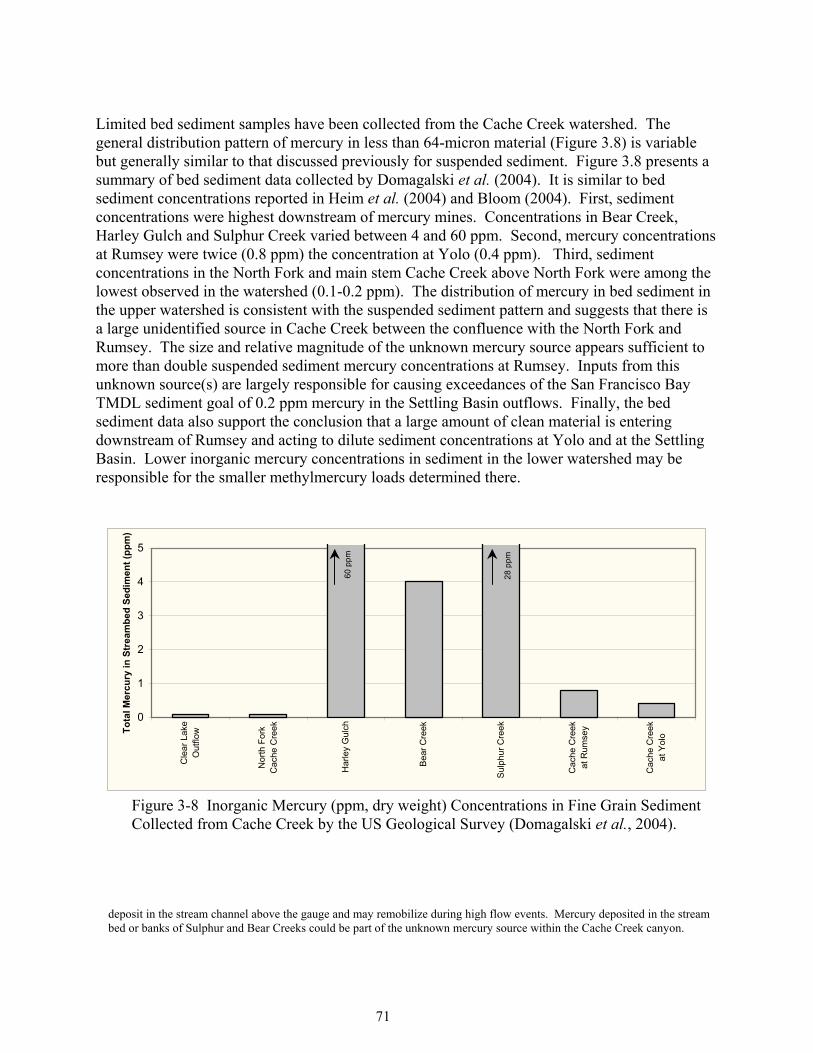
71
Limited bed sediment samples have been collected from the Cache Creek watershed. The general distribution pattern of mercury in less than 64-micron material (Figure 3.8) is variable but generally similar to that discussed previously for suspended sediment. Figure 3.8 presents a summary of bed sediment data collected by Domagalski et al. (2004). It is similar to bed sediment concentrations reported in Heim et al. (2004) and Bloom (2004). First, sediment concentrations were highest downstream of mercury mines. Concentrations in Bear Creek, Harley Gulch and Sulphur Creek varied between 4 and 60 ppm. Second, mercury concentrations at Rumsey were twice (0.8 ppm) the concentration at Yolo (0.4 ppm). Third, sediment concentrations in the North Fork and main stem Cache Creek above North Fork were among the lowest observed in the watershed (0.1-0.2 ppm). The distribution of mercury in bed sediment in the upper watershed is consistent with the suspended sediment pattern and suggests that there is a large unidentified source in Cache Creek between the confluence with the North Fork and Rumsey. The size and relative magnitude of the unknown mercury source appears sufficient to more than double suspended sediment mercury concentrations at Rumsey. Inputs from this unknown source(s) are largely responsible for causing exceedances of the San Francisco Bay TMDL sediment goal of 0.2 ppm mercury in the Settling Basin outflows. Finally, the bed sediment data also support the conclusion that a large amount of clean material is entering downstream of Rumsey and acting to dilute sediment concentrations at Yolo and at the Settling Basin. Lower inorganic mercury concentrations in sediment in the lower watershed may be responsible for the smaller methylmercury loads determined there.
0
1
2
3
4
5
Cle
ar L
ake
Out
flow
Nor
th F
ork
Cac
he C
reek
Har
ley
Gul
ch
Bea
r Cre
ek
Sul
phur
Cre
ek
Cac
he C
reek
at R
umse
y
Cac
he C
reek
at Y
oloTo
tal M
ercu
ry in
Str
eam
bed
Sedi
men
t (pp
m)
60 p
pm
28 p
pm
Figure 3-8 Inorganic Mercury (ppm, dry weight) Concentrations in Fine Grain Sediment Collected from Cache Creek by the US Geological Survey (Domagalski et al., 2004).
deposit in the stream channel above the gauge and may remobilize during high flow events. Mercury deposited in the stream bed or banks of Sulphur and Bear Creeks could be part of the unknown mercury source within the Cache Creek canyon.
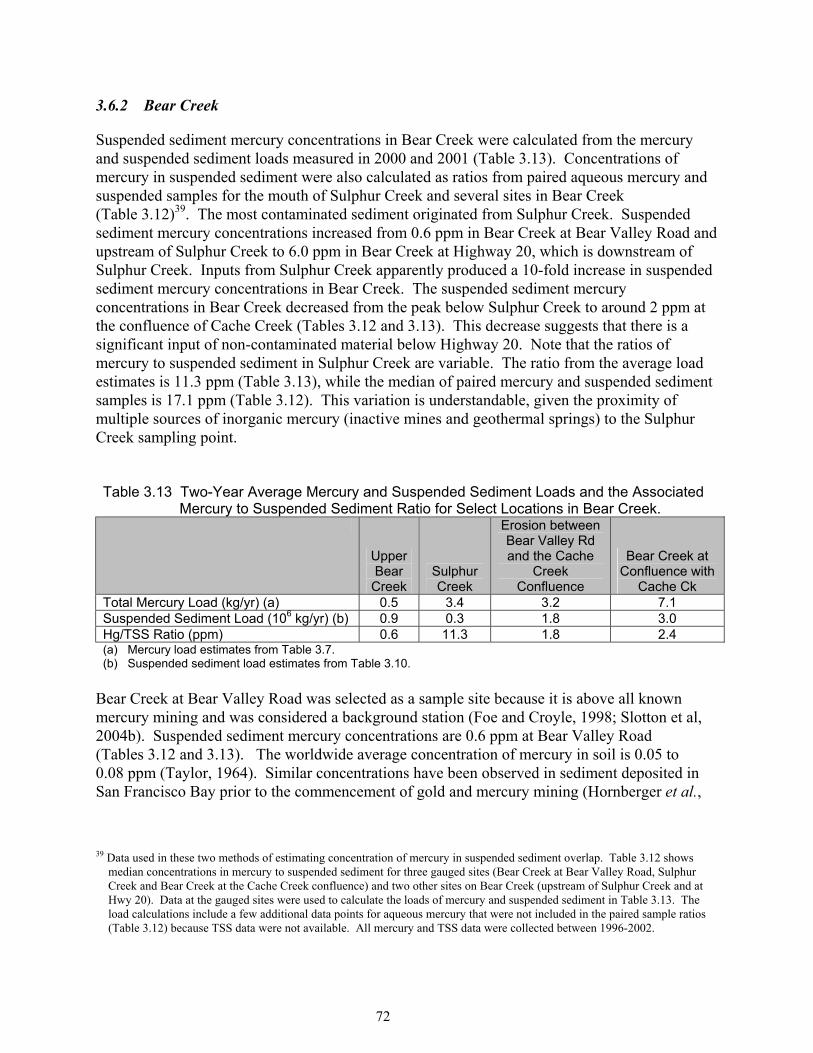
72
3.6.2 Bear Creek
Suspended sediment mercury concentrations in Bear Creek were calculated from the mercury and suspended sediment loads measured in 2000 and 2001 (Table 3.13). Concentrations of mercury in suspended sediment were also calculated as ratios from paired aqueous mercury and suspended samples for the mouth of Sulphur Creek and several sites in Bear Creek (Table 3.12)39. The most contaminated sediment originated from Sulphur Creek. Suspended sediment mercury concentrations increased from 0.6 ppm in Bear Creek at Bear Valley Road and upstream of Sulphur Creek to 6.0 ppm in Bear Creek at Highway 20, which is downstream of Sulphur Creek. Inputs from Sulphur Creek apparently produced a 10-fold increase in suspended sediment mercury concentrations in Bear Creek. The suspended sediment mercury concentrations in Bear Creek decreased from the peak below Sulphur Creek to around 2 ppm at the confluence of Cache Creek (Tables 3.12 and 3.13). This decrease suggests that there is a significant input of non-contaminated material below Highway 20. Note that the ratios of mercury to suspended sediment in Sulphur Creek are variable. The ratio from the average load estimates is 11.3 ppm (Table 3.13), while the median of paired mercury and suspended sediment samples is 17.1 ppm (Table 3.12). This variation is understandable, given the proximity of multiple sources of inorganic mercury (inactive mines and geothermal springs) to the Sulphur Creek sampling point. Table 3.13 Two-Year Average Mercury and Suspended Sediment Loads and the Associated
Mercury to Suspended Sediment Ratio for Select Locations in Bear Creek.
Upper Bear
Creek Sulphur Creek
Erosion between Bear Valley Rd and the Cache
Creek Confluence
Bear Creek at Confluence with
Cache Ck Total Mercury Load (kg/yr) (a) 0.5 3.4 3.2 7.1 Suspended Sediment Load (106 kg/yr) (b) 0.9 0.3 1.8 3.0 Hg/TSS Ratio (ppm) 0.6 11.3 1.8 2.4 (a) Mercury load estimates from Table 3.7. (b) Suspended sediment load estimates from Table 3.10.
Bear Creek at Bear Valley Road was selected as a sample site because it is above all known mercury mining and was considered a background station (Foe and Croyle, 1998; Slotton et al, 2004b). Suspended sediment mercury concentrations are 0.6 ppm at Bear Valley Road (Tables 3.12 and 3.13). The worldwide average concentration of mercury in soil is 0.05 to 0.08 ppm (Taylor, 1964). Similar concentrations have been observed in sediment deposited in San Francisco Bay prior to the commencement of gold and mercury mining (Hornberger et al.,
39 Data used in these two methods of estimating concentration of mercury in suspended sediment overlap. Table 3.12 shows median concentrations in mercury to suspended sediment for three gauged sites (Bear Creek at Bear Valley Road, Sulphur Creek and Bear Creek at the Cache Creek confluence) and two other sites on Bear Creek (upstream of Sulphur Creek and at Hwy 20). Data at the gauged sites were used to calculate the loads of mercury and suspended sediment in Table 3.13. The load calculations include a few additional data points for aqueous mercury that were not included in the paired sample ratios (Table 3.12) because TSS data were not available. All mercury and TSS data were collected between 1996-2002.

73
1999). Somewhat higher concentrations (0.2 ppm) are reported above for the North Fork of Cache Creek, another non-mercury mine impacted watershed. Further study is needed to determine whether the 0.6 ppm mercury measured at Bear Valley Road represents a true background concentration for Bear Creek or whether additional unknown mercury sources exist upstream. A mercury control program for Sulphur Creek will undoubtedly require large reductions in the export of total mercury from the upstream mining district. Equation 3.3 was used to assess the impact of remediation actions in Sulphur Creek on suspended sediment concentrations in Bear Creek. Completely arresting all off-site movement of material from Sulphur Creek would have a positive effect on suspended sediment concentrations in Bear Creek. Downstream sediment concentrations would eventually decrease from 2.4 to 1.6 ppm.40 Control actions to remove or immobilize erosive contaminated material in Bear Creek between Sulphur Creek and Highway 20 would also be beneficial. However, it is impossible at present to calculate what the eventual downstream reduction would be as no quantitative estimate is available on mercury and sediment erosion in this reach of the Creek.
3.6.3 Harley Gulch
Limited data on concentration of mercury in suspended sediment is available for both branches of Harley Gulch. Concentrations on the west branch range between 27 and 385 ppm, consistent with erosion of mercury mine waste (Foe and Croyle, 1998; Suchanek et al., 2004). Concentrations on the east branch range between 0.2 and 24 ppm. Churchill and Clinkenbeard (2002) caution that naturally elevated mercury soils resulting from the weathering of hydrothermally altered bedrock are also present at the mine sites. The mercury content of this naturally elevated material may range from 10 to 300 ppm mercury. Mercury mining was confined to the west branch Harley Gulch. More extensive sediment sampling is needed on the east branch and downstream of the gauge site to establish the present distribution of mercury contamination. Also needed is information on background sediment mercury concentrations prior to mining and whether the proposed Regional Board target is achievable. The DFG collected samples in September 2003 to determine biotic and in-stream sediment mercury concentrations. DFG also will attempt to determine background conditions prior to mercury mining. The results should be available for preparation of the Harley Gulch Basin Plan amendment.
3.7 Source Analysis Summary
The Cache Creek watershed is a major source of inorganic mercury to the Sacramento-San Joaquin Delta Estuary. During the years of record 1996 through 2000, the Cache Creek watershed provided half the mercury entering the Delta. The watershed above Rumsey was the major source of inorganic mercury. The origin of most of the inorganic mercury is not known.
40 Substituting Table 3.13 into Equation 3.3 yields: 0.5 + 5.0 = 1.6 ppm mercury 0.9 + 2.5

74
Existing data indicate that inactive mercury mines located above Rumsey are important secondary sources but do not account for the large volume of highly contaminated material now appearing at Rumsey. Data collection efforts downstream of the mines, however, may have missed sampling runoff during severe rainfall events, which could significantly increase the amount of material transported from the mine sites. Clean sediment entering the watershed below Rumsey acts to dilute sediment mercury concentrations by half. Atmospheric deposition of mercury to the surface of Cache Creek is estimated to contribute less than 0.1 percent of the mercury loads at Yolo. Methylmercury concentrations in Cache Creek largely parallel inorganic sediment mercury contamination levels. The highest concentrations and production rates were observed below the mercury mines and in the canyon above Rumsey, which were locations with the highest inorganic sediment contamination. Lower methylmercury concentrations in water were measured in the North Fork and Cache Creek above North Fork, which were sites with lower sediment concentrations. Identification and remediation of the unknown mercury source(s) in the upper basin are essential to attain the Cache Creek methylmercury targets in fish tissue and to help meet the San Francisco Bay TMDL sediment mercury goal. Bear Creek contributes an estimated 22 percent of methylmercury and four percent of total mercury to the Cache Creek loads measured at Rumsey. Within the Bear Creek watershed, five inactive mercury mines drain to Sulphur Creek. Others may discharge to Bear Creek upstream of Sulphur Creek. The watershed upstream of Bear Valley Road, which is upstream of all known mine inputs, contributes minimally to the loads of methylmercury and total mercury in Bear Creek. The highest methylmercury concentrations in the Bear Creek watershed consistently occur in Sulphur Creek downstream of the mines. Because Sulphur Creek contributes a small percentage of the total flow in Bear Creek, the proportion of the Bear Creek methylmercury load discharging from Sulphur Creek is also small. Most of the methylmercury loads appear to be produced within the Bear Creek channel. Approximately half of the total mercury load discharges from Sulphur Creek. Erosion into Bear Creek downstream of Bear Valley Road produces most of the rest of the Bear Creek total mercury load. Concentrations of mercury in suspended sediment suggest that much of the eroded material is from remobilization of mine waste deposited in the stream bank and bed. Harley Gulch is estimated to contribute less than one percent of the methylmercury load and about one percent of the total mercury load in Cache Creek at Rumsey. Over ninety percent this total mercury load is estimated to come from the west branch Harley Gulch, which receives runoff from inactive mercury mines. Mercury loads from the mines may be underestimated, due to a lack of data collected during heavy rainfall events. Much of the methylmercury in Harley Gulch is likely produced in a wetland area in the west branch downstream of the mines. Staff from the Regional Board and DFG sampled sediment and fish in Harley Gulch in September 2003. The source analysis for this watershed will be refined when the results from the recent sampling efforts are available.

75
4 LINKAGE ANALYSIS
The main purpose of the linkage analysis is to describe the synthesis and biomagnification of methylmercury in the aquatic environment and from this to develop a mathematical relationship between aqueous and biotic methylmercury concentrations. The relationship is used to derive a safe aqueous methylmercury concentration that is linked to the numeric targets of methylmercury in fish tissue. The linkage analysis is divided into three sections. First, factors responsible for methylmercury production are reviewed with an emphasis on processes potentially controllable in Cache and Bear Creeks and Harley Gulch. Second, the biomagnification of methylmercury in the aquatic food chain is described and a mathematical relationship developed between water and large fish. Finally, the literature is reviewed to determine the success of control programs, including reductions in inorganic mercury, to decrease methylmercury concentrations in aquatic biota.
4.1 Methylmercury Production
The synthesis of methylmercury in sediment is the critical first step in a process that ultimately culminates in elevated levels of methylmercury in fish tissue. Factors responsible for the production of methylmercury are reviewed below with an emphasis on processes believed important in the Cache Creek watershed. Methylmercury concentrations are the result of two competing processes, methylation and demethylation, of which neither is well understood. Methylation is the addition of a methyl group to an inorganic mercury molecule (Hg+2). Sulfate reducing bacteria are the primary agents responsible for the methylation of mercury in aquatic ecosystems (Compeau and Bartha, 1985; Gilmour et al., 1992). Small amounts of methylmercury may also be produced abiotically in sediment (Falter and Wilken, 1998). Maximum methylmercury production occurs at the oxic-anoxic boundary in sediment, usually several centimeters below the surface. Although less common, methylmercury may also be formed in bottom waters of lakes that stratify and become anaerobic (Regnell et al., 1996 and 2001). In this case, mercury-methylating microbes move from the sediment to the overlying anaerobic water and the resulting methylmercury becomes available to the biotic community when the lake turns over and contaminated bottom water is mixed into the overlying water column. Demethylation is both a biotic and abiotic process. Both sulfate reducing and methanogen-type bacteria have been reported to demethylate mercury in sediment with maximum demethylation co-occurring in the same zone where maximum methylmercury production is located (Marvin-DiPasquale et al., 2000). Photodegradation of methylmercury in the water column has also been observed (Sellers et al., 1996). While not well studied, the rate of both biotic and abiotic demethylation appear quantitatively important in controlling net methylmercury concentrations in aquatic ecosystems (Sellers and Kelly, 2001; Marvin-DiPasquale et al., 2000). Of course, the fact that methylmercury is always measurable in Cache Creek implies that the rate of methylation is greater than demethylation.

76
Factors controlling sediment methylmercury production have been the subject of intense scientific research. (For reviews see Wiener et al., 2003 and Benoit et al., 2003.) Sediment factors and landscape events important in net methylmercury production include the percent organic content of the sediment (Krabbenhoft et al., 1999; Miskimmmin et al., 1992; Hurley et al., 1998; Heim et al., 2004; Slotton et al, 2004b), pH and sulfate concentration of the overlying water (Gilmour et al., 1998; Miskimmmin et al., 1992; Krabbenhoft et al., 1999), creation of new water impoundments (Verdon et al., 1991; Bodaly et al., 1997), and the amount and kind of inorganic mercury present in the sediment (Krabbenhoft et al., 1999; Bloom, 2004). The organic content of the sediment and the pH of the overlying water are not discussed further as neither appear controllable in the Cache Creek watershed.
4.1.1 Sulfate in the Mercury Cycle
Sulfate is used by sulfate reducing bacteria as the terminal electron acceptor in the oxidation of organic material. Sulfate additions have been observed to both stimulate (Gilmour et al., 1992; King et al., 2002) and inhibit (Benoit et al., 1999a; Gilmour et al., 1998) methylmercury production. Addition of sulfate is predicted to stimulate methylmercury production if sulfate is limiting. In contrast, inhibition may occur when excess sulfide is produced. Sulfide is the primary byproduct of the reduction of sulfate and increasing sulfide concentrations may cause inhibition by either decreasing the amount of neutrally charged dissolved mercury-sulfide complexes41 (Benoit et al., 1999a, 1999b, 2001) or by precipitating insoluble mercuric sulfide (Compeau and Bartha, 1985). Addition of sulfate to Cache Creek sediment collected at Capay Dam resulted in increased methylmercury production in controlled laboratory experiments (Bloom, 2004). This suggests that sulfate may be a limiting factor in Cache Creek and decreasing sulfate loads may further reduce methylmercury production. Geothermal springs and mercury mine waste piles in both Harley Gulch and in Sulphur Creek have a high sulfate content (Churchill and Clinkenbeard, 2002) and are estimated to contribute about four percent of the annual sulfate load downstream at Rumsey (see Appendix D). Additional sulfate amendment experiments should be undertaken with sediment collected throughout the year downstream of the mining regions in both Bear and Cache Creek. The purpose of these experiments would be to provide further confirmatory evidence that decreasing in-stream sulfate concentration would reduce methylmercury production.
4.1.2 New Water Impoundments
The creation of new water impoundments has been found to stimulate sediment microbial activity and to increase methylmercury concentrations in sediment, water and biota (Verdon et al., 1991; Bodaly et al., 1997). The highest recorded methylmercury concentrations in fish in the Cache Creek drainage were recorded in the Davis Creek Reservoir, soon after the
41 Dissolved, neutrally charged mercury is the only form readily crossing microbial cell membranes.

77
reservoir was created (Slotton et al., 1995). The Davis Creek Reservoir is downstream of the inactive Reed mercury mine. Off-channel gravel mining has resulted in the creation of a series of large borrow pits adjacent to lower Cache Creek. Several of these are below groundwater level and therefore contain standing water year round. Others only contain water during the rainy season. Methylmercury concentrations in water and in biota have been monitored for several years at one pit that was converted to a wildlife preserve (Slotton et al., 2004a). Methylmercury concentrations in water and in biota are elevated at the preserve over concentrations in the agricultural source water and in Cache Creek immediately upstream of the discharge point. The preliminary implementation plan (Section 6.2) addresses methylmercury inputs originating from flooded pits created by gravel mining operations and other potential impoundments that would discharge to Cache Creek.
4.1.3 Sediment Mercury Concentrations
A key TMDL question is whether the production of methylmercury in sediment is a function of the total mercury content of the sediment. Methylmercury concentrations42 adjusted for the organic content of the sediment increased logarithmically with increasing total mercury concentration in a study of 106 sites from 21 basins across the United States (Krabbenhoft et al., 1999). The slope of the relationship was linear to approximately one ppm total mercury before commencing to asymptote. These results are consistent with laboratory experiments where increasing concentrations of inorganic mercury were amended into sediment and the production of methylmercury was monitored (Bloom, 2004; Rudd et al., 1983). The efficiency of the conversion of inorganic mercury to methylmercury was linear to about one ppm before commencing to decline. The results are also consistent with field observations of methyl and total mercury concentrations in sediment in the Sacramento-San Joaquin Delta Estuary and elsewhere (Table 4.1). Statistically significant linear relationships were observed in all these studies between methyl and total mercury when the total mercury concentration was less than one ppm. These results suggest that control programs that are able to successfully reduce total surficial sediment mercury concentration will also reduce the production and flux of methylmercury to the overlying water. Much greater reductions in total mercury will be required to achieve similar reductions in aqueous methylmercury when sediment concentrations exceed one ppm total mercury.
42 Radiotracer experiments in Florida Everglade sediment demonstrate that methylmercury production is positively correlated
with bulk sediment methylmercury concentrations (Gilmour et al., 1998). Moreover, the spatial pattern of methylmercury production was strongly correlated with aqueous and biotic concentrations suggesting that surficial sediment concentrations could be used as an analog for in situ methylmercury production and flux into the overlying water. Bulk methylmercury sediment concentrations are now widely used as an index of methylmercury production (Krabbenhoft et al., 1999; Bloom et al., 1999 and 2002; Heim et al., 2002; Slotton et al, 2004b; Conaway et al., 2003; Benoit et al., 1999).

78
Table 4.1 Field Studies Demonstrating a Positive Correlation Between Total and Methylmercury in Freshwater Surficial Sediment
Location (a) R2 P-Value Comments
Author
Sacramento-San Joaquin Delta Estuary
0.2 <0.01 All habitats in Delta combined
Heim et al., 2004
Sacramento-San Joaquin Delta Estuary
0.52 <0.001 Only marsh habitats Heim et al., 2004
Sacramento-San Joaquin Delta Estuary
0.37 <0.001 Comparisons inside and outside of flooded Delta
Islands
Slotton et al, 2004b
Elbe River 0.69 <0.0001 Germany Hintelmann and Wilken, 1995
Patuxent River Estuary 0.61 <0.05 Sub embayment of Chesapeake Bay
Benoit et al., 1998
National Survey 0.62 <0.0001 Log/log relationship normalized to percent
organic carbon at 106 sites in 21 basins across the
United States
Krabbenhoft et al., 1999
Lake Levrasjon 0.64 <0.05 Southern Sweden Regnell et al., 1997
(a) The majority of the sediment in each study had a mercury content less than one ppm.
4.1.4 Forms of Mercury
Mercury may exist in water in multiple oxidation states and also as complexes with other naturally occurring substances (Morel et al., 1998). Mercuric sulfide (cinnabar) is believed to be the least soluble and most inert of the mercury species. Sequential selective extraction of Cache Creek sediment demonstrates that the majority of the mercury in the main stem of the Creek and in mercury mine waste piles is cinnabar and cinnabar-like compounds (Bloom, 2004). Samples of this material were mixed with sediment from Green Lake43 and incubated in the laboratory for a year to ascertain its methylation potential. Mercury mine waste was about 20 times less efficiently converted to methylmercury than was dissolved mercury2+, the most available form of mercury (Bloom, 2004). However, mine waste, in spite of its low conversion efficiency, produced large amounts of methylmercury in the laboratory because of its high total mercury content. The ratio of methyl to total mercury in bulk surficial sediment is assumed to be a field measure of methylation efficiency (Gilmour et al., 1998; Krabbenhoft et al., 1999; Bloom et al., 1999; Bloom, 2004). Heim and others (2004) collected sediment samples from sites in the Cache Creek watershed on three occasions (October 1999, May 2001 and October 2001) to measure methyl and total mercury concentrations and determine methylation efficiency. The highest total mercury concentrations were observed in sediment from Harley Gulch and from Sulphur Creek 43 Green Lake is near Frontier GeoSciences in Seattle, Washington.

79
(Figure 3.8). Sediment methylmercury concentrations were also very elevated at these same locations. However, consistent with the findings of Bloom and Preus (2004), methylation efficiency was low. This may be because of the high total mercury concentration (see previous section on the effect of total mercury on methylmercury production) and/or because the material is still mostly insoluble cinnabar. Heim and colleagues (2004) compared sediment mercury concentrations near the mining districts with those in lower Cache Creek. Total mercury concentrations decreased with increasing distance from the mines to less than 0.5 ppm near the Settling Basin.44 Methylmercury concentrations also decreased but more slowly than did total mercury with the result that methylation efficiency rose with downstream distance. Heim and colleagues speculated that the mercury is weathering and changing form as it is slowly transported away from the mines. The precise mechanisms are not known but may include the formation of soluble polysulfide complexes (Paquette and Heltz, 1995) and dissolution of cinnabar by humic and fulvic acids (Wallschlager et al., 1998; Ravichandran et al., 1998). Both processes should increase the uptake of inorganic mercury by methylating bacteria and thereby increase the efficiency of the conversion of inorganic to organic mercury. Regardless of the mechanisms, the finding of methylmercury “hot-spots” in waterways immediately downstream of mining and increased methylation efficiency of mine waste with increased distance from the mines, emphasizes the need for mine remediation work to minimize future off site movement of mercury. As described in the Implementation Section, implementation of the TMDL will include collecting data to better determine the distribution and erosive potential of inorganic mercury presently stored in channel bed and banks. There is limited information to identify sites in Cache Creek where sediment controls would be effective at reducing methylmercury production. Heim and colleagues (2004) found that methylmercury concentrations and production efficiency varied by at least an order of magnitude on each of three reconnaissance surveys in Cache Creek. The highest methylmercury concentrations and production rates were observed in seasonally flooded impoundments (Capay Dam and Cache Creek Settling Basin). Similarly, wetlands in the Sacramento-San Joaquin Delta Estuary were found to have the highest methylmercury production rates and concentrations (Heim et al., 2004). A statistically significant, but poor, relationship was found between methyl and total mercury concentrations when all Delta habitats (marshes, sub and intertidal mud and sand bottoms, open channels etc) were considered together (R2=0.2, p<0.01, Table 4.1). The relationship greatly improved when only one habitat, marshes, was evaluated (R2=0.52, p<0.001, Table 4.1), emphasizing the need to understand where methylmercury is being synthesized and to consider habitat-specific methyl to total mercury relationships.
4.2 Biomagnification
Biomagnification of methylmercury in aquatic food chains is the second critical step in the process that ultimately culminates in elevated levels of methylmercury in fish tissue. Large, trophic level four fish in Cache and Bear Creeks typically have one to ten million times more 44 About 50 miles downstream from Harley Gulch and from Sulphur Creek.

80
methylmercury than does the surrounding water (Slotton et al., 2004a). A key objective of the linkage analysis is to calculate an aqueous methylmercury concentration that produces safe fish tissue concentrations for human and wildlife consumption. A mathematical relationship exists between aqueous and large fish tissue concentrations in the North Fork and the main stem Cache Creek. Because fish concentrations and the extent of biomagnification appear distinctly different in Bear Creek (Slotton et al., 2004a), a separate mathematical relationship is developed for this water body. These relationships are used to calculate an aqueous methylmercury concentration that will result in safe fish tissue concentrations for human and wildlife consumption. The relationships between aqueous and biotic methylmercury concentrations were investigated in an intensive 20-month study in the Cache Creek watershed (Slotton et al., 2004a).45 Statistically significant positive log/log relationships were observed between waterborne mercury46 and methylmercury tissue concentrations in bottom dwelling invertebrates when all locations were grouped together. Similar relationships were noted between waterborne mercury and methylmercury in small fish. These locations included sites in the North Fork; Cache Creek at the Cache Creek dam, Rumsey and Yolo; and in Bear Creek (Harley Gulch was included for water and invertebrate concentrations.) However, only raw and filtered aqueous methylmercury were consistently correlated with invertebrate or small fish concentrations at individual locations. The correlation between raw aqueous and biotic methylmercury was always the more statistically significant of the two relationships (Slotton et al., 2004a). The conclusion that biotic tissue concentrations correlate best with raw waterborne methylmercury is consistent with the observations of others (Foe et al., 2002; Brumbaugh et al., 2001). The basin-wide (Cache Creek including North Fork, Bear Creek, and Harley Gulch) correlation between raw aqueous methylmercury and invertebrate tissue concentrations is shown in Figure 4.1.
45 Sampling sites were located in North Fork Cache Creek; main stem Cache Creek below the Cache Creek dam , at Rumsey ,
and below the Capay Dam; Harley Gulch; and Bear Creek up- and downstream of Sulphur Creek. Measurements were made of aqueous total and methylmercury in filtered and unfiltered (raw) samples, and mercury and methylmercury in bottom-dwelling invertebrates, small fish and large fish. No fish were collected in Harley Gulch (Slotton et al., 2004a).
46 Statistically significant relationships were found between invertebrate methylmercury and each of four aqueous datasets of raw (unfiltered) and filtered total and methylmercury.
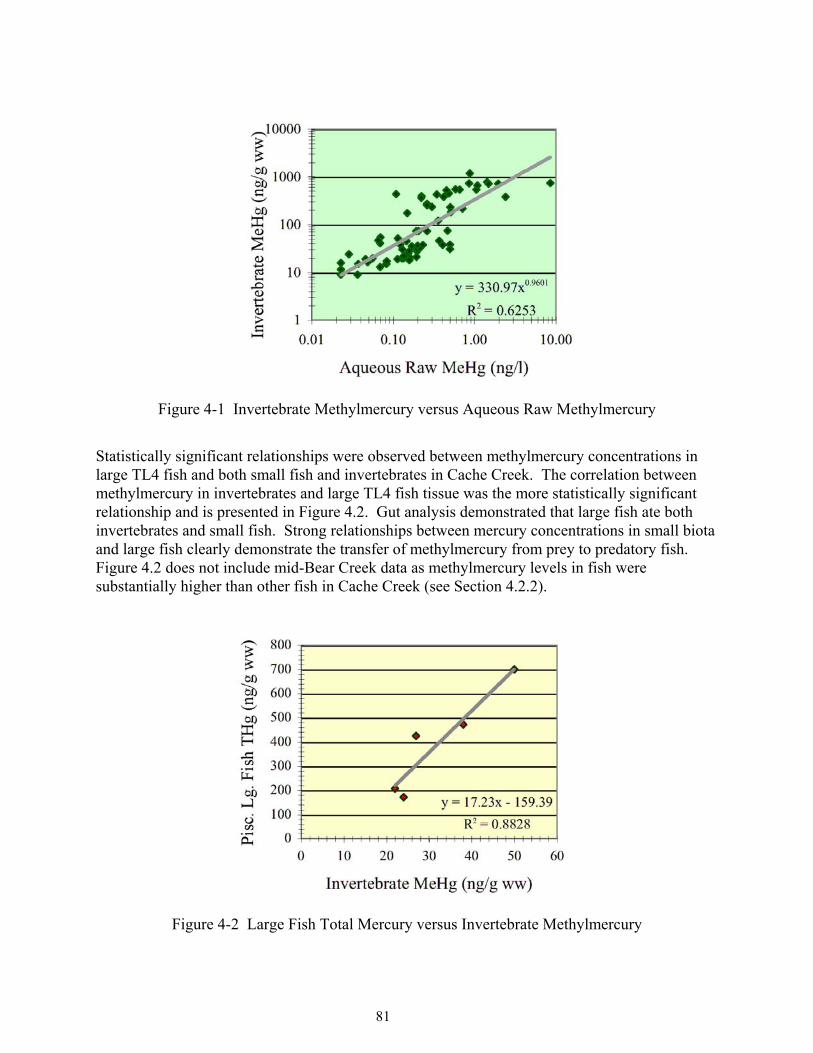
81
Figure 4-1 Invertebrate Methylmercury versus Aqueous Raw Methylmercury
Statistically significant relationships were observed between methylmercury concentrations in large TL4 fish and both small fish and invertebrates in Cache Creek. The correlation between methylmercury in invertebrates and large TL4 fish tissue was the more statistically significant relationship and is presented in Figure 4.2. Gut analysis demonstrated that large fish ate both invertebrates and small fish. Strong relationships between mercury concentrations in small biota and large fish clearly demonstrate the transfer of methylmercury from prey to predatory fish. Figure 4.2 does not include mid-Bear Creek data as methylmercury levels in fish were substantially higher than other fish in Cache Creek (see Section 4.2.2).
Figure 4-2 Large Fish Total Mercury versus Invertebrate Methylmercury
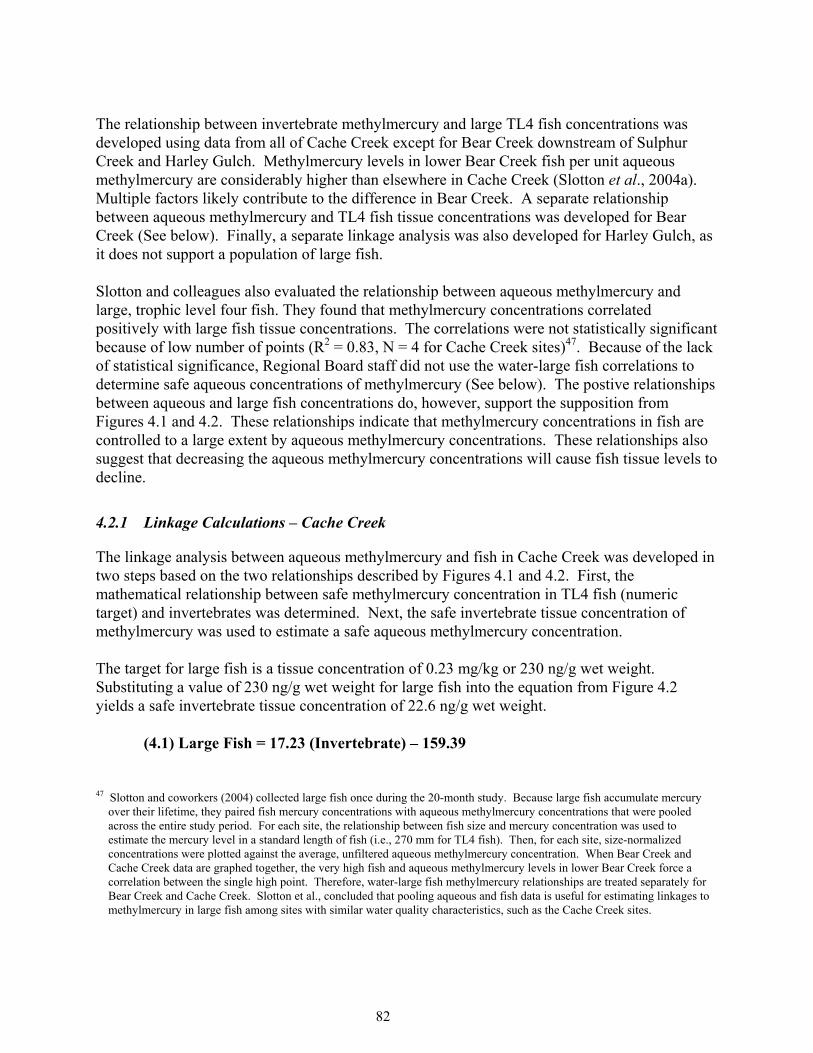
82
The relationship between invertebrate methylmercury and large TL4 fish concentrations was developed using data from all of Cache Creek except for Bear Creek downstream of Sulphur Creek and Harley Gulch. Methylmercury levels in lower Bear Creek fish per unit aqueous methylmercury are considerably higher than elsewhere in Cache Creek (Slotton et al., 2004a). Multiple factors likely contribute to the difference in Bear Creek. A separate relationship between aqueous methylmercury and TL4 fish tissue concentrations was developed for Bear Creek (See below). Finally, a separate linkage analysis was also developed for Harley Gulch, as it does not support a population of large fish. Slotton and colleagues also evaluated the relationship between aqueous methylmercury and large, trophic level four fish. They found that methylmercury concentrations correlated positively with large fish tissue concentrations. The correlations were not statistically significant because of low number of points (R2 = 0.83, N = 4 for Cache Creek sites)47. Because of the lack of statistical significance, Regional Board staff did not use the water-large fish correlations to determine safe aqueous concentrations of methylmercury (See below). The postive relationships between aqueous and large fish concentrations do, however, support the supposition from Figures 4.1 and 4.2. These relationships indicate that methylmercury concentrations in fish are controlled to a large extent by aqueous methylmercury concentrations. These relationships also suggest that decreasing the aqueous methylmercury concentrations will cause fish tissue levels to decline.
4.2.1 Linkage Calculations – Cache Creek
The linkage analysis between aqueous methylmercury and fish in Cache Creek was developed in two steps based on the two relationships described by Figures 4.1 and 4.2. First, the mathematical relationship between safe methylmercury concentration in TL4 fish (numeric target) and invertebrates was determined. Next, the safe invertebrate tissue concentration of methylmercury was used to estimate a safe aqueous methylmercury concentration. The target for large fish is a tissue concentration of 0.23 mg/kg or 230 ng/g wet weight. Substituting a value of 230 ng/g wet weight for large fish into the equation from Figure 4.2 yields a safe invertebrate tissue concentration of 22.6 ng/g wet weight.
(4.1) Large Fish = 17.23 (Invertebrate) – 159.39
47 Slotton and coworkers (2004) collected large fish once during the 20-month study. Because large fish accumulate mercury
over their lifetime, they paired fish mercury concentrations with aqueous methylmercury concentrations that were pooled across the entire study period. For each site, the relationship between fish size and mercury concentration was used to estimate the mercury level in a standard length of fish (i.e., 270 mm for TL4 fish). Then, for each site, size-normalized concentrations were plotted against the average, unfiltered aqueous methylmercury concentration. When Bear Creek and Cache Creek data are graphed together, the very high fish and aqueous methylmercury levels in lower Bear Creek force a correlation between the single high point. Therefore, water-large fish methylmercury relationships are treated separately for Bear Creek and Cache Creek. Slotton et al., concluded that pooling aqueous and fish data is useful for estimating linkages to methylmercury in large fish among sites with similar water quality characteristics, such as the Cache Creek sites.

83
(4.2) Invertebrates = 330.97 (Raw Methylmercury in Water)0.9601
This safe invertebrate tissue concentration can be substituted into the equation from Figure 4.1 to calculate a safe aqueous raw methylmercury value of 0.06 ng/L. Since large fish accumulate methylmercury over many years, the 0.06 ng/L value represents the best estimate of the annual median aqueous methylmercury concentration needed to produce a composite large fish tissue value of 230 ng/g wet weight.48 Methylmercury may biomagnify through the food web through benthic and/or aquatic routes. A benthic pathway may transport methylmercury from sediment to macroinvertebrates to fish. A typical aquatic route would be methylmercury in water absorbed by plankton that is consumed by fish. Although Regional Board staff has identified an aqueous methylmercury goal, this linkage analysis incorporates biomagnification through both routes. Analyses of stomach contents showed that each of the Cache Creek large fish species were consuming benthic macroinvertebrates and small fish. Benthic macroinvertebrates may accumulate methylmercury from within the sediment; however, as described in Section 4.1.3, concentration of methylmercury in the overlying water is positively correlated with sediment methylmercury concentrations. In a national survey Brumbaugh et al. (2001) found that raw methylmercury concentrations of 0.03 and 0.06 ng/L corresponded with the production of 3-year old largemouth bass and composite trophic level-four game fish of 0.23 ppm.49, 50. The predicted safe waterborne methylmercury concentration for Cache Creek is midway between the two nationally derived values.
4.2.2 Linkage Calculations – Bear Creek
As described above, methylmercury levels in fish from Bear Creek are substantially higher per unit aqueous methylmercury than similarly sized counterparts in Cache Creek. Bioaccumulation factors between water and fish are greater for Bear Creek than any site that Slotton and colleagues (2004) examined in Cache Creek. Because of this difference, a separate mathematical relationship is used to link methylmercury concentrations in water and fish in Bear Creek. TL4 fish and aqueous methylmercury data are available for two sites on Bear Creek, up- and downstream of Sulphur Creek. A safe aqueous concentration of methylmercury can be calculated by dividing the numeric target by the bioaccumulation factor to determine the safe water concentration (Table 4.2). Bioaccumulation factors were determined using both the median aqueous methylmercury and average methylmercury concentrations. Median
48 The large fish tissue value may also be estimated from relationships between large and small fish and small fish and water.
Similar calculations produce a safe raw methylmercury concentration of 0.03 ng/L. The approach using invertebrates was selected over that employing small fish as the relationships with invertebrates were more statistically significant.
49 As calculated from equations given in the paper by Brumbaugh et al. (2001). 50 262-mm average length fish.

84
concentrations are the goals for the Cache Creek linkage. However, methylmercury concentrations fluctuate more widely in Bear Creek and near the mine sites than in the main-stem Cache Creek. Because available data were not collected uniformly in all seasons, staff evaluated BAFs based on median and average aqueous concentrations. Table 4.2 Bioaccumulation Factors and Safe Water Concentrations for Bear Creek
Aqueous raw MeHg, ng/L (a)
MeHg in TL4 fish, mg/kg wet wt (b)
BAF Target MeHg in TL4 fish,
mg/kg wet wt
Aqueous MeHg corresponding to fish target,
ng/L median Bear Creek u/s Sulphur Creek 0.09 0.70 7.8 E+06 0.23 0.028
Bear Creek @ Hwy 20 (d/s Sulphur Creek
0.35 3.05 8.7 E+06 0.23 0.025
average Bear Creek u/s Sulphur Creek 0.12 0.70 7.8 E+06 0.23 0.037
Bear Creek @ Hwy 20 (d/s Sulphur Creek
0.62 3.05 5.8 E+06 0.23 0.045
a. Slotton et al., 2004a. Average fish tissue concentrations are for large TL4 fish, normalized to 270 mm length. The methods used to determine aqueous methylmercury goals for Cache Creek and Bear Creek are essentially the same. Both are based on the principle of a defined relationship between aqueous and biotic concentrations of methylmercury. Each point on Figure 4.1 represents a bioaccumulation factor between aqueous and invertebrate methylmercury at a single sampling point in Cache Creek. Because water and TL4 fish were sampled at only two points in Bear Creek, there was insufficient data to develop regression lines as shown for Cache Creek. The average aqueous methylmercury concentration that corresponds to TL4 fish tissue targets in Bear Creek is 0.03 – 0.04 ng/L. This may be the aqueous concentration needed in order to meet the fish tissue targets. A concentration of 0.03 ng/L is close to the current method detection limit for methylmercury in water, which is about 0.02 ng/L 51. Because of the uncertainty associated with analytical results so close to the detection limit, the Regional Board staff proposes that the Cache Creek aqueous goal initially be applied to Bear Creek. Reaching a goal of 0.06 ng/L will require substantial reductions in aqueous methylmercury concentrations in Bear Creek. When the initial aqueous goal is attained, more water and fish data should be collected to determine whether aqueous methylmercury concentrations should be further reduced in Bear Creek.
51 Personal communication from B. Lasorsa, Battelle Marine Sciences Laboratory to C. Foe, CVRWQCB, 3/04. The method
detection limit achieved by the Battelle laboratory and by Frontier Geosciences Laboratory is about 0.02 ng/L. Analytical results less than twice the method detection limit are considered uncertain.

85
4.2.3 Linkage Calculations – Harley Gulch
Because Harley Gulch has no resident large fish, the linkage equations for Cache Creek to derive an aqueous methylmercury goal for Harley Gulch do not apply. A linkage relationship can be derived using the BAF for methylmercury in small Harley Gulch fish. Table 4.3 Bioaccumulation Factor and Safe Water Concentration for Harley Gulch
Aqueous raw MeHg, ng/L (a)
MeHg in TL2/3 fish, mg/kg wet
wt (b) BAF
Target MeHg in TL2/3 fish 50-150 mm, mg/kg wet wt
Aqueous MeHg corresponding to fish
target, ng/L 0.60 0.34 5.7 E+05 0.05 0.09
(a) Data collected in 2000-2003 by Slotton et al., (2004a) and CVRWQCB. (b) CDFG, 2004
4.3 Other Mercury Control Programs
Mercury concentrations in fish at contaminated sites have been found to decline after control measures are instituted to reduce incoming mercury loads (Table 4.3). Most sites studied to date are industrial facilities that discharge into fresh water and have operated for relatively short periods.52 The initial decrease in fish tissue concentration near the source of contamination is often fast, with about a 50 percent decline in the first five to ten years. However, after a rapid initial decrease, concentrations tend to stabilize with little, if any, subsequent decline (Turner and Southworth, 1999; Takizawa, 2000; Lodenius, 1991; Lindestrom, 2001; Francesconi et al., 1997). The new equilibrium value is usually higher than in adjoining uncontaminated waterways and is also often greater than what is recommended as safe for human consumption (Turner and Southworth, 1999; Parks and Hamilton, 1987; Lodenius, 1991; Lindestrom, 2001; Francesconi et al., 1997; Becker and Bigham, 1995). The reason(s) are unclear but may be because small amounts of mercury are still entering from terrestrial sources (Turner and Southworth, 1999) or because of difficulties in bringing sediment concentrations down to background levels (Francesconi et al., 1997; Jernelov and Asell, 1975). If contamination has spread to areas more distant than the immediate facility, then reductions in fish tissue concentrations are much slower (Southworth et al., 2000). Control programs have emphasized a combination of decreasing/eliminating mercury loads, natural burial of contaminated sediment, and fish advisories. Decreasing or eliminating mercury loads is usually the first control measure undertaken. This is critical as it begins to reduce sediment mercury levels and the stock of new mercury to be methylated. Dredging and removal of contaminated sediment or capping with clean material has been employed less often than natural burial; presumably this is because of cost (Rudd et al., 1983; Francesconi et al., 1997). However, natural reburial is problematic as infrequent high flow events may erode and re-expose the contamination. Finally, fish advisories, in combination with education programs, have been used in an attempt to manage the human health risk. The ultimate goal is to attempt to instruct people about the sizes and species of fish that may be harmful to consume while emphasizing
52 One to two decades.

86
that other less contaminated varieties are an excellent source of protein (Lindestrom, 2001; NRC, 2000). Absent from the literature are reports on remediation of pollution from mercury mining. The long duration of mining in the Cache Creek drainage coupled with the extensive distribution of contamination will likely make recovery much slower than at industrial sites (Table 4.3). Proposed control measures for Cache Creek — reduce/eliminate discharge from mine sites, employ natural burial to cover contamination, and issue fish advisories — are similar to what has been employed elsewhere. In addition, studies are proposed to evaluate whether it is possible to interrupt the microbial methylation cycle and arrest the movement of the most erosive contaminated bottom and overbank sediment downstream of the mines. Whether any of these studies will lead to additional improved control measures is not known but are proposed to improve the chance of eventual recovery.
4.4 Linkage Analysis Summary
Across multiple sites in Cache Creek, statistically, significant, positive correlations have been found between concentrations of methylmercury in water and biota (Slotton et al., 2004a). The best correlations occur between aqueous, raw (unfiltered) methylmercury and methylmercury in benthic macroinvertebrates and between methylmercury in invertebrates and large fish. Regional Board staff used these Cache-Creek specific relationships to derive safe aqueous methylmercury concentrations that are linked to the fish tissue numeric targets. The correlations between concentrations of methylmercury water and invertebrates and between invertebrates and TL4 fish (Slotton et al., 2004a) were used to calculate a safe aqueous methylmercury goal of 0.06 ng/L for Cache Creek. This goal applies to the annual, median concentration of unfiltered methylmercury. When the aqueous methylmercury goal is reached, we expect that the numeric target of 0.23 mg/kg in TL4 fish will be attained. The same aqueous methylmercury goal is proposed for Bear Creek. Methylmercury levels in fish from Bear Creek, however, are currently higher than fish in Cache Creek. As methylmercury concentrations in Bear Creek decline to the goal, monitoring should be conducted to verify that fish concentrations have declined sufficiently to meet the targets. Because Harley Gulch has no resident large fish, a linkage relationship was derived using the ratio between median aqueous methylmercury concentration and methylmercury levels in small fish. A safe aqueous concentration goal of 0.06 ng/L corresponds to the Harley Gulch numeric target of 0.05 mg/kg in small fish. Aqueous methylmercury concentrations are controlled by multiple factors. A primary factor is the concentration of total mercury in sediment. Mercury concentrations in fish at contaminated sites have been found to decline after control measures are instituted to reduce incoming mercury loads. Proposed control measures for the Cache Creek watershed (i.e., reduce discharge from mine sites, employ natural burial to cover contamination, and issue fish advisories) are similar to what has been employed elsewhere.

87
Table 4.3 Change in Fish Tissue Mercury Concentration After Remediation Efforts. Location Mercury Source Biotic Change Control Measures References
Oak Ridge National Laboratory, Tennessee
Weapons Facility Sunfish at discharge point declined from 2 to 1 ppm in 5 yrs; half-mile downstream sunfish declined from 0.9 to 0.7 ppm in 9 yrs; no change in tissue 2 and 5 miles downstream.
Reduced discharge, excavated portion of flood plain.
Turner and Southworth, 1999;Southworth et al., 2000
Lake St. Clair, Michigan
Two Chloralkali Plants Walleye fish declined from 2.3 to 0.5 ppm in 25 yrs Reduced/eliminated discharge Turner and Southworth,
1999.
Abbotts Creek, North Carolina
Battery Manufacturing
plant Fish declined from 1 to 0.5 ppm in 11 yrs
Treated groundwater, reduced/eliminated discharge, removed contaminated soil, natural sediment burial
Turner and Southworth, 1999
Saltville, Virginia Chloralkali Plant Rockfish declined from 3.5 to 1.0 ppm in 20 yrs River sediment dredged, rock bottom grouted, rip-rap river bank, pond seepage treated with activated carbon
Turner and Southworth, 1999
Howe Sound, British Columbia, Canada Chloralkali Plant Dungeness crab declined from 2 to 0.2 ppm in 5 yrs. No
subsequent change Reduced/eliminated discharge, treated groundwater
Turner and Southworth. 1999
Little Rock Lake, Wisconsin
Atmospheric deposition Yellow Perch declined 30% in 6 yrs Reduced atmospheric mercury input
by 60%. Hrabik and Watras, 2002.
Minamata, Japan Chloralkali Plant Fish declined from 9.0 to 0.4 ppm in 8 yrs; no further change. Eliminated discharge; dredged and disposed of sediment. Takizawa, 2000
Niigata, Japan Chloralkali Plant Japanese Barbel fish declined from 6 to 0.3 ppm in 7 yrs; no further change. Controls unknown Takizawa, 2000
Clay Lake, Ontario, Canada
A chloralkali plant and a wood
pulp mill.
Walleye fish declined from 15.1 to 2.0 ppm in 20 yrs. Background concentration is 0.6 ppm.
Eliminated discharge; natural burial of contaminated sediment
Parks and Hamilton, 1987; Turner and Southworth, 1999.
Ball Lake, Ontario, Canada (downstream
of Clay Lake) Same as above Walleye fish declined from 2.0 to 1.4 ppm in first 5 yrs. Northern
Pike from 5.1 to 1.8 ppm. No change in Lake Whitefish. Same as above Armstrong and Scott, 1979
Lake Kirkkojarvi, Finland
Phenylmercury in slimicide in
pulp mill
4 and 1-kg Northern Pike declined from 3.6 to 2.1 and from 1.5 to 0.8 ppm in 20 yrs. All reductions happened in first 10 yrs. Background concentration in 1-kg pike is 0.4 ppm.
Reduced discharge, natural burial Lodenius, 1991
Lake Vanern, Sweden Chloralkali Plant 5-yr old Northern Pike declined from 1.4 to 0.6 ppm in 25 yrs. Most of decrease occurred in first 10-15 yrs. Background concentrations in Pike are 0.4 ppm
Reduced/eliminated discharge, natural burial Lindestrom, 2001
Princess Royal Harbor, Australia (Marine water)
Superphosphate Processing Plant
Mercury in 8 marine fish species declined by about 50% in 9-yrs. Most of decrease happened in first 4-yrs. Tissue concentrations are still about twice background.
Eliminated discharge, natural burial Francesconi et al., 1997
Onondaga Lake, New York
Municipal and industrial discharge
Mercury in six fish species declined by 60 to 80 % in 22 yrs. Tissue concentrations are still about twice background. Eliminated discharge, natural burial Becker and Bigham,
1995.

88
5 MARGIN OF SAFETY AND SEASONAL VARIABILITY
5.1 Margin of Safety
Margins of safety (MOS) in this TMDL are explicit and implicit. A portion of allowable methylmercury loads are set aside as an explicit MOS in the load allocations. An implicit MOS for humans and wildlife is incorporated into the load allocation for the main stem Cache Creek above North Fork, which is lower than needed to meet fish tissue targets. An implicit MOS for humans consuming fish from the entire lengths of Cache and Bear Creeks is found in the numeric targets for methylmercury in fish. The targets extend protection to humans eating more local fish than USEPA’s default consumption rate. .
5.1.1 Explicit Margin of Safety
An explicit MOS is included in the allocation of methylmercury loads (Table 6.2) to account for uncertainty in the load estimates and linkage analysis. Ten percent of the allowable load is set aside as an MOS and is not allocated to tributary or in-stream loads.
5.1.2 Implicit Margin of Safety for Humans in Targets
The recommended numeric targets contain an implicit margin of safety for humans that eat fish from Cache and Bear Creeks. The targets allow for safe consumption by an adult of up to 29 g/day of Cache or Bear Creek fish, assuming approximately equal consumption of TL3 and TL4 species and consumption of an additional 12.5 g/day of commercial fish. Adults eating only Cache or Bear Creek fish could safely consume up to 40 g/day of equal amounts TL3 and TL4 species. These consumption rates are higher than the USEPA default rate of 17.5 g/day, which is the 90th percentile consumption rate on a nation-wide basis (USEPA, 2000b). Regional Board staff estimates that these targets will protect the majority of people who eat Cache and Bear Creek fish. There may be people consuming more than 40 g/day of Cache Creek fish. The TMDL implementation plan includes outreach to the Delta consumers to encourage consumption of smaller fish and lower trophic level species. Another factor to consider is that, by regulations issued by the California Department of Fish and Game, catching fish in the Lake County portion of Cache Creek and tributaries is not permitted between November and April. This provides an additional margin of safety for human health provided no locally caught fish are consumed during this period. It is unlikely that humans are consuming fish from Harley Gulch.
5.1.3 Implicit Margin of Safety for Humans and Wildlife in North Fork and Upper Main Stem Cache Creek
The numeric targets contain an implicit margin of safety for wildlife species that eat fish from the main stem Cache Creek upstream of North Fork. The load allocation of methylmercury for

89
this reache of the creek is lower than need be to attain the aqueous methylmercury goal in each fork, in order to meet the load reductions necessary downstream. When the load allocations are attained, Staff expects that concentrations of mercury in fish tissue in the main stem above North Fork will be slightly below the targets.
5.2 Seasonal Variability
Seasonal variability in total and methylmercury loads was accounted for in the source analysis and load allocations. Average, annual loads of total mercury and methylmercury were estimated using data collected throughout the year to account for the seasonal changes in transport of total mercury and methylmercury and methylmercury production. Loads of mercury and methylmercury in Cache and Bear Creeks and Harley Gulch fluctuate with the seasons. Winter precipitation increases the sediment and total mercury loads entering the creeks through erosion and resuspension of sediment. Most of the total mercury coming from tributaries and direct surface runoff enters the Cache and Bear Creeks during high flow events. In contrast, methylmercury production is typically higher during the summer months. Methylmercury concentrations show peaks in early summer, when in situ production is greatest, and after the first storms, when methylmercury produced in the tributaries is flushed downstream (Slotton et al., 2004a). A major component of the seasonal variation is the hydraulic regime in Cache Creek. A majority of the Cache Creek flow is regulated by flows from Indian Valley Reservoir and the Clear Lake dam. In winter, both impoundments retain water for summer irrigation for Yolo County. Cache Creek winter flows are a combination of Clear Lake outflows, Bear Creek, North Fork, and the other tributaries. In contrast, summer flows in Cache Creek are dominated by releases from Indian Valley into North Fork Cache Creek and Clear Lake into Cache Creek. Between March and September, most of the flow from the upper basin is diverted at the Capay Dam into irrigation canals. As a result, minimal flow from the upper basin reaches lower Cache Creek during the summer. The volume of water in the creek below Capay Dam is typically small during the summer (<500 cfs) and is comprised of irrigation tail water and groundwater. This flow regime affects the source of methylmercury in Cache Creek below Capay Dam during this period. In summer, methylmercury concentrations downstream of the dam are thought to be driven primarily by in situ production of methylmercury below the dam. This assumption is supported by monitoring data showing low concentrations of methylmercury in an agricultural slough flowing into Cache Creek (Slotton et al., 2001). In the remainder of the year, methylmercury loads below Capay derive from the upper basin and in situ production. The flow regime below Capay Dam is taken into account in the load reduction plan. In Phase 1 of implementation, sites of high methylmercury production and sediments with high total mercury concentrations will be identified above and below the dam. In situ production of methylmercury is a function of total mercury in the sediment. Therefore, the load reduction plan seeks to limit summertime methylmercury production by controlling the transport of inorganic mercury in winter high flows. Because sediment in Cache Creek below Rumsey is continually eroding and redepositing, remedial efforts in the upper basin will not immediately decrease fish tissue levels below Capay during the summer.

90
The monitoring program (Section 7) for Cache and Bear Creeks and Harley Gulch will be designed to consider the seasonal variation that occurs in biota. Slotton and colleagues (1995) found that mercury concentrations in Davis Creek Reservoir zooplankton peaked during late fall and dropped in the winter. Schwarzbach and colleagues (2001) found that fish samples collected in Bear Creek during one year had higher mercury concentrations in August than in April. Juvenile bass from the same study exhibited similar patterns as the zooplankton with mercury concentrations spiking in the fall. This concurs with increased methylmercury production in the summer. Uptake by higher trophic level organisms is a function of prey availability and mercury concentration in prey. Both of these factors fluctuate with season. In top trophic level organisms that have bioaccumulated mercury for several years, however, seasonal fluctuations in mercury concentration are less apparent (Slotton, 1995). In Cache and Bear Creeks, the numeric targets are concentrations in larger, trophic level 4 fish, which are less sensitive to seasonal fluctuations in aqueous methylmercury concentrations. In Harley Gulch, methylmercury levels in small fish are expected to be highest in fall, which is when samples will be collected.

91
6 LOAD ALLOCATIONS AND IMPLEMENTATION PLAN FOR MEETING LOADS
As shown by the linkage analysis, reductions in the total methylmercury loads are required to reduce methylmercury concentrations in fish tissue. In this section, load allocations are assigned to meet the methylmercury goals in the tributaries and in Cache Creek. After load allocations are determined, this section discusses a preliminary implementation program to reduce methylmercury in each sub-watershed. This preliminary plan provides possible implementation alternatives. The final implementation plan will evaluate these and other alternatives in the Basin Plan amendment staff report. The load reduction program may include remediation of the inactive mercury mine sites to control loading of mercury and sulfate and erosion control of mercury enriched sediment and soil. Meeting the numeric targets will require additional investigations in each sub-watershed to determine the primary sites of methylmercury production and an evaluation of how best to control inorganic mercury entering sensitive areas with high methylmercury production rates. The control program may include a requirement that the construction and operation of wetland restoration projects or new water impoundments do not increase methylmercury loads to Cache Creek. Finally, the implementation plan discusses possible public outreach and education activities and consideration of fish advisories to reduce health effects of consuming mercury contaminated fish.
6.1 Methylmercury Load Allocations
The linkage analysis section concluded with the calculation of aqueous methylmercury goals that are linked to the numeric targets of methylmercury in fish tissue. These goals are median concentrations of unfiltered methylmercury of 0.06 ng/L for Cache and Bear Creeks and 0.09 ng/L for Harley Gulch. Regional Board staff anticipates that as the median concentrations of methylmercury decrease, the numeric fish tissue targets will be attained. Methylmercury concentrations in samples from the Cache Creek watershed exceed the aqueous methylmercury goals. In order to attain the desired methylmercury levels in Cache Creek, loads of methylmercury from the tributaries and streambeds need to be reduced in proportion to the desired decrease in concentrations. In general, other projects or sites (such as wetlands, impoundments) that contribute mercury or methylmercury are assigned a load allocation of no net increase of mercury or methylmercury discharges.
6.1.1 Cache Creek Methylmercury Load Allocations
To allocate methylmercury loads, the first step was to compare existing median concentrations of methylmercury in Cache Creek, Bear Creek and Harley Gulch with the corresponding methylmercury goals. The amount of reduction needed is expressed as a percent of the existing concentrations. The same percent reductions determined for methylmercury concentrations are then applied to the methylmercury loads. The percent reductions in methylmercury concentrations and loads needed to protect biota within each tributary and in Cache Creek from Clear Lake to the Settling Basin outflow are shown in Table 6.1.
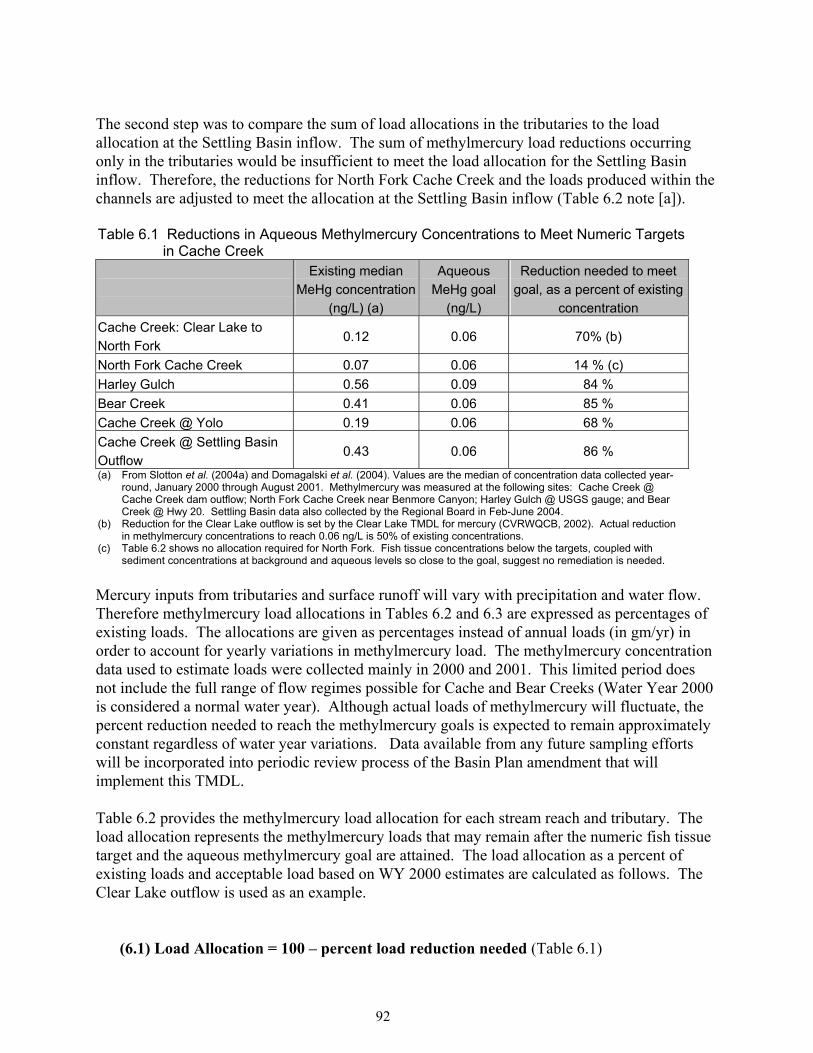
92
The second step was to compare the sum of load allocations in the tributaries to the load allocation at the Settling Basin inflow. The sum of methylmercury load reductions occurring only in the tributaries would be insufficient to meet the load allocation for the Settling Basin inflow. Therefore, the reductions for North Fork Cache Creek and the loads produced within the channels are adjusted to meet the allocation at the Settling Basin inflow (Table 6.2 note [a]). Table 6.1 Reductions in Aqueous Methylmercury Concentrations to Meet Numeric Targets
in Cache Creek
Existing median
MeHg concentration (ng/L) (a)
Aqueous MeHg goal
(ng/L)
Reduction needed to meet goal, as a percent of existing
concentration Cache Creek: Clear Lake to North Fork
0.12 0.06 70% (b)
North Fork Cache Creek 0.07 0.06 14 % (c) Harley Gulch 0.56 0.09 84 % Bear Creek 0.41 0.06 85 % Cache Creek @ Yolo 0.19 0.06 68 % Cache Creek @ Settling Basin Outflow
0.43 0.06 86 %
(a) From Slotton et al. (2004a) and Domagalski et al. (2004). Values are the median of concentration data collected year-round, January 2000 through August 2001. Methylmercury was measured at the following sites: Cache Creek @ Cache Creek dam outflow; North Fork Cache Creek near Benmore Canyon; Harley Gulch @ USGS gauge; and Bear Creek @ Hwy 20. Settling Basin data also collected by the Regional Board in Feb-June 2004.
(b) Reduction for the Clear Lake outflow is set by the Clear Lake TMDL for mercury (CVRWQCB, 2002). Actual reduction in methylmercury concentrations to reach 0.06 ng/L is 50% of existing concentrations.
(c) Table 6.2 shows no allocation required for North Fork. Fish tissue concentrations below the targets, coupled with sediment concentrations at background and aqueous levels so close to the goal, suggest no remediation is needed.
Mercury inputs from tributaries and surface runoff will vary with precipitation and water flow. Therefore methylmercury load allocations in Tables 6.2 and 6.3 are expressed as percentages of existing loads. The allocations are given as percentages instead of annual loads (in gm/yr) in order to account for yearly variations in methylmercury load. The methylmercury concentration data used to estimate loads were collected mainly in 2000 and 2001. This limited period does not include the full range of flow regimes possible for Cache and Bear Creeks (Water Year 2000 is considered a normal water year). Although actual loads of methylmercury will fluctuate, the percent reduction needed to reach the methylmercury goals is expected to remain approximately constant regardless of water year variations. Data available from any future sampling efforts will be incorporated into periodic review process of the Basin Plan amendment that will implement this TMDL. Table 6.2 provides the methylmercury load allocation for each stream reach and tributary. The load allocation represents the methylmercury loads that may remain after the numeric fish tissue target and the aqueous methylmercury goal are attained. The load allocation as a percent of existing loads and acceptable load based on WY 2000 estimates are calculated as follows. The Clear Lake outflow is used as an example.
(6.1) Load Allocation = 100 – percent load reduction needed (Table 6.1)

93
= 100 – 70 = 30%
(6.2) Acceptable load = Load Allocation x Average Annual Load (Table 3.3) = (30%) x 36.8 g/year = 11.0 g/year Table 6.2 Allocation of Methylmercury Loads to Cache Creek
Tributary Watershed
Existing annual load of MeHg (gm/yr)
(b)
MeHg Load Allocation Expressed as a percentage
of existing loads (equals 100% minus reduction in
Table 6.1)
Acceptable MeHg Load (based on
load in Column 1; gm/yr) (d)
Clear Lake Outflow 36.8 30% 11.0 North Fork Cache Creek (a) 12.4 100% 12.4
Harley Gulch 1.0 16% 0.2 Davis Creek (a) 1.3 50% 0.7
Bear Creek 21.1 15% 3.2 Net within channel production &
ungauged tributaries, upper basin to Yolo
49.5 15% 7.4
Margin of Safety (10% of future loads) (10% of future loads) 4
SUM 39.0 Compliance Point for Cache
Creek Tributaries: Cache Creek @ Yolo
122.1 (c) 32% 39.0
Cache Creek Settling Basin
Outflow 86.8 14% 12.0 (a) In North Fork, aqueous concentrations of methylmercury are nearly at acceptable level. Mercury levels in fish resident in
North Fork Cache Creek (Sacramento pikeminnow, rainbow trout) are below the TMDL targets. Based on the fish data and lack of mercury hot spots in the watershed (see sediment concentrations in Table 3.12), no reduction is proposed for North Fork. An allocation of 80% of existing loads was assigned to ensure wildlife species are protected and to reduce loads entering Cache Creek. Methylmercury concentrations in Davis Creek are high (median concentration 0.27 ng/L downstream of the reservoir). The load allocation for Davis Creek is set at 50% of existing loads to protect Cache Creek. Additional load reductions that are likely needed to protect wildlife within Davis Creek will be addressed further in the Davis Creek mercury TMDL.
(b) Estimated loads from Table 3.3. (c) The Cache Creek load at Yolo shown here includes load exported from Cache Creek in agricultural diversions. Tributary
loads contribute to concentrations and loads in both exports. Thus it is appropriate to include the diversions when calculating necessary upstream reductions. An allocation of 32% of existing loads applied just to the water volume passing Yolo corresponds to an estimated load of 23 g/year.
(d) Example of acceptable methylmercury load, based on the loads in Water Year 2000. Actual loads are expected to fluctuate with water volume and other factors, but the allocation as a percentage of a given load will not change.
Note that the methylmercury allocations are expressed as a percentage of existing loads. The load allocation strategy is based on calculating the necessary reductions in aqueous methylmercury concentrations within each tributary and stream section that are needed to attain the fish tissue methylmercury concentration targets. In determining the allocations, however, we must also incorporate methylmercury loads. The loads (concentration x flow) of methylmercury produced upstream determine the concentration downstream. In order to attain the aqueous methylmercury goal in Cache Creek at Yolo, upstream loads must be reduced. As decribed

94
below for the North Fork Cache Creek, the load reductions needed to protect downstream stretches may be greater than the reduction needed to reach the aqueous concentration goal within a tributary.
Evaluating compliance with the allocations should be a multi-step process. First, methylmercury concentrations in water and fish should be compared with the aqueous goal and fish tissue targets, respectively. The median aqueous methylmercury concentrations should be calculated from samples collected in all seasons and flow regimes. Comparing loads with the predicted future loads should be the second step, to be done if targets and goal at the downstream locations are not met or do not correspond (i.e., the flow regimes or linkage may have changed).
Methylmercury is produced in the bed of Cache Creek (in situ production). It is logical to expect that as concentrations of inorganic mercury decline in surficial sediment, in situ production of methylmercury will also decrease (see Linkage Analysis). Potential control measures at the mines and at erosive in-channel sites with high total mercury, coupled with natural sedimentation of less contaminated material, will gradually cause levels of mercury in sediment to decrease. This will result in less methylmercury production in sediment and flux to the overlying water column. The North Fork Cache Creek load allocation was set at 100% of the existing methylmercury loads in North Fork. Comparison of the median, aqueous concentration of methylmercury in North Fork with the aqueous methylmercury goal shows that only slight reductions in water concentrations may be needed (Table 6.1; existing median concentration of 0.07 ng/L versus goal of 0.06 ng/L). The fish data, however, indicate that no corrections are needed in North Fork. Average mercury concentrations in large fish resident in North Fork Cache Creek (TL4 species Sacramento pikeminnow and TL3 species rainbow trout) are below the target levels. At the existing levels, humans and piscivorous birds should be protected. CDFG gathered fish in 2003 to verify the concentration data. As part of the implementation actions described below, additional water data will be gathered. This data will be used to identify sources of methylmercury within North Fork, to refine the linkage, and to ensure that biota in North Fork are protected. The compliance point for measuring the effectiveness of load reductions is Cache Creek at Yolo. Although the TMDL extends through the Settling Basin, the baseline data set for aqueous methylmercury concentrations at Yolo is much more extensive than the data set for the Settling Basin Outflow. Fish in the Settling Basin have not been monitored for mercury. As described in the Source Analysis, methylmercury loads appear to increase between Yolo and the outflow. Regional Board will gather additional data on methylmercury concentrations in water and fish in the six-mile stretch between Yolo and the Setting Basin Inflow and in the Settling Basin. The DFG is working toward collecting fish from Settling Basin for mercury analysis. As part of Phase 1 of the implementation plan described below, strategies to reduce methylmercury production downstream of Yolo and in the Settling Basin will be developed.

95
6.1.2 Bear Creek Methylmercury Load Allocations
Load allocations for Bear Creek were calculated using the same procedure as for the Cache Creek allocations. We compared existing methylmercury concentrations in Bear Creek to the concentration goal and calculated the percent reduction in concentrations needed to meet the goal (Table 6.3). We then applied the same percent reductions to existing methylmercury loads in Bear Creek and a tributary, Sulphur Creek, to determine the allocations (Table 6.4). The Bear Creek load allocations are presented as percentages of existing loads. Using the average of existing loads from Water Year 2000, example acceptable loads are also presented. Table 6.3 Reductions in Aqueous Methylmercury Concentrations to Meet Numeric Targets
in Bear Creek Existing median
MeHg concentration (ng/L) (a)
Aqueous MeHg goal (ng/L)
Reduction needed to meet goal, as a percent of
existing concentration Bear Creek @ Bear
Valley Road 0.10 0.06 40%
Bear Creek @ Hwy 20 0.41 0.06 85% (a) From Slotton et al., (2004a). Flow data for the lower Bear Creek site obtained from Bear Creek flow gauge nearby at Holsten Chimney Canyon.
Loads of methylmercury in lower Bear Creek should be reduced by 85% of existing loads in order to attain the aqueous methylmercury goal and numeric targets for Bear Creek. Loads of methylmercury in Bear Creek above Bear Valley Road should be reduced to 40% of existing loads to attain the goal and targets in upper Bear Creek. The allocation . Much of the methylmercury in Bear Creek comes from sources downstream of Bear Valley Road other than Sulphur Creek. These sources that have not been quantified include within-channel production and ungauged tributaries. The allocation for methylmercury loads from the unidentified sources is 8% of existing loads. Regional Board staff will collect additional data in 2004 to identify and estimate loads from unknown sources of methylmercury within Bear Creek. Load allocations shown in Table 6.4 for the stretch of Bear Creek upstream of Sulphur Creek could become more specific as more detailed information for this stretch is obtained.
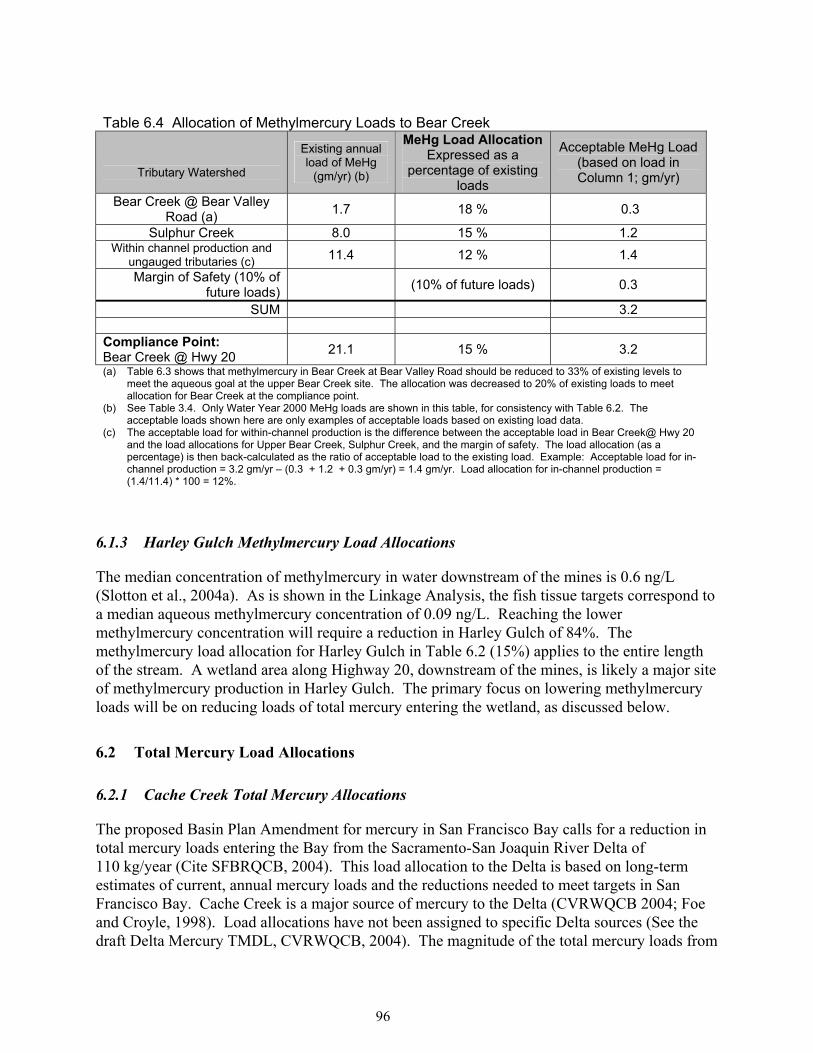
96
Table 6.4 Allocation of Methylmercury Loads to Bear Creek
Tributary Watershed
Existing annual load of MeHg
(gm/yr) (b)
MeHg Load Allocation Expressed as a
percentage of existing loads
Acceptable MeHg Load (based on load in Column 1; gm/yr)
Bear Creek @ Bear Valley Road (a) 1.7 18 % 0.3
Sulphur Creek 8.0 15 % 1.2 Within channel production and
ungauged tributaries (c) 11.4 12 % 1.4 Margin of Safety (10% of
future loads) (10% of future loads) 0.3
SUM 3.2 Compliance Point: Bear Creek @ Hwy 20 21.1 15 % 3.2 (a) Table 6.3 shows that methylmercury in Bear Creek at Bear Valley Road should be reduced to 33% of existing levels to
meet the aqueous goal at the upper Bear Creek site. The allocation was decreased to 20% of existing loads to meet allocation for Bear Creek at the compliance point.
(b) See Table 3.4. Only Water Year 2000 MeHg loads are shown in this table, for consistency with Table 6.2. The acceptable loads shown here are only examples of acceptable loads based on existing load data.
(c) The acceptable load for within-channel production is the difference between the acceptable load in Bear Creek@ Hwy 20 and the load allocations for Upper Bear Creek, Sulphur Creek, and the margin of safety. The load allocation (as a percentage) is then back-calculated as the ratio of acceptable load to the existing load. Example: Acceptable load for in-channel production = 3.2 gm/yr – (0.3 + 1.2 + 0.3 gm/yr) = 1.4 gm/yr. Load allocation for in-channel production = (1.4/11.4) * 100 = 12%.
6.1.3 Harley Gulch Methylmercury Load Allocations
The median concentration of methylmercury in water downstream of the mines is 0.6 ng/L (Slotton et al., 2004a). As is shown in the Linkage Analysis, the fish tissue targets correspond to a median aqueous methylmercury concentration of 0.09 ng/L. Reaching the lower methylmercury concentration will require a reduction in Harley Gulch of 84%. The methylmercury load allocation for Harley Gulch in Table 6.2 (15%) applies to the entire length of the stream. A wetland area along Highway 20, downstream of the mines, is likely a major site of methylmercury production in Harley Gulch. The primary focus on lowering methylmercury loads will be on reducing loads of total mercury entering the wetland, as discussed below.
6.2 Total Mercury Load Allocations
6.2.1 Cache Creek Total Mercury Allocations
The proposed Basin Plan Amendment for mercury in San Francisco Bay calls for a reduction in total mercury loads entering the Bay from the Sacramento-San Joaquin River Delta of 110 kg/year (Cite SFBRQCB, 2004). This load allocation to the Delta is based on long-term estimates of current, annual mercury loads and the reductions needed to meet targets in San Francisco Bay. Cache Creek is a major source of mercury to the Delta (CVRWQCB 2004; Foe and Croyle, 1998). Load allocations have not been assigned to specific Delta sources (See the draft Delta Mercury TMDL, CVRWQCB, 2004). The magnitude of the total mercury loads from

97
Cache Creek make it clear, however, that Cache Creek loads should be reduced in order to attain the Delta total mercury load allocation proposed in the San Francisco Bay TMDL. As described below and in the Implementation Section, this TMDL assigns reductions in total mercury loads to the inactive mines in Harley Gulch and the Bear Creek watershed. The Implementation Section also describes proposed changes to the Cache Creek Settling Basin, which would reduce total mercury loads exiting the Settling Basin. Anticipated reductions in the entire watershed to meet the San Fransisco Bay load reduction will be discussed further in the Cache Creek Watershed Basin Plan Amendment Staff report (anticipated release Spring 2005). Atmospheric loads of methylmercury to the surface of Cache Creek are considered negligible and are not assigned a load allocation. Total mercury loads to the surface of Cache Creek are estimated to provide less than 0.1 percent of loads to Cache Creek. No implementation activities are suggested for atmospheric inputs, as they would be difficult to control under this TMDL and they contribute such a small portion of the mercury loads.
6.2.2 Bear Creek Total Mercury Allocations
Mercury from inactive mines in the Bear Creek watershed has contaminated sediment in tributaries downstream of the mines (Foe and Croyle, 1998). Mercury in the tributaries has and continues to enter Bear Creek53. To decrease loads of mercury entering Bear Creek, Regional Board staff assigns a load allocation of five percent of existing inputs of total mercury from the mines54. The load allocation applies individually to the Petray North, Petray South, Rathburn, and Rathburn-Petray sites. Depending upon rainfall, between 1.2 and 24.3 kg/year of total mercury erodes from existing features on the Petray North, Petray South, and Rathburn-Petray sites to adjacent ravines (Churchill and Clinkenbeard, 2004). Further evaluations should be conducted to determine transport of this material to Bear Creek and potential contributions of mercury from early prospects or excavations on these sites. Drainage on the Rathburn site is inward to the mine pit, indicating that no mercury from current features is expected to reach Bear Creek (Tetra Tech, 2004). A further investigation of the Rathburn Mine site should be conducted to evaluate potential effects of early operations at the site.
6.2.3 Harley Gulch Total Mercury Allocations
In order to decrease concentrations and loads of methylmercury in the entirety of Harley Gulch, inputs of total mercury must be reduced. Levels of total mercury in water flowing into the wetland indicate that the inactive mercury mines are the primary source of inorganic mercury to the wetlands. To address the inorganic loads entering the wetland, Regional Board staff is assigning a load allocation for inorganic mercury to the mine sites. The load allocation assigned to the Abbott and Turkey Run mines is five percent of the existing inputs of total mercury.54 53 Sediment and water samples collected by Regional Board Staff in summer 2004 show an increase in mercury and
methylmercury concentrations downstream of tributaries draining the mine area. Although there was no surface water in the tributaries in the summer, green foliage lining the tributary suggested subsurface flow (unpublished data collected by the Regional Board).
54 The intent of the load allocation for Bear Creek and Harley Gulch mines is to reduce inputs resulting from anthropogenic activities on the site to essentially zero. Waste discharge requirements typically prohibit the discharge of wastes to surface or

98
This allocation is for the total of inputs from both mines.55 The total mercury allocation is to ensure that inputs from the mine areas are reduced, within limits of technical feasibility, to pre-mining conditions.
6.3 TMDL Implementation
The following is a preliminary plan to implement a mercury and methylmercury load reduction program in Cache Creek, Bear Creek, and Harley Gulch. The implementation plan may consist of multiple projects, some of which are discussed here. Various projects and alternatives will be evaluated during the Basin Plan amendment development process to implement the TMDL. The alternative projects and compliance time schedules will be evaluated in accordance with the Porter-Cologne Water Quality Act, Section 13242. The final implementation strategy for this TMDL will be determined based on the implementation plan adopted by the Regional Board through a Basin Plan amendment. The implementation plan to reduce methylmercury concentrations in fish tissue could include three major components:
1) Reduce total mercury discharges from the mercury mine sites; 2) Control discharges of contaminated sediments in watersheds where the total mercury
sediment concentrations are greater than 0.2 ppm, dry weight; and 3) Determine sources of methylmercury production and develop plans to reduce
methylmercury loads.
Another component of the implementation plan might include a program to reduce the mercury related risk to humans consuming mercury contaminated by public outreach and education. Regional Board staff could work with the California Department of Health Services, Office of Environmental Health Hazard Assessment, and the local County Public Health Departments to evaluate whether fish advisories are needed and how best to outreach and educate local anglers and consumers about the hazard of consuming mercury contaminated fish. Reducing methylmercury loads will require a multi-faceted approach that could include controlling inorganic mercury loads, limiting the entry of inorganic mercury into sites with high rates of methylmercury production, and limiting discharge of sulfate where possible. Inorganic mercury control efforts could be prioritized according to their effectiveness at limiting methylmercury production. To that end, mercury likely to enter or reside in areas with high methylation efficiencies should be addressed first. Decreasing methylmercury loads will also
ground water. The allocation of 5% of existing loads from the inative mines considers two factors: 1) the technical feasibility of mine remediation and 2) the uncertainty about natural background conditions within the mine sites. Undisturbed soil in the mineralized zones where the mines are located has higher concentrations of mercury than soil in non-mineralized areas (i.e., the east branch Harley Gulch or Walker Ridge above the mines (Churchill and Clinkenbeard, 2004). Runoff from the mineralized area prior to mining would have contained higher levels of mercury than runoff from areas outside of the mineralized zone. It is difficult to estimate this pre-mining runoff, however, because of the extent of soil disturbances and weathering and uncertainty about mercury deposited locally from the operation of the mine furnaces. Further evaluation of pre-mining conditions are part of a proposed study to be conducted in 2004 (see Monitoring Program).
55 Although originally two mining claims, the mines are contiguous and currently have a single owner. Historical records suggest that waste material and ore were moved between the mine sites.
99
include review by Regional Board staff of scientific progress in understanding factors that influence methylation and incorporation of this information into the implementation plan. Reducing methylmercury production in the sediment of Cache Creek will require that concentrations of inorganic mercury in the sediment decrease (see Linkage Analysis). In order to maximize the efficiency of control activities, controls of inorganic loads entering the main stem could focus on areas with elevated concentrations of inorganic mercury in sediment. Regional Board staff recommends using the proposed San Francisco Bay sediment mercury target of 0.2 ppm as a screening value to prioritize control of contaminated soil. The TMDL implementation program could be divided into a phased process: TMDL Implementation Phase 1 • Start the process for remediation of inactive mercury mines to limit output of mercury and
sulfate; • Collect water and sediment data to determine the sources of methylmercury in the tributaries
and stretches of Cache Creek; and • Initiate public outreach activities to inform consumers of the potential risks of consuming
unsafe amounts of fish from Cache Creek. TMDL Implementation Phase 2 • Develop and implement plans to further reduce loads of methylmercury and inorganic
mercury. Options to be evaluated include erosion control, stream bank stabilization, and allowing sediment with low concentrations of mercury to replace or bury contaminated material in the streambed.
To make significant progress toward reducing methylmercury loads, methylmercury sources need to be identified. In Phase 1, Regional Board staff proposes to gather additional data in Bear Creek and the main stem of Cache Creek to identify sites, such as wetlands, or stream segments that are significant sources of aqueous methylmercury. The data collected in Phase 1 will be used to design the reduction alternatives for Phase 2. Table 6.5 provides an outline of the sources of inorganic and organic mercury and potential implementation options for Phase 1 and 2. The public and private stakeholders with whom the Regional Board will work to achieve the implementation goals are also indicated. Text following Table 6.5 describes the implementation actions in greater detail by waterway.
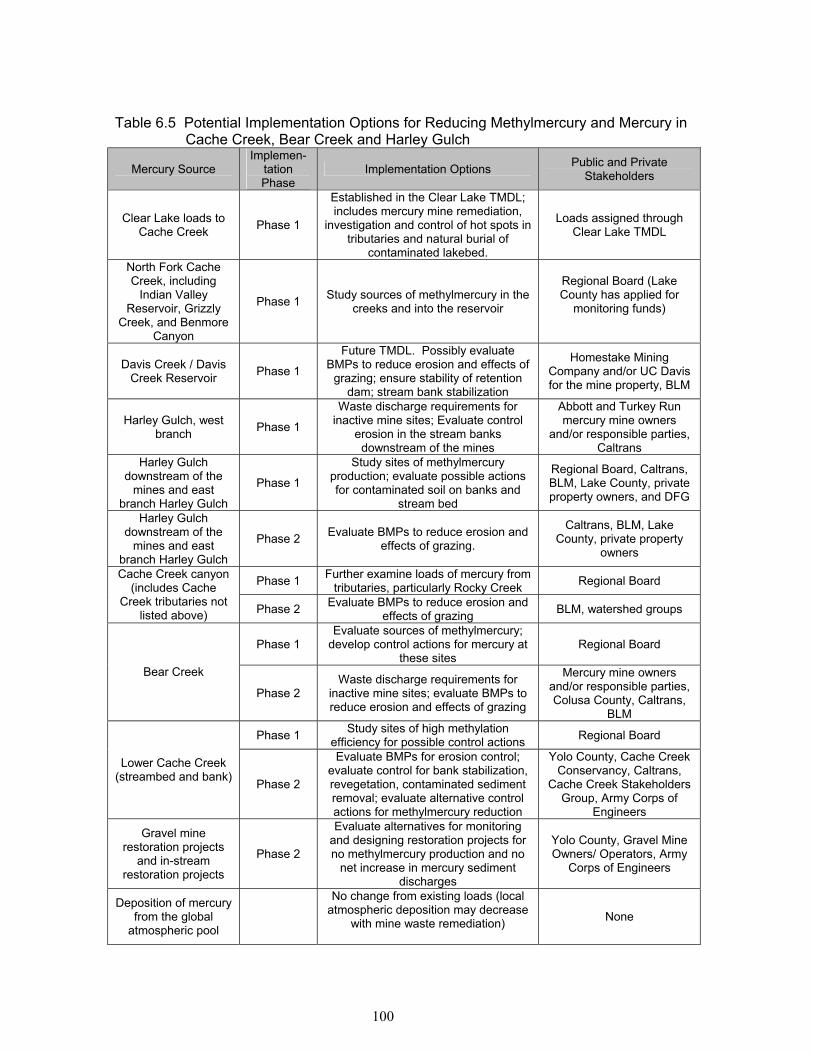
100
Table 6.5 Potential Implementation Options for Reducing Methylmercury and Mercury in
Cache Creek, Bear Creek and Harley Gulch
Mercury Source Implemen-
tation Phase
Implementation Options Public and Private Stakeholders
Clear Lake loads to Cache Creek Phase 1
Established in the Clear Lake TMDL; includes mercury mine remediation,
investigation and control of hot spots in tributaries and natural burial of
contaminated lakebed.
Loads assigned through Clear Lake TMDL
North Fork Cache Creek, including
Indian Valley Reservoir, Grizzly
Creek, and Benmore Canyon
Phase 1 Study sources of methylmercury in the creeks and into the reservoir
Regional Board (Lake County has applied for
monitoring funds)
Davis Creek / Davis Creek Reservoir Phase 1
Future TMDL. Possibly evaluate BMPs to reduce erosion and effects of
grazing; ensure stability of retention dam; stream bank stabilization
Homestake Mining Company and/or UC Davis for the mine property, BLM
Harley Gulch, west branch Phase 1
Waste discharge requirements for inactive mine sites; Evaluate control
erosion in the stream banks downstream of the mines
Abbott and Turkey Run mercury mine owners
and/or responsible parties, Caltrans
Harley Gulch downstream of the
mines and east branch Harley Gulch
Phase 1
Study sites of methylmercury production; evaluate possible actions for contaminated soil on banks and
stream bed
Regional Board, Caltrans, BLM, Lake County, private property owners, and DFG
Harley Gulch downstream of the
mines and east branch Harley Gulch
Phase 2 Evaluate BMPs to reduce erosion and effects of grazing.
Caltrans, BLM, Lake County, private property
owners
Phase 1 Further examine loads of mercury from tributaries, particularly Rocky Creek Regional Board Cache Creek canyon
(includes Cache Creek tributaries not
listed above) Phase 2 Evaluate BMPs to reduce erosion and effects of grazing BLM, watershed groups
Phase 1 Evaluate sources of methylmercury;
develop control actions for mercury at these sites
Regional Board
Bear Creek
Phase 2 Waste discharge requirements for
inactive mine sites; evaluate BMPs to reduce erosion and effects of grazing
Mercury mine owners and/or responsible parties, Colusa County, Caltrans,
BLM
Phase 1 Study sites of high methylation efficiency for possible control actions Regional Board
Lower Cache Creek (streambed and bank) Phase 2
Evaluate BMPs for erosion control; evaluate control for bank stabilization, revegetation, contaminated sediment removal; evaluate alternative control actions for methylmercury reduction
Yolo County, Cache Creek Conservancy, Caltrans,
Cache Creek Stakeholders Group, Army Corps of
Engineers
Gravel mine restoration projects
and in-stream restoration projects
Phase 2
Evaluate alternatives for monitoring and designing restoration projects for no methylmercury production and no
net increase in mercury sediment discharges
Yolo County, Gravel Mine Owners/ Operators, Army
Corps of Engineers
Deposition of mercury from the global
atmospheric pool
No change from existing loads (local atmospheric deposition may decrease
with mine waste remediation)
None
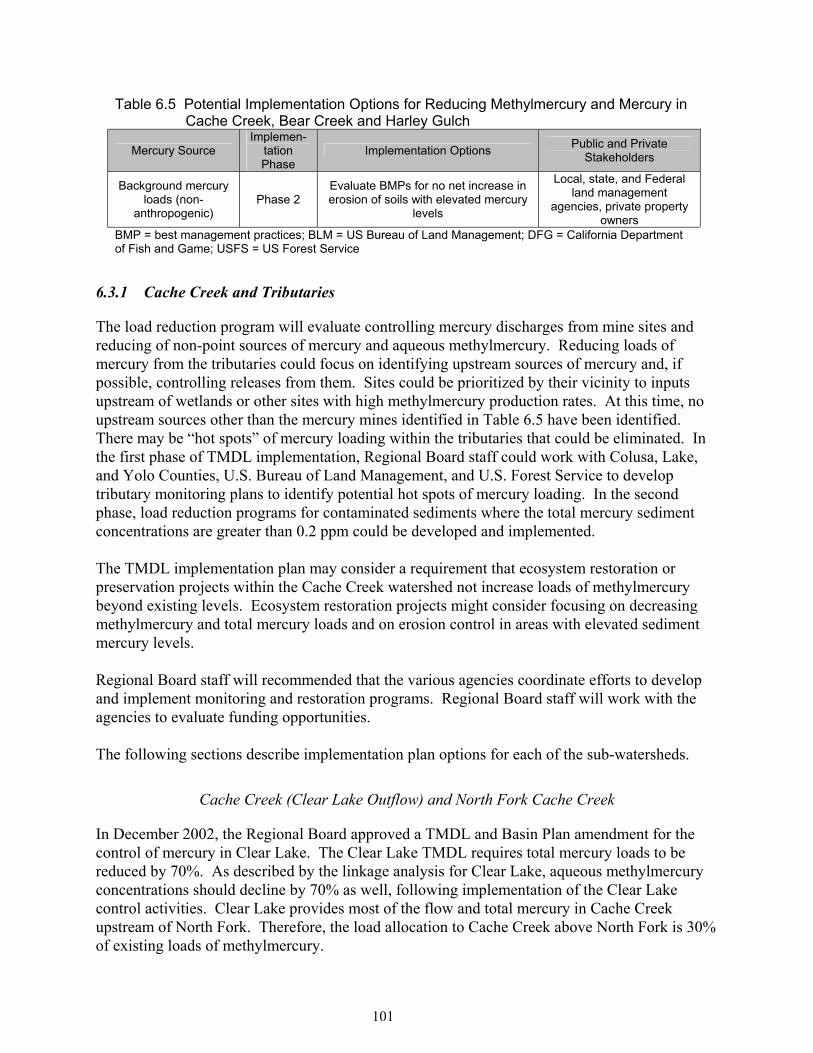
101
Table 6.5 Potential Implementation Options for Reducing Methylmercury and Mercury in Cache Creek, Bear Creek and Harley Gulch
Mercury Source Implemen-
tation Phase
Implementation Options Public and Private Stakeholders
Background mercury loads (non-
anthropogenic) Phase 2
Evaluate BMPs for no net increase in erosion of soils with elevated mercury
levels
Local, state, and Federal land management
agencies, private property owners
BMP = best management practices; BLM = US Bureau of Land Management; DFG = California Department of Fish and Game; USFS = US Forest Service
6.3.1 Cache Creek and Tributaries
The load reduction program will evaluate controlling mercury discharges from mine sites and reducing of non-point sources of mercury and aqueous methylmercury. Reducing loads of mercury from the tributaries could focus on identifying upstream sources of mercury and, if possible, controlling releases from them. Sites could be prioritized by their vicinity to inputs upstream of wetlands or other sites with high methylmercury production rates. At this time, no upstream sources other than the mercury mines identified in Table 6.5 have been identified. There may be “hot spots” of mercury loading within the tributaries that could be eliminated. In the first phase of TMDL implementation, Regional Board staff could work with Colusa, Lake, and Yolo Counties, U.S. Bureau of Land Management, and U.S. Forest Service to develop tributary monitoring plans to identify potential hot spots of mercury loading. In the second phase, load reduction programs for contaminated sediments where the total mercury sediment concentrations are greater than 0.2 ppm could be developed and implemented. The TMDL implementation plan may consider a requirement that ecosystem restoration or preservation projects within the Cache Creek watershed not increase loads of methylmercury beyond existing levels. Ecosystem restoration projects might consider focusing on decreasing methylmercury and total mercury loads and on erosion control in areas with elevated sediment mercury levels. Regional Board staff will recommended that the various agencies coordinate efforts to develop and implement monitoring and restoration programs. Regional Board staff will work with the agencies to evaluate funding opportunities. The following sections describe implementation plan options for each of the sub-watersheds.
Cache Creek (Clear Lake Outflow) and North Fork Cache Creek
In December 2002, the Regional Board approved a TMDL and Basin Plan amendment for the control of mercury in Clear Lake. The Clear Lake TMDL requires total mercury loads to be reduced by 70%. As described by the linkage analysis for Clear Lake, aqueous methylmercury concentrations should decline by 70% as well, following implementation of the Clear Lake control activities. Clear Lake provides most of the flow and total mercury in Cache Creek upstream of North Fork. Therefore, the load allocation to Cache Creek above North Fork is 30% of existing loads of methylmercury.

102
An allocation of 100% of the existing methylmercury loads is assigned to the North Fork Cache Creek. Sediment concentrations in this sub-watershed are 0.1-0.3 m/kg, which are background levels of the Coast Range. There are no known mercury mines within this watershed. In the first phase of this TMDL implementation program, Regional Board staff may monitor methylmercury production in the North Fork Cache Creek to verify that methylmercury levels are indeed at the aqueous methylmercury goal. Lake County has also applied for monitoring funds to identify possible mercury sources in this watershed. Because the sediment mercury concentrations are at background, it is unlikely that control actions in the watershed will change the concentrations of total mercury in the sediment or the methylmercury concentrations produced in that sediment. Erosion control in the watershed, however, would still beuseful to reduce loads of total mercury exiting the Cache Creek system. Implementation activities might involve the California Department of Transportation (Caltrans) and the Lake County Department of Public Works to evaluate and implement effective management practices to control erosion from highway improvement projects along Highway 20 and county roads, grazing and other activities.
Cache Creek Canyon (Includes Cache Creek Tributaries Not Detailed Below)
The allocation for methylmercury produced within Cache Creek and/or from ungauged tributaries is 6% of the existing loads. As described in the source analysis, most of this methylmercury is thought to be produced upstream of Rumsey. Much of this methylmercury is likely produced from mercury contained within the bed and contaminated bank sediments of Cache Creek. The Cache Creek canyon tributaries include Rocky Creek, Judge Davis Creek, and other small tributaries upstream of Rumsey. Regional Board staff intends to collect additional data on mercury sources, contaminated sediment, and sites of methylmercury production in the canyon. Prelminary sediment collection was begun in October 2003. Regional Board staff may coordinate with the Bureau of Land Management and Lake and Yolo Counties to review and update watershed management plans, to update plans to minimize erosion of mercury-contaminated soils, and to continue the grazing moratorium in areas sensitive to erosion. Highway 16 transects a steep section of the Cache Creek canyon between Bear Creek and Rumsey. This part of the road has numerous road cuts, landslides, and unstable sections that may add sediment to Cache Creek. At this time, it is unknown how many of these sections have elevated concentrations of mercury. The implementation plan may consider recommendations that Caltrans evaluate and implement additional BMPs to control erosion from highway maintenance and improvement projects or provide alternatives to control erosion as required.
Lower Cache Creek (Rumsey to the Settling Basin)
As described in the source analysis, methylmercury produced between Rumsey and the Settling Basin is likely from mercury contained within the creek bed and contaminated bank sediments. Other sources of mercury (e.g., small tributaries to lower Cache Creek) to the lower watershed are considered insignificant. The implementation program for lower Cache Creek could be a

103
combination of passive and active remediation projects. It is expected that even after the upstream sources of total mercury are controlled (e.g., sources in Harley Gulch and Sulphur Creek), mercury will be present in the streambed for a long time unless actions are developed and implemented to expedite mercury removal. Load reduction activities in lower Cache Creek could focus on controlling erosion of sediment deposits that contain elevated mercury levels and reducing methylation where possible. The lower Cache Creek load allocation program has two potential components: 1) identify creek sections where methylmercury production rates are high and identify erosive sections with elevated mercury contamination, and 2) conduct engineering and feasibility studies to evaluate options to reduce methylation potential and to reduce erosion or remove contaminated sediments from the floodplain. The final phase of the lower Cache Creek program could be to implement the selected alternatives. Alternative to erosion control or removal within the lower basin, methods to facilitate burial of more contaminated sediment under sediment that is less contaminated or contains regional background levels of mercury. This cleaner sediment would be allowed to enter the creek through natural erosion. The implementation plan could include a recommendation that Yolo County develop and coordinate a program to evaluate projects to reduce erosion and/or remove contaminated sediment. The Yolo County Department of Public Works and Caltrans could implement additional BMPs to control erosion in lower Cache Creek. The lower reaches of Cache Creek have been mined for aggregate. The mining companies now conduct mining operations off-channel. As described in the linkage analysis, some of the off-channel gravel pits are being restored to wildlife habitats that include wetland areas. Mercury present in the sediment is likely to be methylated and made available to wildlife feeding in both the creek and gravel pits. Off-stream gravel mines restoration areas are assigned a load allocation of no net increase of mercury or methylmercury discharges. Regional Board staff may consult with Yolo County and with the gravel mining industry to determine how established gravel pits could be maintained and how new excavations could be constructed and operated in the future to ensure non-toxic methylmercury levels in biota. The final implementation plan may consider a requirement that the construction of new pits not export methylmercury to Cache Creek until fish tissue levels are in compliance with the TMDL targets. Regional Board staff will evaluate the operations of the Capay diversion dam and, if necessary, propose changes to ensure that its operation and maintenance minimizes erosion and the discharge of contaminated sediments to lower Cache Creek.
Davis Creek
Davis Creek Reservoir is on the 303(d) list as impaired by mercury and will be addressed in a separate TMDL. The load allocation to Davis Creek identified thus far is 50% of existing loads of methylmercury. The intention of this allocation is to reduce the loads of methylmercury from Davis Creek that enter Cache Creek. Additional load reductions may be considered in the Davis Creek Reservoir TMDL in order to protect wildlife species in the Davis Creek watershed. Water discharges from Davis Creek Reservoir during above average water years. When water overtops

104
the dam, the methylmercury load to Cache Creek is relatively low. Inorganic mercury loads entering Cache Creek are also a small percentage of the total loads. Regional Board staff will consider recommending that the property owner (Homestake Mining Company and/or UC Davis) continue to operate and maintain the Davis Creek Reservoir Dam and propose other projects to reduce mercury discharges to Davis Creek.
Cache Creek Settling Basin
The Source Analysis determined that the Cache Creek Settling Basin reduces loads of total mercury by 60%. It may be possible to either redesign or operate the basin to trap additional contaminated sediment and reduce mercury flux to the Delta. Regional Board staff is working with Department of Water Resources, Army Corps of Engineers, and the California Bay-Delta Authority to study the sediment retention capacity of the settling basin and to develop engineering modifications that could increase trapping efficiency. The results of this study are expected in 2004/2005. Staff will then work with the agencies to implement the preferred alternative.
6.3.2 Bear Creek
The methylmercury load allocation assigned to Bear Creek is 9% of existing loads. Regional Board staff will gather additional data in Fall 2003 and in 2004 to identify unknown sources of methylmercury in Bear Creek. The load reduction program for Bear Creek developed in Phase 1 will assign allocations to the mercury mine sites within the Bear Creek watershed (including mercury mines along Sulphur Creek) and to other non-point sources. Control actions could be accomplished in Phase 2 through various methods, including waste discharge requirements for the mercury mines and alternatives for erosion control programs for the watershed. The methylmercury load allocation to Sulphur Creek is 50% of existing loads. Implementation plans to reduce mercury loads from the inactive mines draining to Sulphur Creek will be addressed in a separate TMDL for Sulphur Creek. Regional Board staff is currently developing the Sulphur Creek mercury TMDL and expects to have a technical TMDL report in 2004. Tetra Tech (2004) has evaluated the feasibility of remediating mercury mines in Sulphur Creek. Recommendations from the Tetra Tech report will be considered in the Sulphur Creek TMDL. BLM is currently involved with projects to remove invasive vegetation along Bear Creek. For TMDL implementation, Regional Board staff could recommend that BLM monitor stream bank stabilization projects and implement erosion control projects during the restoration program. Further investigations should be conducted to evaluate loading of mercury from the Rathburn and Petray mine group. The Bear Creek implementation TMDL could include a schedule for the Regional Board to adopt waste discharge requirements for the mine sites (e.g., NPDES permit, storm water, or cleanup and abatement orders) to control mercury discharges. The permits may require that the mine owners develop and implement mine remediation plans. The load reductions may be accomplished through a variety of engineering actions including, but not limited to, surface water diversion, erosion control, landslide stabilization, regrading, waste pile

105
containment, capping, relocation or removal, and revegetation. Engineering feasibility studies have been conducted at the Rathburn and Petray mine group (Tetra Tech, 2004). The TMDL implementation plan may also recommend that Caltrans implement BMPs to control erosion from highway maintenance and improvement projects along Highway 16 between Highway 20 and the Bear Creek confluence with Cache Creek.
6.3.3 Harley Gulch
The implementation plan for the Harley Gulch TMDL could include a schedule for adopting waste discharge requirements for the mine sites to control discharges. The permits could include requirements that the mine owners develop and implement mine remediation plans to control discharges of mine wastes. The load reductions may be accomplished through a variety of engineering actions as listed above for the Bear Creek mines. Engineering feasibility studies have been conducted at the Abbott-Turkey Run mine complex to reduce off-site movement of mercury (Tetra Tech, 2004). The results of the feasibility studies will be considered in the evaluation of alternatives for the Harley Gulch mines. In addition, Regional Board staff will continue to collect samples at the mine complex to better ascertain the mercury loads discharged from the site in different water years. The mercury-contaminated wetlands immediately downstream from the mine sites (across Highway 20) may also require remediation. Regional Board staff intends to further investigate methylmercury production rates in the wetland and between Highway 20 and the confluence with Cache Creek. Results of this study will determine whether additional control actions are needed downstream of the mines. Although the east branch Harley Gulch does not contain any known mercury mines, mercury flows from this drainage due to elevated mercury concentrations in surficial soils. This TMDL does not assign a load reduction to the east branch Harley Gulch, but it does require that the mercury loads do not increase over existing conditions. Road improvements are planned on Highway 20 near the Abbott and Turkey Run mines. The implementation plan for the east branch Harley Gulch may have alternatives that involve Caltrans implementing effective BMPs to control erosion from highway improvement projects. Staff will work with Caltrans to ensure that road improvement activities not contribute to increased mercury loads. The implementation plan may discuss alternatives for erosion control of non-road improvement projects. Pre- and post-project water quality monitoring may be required to ensure compliance with the TMDL. BMPs and erosion control alternatives could also apply to Highway 20 road improvements and maintenance along the west branch Harley Gulch. Regional Board staff could coordinate with the BLM, USFS, Lake County, and other land management agencies to address erosion control and mercury hot spots in other parts of the Harley Gulch watershed. These efforts might include a review of grazing and land development policies that effect soil erosion. Additional BMPs could be implemented in regions where soil erosion is a problem.

106
Other implementation options include updating or proposing Memorandums of Understanding or Agreements (MOU, MOA) between the Regional Board and the BLM, USFS, and DFG to include provisions to control mercury discharges and erosion of mercury-contaminated sediment. Regional Board staff could work with agencies to review and update land management plans (e.g., grazing moratoriums), and staff could coordinate with California Department of Forestry to ensure timber harvest plans contain requirements to control erosion of soils with elevated concentrations of mercury.
6.3.4 New Water Impoundments
Gravel mining in lower Cache Creek has produced pits that fill with water and may be a source of methylmercury. Regional Board staff will consult with Yolo County and with the gravel mining industry to determine how established gravel pits could be maintained and how new excavations could be constructed and operated in the future to ensure non-toxic methylmercury levels in biota. Alternatives for the implementation plan may consider requirements that the construction of new pits minimize the export of methylmercury to Cache Creek. Cache Creek has unregulated flow in most winters that is discharged to the Yolo Bypass and Delta. It is possible that water managers could consider the Cache Creek watershed as a site of future water storage facilities. Regional Board staff will consult with the Department of Water Resources and with the Yolo County Flood Control District to determine whether either party intends to construct additional storage facilities in the basin and, if so, how the facilities might be constructed and operated. The implementation plan may consider a requirement that any new water storage facility be constructed and operated in a manner that would preclude a net increase in methylmercury production until fish tissue levels are in compliance with Basin Plan targets.
6.3.5 Atmospheric Inputs
The allocation for atmospheric deposition is capped at the maximum mercury load estimated to accumulate from the global atmospheric pool, which is 0.02 kg/year. Atmospheric mercury originating outside of the Cache Creek watershed is considered an uncontrollable source under this TMDL. As noted in the source analysis, atmospheric loads of mercury derive from global, regional, and local sources. Mercury from Sulphur Bank Mercury Mine is a regional atmospheric source that deposits locally in the Cache Creek watershed. Local mercury flux from Sulphur Bank will be controlled by USEPA Superfund remediation activities at the mine site; therefore, there should be slightly less atmospheric loading from local sources after remediation.

107
7 MONITORING PROGRAM
An essential element of the TMDL is the monitoring plan. Goals of monitoring are to measure whether loads have been reduced from the various sources and to track progress in meeting the targets. In addition to this TMDL compliance monitoring, Regional Board staff intends to collect data to further define sites of methylmercury production and loads of mercury within tributaries and the main stem Cache Creek. Some of the additional studies will be planned as part of Phase One of the Implementation Plan. The monitoring plan for the Cache Creek Watershed is described below. Table 7.1 summarizes additional studies that have been recommended in this report. The table provides an estimated cost for the studies and indicates which activities have been funded. Completion of all of the studies listed below is dependent upon receipt of sufficient funding.
7.1 Implementation Phase 1 Studies
Reduction of mercury loads will be most cost-effective when targeted to mercury entering sites with high methylation efficiencies. Regional Board staff intends to collect water and sediment samples at multiple sites in Cache Creek below Rumsey, in North Fork Cache Creek, in Bear Creek and at the mouths of smaller tributaries to Cache and Bear Creeks. Analytes will include methylmercury and total mercury in sediment and unfiltered methylmercury in water.
7.2 Determination of Harley Gulch Background
The cleanup goal for remediation of the mines in Harley Gulch is based on limited data for the determination of background mercury concentrations. The TMDL requires the mines in Harley to be remediated to pre-mining, natural background levels. The monitoring program includes the development of a protocol for determining background sediment concentrations and collecting the necessary field data to establish background. In addition, to assess the existing conditions in Harley Gulch, Staff proposes to collect information between the USGS gauge station and the confluence of Cache Creek. Information will include methylmercury and mercury in water, sediment, and biota. Additional work planned for Harley Gulch includes an assessment of the sediment delta at the confluence of Cache Creek and Harley Gulch. The volume of sediment, associated grain size, and mercury content of the delta will be determined. Assuming funds are available, Regional Board staff proposes to conduct this work in 2004 and 2005.
7.3 Fish Tissue
Monitoring of mercury levels in fish is proposed for several objectives: 1) measure levels of mercury in fish in Harley Gulch; 2) track the progress of mercury control actions by measuring mercury in small fish; and 3) over time, evaluate compliance with numeric targets.

108
No data are currently available on levels of mercury in small fish residing in Harley Gulch. Regional Board staff proposes to collect fish in Harley Gulch downstream of Highway 20 to create a baseline prior to remediation of the mines. In order to track the progress of remediation actions, young, TL2 and TL3 fish that remain in a relatively defined home territory should be monitored in the Cache Creek watershed. Young fish are desired because their methylmercury uptake is largely the result of recent exposure. Therefore, young fish will more quickly reflect changes in mercury bioavailability than will larger or older fish, which integrate mercury uptake across years and large spatial areas. Young California roach, speckled dace, red shiner and inland silversides are species that are recommended for this effort. A baseline for levels of methylmercury in these species is fairly well established (see Appendix A for data). Juvenile fish should be sampled periodically after control actions. It is expected that attainment of the target levels of methylmercury in fish will require a lengthy period of time. The numeric targets for Cache Creek are averages of concentrations in large TL3 and TL4 fish. Monitoring of these large fish can be effectively done once per year periodically (interval between three and ten years). Because adult fish integrate methylmercury levels over a lifetime and changes in mercury loads in Cache Creek are expected to occur slowly, more frequent sampling of sport fish is not necessary. Species recommended for trend monitoring are green sunfish and Sacramento sucker (TL3) and Sacramento pikeminnow, smallmouth bass and catfish (TL4). In order to confirm that the targets are attained, presumably mercury levels would need to be evaluated in other species popular for sport fishing. Because of the widespread distribution of mercury within Cache and Bear Creeks, Regional Board staff expects that cleanup and subsequent reduction in methylmercury concentrations in fish will take decades. Through the monitoring described above, staff will be alerted when fish tissue levels approach the numeric targets. If the results of one sampling event show that average concentrations in TL3 and TL4 sport fish are at the target levels, samples should then be collected in the following two years to verify that the targets have been attained. The procedure for determining compliance with the targets will be specified in the Basin Plan amendment. Regional Board staff anticipates recommending to the Board a procedure that includes the following conditions:
• Targets are attained when the average concentrations in TL3 and TL4 sport fish greater than 180 mm in fork length are equivalent to the corresponding TL3 and TL4 numeric targets each year for three consecutive years.
• Average concentrations should be calculated from at least ten samples from individual fish of each trophic level.
• Sample sets should include at least two species from each trophic level (i.e., bass and Sacramento pikeminnow, for TL4) collected at each target compliance point or stream section. The samples should include a range of sizes of fish greater than 180 mm.
• Proposed target compliance sections for Cache Creek are: below the Cache Creek dam, within North Fork, Cache Creek between Rumsey and the Capay Dam, and Cache Creek between Capay Dam and the Settling Basin Outflow. Compliance sections for Bear Creek are: Bear Creek within Bear Valley and Bear Creek downstream of Sulphur Creek.

109
These compliance sections can be changed upon receipt of better information about methylmercury production sites and/or distribution of fish populations. (For example, because most methylmercury is produced in the Upper Cache Creek Basin, the Board could conclude that methylmercury concentrations in fish below Rumsey and below Capay Dam are always expected to be very similar).
• Targets should be attained for three consecutive years in each compliance section.
In Harley Gulch, small fish should be sampled frequently after control actions are performed (such as every 2-3 years for ten to twelve years) to track the effectiveness of the remediation and less frequently thereafter (every ten years). Because the population sizes in Harley Gulch are small, care must be taken not to decimate them by sampling excessively. The Harley Gulch target is attained when the average concentrations in resident fish (TL2/3) are equivalent to the numeric target each year for three consecutive years. Average concentrations should be calculated from at least five samples. These samples may be from individual fish or composites.
7.4 Sediment and Water
A majority of the mercury load in Cache Creek is the existing bed load. The monitoring program for lower Cache Creek should include an evaluation of mercury in the sediment. The plan should determine the major erosional and depositional areas and the mercury content. The results of this study will be used to formulate implementation alternatives and conduct engineering feasibility studies for selected alternatives. Regional Board staff expects to conduct this work within the next five years. Aqueous methylmercury concentrations and TSS throughout the watershed should be evaluated regularly, preferably on the same time schedule as small fish. Total mercury sediment concentrations may be monitored as well. Levels of total mercury in sediment and TSS can be used to indicate whether loads have diminished. Existing sediment data should be evaluated to determine if there is an adequate baseline of information. More detailed sediment surveys will be undertaken in Cache and Bear Creeks during 2003/04 to better identify the primary areas where methylmercury is being synthesized and, if possible, habitat-specific methyl to total mercury relationships. Sediment and water data should be collected at the following compliance points or segments of the Cache Creek: Cache Creek at Rumsey; Cache Creek between Capay Dam and Road 102; Cache Creek downstream of the Cache Creek Dam, and North Fork Cache Creek near Highway 20. For all data collection efforts described above, some baseline data are available. The existing data should be evaluated by a statistician to determine completeness, to understand variability in the study population, and to design future collections. Statistical analysis is critical to being able to assess whether load reductions have decreased fish tissue levels.

110
Table 7.1 Additional Studies
Studies or Actions
Report Sections Purpose Agency Schedule
Estimated Cost
Funding Availability
Fish Advisories 1.4, 6.2 Determine whether a fish advisory is needed for the watershed and how best to educate local residents about the hazard of consuming mercury contaminated fish.
California Department of Health Services, California Office of Environmental Health Hazard Assessment, County Public Health Departments and Regional Board staff
2005 $5,000-$20,000
Not funded
Water and Fish in Harley Gulch
3.3, 6.2, 7.2
Determine mercury and methylmercury concentrations in water and fish within Harley Gulch to the confluence with Cache Creek. Investigate methylmercury production rates in the wetland along Highway 20.
Regional Board staff and DFG
2004 $10,000 Funded: TMDL
contract money
Harley Gulch Background
2.2, 7.2 Collect additional data to help define background conditions in Harley Gulch. Information will include methylmercury and mercury in water, soils, sediment, and biota.
Regional Board staff and DFG
2004 $10,000 Funded: TMDL
contract money
Sediment in Harley Gulch
2.2, 7.2
Determine volume of contaminated sediment and amount of mercury in the channel between Highway 20 and the delta. Assess the sediment delta at the confluence of Cache Creek and Harley Gulch. Determine the volume of sediment, associated grain size, and mercury content of the delta.
Regional Board staff and DFG
2004
$5,000 Funded: TMDL
contract money
Cache Creek Methylmercury Loads
3.3, 4.1, 5.2, 6.2, 6.2.1
Determine methylmercury loads in Cache Creek watershed (upper and lower), collect additional data in North Fork Cache Creek, Bear Creek and tributaries, and the main stem of Cache Creek to identify sites, such as wetlands, or stream stretches that are significant sources of aqueous methylmercury, collect further data on mercury sources, contaminated sediment,
Regional Board staff and contractors
2003-2005
$50,000 Partially funded with
TMDL Contract money

111
and sites of methylmercury production. Table 7.1, continued
Studies or
Actions Report
Sections Purpose Agency Schedule Estimated
Cost Funding
Availability Cache Creek Sediment
3.4, 6.2, 7.4
Determine in-stream sediment concentrations and erosion and depositional areas; conduct engineering and feasibility studies to determine if source reduction projects are possible for creek sediments.
Department of Conservation
2004-2007 $800,000 to $1M
Not Funded: CalFed
Watershed Proposal
under consideration
Cache Creek Settling Basin
6.2 Study the sediment retention capacity of the Settling Basin and determine engineering modifications to increase trapping efficiency.
Regional Board, Department of Water Resources, Army Corps of Engineers, and California Bay-Delta Authority
2004-2007 $250,000 Partially funded with
TMDL Contract money
Fish Tissue 7.3 Periodic fish tissue measurements of mercury in fish to track the progress of mercury control actions and evaluate compliance with numeric targets. (Cost estimate for sampling once at 5 sites. Establishing yearly variation and a final demonstration of compliance with targets requires more samples).
DFG After completion of mercury
control actions
$15,000- $20,000
Not Funded
Harley Gulch Mine Sites
6.2 Write and adopt permits for inactive mercury mine sites in Harley Gulch.
Regional Board staff 2004-2006 $125,000 Potential funding from
CalFed

112
8 PUBLIC PARTICIPATION
Regional Board staff received data and background information from the USEPA, USGS, USBR, UC Davis, and CALFED. Staff will solicit further public participation during a public comment period by:
• Sending notification of availability of the draft TMDL Report to interested parties (e.g., federal, state and local agencies involved in the watershed, private landowners, members of the Cache Creek Stakeholders Group and any other local watershed groups, the Delta Tributaries Mercury Council (DTMC) and other interested groups and persons). The draft TMDL report and appendices will be available in PDF format on the Regional Board website: http://www.swrcb.ca.gov/rwqcb5/programs/index.html. Paper copies of the report will be sent to interested persons upon request.
• Soliciting and reviewing the public’s written and verbal comments. • Organizing one or more public workshops within the Cache Creek watershed to explain
the TMDL and to receive and respond to comments. • Continuing to coordinate with and receive input from the DTMC. Monitoring and
implementation activities of this TMDL fit within recommendations of the DTMC’s Strategic Plan for the Reduction of Mercury Related Risk in the Sacramento River Watershed (DTMC Strategic Plan). Specifically, the DTMC Strategic Plan recommends monitoring soil samples in tributary watersheds with higher than average Hg/TSS, additional sediment and water monitoring to quantify mercury loads, planning of remediation projects that may serve as pilot projects for the Sacramento River Watershed, and development and implementation of public outreach.
Regional Board staff will consider relevant comments and any additional data in the final version of the TMDL report and in the development of the proposed Basin Plan amendment for Cache Creek, Bear Creek, and Harley Gulch. When the draft Basin Plan amendment Staff Report and CEQA analysis are available, Regional Board staff will solicit written and oral comments from the public. Regional Board staff will prepare responses to public comments received on the proposed Basin Plan amendment and submit the comments and responses to the Regional Board.

113
9 REFERENCES
Armstrong F, Scott D, 1979. Decrease in mercury content of fishes in Ball Lake, Ontario, since imposition of controls on mercury discharge. Journal of the Fish Research Board of Canada 36:670-672.
Ayers RS, Westcot DW, 1985. Water Quality for Agriculture. Rome, Food and Agriculture Organization of the United Nations - Irrigation Drainage Paper No. 29, Rev. 1.
Barr JF, 1986. Population dynamics of the common loon (Gavia immer) associated with mercury-contaminated waters in northwestern Ontario. Can. Wildl. Serv. Occas. Paper No. 56., In: Environmental Contaminants in Wildlife: Interpreting Tissue Concentrations. (WN Beyer, GH Heinz and AW Redmon-Norwood, eds) Boca Raton, CRC Press, Inc. 1996. Chapter 14, p. 344.
Becker DS, Bigham GN, 1995. Distribution of mercury in the aquatic food web of Onondaga Lake, New York. Water, Air, and Soil Pollution 80:563-571.
Bedient PB, Huber WC, 1988. Hydrology and Floodplain Analysis: Addison Wesley Publishing Co. Benoit JM, Gilmour CC, Heyes A, others, 2003. Geochemical and biological controls over
methylmercury production and degradation in aquatic ecosystems. In: Biogeochemistry of Environmentally Important Trace Elements (Chai Y, Braids O, eds). Washington, DC: American Chemical Society; 262-297.
Benoit,J.M., C.C. Gilmour, R.P. Mason, G.S. Riedel, and G.F. Riedel. 1998. Behavior of mercury in the Patuxent River Estuary. Biogeochemistry 40: 249-265.
Benoit JM, Gilmour CC, Mason R, 2001. The influence of sulfide on solid-phase mercury bioavailability for methylation by pure cultures of Desulfobulbus propionicus (lpr3). Env. Sci. Technol. 35:127-132.
Benoit JM, Gilmour CC, Mason R, al e, 1999a. Sulfide controls on mercury speciation and bioavailability to methylating bacteria in sediment and pore waters. Env. Sci. Technol. 33:951-957.
Benoit JM, Mason R, Gilmour CC, 1999b. Estimation of mercury-sulfide speciation and bioavailability in sediment pore waters using octanol-water partitioning. Environmental Toxicology and Chemistry 18:2138-2141.
Bloom NS, 1992. On the chemical form of mercury in edible fish and marine invertebrate tissue. Can. J. Fish. Aquat. Sci 49:1010-1017.
Bloom NS, Gill G, Cappellino S, al. e, 1999. Speciation and cycling of mercury in Lavaca Bay, Texas, sediments. Env. Sci. Technol. 33:7-13.
Bloom NS, 2004. Solid Phase Mercury Speciation and Incubation Studies in or Related to Mine-site Runoff in the Cache Creek Watershed (CA)., Frontier Geosciences Inc. In Final report for CalFed Bay-Delta Mercury Program grant entitled “An assessment of ecological and human health impacts of mercury in the Bay-Delta Estuary Watershed”.
Bodaly RA, St. Louis VL, Paterson M, al. e, 1997. Bioaccumulation of mercury in the aquatic food chain in newly flooded areas. In: Metal Ions in Biological Systems, Vol. 34: Mercury and Its Effects on Environment and Biology (Sigel A, Sigel H, eds). New York: Marcel Dekker.
Brumbaugh W, Krabbenhoft DP, Helsel DR, Wiener JG, 2001. A National Pilot Study of Mercury Contamination of Aquatic Ecosystems Along Multiple Gradients: Bioaccumulation in Fishes. Reston, VA, US Geological Survey, Biological Science Report USGS.BRD/BSR-2001-0009.
Buer SM, Phillippe SR, Pinkos TR, 1979. Inventory and Assessment of Water Quality Problems Related to Abandoned and Inactive Mines in the Central Valley Region of California., California Regional Water Quality Control Board, Central Valley Region. Sacramento, CA. Draft staff report.
DFG, 2002. California Wildlife Habitat Relationships System Version 8., California Department of Fish and Game. Species Database is available at:http://www.dfg.ca.gov/whdab/html/cwhr.html.
Churchill RK, 1999. Insights into California Mercury Production and Mercury Availability for the Gold Mining Industry from the Historical Record. Abstract. In: Geological Society of America.

114
Churchill RK, Clinkenbeard JP, 2002. Assessment of the Feasibility of Remediation of Mercury Mine Sources in the Cache Creek Watershed. Task 5C1 Final Report., California Department of Conservation, California Geological Survey. Prepared for the CALFED Bay-Delta Program, Directed Action #99-B06. Available at: http://loer.tamug.tamu.edu/calfed/FinalReports.htm. 20 August.
Compeau G, Bartha R, 1985. Sulfate-reducing bacteria: Principal methylators of mercury in anoxic estuarine sediment. Applied Environmental Microbiology 50:498-502.
Conaway CH, Squire S, Mason R, al. e, 2003. Mercury speciation in the San Francisco Bay Estuary. Marine Chemistry 80:199-225.
Cooke J, Karkoski J, 2001. Clear Lake TMDL for Mercury Numeric Target Report. Sacramento, Central Valley Regional Water Quality Control Board, Staff Report. Available at: http://www.swrcb.ca.gov/rwqcb5/programs/tmdl/clearlake.html. June.
CVRWQCB, 1998. The Water Quality Control Plan (Basin Plan) for the California Regional Water Quality Control Board - Central Valley Region for the Sacramento River Basin and the San Joaquin River Basin. Fourth Edition. Sacramento, CA, Central Valley Regional Water Quality Control Board.
CVRWQCB, 2002. Clear Lake TMDL for Mercury. Final Staff Report., Central Valley Regional Water Quality Control Board, Sacramento, CA. February.
CVRWQCB, 2003a. Personal communication from D. Russell, US Fish and Wildlife Service, to Janis Cooke, Central Valley Regional Water Quality Control Board, regarding mercury bioaccumulation factors for piscivorous birds. 13 Feb 2003.
CVRWQCB, 2003b. Personal communication from G. Mangan, US Bureau of Land Management, Ukiah Office, to J. Cooke, Central Valley Regional Water Quality Control Board, regarding wildlife resources of Bear Creek. 16 July.
CVRWQCB, 2003c. Personal communication from Alan Buckman, Lake County Wildlife Biologist, California Dept. Fish & Game, to J. Cooke, Central Valley Regional Water Quality Control Board, regarding wildlife resources of Bear Creek. 23 July.
Davidson PW, Myers GJ, Cox C, Axtell C, Shamlaye C, Sloane-Reeves J, Cernichiari E, Needham L, Choi A, Wang Y, Berlin M, Clarkson TW, 1998. Effects of prenatal and postnatal methylmercury exposure from fish consumption on neurodevelopment. Journal of the American Medical Association 280:701-707.
Davis T, 1998. Cache Creek Annual Status Report., Yolo County Planning and Public Works Department. Woodland, CA. Staff memorandum.
Domagalski J, Slotton DG, Alpers CN, Suchanek TH, Churchill RK, Bloom NS, Ayers SM, Clinkenbeard JP, 2004. Summary and Synthesis of Mercury Studies in the Cache Creek Watershed, California, 2000-2001. Final Report., U.S. Geological Survey; UC Davis; U.S. Fish and Wildlife Service; California Department of Conservation; California Geological Survey; and Frontier Geosciences, Inc. Prepared for the CALFED Bay-Delta Program, Directed Action #99-B06. Available at: http://loer.tamug.tamu.edu/calfed/FinalReports.htm.
DWR, 2001. California Department of Water Resources, California Data Exchange Center, Brooks Precipitation Gauge, Station BBS. Available at: http://cdec.water.ca.gov.
Eisler R, 1987. Mercury Hazards to Fish, Wildlife and Invertebrates: A Synoptic Review., U. S. Fish and Wildlife Service Biological Report 85(1.10). Available at: http://www.pwrc.usgs.gov/contaminants.
Falter R, Wilken R, 1998. Isotope experiments for the determination of abiotic mercury methylation potential of a Rhine River sediment. Wasser 90L:217-232.
Foe C, Croyle B, 1998. Mercury Concentrations and Loads from the Sacramento River and from Cache Creek to the Sacramento-San Joaquin Delta Estuary. Sacramento, CA, Staff Report to the Central Valley Regional Water Quality Control Board. June.
Foe CG, Stephenson M, Stanish S, 2002. Pilot Transplant Studies with the Introduced Asiatic Clam, Corbicula fluminea, to Measure Methyl Mercury Accumulation in the Foodweb of the Sacramento-San Joaquin Delta Estuary. Final Report., Central Valley Regional Water Quality Control Board and

115
California Department of Fish and Game. Prepared for the CALFED Bay-Delta Program Directed Action #99-B06. Available at: http://loer.tamug.tamu.edu/calfed/FinalReports.htm. August.
Francesconi K, Lenanton R, Capoli N, al. e, 1997. Long-term study of mercury concentrations in fish following cessation of a mercury-containing discharge. Marine Env. Res. 43:27-40.
Gilmour CC, Henry EA, Mitchell R, 1992. Sulfate stimulation of mercury methylation in freshwater sediments. Env. Sci. Technol. 26:2281-85.
Gilmour CC, Riedel G, Ederington M, al. e, 1998. Methylmercury concentrations and production rates across a trophic gradient in the northern Everglades. Biogeochemistry 40:327-345.
Grandjean P, Budtz-Jorgensen R, White R, al. e, 1999. Methylmercury exposure biomarkers as indicators of neurotoxicity in children aged 7 years. Am J. Epidemiology 150:301-305.
Gustin MS, Fitzgerald B, Nacht D, Zehner B, Coolbaugh M, Engle M, Sladek C, Keislar R, Rytuba J, Lindberg S, Zhang H, 2000. Atmospheric Mercury Emissions from Mine Waste. In: Proceedings, Assessment and Managing Mercury from Historic and Current Mining Activities. Extended Abstract. San Francisco: U. S. Environmental Protection Agency, Office of Research and Development.
Halbrook RS, Lewis LA, Aulerich RI, Bursian SJ, 1997. Mercury accumulation in mink fed fish collected from streams on the Oak Ridge Reservation. Archives of Environmental Contamination and Toxicology 33:312-316.
Hamas MJ, 1994. Belted kingfisher (Ceryle alcyon). In: The Birds of North America, No. 84 (Poole A, Gill F, eds): Philadelphia: The Academy of Natural Sciences; Washington D.C.: The American Ornithologists' Union.
Hatch JJ, Weseloh DV, 1999. Double-crested Cormorant (Phalacrocorax auritus). In: The Birds of North America, No. 441 (Poole A, Gill F, eds): Philadelphia: The Academy of Natural Sciences; Washington D.C.: The American Ornithologists' Union.
Heim W, Coale K, and Stephenson M, 2004. Methyl and Total Mercury Spatial and Temporal Trends in Surficial Sediments of the San Francisco Bay-Delta, Final Report., California Dept. Fish and Game Moss Landing Marine Laboratory. Prepared for the CALFED Bay-Delta Program Directed Action #99-B06. Available at: http://loer.tamug.tamu.edu/calfed/FinalReports.htm.
Hintelmann, H. and R Wilken. 1995. Levels of total and methylmercury compounds in sediments of the polluted Elbe River: influence of seasonally and spatially varying environmental factors. Science of the Total Environment 166: 1-10.
Hornberger, M.I. S. Luoma, A. Van Geen, C. Fuller and R. Anima. 1999. Historical trends of metals in the sediment of San Francisco Bay, CA. Marine Chemistry 64: 39-55.
Hurley J, Krabbenhoft DP, Cleckner L, 1998. System controls on the aqueous distribution of mercury in the northern Florida Everglades. Biogeochemistry 40:293-311.
Jackman RE, Hunt WG, Jenkins JM, Detrich PJ, 1999. Prey of nesting bald eagles in Northern California. J. Raptor Research 33:87-96.
Jernelov A, Asell B, 1975. The feasibility of restoring mercury contaminated waters. In: Heavy Metals in the Aquatic Environment (Krenkel PA, ed). Oxford: Pergammon Press; 299-309.
Kelly CA, Rudd JWM, St. Louis VL, Heyes A, 1995. Is total mercury concentration a good predictor of methyl mercury concentration in aquatic systems? Water, Air, and Soil Pollution 80:715-724.
King J, Harmon S, Fu T, al. e, 2002. Mercury removal, methylmercury formation, and sulfate reducing bacteria profiles in wetland mesocosms. Chemosphere 46:859-870.
Kjellstrom T, Kennedy P, Wallis S, et al., 1998. Physical and Mental Development of Children with Prenatal Exposure to Mercury from Fish: Stage 2 Interviews and Psychological Tests at Age 6. Solna, National Swedish Environmental Protection Board. Report No. 3642.
Krabbenhoft DP, Wiener JG, Brumbaugh W, al. e, 1999. A national pilot study of mercury contamination of aquatic ecosystems along multiple gradients. In: U. S. Geological Survey Toxic Substances Hydrology Program: proceedings of the Technical Meeting, Charleston, SC, March 8-12, 1999. Water-resources Investigations Report: 99-4018 A-C (Morganwalp DW, Buxton HT, eds): West
116
Trenton, N. J.: U. S. Dept. Interior, U. S. Geological Survey; Denver: Branch of Information Services (distributor); 147-160.
Lindestrom L, 2001. Mercury in sediment and fish communities of Lake Vanern, Sweden: Recovery from contamination. Ambio 30:538-544.
Linthicum J, 2003. Personal communications from Janet Linthicum, University of California Santa Cruz Predatory Bird Research Group, to Janis Cooke, Central Valley Regional Water Quality Control Board, regarding nesting sites and prey remains for peregrine falcons in the Cache Creek, Napa Valley and Delta areas. April.
Lodenius M, 1991. Mercury concentrations in an aquatic ecosystem during 20 years following abatement of the pollution source. Water, Air, and Soil Pollution 56:323-332.
Mallory M, Metz K, 1999. Common merganser (Mergus merganser). In: The Birds of North America, No. 442 (Poole A, Gill F, eds): Philadelphia: The Academy of Natural Sciences; Washington D.C.: The American Ornithologists' Union.
Marshack JB, 2003. A Compilation of Water Quality Goals. Sacramento, CA, Central Valley Regional Water Quality Control Board, Staff report. August.
Marvin-DiPasquale M, Agee MJ, McGowan C, al. e, 2000. Methylmercury degradation pathways- A comparison among three mercury impacted ecosystems. Env. Sci. Technol. 34:4908-4916.
Matta MB, Linse J, Cairncross C, Francendese L, Kocan RM, 2001. Reproductive and trangenerational effects of methylmercury or Aroclor 1268 on Fundulus heteroclitus. Environmental Toxicology and Chemistry 20:327-335.
McKee,L and C. Foe. 2002. Memorandum to D. White and K. Abu-Saba entitled “Estimation of Total Mercury Fluxes entering San Francisco Bay from the Sacramento and San Joaquin River Watersheds. San Francisco Estuary Institute. 7770 Pardee Lane, Oakland Ca 94621-1424.
McLaughlin RJ, Ohlin HN, Thormahlen DJ, Jones DL, Miller JW, Blome CD, 1989. Geologic Map and Structure Sections of the Little Indian Valley-Wilbur Springs Geothermal Area, Northern Coast Range, California., U. S. Geological Survey, Map I-1706.
Miskimmin B, Rudd JWM, Kelly CA, 1992. Influences of dissolved organic carbon, pH, and microbial respiration rates on mercury methylation and demethylation in lake water. Can. J. Fish. Aquat. Sci 49:17-22.
Montoya B, Pan X, 1992. Inactive Mine Drainage in the Sacramento Valley, California., Central Valley Regional Water Quality Control Board, Central Valley Region. Sacramento, CA. Staff Report. July.
Morel FMM, 1998. The chemical cycle and bioaccumulation of mercury. Annual Review of Ecology and Systematics 29:543-66.
Moyle PB, 2002. Inland Fishes of California. Revised and Expanded. Berkeley, CA: University of California Press.
NADP, 2000a. National Atmospheric Deposition Program 1998 Wet Deposition., NADP Data Report 2000-01. Illinois State Water Survey, Champaign, IL. Data available at: http://nadp.sws.uiuc.edu/mdn.
NADP, 2000b. National Atmospheric Deposition Program 1999 Annual Summary., NADP Data Report 2000-02. Illinois State Water Survey, Champaign, IL. Data available at: http://nadp.sws.uiuc.edu/mdn.
NAS, 1973. A Report of the Committee on Water Quality: Water Quality Criteria, 1972. U.S. Environmental Protection Agency, National Academy of Science-National Academy of Engineers (NAS). EPA R3-73-033.
Nichols J, Bradbury S, Swartout J, 1999. Derivation of wildlife values for mercury. Journal of Toxicology and Environmental Health:325-355.
NRC, 2000. Toxicological Effects of Methylmercury. Washington, DC, National Research Council, Committee on the Toxicological Effects of Mercury. Published by National Academy Press. Available at http://www.nap.edu/books/0309071402/html.

117
OEHHA, 1999. California Sport Fish Consumption Advisories 1999., Office of Environmental Health Hazard Assessment, California Environmental Protection Agency.
OEHHA, 2000. Evaluation of Potential Health Effects of Eating Fish from Black Butte Reservoir (Glenn and Tehama Counties): Guidelines for Sport Fish Consumption. Draft Report., Pesticide and Environmental Toxicology Section, Office of Environmental Health Hazard Assessment, California Environmental Protection Agency. March, 2000.
OEHHA, 2001. Chemicals in Fish: Consumption of fish and Shellfish in California and the United States. Final Report. Oakland, CA, Pesticide and Environmental Toxicology Section. Office of Environmental Health Hazard Assessment. California Environmental Protection Agency.
Paquette, K and G. Heltz, 1995. Solubility of Cinnabar (Red Hgs) and implications for mercury speciation in sulfidic waters. Water, Air and Soil Pollution. 80: 1053-1056.
Parks JW, Hamilton AL, 1987. Accelerating recovery of the mercury-contaminated Wabigoon/English River system. Hydrobiologia 149:159-188.
Ravichandran M, Aiken G, Reddy M, Ryan J, 1998. Enhanced dissolution of cinnabar (mercuric sulfide) by dissolved organic matter isolated from the Florida Everglades. 32.
Regnell, O. and G. Ewald. 1997. Factors controlling temporal variation in methyl mercury levels in sediment and water in a seasonally stratified lake. Limnology and Oceanography. 42(3): 1784-1795.
Regnell O, Hammar T, Helgee A, Trodesson B, 2001. Effects of anoxia and sulfide on concentrations of total and methylmercury in sediment and water in two mercury polluted lakes. Can. J. Fish. Aquat. Sci 58:506-517.
Regnell O, Tunlid A, Ewald G, Sangfors O, 1996. Methyl mercury production in freshwater microcosms affected by dissolved oxygen levels: role of cobalmin and microbial community composition. Canadian Journal Fisheries and Aquatic Science 53:1535-45.
Reuter JE, Slotton DG, Ayers SM, Goldman CR, 1996. Evaluation of McLaughlin Gold Mine Project in Yolo County as Related to Surface Waters in the Davis Creek Watershed. July 1, 1995 –June 30, 1996., University of California, Davis. Report prepared for Yolo County.
Rudd JWM, Turner MA, Furutani A, Swick AL, Townsend BE, 1983. The English-Wabigoon river system: I. A synthesis of recent research with a view towards mercury amelioration. Can. J. Fish. Aquat. Sci 40:2206-2217.
Rytuba, JJ, 2000. Mercury mine drainage and processes that control its environmental impact. Science of the Total Environment 260:57-71.
Schober S, Sinks T, Jones R, Bolger PM, McDowell M, Osterloh J, Garrett ES, Canady R, Dillon C, Sun Y, Joseph C, Mahaffey KR, 2003. Blood mercury levels in US children and women of childbearing age, 1999-2000. J. American Medical. Assn. 289:1667-1674.
Schwarzbach S, Thompson L, Adelsbach T, 2001. An Investigation of Mercury Bioaccumulation in the Upper Cache Creek Watershed, 1997-1998. USFWS Final Report., U.S. Fish and Wildlife Service, Environmental Contaminants Division, Sacramento Fish and Wildlife Office. Off Refuge Investigations Report FFS #1130 1F22. DEC ID #199710005. July.
Sellers C, Kelly CA, 2001. Fluxes of methylmercury to the water column of a drainage lake: The relative importance of internal and external sources. Limnology and Oceanography 46:623-631.
Sellers C, Kelly CA, Rudd JWM, al. e, 1996. Photodegradation of methylmercury in lakes. Nature 380:694-697.
SFEI, 2001a. San Francisco Bay Seafood Consumption Study, Final Report. Richmond, CA, San Francisco Estuary Institute. January.
SFEI, 2001b. San Francisco Bay Atmospheric Deposition Pilot Study Part 1: Mercury. Prepared by the San Francisco Estuary Institute for the San Francisco Estuary Regional Monitoring Program, Oakland, CA. August.
Slotton DG, Ayers SM, 2001. Cache Creek Nature Preserve Mercury Monitoring Program: Second Semi-Annual Data Report (Spring-Summer 2001)., Prepared for Yolo County, CA. 20 November.

118
Slotton DG, Ayers SM, Reuter JE, 1996. Marsh Creek Watershed 1995 Mercury Assessment Project, Final Report., University of California, Davis. Prepared for Contra Costa County. March.
Slotton DG, Ayers SM, Reuter JE, Goldman CR, 1997. Cache Creek Watershed Preliminary Mercury Assessment, Using Benthic Macro-Invertebrates. Final Report., University of California, Davis, Division of Environmental Sciences. June.
Slotton DG, Ayers SM, Suchanek TH, Weyland RD, Liston AM, 2004a. Mercury Bioaccumulation and Trophic Transfer in the Cache Creek Watershed, California, in Relation to Diverse Aqueous Mercury Exposure Conditions. Subtask 5B. Final Report., University of California, Davis, Dept. of Env. Science and Policy and Dept. Wildlife, Fish and Conservation Biology. Prepared for the CALFED Bay-Delta Program, Directed Action #99-B06. Available at: http://loer.tamug.tamu.edu/calfed/FinalReports.htm. August.
Slotton DG, Ayers SM, Suchanek TH, Weyland RD, Liston AM, Asher C, Nelson DC, Johnson B, 2004b. The Effects of Wetland Restoration on the Production and Bioaccumulation of Methylmercury in the Sacramento-San Joaquin Delta, California. Final Report., University of California, Davis, Dept. of Env. Science and Policy, Dept. Wildlife, Fish and Conservation Biology and Division of Microbiology; and US Fish and Wildlife Service. Prepared for the CALFED Bay-Delta Program, Directed Action #99-B06. Available at: http://loer.tamug.tamu.edu/calfed/FinalReports.htm. September.
Slotton DG, Reuter JE, Goldman CR, 1995. Mercury uptake patterns of biota in a seasonally anoxic northern California reservoir. Water, Air, and Soil Pollution 80:841-850.
Sorenson SK, Elliott AL, 1981. Water Quality Assessment of Cache Creek, Yolo, Lake, and Colusa Counties, California. U.S. Geological Survey Water Resources Investigations Open-File Report 81-677., U.S. Geological Survey Water Resources Investigations Open-File Report 81-677.
Southworth GR, Turner RR, Peterson MJ, Bogle MA, Ryon MG, 2000. Response of mercury contamination in fish to decreased aqueous concentrations and loading of inorganic mercury in a small stream. Environmental Monitoring and Assessment 63:481-494.
St. Louis VL, Rudd JWM, Kelly CA, al. e, 1996. Production and loss of methylmercury and loss of total mercury from boreal forest catchments containing different types of wetlands. Env. Sci. Technol. 30:2719-2749.
Suchanek TH, Richerson PJ, Mullen LH, Brister LL, Becker JC, Maxson AE, Slotton DG, 1997. The Role of the Sulphur Bank Mercury Mine Site in the Dynamics of Mercury Transport and Bioaccumulation within the Clear Lake Aquatic Ecosystem. Interim Final Report., Prepared for the USEPA Region 9 Superfund Program.
Suchanek TH, Slotton DG, Nelson DC, Ayers SM, Asher C, Weyland RD, Liston AM, Eagles-Smith C, 2004. Mercury Loading and Source Bioavailability from the Upper Cache Creek Mining District. Subtask 5A. Final Report., US Fish and Wildlife Service, Division of Environmental Contaminants and UC Davis, Departments of Environmental Science and Policy and Microbiology. Prepared for the CALFED Bay-Delta Program, Directed Action #99-B06. Available at: http://loer.tamug.tamu.edu/calfed/FinalReports.htm. September.
SWRCB, 2002. State Water Resources Control Board Toxic Substances Monitoring Program,: Freshwater Bioaccumulation Monitoring Program: Data Base (Metals_Wet)., State Water Resources Control Board, Division of Water Quality, electronic database available at: http://www.swrcb.ca.gov/programs/swm/index.html
SWRCB, 1999. Consolidated Toxic Hot Spots Cleanup Plans, New Series No. 6 and 8, April and June., State Water Resources Control Board, Division of Water Quality, Sacramento, CA.
Takizawa, Y. 2000. Minamata disease in retrospect. World Resource Review 12(2): 211-223. Taylor, S.R. 1964. Abundance of chemical elements in the continental crust: a new table. GeoChimica
Cosmochin. Acta. 1273-1285. Tetra Tech, 2004. Engineering Evaluation and Cost Analysis for the Sulphur Creek Mining District,
Colusa and Lake Counties, California. Subtask 5C2 Draft Report., Prepared for the CALFED Bay-

119
Delta Program, Directed Action #99-B06. Available at: http://loer.tamug.tamu.edu/calfed/DraftReports.htm. August.
Turner RR, Southworth GR, 1999. Mercury-contaminated industrial and mining sites in North America: an overview with selected case studies. In: Mercury Contaminated Sites (Ebinghaus R, Turner RR, de Lacerda LD, Vasiliev O, Salomons W, eds). Berlin: Springer-Verlag; 89-108.
USBLM, 2002. Cache Creek Coordinated Resource Management Plan/Environmental Assessment. Draft for Public Review., United States Department of the Interior, Bureau of Land Management, Ukiah Field Office. September.
USEPA, 1993b. Wildlife Exposure Factors Handbook. Washington, DC, US Environmental Protection Agency Office of Science and Technology. EPA/600/R-93/187a.
USEPA, 1995a. Great Lakes Water Quality Initiative Technical Support Document for Wildlife Criteria. Washington. DC., Environmental Protection Agency. Office of Water. EPA/820/B-95/009, 9-36. March.
USEPA, 1995c. Guidance for Assessing Chemical Contaminant Data for Use in Fish Advisories. Volume 1 Fish Sampling and Analysis. Second Edition. Washington DC, US Environmental Protection Agency, Office of Water, Office of Science and Technology. EPA-823-R-95-007.
USEPA, 1997a. Mercury Study Report to Congress Vol. 3: Fate and Transport of Mercury in the Environment., Office of Air Quality Planning & Standards and Office of Research & Development, U.S. Environmental Protection Agency. EPA-452/R-97-005.
USEPA, 1997b. Mercury Study Report to Congress Vol. 4: An Assessment of Exposure to Mercury in the United States., Office of Air Quality Planning & Standards and Office of Research & Development, U.S. Environmental Protection Agency. EPA-452/R-97-006. EPA-452/R-97-006.
USEPA, 1997c. Mercury Study Report to Congress Vol. 6: An Ecological Assessment for Anthropogenic Mercury Emissions in the United States., Office of Air Quality Planning & Standards and Office of Research & Development, U.S. Environmental Protection Agency. EPA-452/R-97-008.
USEPA, 1997d. Mercury Study Report to Congress Vol. 7: Characterization of Human Health and Wildlife Risks from Mercury Exposure in the United States., Office of Air Quality Planning & Standards and Office of Research & Development, U.S. Environmental Protection Agency. EPA-452/R-97-009.
USEPA, 1997g. Mercury Study Report to Congress Vol. 1: Executive Summary., Office of Air Quality Planning & Standards and Office of Research & Development, U.S. Environmental Protection Agency. EPA-452/R-97-003.
USEPA, 1997h. Mercury Study Report to Congress Vol. 2: An Inventory of Anthropogenic Mercury Emissions in the United States., Office of Air Quality Planning & Standards and Office of Research & Development, U. S. Environmental Protection Agency. EPA-452/R-97-004.
USEPA, 1999a. Mercury Update: Impact on Fish Advisories Fact Sheet., United States Environmental Protection Agency, Office of Water. EPA-823-F-99-016. Sept. 1999.
USEPA, 1999b. Integrated Risk Information System (IRIS). Cincinnati, US Environmental Protection Agency, Office of Health and Environmental Assessment; Environmental Criteria and Assessment Office. Available from: http://www.epa.gov/ngispgm3/iris/index.html. 1994 (cited 1999 Aug. 23).
USEPA, 1999c. National Recommended Water Quality Criteria – Correction., U.S. Environmental Protection Agency, Office of Water (USEPA), Washington, D.C. EPA 822-Z-99-001. Available: http://www.epa.gov/ost/pc/revcom.pdf. April.
USEPA, 2000a. US Environmental Protection Agency, Federal Register, Vol. 65, No. 97 (Thurs. 18 May, 2000). Water Quality Standards; Establishment of Numeric Criteria for Priority Toxic Pollutants for the State of California; Rule., 31682-31719.
USEPA, 2000b. Methodology for Deriving Ambient Water Quality Criteria for the Protection of Human Health (2000)., United States Environmental Protection Agency, Office of Water, Office of Science and Technology. EPA-822-B-00-004. October.

120
USEPA, 2001. Water Quality Criterion for the Protection of Human Health: Methylmercury. Final Document. Washington, DC, US Environmental Protection Agency, Office of Science and Technology, Office of Water. EPA-823-F-01-001. January.
USFDA, 1984. Shellfish Sanitation Interpretation: Action Levels for Chemical and Poisonous Substances., US Food and Drug Administration.
USFWS, 2002. Comments on the Clear Lake Total Maximum Daily Load (TMDL) for Mercury - Draft Final Report. Letter from Michael B. Hoover, Acting Assistant Field Supervisor, US Fish and Wildlife Service, to Janis Cooke, Environmental Scientist, Central Valley Regional Water Quality Control Board (FWS/EC-02-026). 8 April.
USFWS, 2003. Evaluation of the Clean Water Act Section 304(a) Human Health Criterion for Methylmercury: Protectiveness for Threatened and Endangered Wildlife in California. U.S. Fish and Wildlife Service, Sacramento Fish and Wildlife Office, Environmental Contaminants Division. October.
USFWS, 2004. Evaluation of Numeric Wildlife Targets for Methylmercury in the Development of Total Maximum Daily Loads for the Cache Creek and Sacramento-San Joaquin Delta Watersheds. U.S. Fish and Wildlife Service, Sacramento Fish and Wildlife Office, Environmental Contaminants Division. March.
USGS, 1958-1992. Lower Lake (1993), Wilson Valley (1958), Glastock Mountain (1958), Rumsey (1959), Guinda (1959), Brooks (1959), Esparto (1959), Madison (1992), Woodland (1981), and Grays Bend (1975). United States Geological Survey California 7.5’ Topographic Quadrangles, as presented by TopoZone.com (© 2000 Maps a la carte, Inc.). Available: http://www.topozone.com/default.asp. Accessed: March 7, 2001.
USGS, 2001. USGS Surface-Water Data for California. Harley Gulch streamflow data, station 11451540. United States Geological Survey. Available: http://water.usgs.gov/ca/nwis/sw.
Verdon R, Brouard D, Lalumiere C, others, 1991. Mercury evolution (1978-1988) in fishes of the La Grande hydroelectric complex, Quebec, Canada. Water, Air, and Soil Pollution 56:405-417.
Wallschlager D, Desai M, Spengler M, Wilken R, 1998. Mercury speciation in floodplain soils and sediments along a contaminated river transect. J. Environmental Quality 27:1034-1044.
Wiener JG, Krabbenhoft DP, Heinz GH, al. e, 2003. Ecotoxicology of mercury. In: Handbook of Ecotoxicology (Hoffman D, Rattner B, Burton G, Cairns J, eds). Washington, D. C.: Lewis Publishers.
Wolfe MF, Schwarzbach S, Sulaiman RA, 1998. Effects of mercury on wildlife: A comprehensive review. Environmental Toxicology and Chemistry 17:146-60.
Wyels W, 1987. Regional Mercury Assessment., California Regional Water Quality Control Board, Central Valley Region. Sacramento, CA. Staff report. March.
YCFCWCD, 2002a. Personal communication from Christine Barton, Yolo County Flood Control and Water Conservation District, to Stacy Stanish, Central Valley Regional Water Quality Control Board, regarding the estimated amount of water drawn from Cache Creek for agricultural purposes. 14 March.
YCFCWCD, 2002b. Yolo County Flood Control and Water Conservation District Website, Accessed December 2002. Available: http://www.ycfcwcd.org.