by daniel l. edelstein
TRANSCRIPT

Copper—2004 21.1
Copper
ByDanielL.edelstein
Domestic survey data and tables were prepared by Hema Edupuganti, Michael V. Leahy, and Wanda G. Wooten, statistical assistants, and the world production tables were prepared by Regina R. Coleman and Glenn J. Wallace, international data coordinators.
In2004,mineproductionofrecoverablecopperintheUnitedStatesrosebyabout40,000metrictons(t)(4%)to1.16millionmetrictons(Mt),thehighestlevelsince2001.Aglobalshortfallinproductionthatbeganin2003andgainedmomentumin2004,ledtoasharpdeclineinglobalrefinedcopperinventoriesandariseincopperprices.Higherpricesandprojectionsofasustainedshortfallinproductionencouragedtherestartofidlecapacityatseveraloperatingminesinthelatterpartoftheyearandrestart,undernewownership,ofamineidledsince1999.
Downstreamsmelterandrefineryproductionwereessentiallyunchangedfromthatof2003,inpartowingtoincreasedexportsofconcentratesandanodecopper.electrowonproductionfromtheleachingofcopperores,whichdeclinedbyabout7,000t,accountedfor50%ofmineoutputand47%ofprimaryrefinedcopperproduction.reporteddomesticconsumptionofrefinedcopperin2004rosebyabout5%to2.41Mtandwasatitshighestlevelsince2001.Chinawastheworld’sleadingconsumerofrefinedcopperwithanestimated20%marketshare.
Globalmineproductionofcopper,whichhadbeenessentiallystagnantduringthepreceding2years,rosebyabout6%toarecord-high14.6Mtin2004.TheUnitedStatesaccountedforabout8%ofworldproductionandretaineditspositionastheworld’ssecondleadingmineproducer.Chile,wheremineproductionrosebyabout10%toarecord-high5.4Mt,remainedtheleadingmineproducerandaccountedformorethan37%oftotalworldproduction.Globalsmelterandrefineryproductionrosebyonlyabout3%and4%,respectively.TheUnitedStatesfelltosixthplacebehindpolandinworldsmelterproductionandremainedfourthinrefineryoutputbehindChile,China,andJapan.
U.S.GeologicalSurveyestimatesindicatedworldcopperreservesof470Mtandacopperreservebaseof940Mt.TheUnitedStateshadabout7%eachoftheworld’scopperreservesandreservebase.
TheprincipalminingStates,indescendingorderofproduction,Arizona,Utah,NewMexico,andMontana,accountedfor99%ofdomesticproduction;copperwasalsorecoveredatminesinIdaho,Missouri,andNevada.Althoughcopperwasrecoveredat22minesthatoperatedintheUnitedStates,just14minesaccountedformorethan99%ofproduction.Theremaining8mineswereeithersmallleachoperationsorbyproductproducersofcopper.
Duringtheyear,3primarysmelters,4electrolyticand3firerefineries,and12solventextraction-electrowinning(SX-eW)facilitiesoperatedintheUnitedStates.Thethreefirerefineriesprocessedscraptorecoverunalloyedcopperproducts;oneoftherefineriesoperatedonlyduringthefourthquarter.Scrapwasalsoconsumedinrelativelysmallquantitiesatseveraloftheprimarysmelters.
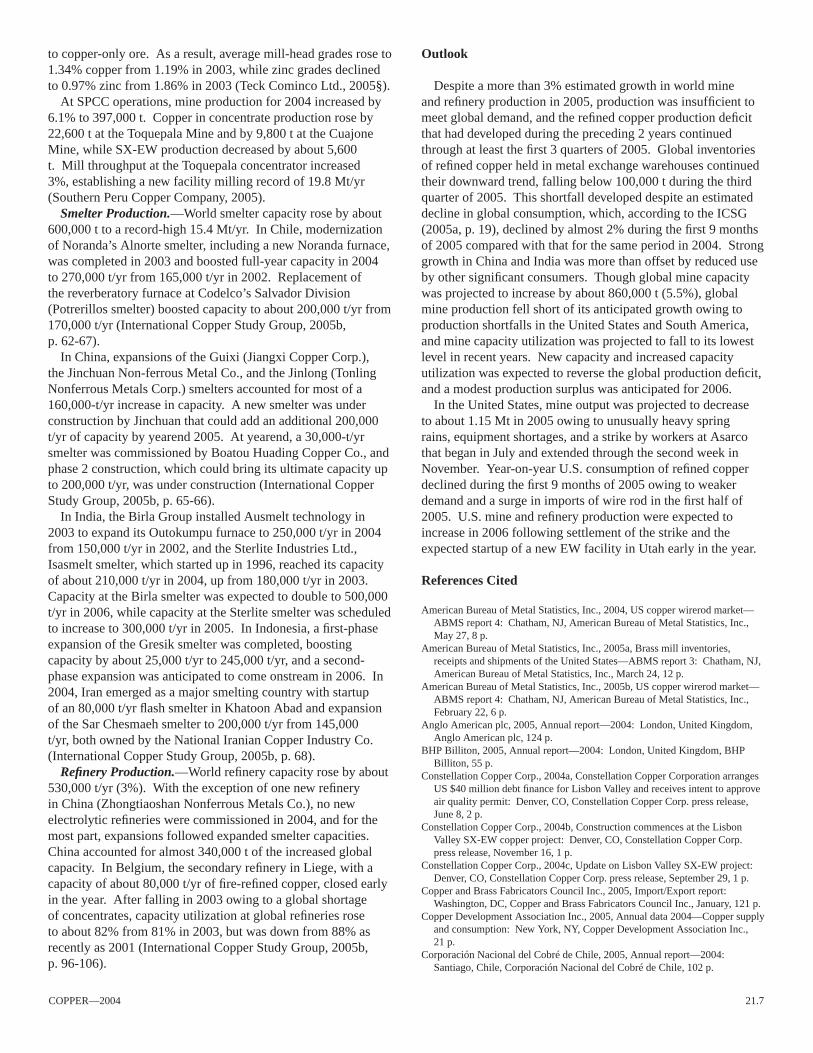
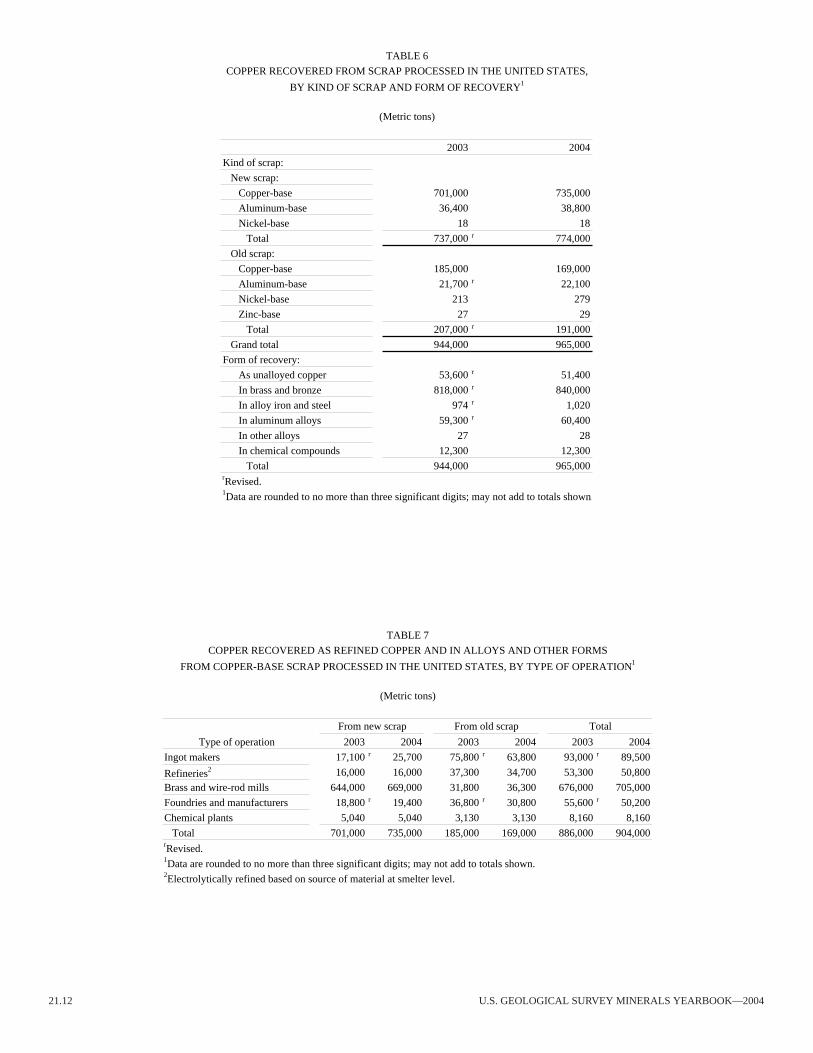
U.S.smelterandrefinerycapacityremainedessentiallyunchangedatabout900,000t,and2.25Mt,respectively,andcapacityutilizationratesremainedunchangedat60%and58%,respectively.In2004,copperrecoveredfromrefinedorremeltedscrap(about80%fromnewscrapand20%fromoldscrap)composed29%ofthetotalU.S.coppersupply.Theconversionofoldscraptoalloysandrefinedcopperdeclinedbyabout8%to191,000tofrecoverablecopperandwasataboutthesamelevelasin2003.Copperrecoveredfromnewscrap(774,000t)rosebyabout5%,andtoalargeextentwasareflectionofincreasedmanufacturinglevels.
Copperwasconsumedasrefinedcopperandasdirect-meltscrapatabout30brassmills,13wire-rodmills,and500chemicalplants,foundries,andmiscellaneousoperations.owingtosustainedlow-capacityutilizationatU.S.refineries,thenetimportrelianceforrefinedcopperasapercentageofapparentconsumptionincreasedforthethirdconsecutiveyeartoarecord-high43%.Chile,Canada,andperu,indescendingorder,accountedfor92%ofthe807,000tofrefinedcopperimportedforconsumption.Inadditiontoimports,domesticinventories,whichdeclinedby522,000t,providedsignificantsuppliestothedomesticindustry.
Legislation and Government Programs
In2003,theU.S.environmentalprotectionAgency(epA),aspartofitsreviewofexistingdrinkingwaterstandardsfor69substances(includingleadandcopper)forwhichNationalprimaryDrinkingWaterregulations(NpDWrs)wereestablishedpriorto1997,affirmeditsconclusionthattheestablishedmaximumcontaminantlevelgoal(MCLG)forcopperof1.3milligramsperlitershouldberetainedpendingcollectionofadditionaldataonhealthrisks.TheepAfurtherconcludedthatutilitieshadsufficientflexibilityundertheexistingleadcopperrule(LCr)toadoptnewcontrolstrategies.TheepArecognized,however,thattheexistingLCrmaylimittheabilitytoadoptneworemergingtechnologiesandstatedthatitwouldcontinuetomonitornewdevelopmentsandmayconsiderrevisionsattheendofthenext6-yearreviewcycle(U.S.environmentalprotectionAgency,2003).In2004,theepAheldaseriesofworkshopstodiscussissuesassociatedwithcompanyimplementationoftheLCr,includingworkshopsonLCrMonitoringprotocols,simultaneouscompliancewiththeLCrandNpDWrs,andpubliceducationrequirements(U.S.environmentalprotectionAgency,2004a,b).
onApril7,theBureauofIndustryandSecurity(BIS),U.S.DepartmentofCommerce,receivedajointpetitionfromtheCopperandBrassFabricatorsCouncil,Inc.andtheNonferrousFounders’Societythatrequestedtheimposition
21.2 U.S.GeoLoGICALSUrveyMINerALSyeArBook—2004
ofexportmonitoringandexportcontrolsoncopperscrapandcopper-alloyscrapandthatrequestedapublichearingontheissue.ThepetitionwasfiledunderprovisionsoftheexportAdministrationActof1979,asamended,thatallowedforanindustry,orasegmentthereof,thatprocessesmetallicmaterialscapableofbeingrecycledtofilesuchapetition(U.S.DepartmentofCommerce,2004).Intheirpetition,thecopperandbrassindustrycontendedthattherapidriseofscrapexportstoChinahadcreatedashortsupplyofscrapmaterialsfordomesticconsumersandhadcontributedtohigherpricesforavailablesupplies.Thepetitionersarguedthatnotallsectorsoftheirindustrywereabletosubstitutecoppercathodeforscrapasafeedmaterial,andwherepossible,suchsubstitutionimposedeconomicpenaltyowingtothehighercostofcathode.Thepetitionersfurtherclaimedthathigherrawmaterialcostscouldnotbepassedthroughtoconsumers,andthatscarcitylimitedtheirproductionandharmedtheircompetitiveposition.Accordingtothepetition,totalscrapexportsfrom1999to2003roseby138%,andexportstoChina,whichroseby515%duringthesameperiod,accountedforessentiallyalloftheincrease.Thepetitionersrequestedthatexportquotasforcopperandcopper-alloyscrapbesetatthemeanvolumeofexportsfortheperiod1996-2000,380,000t,whichwasabout50%ofthe2003level(U.S.DepartmentofCommerce,2004b§1).
InJuly,BISissueditsrulingonthepetitioninwhichitdeterminedthattheshortsupplycriteriahadnotbeenmet,andthatneithermonitoringnorcontrolswerewarranted.Initsdetermination,Commerceconcludedthat:
• Thoughthevolumeofexportsofcopper-basescrapincreasedsignificantlyduringthestudyperiod,theincreasewassomewhatlesssignificantwhenconsideredinrelationtodomesticdemandandtheerosionofthesecondarysmeltingindustry.
• Copperscrappricesdidincreasesignificantly,buttheworldmarketforcoppercathode,notthelevelofU.S.exportsofcopper-basescrap,wasthemostimportantdeterminantinthefluctuationsofdomesticscrapprices.
• Theevidencedidnotdemonstratetheexistenceofascrapshortage,nordiditdemonstrateasignificantadverseeffectonthenationaleconomyorsectorthereof.TheCommerceDepartmentindicated,however,thatitwouldworktorefinescheduleBclassificationsforcopper-basescrapexportsinordertobetterdelineatethevarietiesofscrapbeingexported;reviewthenewscrapexportdatainthecomingyear;andworkcloselywiththeofficeoftheUnitedStatesTraderepresentativetoaddressanyforeigngovernmentpracticesthatmaybedistortingtradeincopper-basescrap(U.S.DepartmentofCommerce,2004a§).NewscheduleBclassificationsweresubsequentlyimplementedfor2005.
Production
In2004,inresponsetoaprojectedsustainedshiftintheglobalsupplybalance(fromoneofoversupplyofrefinedcoppertoaproductiondeficit)andtheprecipitousriseincopperprices
1References that include a section mark (§) are found in the Internet References Cited section.
atyearend2003,the7-yeardownwardtrendindomesticmineproductionwasreversed,andmineproductionrosebyabout4%.AttheendofJanuary,inresponseto“highercopperpricesandindicationsthattheimprovedmarketforcopperissustainable,”phelpsDodgeCorp.announcedplansforincreasingproductionatseveralNorthandSouthAmericanoperations.phelpsDodgechosespecificoperationsforincreaseinparttomaintainabalancebetweenitsmininganditsdownstreamprocessingfacilities(phelpsDodgeCorp.,2004).
Smelterandrefineryproductionwereessentiallyunchangedin2004.Threeprimarysmeltersandfourprimaryelectrolyticrefineriesoperatedduring2004.TheChinosmelterinNewMexicoandtheMiamielectrolyticrefineryinArizonathatclosedin2002wereretainedoncare-and-maintenancestatus.Duringthefourthquarter,thesecondarysmeltingandrefiningindustry,whichhadenduredacontinualdeclineinrecentyears,receivedaboostwhenAmericanIron&MetalCo.Inc.(Montreal,Quebec,Canada)restarteditsWarrenton,Mo,firerefinery,theonlyremainingnonintegratedsecondarycopperrefineryintheUnitedStates.AmericanIron&MetalacquiredWarrentonfromphilipServicesCorp.,ofHouston,TX,in2000andoperatedtherefineryintermittentlyuntilyearend2002.operatingasthenewlyformedWarrentonCopperLLC,theplanthopedtofilladomesticnicheasa“stableconsumercapableofconsuminglargeamountsofNo.2copper(scrap).”Thefacilityincludedwire-choppinglines,andplanscalledforaddingapreshredderandgranulator(McCann,2004§).
Company Reviews.—ASArCoIncorporated[ownedbyGrupoMéxico,S.A.deC.v.throughitssubsidiary,AmericasMiningCorp.(AMC)]begananacceleratedwasterockremovalprograminAprilatitsMissionandrayMinesinArizona.Asaresult,wasteremovalin2004increasedbyabout65%comparedwiththatin2003.AccordingtoAsarco,theprogrambegantobearfruitinthethirdquarter,withtotalcompanyproductionrisingto36,200t,anincreaseof30.2%comparedwithproductionduringthesecondquarter.GrupoMéxicoprojectedasignificantmineturnaroundbymid-2005thatcouldboostAsarco’stotalmineproductioncapacityto220,000metrictonsperyear(t/yr)ofcopper.productionfromU.S.operationsinArizonatotaled141,000t;theMissionMineproduced22,200tofcopperinconcentrate;therayMineproduced65,600tinconcentrateand34,000tofelectrowoncopper;andtheSilverBellMineproduced19,500tofelectrowoncopper.Asarcoexpectedthatareturntoapositivenetincomein2005wouldallowforinvestmentinprocessimprovementsandenvironmentalremediation(GrupoMéxico,S.A.deC.v.,2005,p.11-15;plattsMetalsWeek,2005).
CopperproductionfromBHpBilliton’sresidualArizonaleachoperationsatMiamiandpintovalleytotaled9,500tin2004,downfrom10,200tin2003(BHpBilliton,2005,p.10).BasedonanagreementsignedwithBHpin2001,rioTintoplcearneda55%controllinginterestintheresolutionCopperCompanybyinvesting$25millionindrilling,exploration,andremediation(BHpretaineda45%interest).resolutionwasformedbyrioTintotoevaluatealargecoppersulfidedepositlocatedabout2,000meters(m)belowthesurfacebeneathBHp’sshutteredMagmaMineinthepioneerminingdistricteastofSuperior,AZ.Bymidyear,drillinghadachievedat

Copper—2004 21.3
least5interceptswiththeorebody,oneofwhichwasreportedtoextendforabout300mandgrading1.9%copper.Ifminedevelopmentwastoproceed,thenrioTintodidnotanticipateproductionpriorto2014(Dillard,2004).
ConstellationCopperCorp.announcedinJunethatitsboardofdirectorshadapproveda$40milliondebtfinancingpackagefortheconstructionoftheLisbonvalleyopenpitandheap-leachSX-eWprojectinUtah(ConstellationCopperCorp.,2004a).InSeptember,ConstellationreportedthatdismantlingofthecrushingandSX-eWprocessingfacilitiesthatitpurchasedfromequitorialTonopahInc.’sclosedTonapah,Nv,minewascomplete,andthattheplantequipmenthadbeenrelocatedtotheLisbonvalleysite.InNovember,ConstellationannouncedthatithadbegunreconstructionofthecrushingandSX-eWprocessingfacilities.TheLisbonvalleyprojectwasdesignedtoproduce24,500t/yrofcoppercathodeataprojectedaveragecashoperatingcostof$0.47perpound(excludingminingfleetcosts).Theprojectedtotalcostof$0.72perpoundincludedalllife-of-minecapital,reclamation,andclosurecosts(ConstellationCopperCorp.,2004b,c).
InNevada,GoldSpring,Inc.reportedearlyintheyearthatitwasproceedingwithitsBigMikeproject,nearWinnamucca.Theprojectcalledforusingthecompany’seco-vatleachingsystemtoprocessabout1.1Mtofstockpiledoreduringa5-to6-yearperiodtorecoverabout11,300tofelectrowoncopper(GoldSpring,Inc.,2004§).Byyearend,however,nofurtherdevelopmenthadbeenannounced.
NordresourcesCorp.announcedthatithadissuedtender/contractdocumentstofourminingcontractorsforminingatthecompany’sJohnsonCampMinelocatedinSouthernArizona.operationsatJohnsonCampwouldinvolveremovalof4,500metrictonsperday(t/d)ofoverburdenandminingabout8,000t/doforetoproduceanominal9,000t/yrofelectrowoncathode.Actualproductionofcoppercathodewasanticipatedtobeginwithin3monthsofarestart(NordresourcesCorp.,2004).
In2004,phelpsDodgereportedcopperproductionof1.20Mt,whichincludedminorityparticipants’shareof204,000t,fromitsworldwideoperations,comparedwith1.18Mtand223,000t,respectively,in2003.U.S.productionin2004was683,000tofcopper(515,000telectrowonand168,000tinconcentrate),anincreaseof31,000tfromthatproducedin2003(phelpsDodgeCorp.,2005,p.8).
productionof381,000tofelectrowoncopperattheMorenciMinecomplexinArizonawasessentiallyunchangedfromthatofthepreviousyear.Thecomplexcomprisedanopenpit,aconcentrator,foursolventextraction(SX)facilities,andthreeelectrowinningtankhouses.WhiletheMorenciconcentratorremainedoncareandmaintenance,theMetcalfcrushingfacilityprocessedabout77,000t/dofore(phelpsDodgeCorp.,2005,p.8).
productionattheBagdadMineinArizonarosenominallyto99,900tofcopper(74,500tinnetconcentrateproductionand25,400telectrowon).ThoughphelpsDodgebeganincreasingmillthroughputandreportedthemilloperatingatfullcapacitybytheendofthesecondquarter,netproductionofcopperinconcentratewasessentiallyunchangedowingtolowermillheadgrade(0.41%copperdownfrom0.43%in2003)andtheprocessingof52,600tofconcentratethroughademonstrationleachplant(commissionedin2003)toproduce15,800tof
electrowoncathode.In2003,thedemonstrationleachplantprocessed40,000tofconcentrateandproduced11,000tofelectrowoncopper.In2002,priortostartingtheconcentrateleachplant,conventionalleachproductionwasonly14,000tfromresidualleachingoforepiles.Between1999,theyearphelpsDodgeacquiredtheproperty,andyearend2003,lessthan1Mtofleachorehadbeenaddedtothestockpiles.In2004,morethan21Mtoforegradinganaverage0.9%copperwasaddedtotheleachstockpile(phelpsDodgeCorp.,2005,p.3-8).
AttheSierritaMineinArizona,copperinconcentrateproductionroseto66,700tfrom60,100tin2003followingrampuptofullcapacityduringthefourthquarter.electrowonproductionplummetedto3,600tfrom8,400tduring2003,astheplantwasshutteredformostoftheyear.Thoughitwasrenewedduringtheyear,productionhadbeeninterruptedbyexpirationofalandleaseforthepropertyuponwhichtheelectrowinning(eW)tankhousewaslocated.phelpsDodgealsocompletedconstructionofan18,000t/yrcoppersulfateplantatSierritatosupplementcapacityatitsplantinelpaso,TX(phelpsDodgeCorp.,2005,p.3-8).
AttheChinoMineinNewMexico,miningandmillingofsulfideore,whichhadbeencurtailedsinceMarch2001,resumedduringthesecondquarteroftheyear,andbytheendofthethirdquarterthemillreportedlywasoperatingatabout80%capacity.Copperinconcentrateproductionwas27,000tfortheyear,aboutone-thirdofthelevelin2000.productionofleachore,whichhadbeennegligiblein2002,resumedduringSeptember2003,androsetothepre-curtailmentlevelof28millionmetrictonsperyear(Mt/yr)during2004.electrowonproductionin2004roseto56,000t,thehighestlevelsince1998,from36,000tin2003(phelpsDodgeCorp.,2005,p.10).TheCobreMineinNewMexicoproducednocopperin2004despitetheannouncedintentiontoreopentheminethathadbeenshutteredsince1999,thoughlimitedminerehabilitationactivitiestookplace.AttheTyroneMine,alsoinNewMexico,productionofelectrowoncopperdecreasedto39,000tfrom52,000tin2003followingpartialcurtailmentofproductioninSeptember2003.In2004,16.5Mtoforewasplacedinleachstockpiles,mostofwhichwaspreviouslyminedmaterialthathadbeenconsideredwastematerial(phelpsDodgeCorp.,2005,p.3-10).
AtMiami,AZ,phelpsDodges’selectrolyticrefineryremainedshuttered,whileelectrowonproductiondecreasedto8,900tofcopperfrom16,100tin2003.Miningofleachmaterial,whichlasttookplacein2001,remainedsuspended.Smelterproductionroseto195,000tofanodefrom182,000tin2003,andthefacilitywasreportedlyoperatingatfullcapacityduringthefourthquarter.productionofrefinedcopperatitselpaso,TX,refineryroseto280,000t,yetremainedwellbelowcapacityofabout400,000t(phelpsDodgeCorp.,2005,p.3-10).
QuadraMiningLtd.(vancouver,BritishColumbia,Canada)announcedthattheconcentratoratitsrobinsonMinenearely,Nv,hadbegunprocessingoreonSeptember1,andbytheendofthefirstweekinSeptemberitwasoperatingatabout60%ofitsdesigncapacityof38,000t/dofore.Themineoperatingcompany,robinsonNevadaMiningCompany(awhollyownedsubsidiaryofQuadra),contractedwithWashingtonGroupInternationaltomineapproximately67Mt/yroforeandwaste

21.4 U.S.GeoLoGICALSUrveyMINerALSyeArBook—2004
atrobinsonduringa5-yearperiod.oreandwasteremovalwasexpectedtorampupfrom80,000t/dto200,000t/dbyJanuary2005.QuadrapurchasedrobinsonfromBHpinApril2004for$18million(QuadraMiningLtd.,2004b).BHp,whichbuiltanewmilltoprocessorefrompitsfirstdevelopedbywhatisnowkennecottUtahCopperCorp.,operatedtherobinsonMinefrom1996-99.UpdatedreserveestimatesandmineplanspublishedbyQuadrainAugust2004indicatedcopperreservesatitsfourpitsof133Mtoforegrading0.69%copperand0.285gramspermetrictonofgoldandcontaining747,000tofrecoverablecopperand18,700kilogramsofrecoverablegoldatrecoveryratesof82%and49.3%,respectively.Theoverallminelifewasprojectedtobe10yearsatanaverageproductionrateof75,000t/yrofcopperand1,170kilogramsperyearofgold,andhaveanaveragelife-of-the-minecashcostof$0.80perpoundofcopper.Concentrateswereexpectedtobesoldoffshore(QuadraMiningLtd.,2004a).
AtrioTinto’sBinghamCanyonMineinUtah,productionofcopperinconcentratedecreasedto264,000tfrom282,000tin2003owingtolowermillthroughputandloweraveragemill-headgrades(0.63%copper).Despitea2-weeksmeltershutdownformaintenanceduringthefourthquarter,productionofrefinedcopperroseto247,000tfrom231,000tin2003,yetremainedwellbelowcapacityofabout300,000t/yr.earlyin2005,parentcompanyrioTintoapprovedtheeast1pushbackproject,budgetedtocost$170million,toenlargetheBinghamCanyonopenpitandextendthelifeofthepituntil2017.previousplanshadcalledforexhaustionofopenpitreservesanddevelopmentofanundergroundmineby2013(rioTintoplc,2005a,p.17;2005b,p.48).
Inoctober,SouthernperuCopperCorp.(SpCC)announcedthatithadexecutedamergeragreementwithAMC,thenetresultofwhichwasthatGrupoMéxico,throughAMC,wouldincreaseitsownershipinSpCCtoroughly75.1%.previously,AMCowned54.2%ofSpCCwiththebalanceheldbyCerroTradingCompany(14.2%),phelpsDodgeCorp.(14.0%),andothercommonshareholders(17.6%).AccordingtoGrupoMéxico,afterthemergerithadthesecondlargestcopperreservesofanycompanyintheworldandthelargestreservesofanypubliclytradedcompany(GrupoMéxico,S.A.deC.v.,2004,p.2;SouthernperuCopperCorp.,2004).InadditiontoitsU.S.operations,GrupoMéxicooperatedtheCananeaandLaCaridadMinesinMexico,andSpCCoperatedtheToquepalaandCuajoneMinesinperu,thefourmineshavingacombinedcapacityofmorethan750,000t/yrofcopperinconcentrateandelectrowoncopper.
Consumption
reporteddomesticconsumptionofrefinedcopperin2004reversedits2-yeardownwardtrend,risingbymorethan5%tothehighestlevelin3years.Buoyedbycontinuedstronghousingconstruction,consumptionofrefinedcopperinthefirstquarterof2004rose6%aboveconsumptioninthepreviousquarterandwasupbymorethan8%comparedwithconsumptionduringthefirstquarterof2003.Wire-rodmillsaccountedformostoftheincrease,withconsumptionrisingbymorethan7%comparedwiththatofthepreviousquarter
andmorethan10%comparedwiththatofthefirstquarterof2003.AccordingtodatacompiledbytheAmericanBureauofMetalStatistics,Inc.(ABMS)(2004),U.S.shipmentsofwirerodinMarch2004were24%higherthaninMarch2003,andfirstquarter2004shipments,whichwereatthehighestlevelsincethefirstquarterof2001,were13%aboveshipmentsinthefirstquarterof2003.ApparentconsumptionofwirerodintheUnitedStates,whichincludednetimports,was15%higherthanthatforthefirstquarterof2003.Inventoriesofwirerodatproducerswereatthelowestlevelsinceatleast1996,providingfurtherevidenceofrecoveryindemand.
reportedconsumptioninthesecondandthirdquarters,thoughdownnominallyfromthatinthefirstquarter,remainedabout9%abovethatfortheequivalentperiodsof2003.BySeptember,however,themarketsshowedsignsofweakening,andduringthefourthquarter,reportedconsumptionofrefinedcopperdecreasedby10%fromthatofthethirdquarterandwas5%belowtherelativelystrongfourthquarterof2003.AccordingtoABMS(2005b)data,domesticwirerodshipmentsfor2004totaled1.79Mt,andwereupbyalmost9%fromthatofthepreviousyear.Apparentconsumptionofwirerodwasupbyabout7%.Similarly,ABMS(2005a)dataon2004brassmillproductsshipmentsbydomesticproducerswereupby7.3%comparedwith2003shipments,despitea12.3%dropduringthefourthquarterof2004(3.3%fourthquarteryear-on-yeardrop).Allcopperandcopperalloyproductsectorsrosein2004—plate,stripandsheet(11.9%);rodandbar(7.7%);andtube(3.4%).
AccordingtopreliminarydatafromtheCopperDevelopmentAssociation,Inc.(2005,p.18-20),thetotalsupplyofcopperandcopper-alloyproductstotheU.S.marketbyfabricators(brassmills,wiremills,foundries,andpowderproducers),whichincludednetimports,reverseda2-yeardeclineandroseby5.1%in2004toaboutthesamelevelasin2001.Brassmillproductsaccountedforabout49%oftotalshipmentstothedomesticmarket;wiremillproducts,49%;andfoundryandpowderproducts,2%.Inbuildingconstruction,whichwasthelargestendusesector,shipmentsroseby5.4%andaccountedforabout49%ofthemarket.Buildingconstructionincludedproductsusedforairconditioning,architecturalapplications,builder’shardware,buildingwire,commercialrefrigeration,andplumbingandheating.Shipmentsforelectric/electronicproducts(21%marketshare),transportationequipment(11%share),andconsumerandgeneralproducts(11%share)increasedby3%,12%,and8%,respectively.Shipmentsforindustrialmachineryandequipment(9%share)declinedbyabout2%.
Prices and Stocks
Thecopperpricerallyatyearend2003,thatwasencouragedbyaproductiondeficit,stockdrawdowns,andannouncementsofpotentialsupplydisruptions,continuedalmostuninterruptedthroughthefirstquarterof2004.TheCoMeX(theCoMeXDiv.oftheNewyorkMercantileexchange)pricereachedapeakof$1.38onMarch19,andaveraged$1.34forthemonth,thehighestmonthlyaveragesinceNovember1995.ThoughtheplattsMetalsWeekaverageproducerpricepremiumremainedunchangedintheJanuarytoMarchperiodat4.2centsperpound

Copper—2004 21.5
overCoMeX,theNewyorkdealerpremiumrosefrom4.2centsperpoundinJanuary,to4.8centsinFebruary,to5.5centsinMarch,andwasindicativeoftighteningcoppersupplies.
Thoughcopperpricesmoderatedduringthesecondquarter(theCoMeXpriceaveragedonly$1.21inJune),themarketwasvolatileandwassensitivetoindustryannouncements,includinganannouncementthatFreeportMcMoranCopperandGoldInc.’sGrasbergoperationinIndonesiahadrestartedmininginthehigh-graderegionofitspit(aseriesofslopefailureshadalteredmineplansandreducedproductionprojections)andreportsofpanicsellinginChina.ConcernoverapossibleslowdowninChina’seconomicgrowthsentpricesplungingonApril28to$1.18(Francis-Grey,2004§).Similarly,initiallaborconcernsatthe470,000-t/yrCollahuasiMineinChileandatAsarco’sminesinArizona,andtheirresolutionwithoutproductiondisruption,ledtopricevolatilityinJune(plattsMetalsWeek,2004a).
pricevolatilitywascloselytiedtothetighteningglobalsupplyofcopper.Globalcommodityexchangeinventories(CoMeX,LondonMetalexchangeLtd.,andShanghaiFuturesexchange)haddeclinedto806,000tatyearend2003from1.29Mtatyearend2002.exchangestockscontinuedtheirdownwardtrendduringthefirst6monthsof2004,andbytheendofJunehaddecreasedto242,000t.TheUnitedStatesaccountedformostofthedecline,withU.S.locatedexchangeinventoriesdecliningto152,000tattheendofJune,downfrom590,000tatyearend2003.
FollowingadipinAugust,atraditionalperiodoflightsummerdemand,tighteningsupply,laborunrest,andconcernoverotherproductiondisruptionsledtoanearsteadyriseinpricesduringtheremainderoftheyear.TheCoMeXpricepeakedat$1.54perpoundonDecember28andclosedtheyearat$1.49perpound.InDecember,theplattsMetalsWeekaverageNewyorkdealerpremiumforcathoderoseto5.5centsperpoundovertheCoMeXspotpriceandtheproducerpremiumrosetoabout5.3centsperpound.Thiscomparedwith3.0centsperpoundand4.2centsperpound,respectively,inDecember2003.kennecottUtahCopperindicatedthatpremiumswerelikelytocontinuetorisewhenitannouncedthatitsfirstquarter2005premiumforcathodedeliverytoU.S.locationswouldrisebybetween1.4centsperpoundand1.7centsperpounddependingonlocation(plattsMetalsWeek,2004b).Copperinventoriescontinuedtheirdownwardtrend,andbyyearendglobalcommodityexchangeinventorieshaddeclinedtoonly124,000t,thelowestlevelsincemid-1990.AccordingtoInternationalCopperStudyGroup(ICSG)data(2005a,p.9),totalyearendglobalinventories(commodityexchanges,consumer,government,merchant,andproducer)declinedto922,000tfrom1.78Mtatyearend2003,andattheprevailingrateofconsumptionequaledlessthana3-weeksupplyofcopper.
Copperscrappricesgenerallyfollowedtheupwardtrendinrefinedcopperprices.Withhigherrefinedprices,however,thediscountofmostgradesofcopperscraptorefinedcopperincreased.AccordingtoAmericanMetalMarketdata,theaveragediscountforrefinersNo.2scraproseto21centsperpoundfrom11centsperpoundin2003andthediscountforbrassmillNo.1scraproseto2.6centsperpoundfrom1.2
centsperpoundin2003.ThepricediscountforNo.2copperscrapincreasedsharplyinAprilto21.3centsperpoundfromanaverageofonly11.5centsperpoundduringthefirstquarter.TherisecoincidedwithindustryreportsthatChina,whichwastheleadingdestinationfordomesticscrapexports,hadessentiallyexitedfromtheNo.2scrapmarket,andthatshipmentsofscrapwerebackedupatChineseports(McCann,2004).
Trade
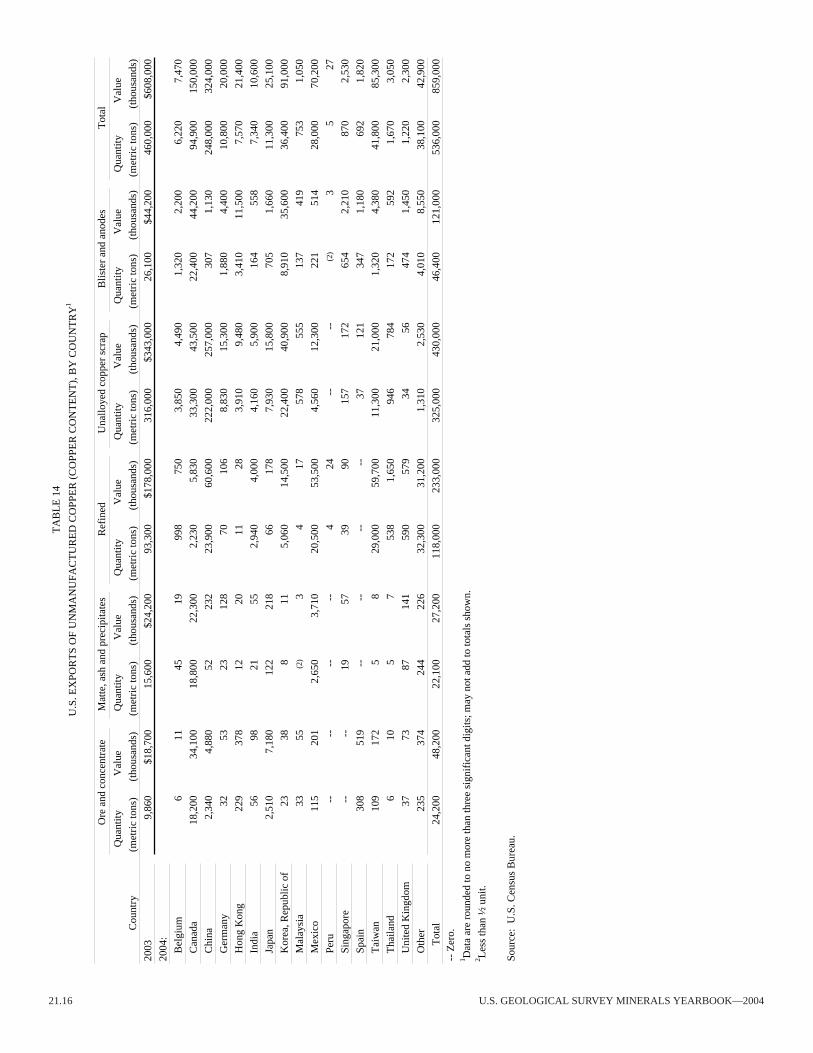
AccordingtoU.S.CensusBureaudata,netrefinedcopperimportsof689,000tweredownbyabout13%fromthosein2003.owingtoalargedrawdownininventories,however,U.S.importrelianceasapercentageofapparentdemandrosetoarecord-high43%.Canadaremainedthemostsignificantsourceofunwroughtcopperproductsfrom2000through2004andaccountedfor31%ofunmanufacturedimports,followedbyChile,28%,andperu,21%.refinedcopperaccountedfor75%ofunwroughtcopperimportsduringthesameperiod.In2004,theUnitedStateswasnominally(lessthan1,300t)anetexporterofcopperinconcentrates,havingbeenanetimporter(17,000t)in2003.Thistookplaceinlargepartbecauseofincreasedconcentrateproductionatnonintegratedminesthatexportedtheirconcentratesforprocessing.
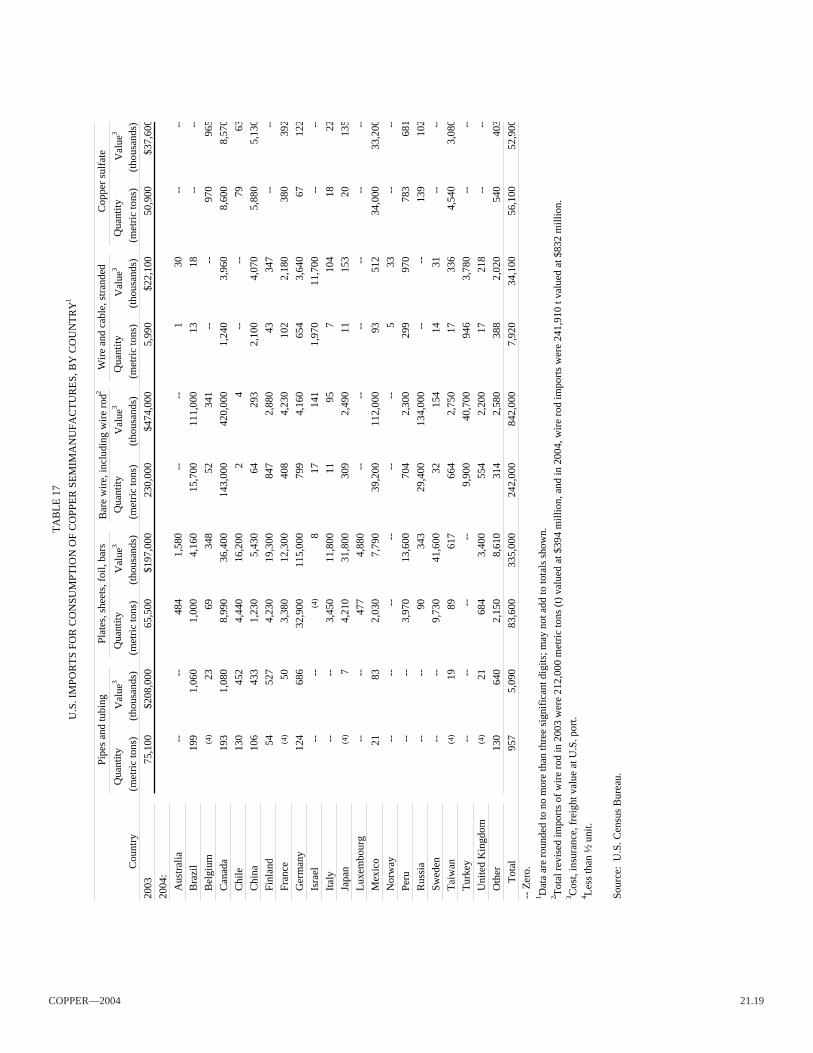
AccordingtoU.S.CensusBureaudatacompiledbytheCopperandBrassFabricatorsCouncilInc.(2005,p.1-9),U.S.importsof328,000tofcopperandcopper-alloysemifabricatedproducts(excludingwire-rodmillproducts)wereupby22%fromthoseofthepreviousyear,andexportsroseto143,000tfrom122,000tin2003.Consequently,netimportsroseto184,000tfrom146,000tin2003.CanadaandMexicocollectivelyaccountedfor74%ofsemifabricatedcopperexportsand30%ofimports.
exportsofcopperscrapfor2004totaled714,000t,upfrom689,000tin2003.China(includingHongkong)wasthedestinationfor67%ofdomesticscrapexportsand,basedonimportdata,accountedfor65%ofreportedglobalscrapimports.TheUnitedStatesremainedtheleadingsourceofscrap,accountingfor19%ofglobalscraptrade(basedonreportedexports).
World Review
Whileworldproductionofrefinedcopperroseto15.8Mt,anincreaseofabout560,000t,worldcopperuse,accordingtoICSGdata(2005a,p.9),increasedbymorethan1Mttoalmost16.7Mt.Asaresult,theglobalproductiondeficitthatdevelopedduring2003continuedthroughout2004.Thecalculateddeficitfor2004reachedalmost900,000tofrefinedcopper.ThiscorrelateswellwiththeICSGreportedglobaldrawdownintotalinventories(860,000t)to920,000tatyearend2004from1.78Mtatyearend2003.Theaccumulated2-yeardeficitandstockdrawdown(2003-04)totaledabout1.3Mtand1.13Mt,respectively.Thediscrepancybetweencalculateddeficitsandstockdrawdownscanreadilybeaccountedforbythereleaseofunreportedinventories,especiallythoseinChina,thelargestglobalconsumerofcopper.

21.6 U.S.GeoLoGICALSUrveyMINerALSyeArBook—2004
Whileworldrefineryproductionrosebyonlyabout560,000t,worldmineproductionrosebyabout860,000tto14.6Mt,withalloftheincreasecomingascopperinconcentrate.Smeltersreportedlyweretakingadvantageofasurgeinconcentrateavailabilityandariseintreatmentandrefiningchargestorebuilddiminishedinventoriesratherthanboosttheiroutput.ThiswasreportedtobemostprevalentinAsia,wherethedeclarationofaforcemajeureonconcentrateshipmentsfromtheGrasbergMineinIndonesiainlate2003hadcausedseveresupplyshortages,andsmelterswereseekingtoreducetheirvulnerabilitytofuturesupplyshortages.AccordingtoBloomsburyMineralseconomicsLtd.,smelterstocks,whichhadbeendecliningduringthepreceding3years,wereapproaching2001levelsbyyearend2004(plattsMetalsWeek,2004c).Underperformanceatsomenewsmelters,includingthoseinIndiaandThailand,alsocontributedtothefailureofincreasedmineoutputtotranslateintoincreasedrefineryproduction.AccordingtoICSG(2005b,p.62-67)data,smeltercapacityrosebyabout600,000tin2004to15.4Mt,whereascapacityutilizationdeclinedto82%fromabout83%in2003.AccordingtoCrUInternationalLtd.(2005,p.42-45),atightsupplyofconcentrateearlyintheyearthatresultedinspottreatmentandrefiningchargesfallingtozero,oreventonegativevalues,gavewaytosharplyrisingchargesatmidyearandbyyearendwereabout30centsperpoundofcopper.yearendtermcontractswerereportedtobeabout22centsperpoundofcopper.
Incontrastto2003,whenonlyAsiashowedapositivegrowthincopperuse,ICSG(2005a,p.19-20)dataindicatethatallthemajorcopperconsumingregionsoftheworldreportedsignificantgrowthincopperuse.InNorthAmerica,copperuseincreasedbymorethan6%to3.09Mt,upfrom2.90Mtin2003,andinAsia,copperuseincreasedby7.5%to7.7Mt.ThoughallthesignificantAsiancopper-consumingcountriesexperiencedgrowth,China,theworld’slargestconsumerofcopper,ledthewaywithanalmost8%increaseinapparentgrowth.releasesfromChina’sstrategicstockpile,forwhichdatawerenotavailable,mayhavesuppliedadditionalcoppertotheChinesemarket.Ineurope,copperuseincreasedbyabout5.3%to5.0Mtonthestrengthofrussianuse,whichincreasedbyabout30%to582,000t.ApparentconsumptionintheeuropeanUnionincreasedbyonlyabout2.3%.russianexporttariffsfavoredtheexportofvalueaddedproducts,resultingingreaterdomesticconsumptionofrefinedcopper,andanincreaseinexportsofcopperandcopper-alloysemifabricates,whichroseto305,000tin2004from185,000tin2003and59,000tin2001,whilerussianexportsofrefinedcopperdeclinedto339,000tin2004from395,000tin2003andmorethan580,000tin2001.U.S.importsofrussianwirerodwereonly29,000t,downfrom52,000tin2003,butstillsignificantlyhigherthan2001importsoflessthan3,000t.
Mine Production.—In2004,accordingtoICSG(2005b,p.2-60)estimates,worldminecapacityresumeditsstrongupwardgrowth,increasingbyalmost600,000t(3.9%).Capacityin2003hadrisenbyonlyabout130,000t(0.8%)toabout15.2Mt.Thisfollowedaperiodofstronggrowththatbeganin1995andsawcapacitygrowthof42%duringthe1994-2002period.estimatedcapacityutilizationincreasedin2004
fromabout90%inthepreceding2years,toalmost92%in2004,yetremainedwellbelowthatfor2001whentheutilizationrateexceeded94%.
In2004,capacitygrowthinChile(475,000t),China(20,000t),Congo(kinshasa)(30,000t),kazakhstan(40,000t),Mexico(30,000t),peru(105,000t),andZambia(34,000t),waspartiallyoffsetbyreductioninIndonesia.InIndonesia,effectivecapacitywasreducedbyabout280,000tfromitsengineeredcapacitywhenlandslideslimitedaccesstohigh-gradeoreintheGrasbergMine(InternationalCopperStudyGroup,2005b,p.12-60).
InAustralia,capacityandproductionwerepoisedtoincreasein2005followingthepurchaseoftheMt.GordonMinefrombankruptWesternMetalsLtd.byIndia’sAdityaBirlaGroup,andtheconversionofproductiontocopperinconcentratefromSX-eWinordertofeeditsDahejsmelterinIndia.TheBirlaGrouphadpreviouslypurchasedtheNiftyMineandwasplanningasimilarconversiontocopperinconcentrateandexpansionby2006(Clarke,2004§).
InChile,thereweremajorexpansionsatCorporaciónNacionaldelCobrédeChile’s(Codelco)NorteandTenientedivisions,andattheCollahuasiandescondidaMines.TotalproductionfromCodelco’sminesroseto1.84Mtfrom1.67Mtin2003.AtCodelcoNorte,productionroseto983,000tin2004from907,000tin2003followingaconcentratorexpansionin2003.WorkprogressedtowardopeningtheMinaSurnorthernexpansion,a120,000-t/yrrefinedcopperleachprojectslatedtobeginproductioninthelatterpartof2005.DevelopmentoftheMinistroAlejandroHalesMineandassociatedexpansionofconcentratorcapacityby50,000t/doforewasbeingstudied.AtelTeniente,productionroseto435,000tfrom339,000towingtomillandinfrastructureexpansionthatraisedmillingcapacityto131,000t/dofore(CorporaciónNacionaldelCobrédeChile,2005,p.25-42).AttheescondidaMine,productionroseto1.2Mtfrom993,000tin2003followingimprovedperformancefromthenewLagunaconcentrator.Mill-headgraderoseto1.51%from1.43%in2003andthroughputroseto82Mtfrom70Mtin2003.productionin2003hadbeensuppressedintentionallybymininglower-gradeoreinordertolimittheglobalcoppersurpluscarryingforwardfrom2002(rioTintoplc,2005b,p.14,45-48).
AttheCollahuasiMine,productionroseto481,000tofcopper(423,000tcopperinconcentrateand58,000telectrowon)fromatotalof395,000tin2003,followingcompletionofa$584millionexpansionprogramthatwasintendedtogivetheminealong-termcapacityof500,000t/yrofcopper(AngloAmerican,2005,p.124;Mining-technology.com,2005§).AttheelAbraMine(phelpsDodge,51%andCodelco,49%),productionofelectrowoncopperdeclinedbyabout9,000tto218,000t,andattheCandaleriaMine(phelpsDodge,80%andSumitomoCorp.,20%)concentrateproductiondeclinedby12,700tto200,000t(phelpsDodgeCorp.,2005,p.9).
InNorthernperu,productionattheAntaminacopper-zincproject(BHpBilliton,MitsubishiCorp.,NorandaInc.,andTeckComincoLtd.)rosetoarecord-high362,000tofcopperinconcentratefrom272,000tin2003.efficiencyimprovementsresultedinan18%increaseinmillthroughput,andcompletionofsedimentremovalfromthebottomofthepitallowedaccess
Copper—2004 21.7
tocopper-onlyore.Asaresult,averagemill-headgradesroseto1.34%copperfrom1.19%in2003,whilezincgradesdeclinedto0.97%zincfrom1.86%in2003(TeckComincoLtd.,2005§).
AtSpCCoperations,mineproductionfor2004increasedby6.1%to397,000t.Copperinconcentrateproductionroseby22,600tattheToquepalaMineandby9,800tattheCuajoneMine,whileSX-eWproductiondecreasedbyabout5,600t.MillthroughputattheToquepalaconcentratorincreased3%,establishinganewfacilitymillingrecordof19.8Mt/yr(SouthernperuCopperCompany,2005).
Smelter Production.—Worldsmeltercapacityrosebyabout600,000ttoarecord-high15.4Mt/yr.InChile,modernizationofNoranda’sAlnortesmelter,includinganewNorandafurnace,wascompletedin2003andboostedfull-yearcapacityin2004to270,000t/yrfrom165,000t/yrin2002.replacementofthereverberatoryfurnaceatCodelco’sSalvadorDivision(potrerillossmelter)boostedcapacitytoabout200,000t/yrfrom170,000t/yr(InternationalCopperStudyGroup,2005b,p.62-67).
InChina,expansionsoftheGuixi(JiangxiCopperCorp.),theJinchuanNon-ferrousMetalCo.,andtheJinlong(TonlingNonferrousMetalsCorp.)smeltersaccountedformostofa160,000-t/yrincreaseincapacity.AnewsmelterwasunderconstructionbyJinchuanthatcouldaddanadditional200,000t/yrofcapacitybyyearend2005.Atyearend,a30,000-t/yrsmelterwascommissionedbyBoatouHuadingCopperCo.,andphase2construction,whichcouldbringitsultimatecapacityupto200,000t/yr,wasunderconstruction(InternationalCopperStudyGroup,2005b,p.65-66).
InIndia,theBirlaGroupinstalledAusmelttechnologyin2003toexpanditsoutokumpufurnaceto250,000t/yrin2004from150,000t/yrin2002,andtheSterliteIndustriesLtd.,Isasmeltsmelter,whichstartedupin1996,reacheditscapacityofabout210,000t/yrin2004,upfrom180,000t/yrin2003.CapacityattheBirlasmelterwasexpectedtodoubleto500,000t/yrin2006,whilecapacityattheSterlitesmelterwasscheduledtoincreaseto300,000t/yrin2005.InIndonesia,afirst-phaseexpansionoftheGresiksmelterwascompleted,boostingcapacitybyabout25,000t/yrto245,000t/yr,andasecond-phaseexpansionwasanticipatedtocomeonstreamin2006.In2004,Iranemergedasamajorsmeltingcountrywithstartupofan80,000t/yrflashsmelterinkhatoonAbadandexpansionoftheSarChesmaehsmelterto200,000t/yrfrom145,000t/yr,bothownedbytheNationalIranianCopperIndustryCo.(InternationalCopperStudyGroup,2005b,p.68).
Refinery Production.—Worldrefinerycapacityrosebyabout530,000t/yr(3%).WiththeexceptionofonenewrefineryinChina(ZhongtiaoshanNonferrousMetalsCo.),nonewelectrolyticrefinerieswerecommissionedin2004,andforthemostpart,expansionsfollowedexpandedsmeltercapacities.Chinaaccountedforalmost340,000toftheincreasedglobalcapacity.InBelgium,thesecondaryrefineryinLiege,withacapacityofabout80,000t/yroffire-refinedcopper,closedearlyintheyear.Afterfallingin2003owingtoaglobalshortageofconcentrates,capacityutilizationatglobalrefineriesrosetoabout82%from81%in2003,butwasdownfrom88%asrecentlyas2001(InternationalCopperStudyGroup,2005b,p.96-106).
Outlook
Despiteamorethan3%estimatedgrowthinworldmineandrefineryproductionin2005,productionwasinsufficienttomeetglobaldemand,andtherefinedcopperproductiondeficitthathaddevelopedduringthepreceding2yearscontinuedthroughatleastthefirst3quartersof2005.Globalinventoriesofrefinedcopperheldinmetalexchangewarehousescontinuedtheirdownwardtrend,fallingbelow100,000tduringthethirdquarterof2005.Thisshortfalldevelopeddespiteanestimateddeclineinglobalconsumption,which,accordingtotheICSG(2005a,p.19),declinedbyalmost2%duringthefirst9monthsof2005comparedwiththatforthesameperiodin2004.StronggrowthinChinaandIndiawasmorethanoffsetbyreducedusebyothersignificantconsumers.Thoughglobalminecapacitywasprojectedtoincreasebyabout860,000t(5.5%),globalmineproductionfellshortofitsanticipatedgrowthowingtoproductionshortfallsintheUnitedStatesandSouthAmerica,andminecapacityutilizationwasprojectedtofalltoitslowestlevelinrecentyears.Newcapacityandincreasedcapacityutilizationwasexpectedtoreversetheglobalproductiondeficit,andamodestproductionsurpluswasanticipatedfor2006.
IntheUnitedStates,mineoutputwasprojectedtodecreasetoabout1.15Mtin2005owingtounusuallyheavyspringrains,equipmentshortages,andastrikebyworkersatAsarcothatbeganinJulyandextendedthroughthesecondweekinNovember.year-on-yearU.S.consumptionofrefinedcopperdeclinedduringthefirst9monthsof2005owingtoweakerdemandandasurgeinimportsofwirerodinthefirsthalfof2005.U.S.mineandrefineryproductionwereexpectedtoincreasein2006followingsettlementofthestrikeandtheexpectedstartupofaneweWfacilityinUtahearlyintheyear.
References Cited
AmericanBureauofMetalStatistics,Inc.,2004,UScopperwirerodmarket—ABMSreport4:Chatham,NJ,AmericanBureauofMetalStatistics,Inc.,May27,8p.
AmericanBureauofMetalStatistics,Inc.,2005a,Brassmillinventories,receiptsandshipmentsoftheUnitedStates—ABMSreport3:Chatham,NJ,AmericanBureauofMetalStatistics,Inc.,March24,12p.
AmericanBureauofMetalStatistics,Inc.,2005b,UScopperwirerodmarket—ABMSreport4:Chatham,NJ,AmericanBureauofMetalStatistics,Inc.,February22,6p.
AngloAmericanplc,2005,Annualreport—2004:London,Unitedkingdom,AngloAmericanplc,124p.
BHpBilliton,2005,Annualreport—2004:London,Unitedkingdom,BHpBilliton,55p.
ConstellationCopperCorp.,2004a,ConstellationCopperCorporationarrangesUS$40milliondebtfinanceforLisbonvalleyandreceivesintenttoapproveairqualitypermit:Denver,Co,ConstellationCopperCorp.pressrelease,June8,2p.
ConstellationCopperCorp.,2004b,ConstructioncommencesattheLisbonvalleySX-eWcopperproject:Denver,Co,ConstellationCopperCorp.pressrelease,November16,1p.
ConstellationCopperCorp.,2004c,UpdateonLisbonvalleySX-eWproject:Denver,Co,ConstellationCopperCorp.pressrelease,September29,1p.
CopperandBrassFabricatorsCouncilInc.,2005,Import/exportreport:Washington,DC,CopperandBrassFabricatorsCouncilInc.,January,121p.
CopperDevelopmentAssociationInc.,2005,Annualdata2004—Coppersupplyandconsumption:Newyork,Ny,CopperDevelopmentAssociationInc.,21p.
CorporaciónNacionaldelCobrédeChile,2005,Annualreport—2004:Santiago,Chile,CorporaciónNacionaldelCobrédeChile,102p.

21.8 U.S.GeoLoGICALSUrveyMINerALSyeArBook—2004
CrUInternationalLtd.,2005,Copperquarterlyindustryandmarketoutlook:London,Unitedkingdom,CrUInternationalLtd.,January,66p.
Dillard,Gary,2004,NewhopeforSuperior:payDirt,November,p.3-5.GrupoMéxico,S.A.deC.v.,2004,GrupoMéxico,S.A.deC.v.reportsits
resultstodaycorrespondingtothethirdquarterandninemonthsendedSeptember30,2004:MexicoCity,Mexico,GrupoMéxico,S.A.deC.v.Ceo’sreport,october24,20p.
GrupoMéxico,S.A.deC.v.,2005,Annualreport—2004:MexicoCity,Mexico,GrupoMéxico,S.A.deC.v.,46p.
InternationalCopperStudyGroup,2005a,Copperbulletin:Lisbon,portugal,InternationalCopperStudyGroup,v.12,no.12,December,55p.
InternationalCopperStudyGroup,2005b,Directoryofcopperminesandplants:Lisbon,portugal,InternationalCopperStudyGroup,January,105p.
McCann,Joseph,2004,ChinesenoticeablyabsentfromUScopperscrapmart:AmericanMetalMarket,v.112,no.11-1,March15,p.6.
NordresourcesCorp.,2004,NordresourcesinvitestendersfromminingcontractorsforJohnsonCampcoppermine:Dragoon,AZ,NordresourcesCorp.newsrelease,July19,2p.
plattsMetalsWeek,2004a,FearsofstrikesatAsarco,Collahuasipushcopperhigher:plattsMetalsWeek,v.75,no.27,July5,p.1,6.
plattsMetalsWeek,2004b,kennecottpremiumsupmorethan1.40¢:plattsMetalsWeek,v.75,no.51,December20,p.15.
plattsMetalsWeek,2004c,refinedcopperdeficittotop1-milmtin2004—BMe:plattsMetalsWeek,v.75,no.46,November15,p.9.
plattsMetalsWeek,2005,Asarcoaimstohikeoutputto220,000mt:plattsMetalsWeek,v.76,no.4,January24,p.7.
phelpsDodgeCorp.,2004,phelpsDodgeisincreasingcopperproductionin2004,2005:phoenix,AZ,phelpsDodgeCorp.newsrelease,January29,2p.
phelpsDodgeCorp.,2005,Annualreport—2004:phoenix,AZ,phelpsDodgeCorp.,152p.
QuadraMiningLtd.,2004a,QuadraMiningLtd.reportssecondquarterresults,increasedmineralreservesandrevisedmineplan:vancouver,BritishColumbia,Canada,QuadraMiningLtd.pressrelease,August11,4p.
QuadraMiningLtd.,2004b,robinsonMineupdate—Concentratorbeginsprocessingore—Miningcontractsigned:vancouver,BritishColumbia,Canada,QuadraMiningLtd.pressrelease,September8,2p.
rioTintoplc.,2005a,Fourthquarter2004operationsreview:London,Unitedkingdom,rioTintoplcpressrelease,January19,23p.
rioTintoplc.,2005b,rioTinto2004annualreportandfinancialstatements:London,Unitedkingdom,rioTintoplc.,155p.
SouthernperuCopperCorp.,2004,SouthernperutoacquireMineraMéxicoinastock-for-stocktransaction:Lima,peru,SouthernperuCopperCorp.pressrelease,october21,1p.
SouthernperuCopperCorp.,2005,SpCCreportsfourthquarterandfull-yearresults:Lima,peru,SouthernperuCopperCorp.pressrelease,March14,2p.
U.S.DepartmentofCommerce,2004,requestforpubliccommentonthereceiptbytheDepartmentofCommerceofawrittenpetitionrequestingtheimpositionofshortsupplyexportcontrolsandmonitoringonrecyclablemetallicmaterialscontainingcopper:Federalregister,v.69,no.78,April22,p.21815-21816.
U.S.environmentalprotectionAgency,2003,Nationalprimarydrinkingwaterregulations;announcementofcompletionofepA’sreviewofexistingdrinkingwaterstandards:Federalregister,v.68,no.138,July18,p.42907-42929.
U.S.environmentalprotectionAgency,2004a,Leadandcopperrule;expertpanelworkshoponpubliceducationandriskcommunication:Federalregister,v.69,no.153,August10,p.48491-48492.
U.S.environmentalprotectionAgency,2004b,Leadandcopperrule;expertpanelworkshopsonsimultaneouscomplianceandmonitoringprotocols:Federalregister,v.69,no.79,April23,p.21958.
Internet References Cited
Clarke,Jo,2004(January26),India’aBirlaindealtobuysecondAustraliancopperminefor$14.3,accessedoctober5,2005,viaUrLhttp://www.amm.com.
Francis-Grey,paul,2004(April21),CoppertriggersLMeplunge,pricesdecrease,accessedApril22,2004,viaUrLhttp://www.amm.com.
GoldSpring,Inc.,2004,TheBigMikeproject,accessedJuly9,2004,viaUrLhttp://www.goldspring.us.
McCann,Joseph,2004(June18),Missouricoppersmelterismakingacomeback,accessedJune21,2004,viaUrLhttp://www.amm.com.
Mining-technology.com,2005,Collahuasicoppermine,Chile,accessedDecember18,2005,atUrLhttp://www.mining-technology.com/projects/collahuasi.
TeckComincoLtd.,2005,Antaminayearinreview,accessedJanuary20,2006,atUrLhttp://www.teckcominco.com/operations/antamina/review/htm.
U.S.DepartmentofCommerce,2004a(July21),CommerceDepartmentannouncescopperscrapandcopper-alloyscrapdetermination,accessedJuly22,2004,atUrLhttp://www.bis.doc.gov/news/2004/copperJuly21.htm.
U.S.DepartmentofCommerce,2004b(April7),petitionfortheimpositionofmonitoringandcontrolswithrespecttoexportsfromtheUnitedStatesofcopperscrapandcopperalloyscrap,accessedApril12,2004,atUrLhttp://www.bis.doc.gov/pdf/ocpa-final.pdf.
GEnERaL SOuRCES Of InfORMaTIOn
u.S. Geological Survey Publications
Copper.Ch.inMetalpricesintheUnitedStatesThrough1998.Copper.Ch.inMineralCommoditySummaries,annual.Copper.Ch.inUnitedStatesMineralresources,professional
paper820,1973.Copper.MineralIndustrySurveys,monthly.TheNatureandUseofCopperreserveandresourceData,
professionalpaper907-F,1981.
Other
AmericanBureauofMetalStatistics(ABMS)Non-FerrousMetalData.
TheAvailabilityofCopperinMarketeconomyCountries,U.S.BureauofMinesInformationCircular9310,1992.
Copper.Ch.inMineralFactsandproblems,U.S.BureauofMinesBulletin675,1985.
InternationalCopperStudyGroup,Lisbon,portugal,monthlyCopperBulletin.
InternationalCopperStudyGroup,Lisbon,portugal,quarterlyDirectoryofCopperMinesandplants.
WorldBureauofMetalStatistics(WBMS,London),monthlyWorldMetalsStatistics.

Copper—2004 21.9
TABLE 1
SALIENT COPPER STATISTICS1
(Metric tons unless otherwise specified)
2000 2001 2002 2003 2004
United States:
Mine production:
Ore concentrated thousand metric tons 202,000 148,000 104,000 114,000 139,000
Averag y er2e ield of copp percent 0.44 r 0.48 r 0.52 r 0.46 r 0.38
Recoverable copper:
Arizona 929,000 879,000 767,000 741,000 723,000
Michigan, Montana, Utah W W W W W
New Mexico 195,000 141,000 112,000 87,800 122,000
Other States 322,000 318,000 263,000 287,000 312,000
Total 1,450,000 1,340,000 1,140,000 1,120,000 1,160,000
Total value millions $2,810 $2,270 $1,910 $2,100 $3,420
Smelter production, primary and secondary 1,000,000 919,000 683,000 539,000 542,000
Byproduct sulfuric acid, sulfur content thousand metric tons 830 813 695 590 600
Refinery production:
Primary materials:
Electrolytic from domestic ores 865,000 808,000 725,000 532,000 531,000
Electrolytic from foreign materials 163,000 192,000 116,000 130,000 140,000
Electrowon 556,000 628,000 601,000 591,000 584,000
Total 1,580,000 1,630,000 1,440,000 1,250,000 1,260,000
Secondary materials (scrap), electrolytic and fire refined 209,000 172,000 69,900 53,300 50,800
Grand total 1,790,000 1,800,000 1,510,000 1,310,000 1,310,000
Secondary copper produced:
Recovered from new scrap 955,000 833,000 840,000 r 737,000 r 774,000
Recovered from old scrap 358,000 317,000 190,000 r 207,000 r 191,000
Total 1,310,000 1,150,000 1,030,000 r 944,000 965,000
Copper sulfate production 55,500 55,200 49,200 32,100 25,100
Exports:
Refined 93,600 22,500 26,600 93,300 118,000
Unmanufactured3 650,000 556,000 506,000 703,000 789,000
Imports:
Refined 1,060,000 991,000 927,000 882,000 807,000
Unmanufactured3 1,350,000 1,400,000 1,230,000 1,140,000 1,060,000
Copper stocks, December 31:
Blister and in-process material 122,000 98,000 44,400 56,800 51,400
Refined copper:
Refineries 14,800 28,600 11,700 12,100 10,400
Wire-rod mills 39,900 37,600 23,000 29,700 20,300
Brass mills 23,600 25,500 28,700 20,200 21,500
Other industry 4,390 4,860 4,800 4,240 r 3,230
New York Commodity Exchange (COMEX) 58,700 244,000 362,000 255,000 43,700
London Metal Exchange (LME), U.S. warehouses 204,000 617,000 601,000 335,000 35,000
Total 345,000 957,000 1,030,000 656,000 r 134,000
Consumption:
Refined copper, reported 3,020,000 2,620,000 2,370,000 2,290,000 2,410,000
A p p y p4pparent consum tion, rimar refined and old scra 3,090,000 2,510,000 2,610,000 2,430,000 2,550,000
Price:
Producer, weighted average cents per pound 88.16 76.85 75.80 85.25 133.94
COMEX, first position do. 83.97 72.57 71.67 81.05 128.97
LME, Grade A cash do. 82.24 71.57 70.72 80.68 129.96
World production:
Mine thousand metric tons 13,300 r 13,700 13,700 r 13,700 r 14,600 e
Smelter do. 12,300 r 12,800 r 12,600 r 12,500 r 12,700 e
Refinery do. 14,900 15,600 r 15,400 r 15,200 e 15,800See footnotes at end of table.

21.10 U.S.GeoLoGICALSUrveyMINerALSyeArBook—2004
TABLE 1—Continued
SALIENT COPPER STATISTICS1
eEstimated. rRevised. W Withheld to avoid disclosing company proprietary data; included in "Other States."1Data are rounded to no more than three significant digits, except prices; may not add to totals shown.2Yield calculations are for concentrated ore only.3Includes copper content of alloy scrap.4In 2000, 2001, 2002, 2003, and 2004, apparent consumption is calculated using general imports of 1,020,000 tons, 1,200,000 tons, 1,060,000 tons, 687,000 tons, and 704,000 tons, respectively.
TABLE 2
LEADING COPPER-PRODUCING MINES IN THE UNITED STATES IN 2004, IN ORDER OF OUTPUT1
Capacity
(thousand
Rank Mine County and State Operator Source of copper metric tons)
1 Morenci Greenlee, AZ Phelps Dodge Corp. Copper ore, leached 390
2 Bingham Canyon Salt Lake, UT Kennecott Utah Copper Corp. Copper-molybdenum ore, concentrated 300
3 Ray Mine Pinal, AZ ASARCO Incorporated Copper ore, concentrated and leached 180
4 Bagdad Yavapai, AZ Phelps Dodge Corp. Copper-molybdenum ore, concentrated and leached 120
5 Chino Grant, NM do. do. 125
6 Sierrita Pima, AZ do. do. 100
7 Tyrone Grant, NM do. Copper ore, leached 80
8 Continental Pit Silver Bow, MT Montana Resources Copper-molybdenum ore, concentrated 45
9 Mission Complex Pima, AZ ASARCO Incorporated Copper ore, concentrated 70
10 Silver Bell do. do. Copper ore, leached 22
11 Robinson Mine White Pine, NV Robinson Nevada Mining Company Copper ore, concentrated 60
12 Miami Mine Gila, AZ Phelps Dodge Corp. Copper ore, leached 73
13 Pinto Valley do. BHP Copper Co. do. 10
14 Miami Mine do. do. do. 121The mines on this list accounted for more than 99% of U.S. mine production in 2004.
TABLE 3
MINE PRODUCTION OF COPPER-BEARING ORES AND RECOVERABLE COPPER CONTENT
OF ORES PRODUCED IN THE UNITED STATES, BY SOURCE AND TREATMENT PROCESS1
(Metric tons)
2003 2004
Gross Recoverable Gross Recoverable
Source and treatment process weight2 copper weight2 copper
Mined copper ore:
Concentrated 114,000,000 518,000 139,000,000 533,000
Leached NA 591,000 NA 584,000
Total NA 1,110,000 NA 1,120,000
Copper precipitates shipped, leached from
tailings, dumps, and in-place material 1,210 684 1,270 2,360
Other copper-bearing ores3 3,320,000 r 6,060 4,780,000 37,200
Grand total XX 1,120,000 XX 1,160,000rRevised. NA Not available. XX Not applicable. 1Data are rounded to no more than three significant digits; may not add to totals shown.2In 2004, 9,706 kilograms of gold and 171 metric tons of silver were recovered from concentrated ore. The average value of gold and silver per metric ton of ore concentrated was $1.18.3Includes gold ore, lead ore, silver ore, silver-copper ore, zinc ore, and ore shipped directly to smelter.

Copper—2004 21.11
TABLE 4
CONSUMPTION OF COPPER AND BRASS MATERIALS IN THE UNITED STATES, BY ITEM1
(Metric tons)
Foundries, Smelters,
chemical plants, refiners,
Item Brass mills Wire-rod mills miscellaneous users ingot makers Total
2003:
Copper scrap 840,000 2 W 85,900 r 187,000 r 1,110,000
Refined copper3 587,000 1,640,000 59,500 r 4,550 2,290,000
Hardeners and master alloys 6,060 -- 1,750 -- 7,800
Brass ingots 1,180 -- 98,700 r -- 99,900 r
Slab zinc 65,600 -- (4) (4) 86,200
2004:
Copper scrap 880,000 2 W 80,700 183,000 1,140,000
Refined copper3 573,000 1,780,000 57,400 4,560 2,410,000
Hardeners and master alloys 10,000 -- 2,040 -- 12,100
Brass ingots 1,470 -- 95,200 -- 96,600
Slab zinc 68,300 -- (4) (4) 95,500rRevised. W Withheld to avoid disclosing company proprietary data; included with "Brass mills." -- Zero.1Data are rounded to no more than three significant digits; may not add to totals shown.2Includes item indicated by symbol W.3Detailed information on consumption of refined copper can be found in table 5.4Withheld to avoid disclosing company proprietary data; included in "Total."
O R
TABLE 5
NSUMPTION OF REFINED COPPER SHAPES IN THE UNITED STATES, BY CLASS OF CONSUME
(Metric tons)
Ingots and Cakes and Wirebar, billets,
Class of consumer Cathodes ingot bars slabs other Total
2003:
Wire-rod mills 1,630,000 -- -- 8,730 1,640,000
Brass mills 439,000 14,900 41,800 91,400 587,000
Chemical plants -- -- -- 959 959
Ingot makers W W W 4,550 2 4,550
Foundries 3,320 r 7,440 r -- 11,100 r 21,900 r
Miscellaneous3 W W W 36,700 r, 2 36,700 r
Total 2,070,000 22,300 r 41,800 153,000 2,290,000 r
2004:
Wire-rod mills 1,770,000 -- -- 8,860 1,780,000
Brass mills 389,000 15,100 57,000 112,000 573,000
Chemical plants -- -- -- 1,200 1,200
Ingot makers W W W 4,560 2 4,560
Foundries 3,470 6,230 -- 11,300 21,000
Miscellaneous3 W W W 35,200 2 35,200
Total 2,160,000 21,400 57,000 173,000 2,410,000rRevised. W Withheld to avoid disclosing company proprietary data; included with "Wirebar, billets, other." -- Zero.1Data are rounded to no more than three significant digits; may not add to totals shown.2Includes items indicated by symbol W.3Includes consumers of copper powder and copper shot, iron and steel plants, and other manufacturers.
21.12 U.S.GeoLoGICALSUrveyMINerALSyeArBook—2004
.
TABLE 6
COPPER RECOVERED FROM SCRAP PROCESSED IN THE UNITED STATES,
BY KIND OF SCRAP AND FORM OF RECOVERY1
(Metric tons)
2003 2004
Kind of scrap:
New scrap:
Copper-base 701,000 735,000
Aluminum-base 36,400 38,800
Nickel-base 18 18
Total 737,000 r 774,000
Old scrap:
Copper-base 185,000 169,000
Aluminum-base 21,700 r 22,100
Nickel-base 213 279
Zinc-base 27 29
Total 207,000 r 191,000
Grand total 944,000 965,000
Form of recovery:
As unalloyed copper 53,600 r 51,400
In brass and bronze 818,000 r 840,000
In alloy iron and steel 974 r 1,020
In aluminum alloys 59,300 r 60,400
In other alloys 27 28
In chemical compounds 12,300 12,300
Total 944,000 965,000rRevised.1Data are rounded to no more than three significant digits; may not add to totals shown
TABLE 7
COPPER RECOVERED AS REFINED COPPER AND IN ALLOYS AND OTHER FORMS
FROM COPPER-BASE SCRAP PROCESSED IN THE UNITED STATES, BY TYPE OF OPERATION1
(Metric tons)
From new scrap From old scrap Total
Type of operation 2003 2004 2003 2004 2003 2004
Ingot makers 17,100 r 25,700 75,800 r 63,800 93,000 r 89,500
Refineries2 16,000 16,000 37,300 34,700 53,300 50,800
Brass and wire-rod mills 644,000 669,000 31,800 36,300 676,000 705,000
Foundries and manufacturers 18,800 r 19,400 36,800 r 30,800 55,600 r 50,200
Chemical plants 5,040 5,040 3,130 3,130 8,160 8,160
Total 701,000 735,000 185,000 169,000 886,000 904,000rRevised.1Data are rounded to no more than three significant digits; may not add to totals shown.2Electrolytically refined based on source of material at smelter level.

Copper—2004 21.13
TABLE 8
PRODUCTION OF SECONDARY COPPER AND COPPER-ALLOY PRODUCTS
IN THE UNITED STATES, BY ITEM PRODUCED FROM SCRAP1
(Metric tons)
Item produced from scrap 2003 2004
Unalloyed copper products:
Refined copper 53,300 50,800
Copper powder 6,850 r 48
Copper castings 338 574
Total 60,500 r 51,400
Alloyed copper products:
Brass and bronze ingots:
Tin bronzes 8,820 r 10,200
Leaded red brass and semired brass 64,700 r 68,400
High leaded tin bronze 9,840 r 10,400
Yellow brass 4,370 r 5,890
Manganese bronze 7,860 r 8,270
Aluminum bronze 5,030 r 6,010
Nickel silver 2,270 r 2,140
Silicon bronze and brass 4,190 r 5,900
Copper-base hardeners and master alloys 5,420 5,500
Miscellaneous 6,130 r 4,940
Total 119,000 r 128,000
Brass mill and wire-rod mill products 829,000 865,000
Brass and bronze castings 42,800 r 44,000
Brass powder 102 71
Copper in chemical products 12,300 12,300
Grand total 1,060,000 1,100,000rRevised.1Data are rounded to no more than three significant digits; may not add to totals shown.
TABLE 9
COMPOSITION OF SECONDARY COPPER-ALLOY PRODUCTION IN THE UNITED STATES1
(Metric tons)
Copper Tin Lead Zinc Nickel Aluminum Total
Brass and bronze ingot production:2
2003r 100,000 3,400 5,290 9,540 221 12 119,000
2004 107,000 4,140 6,110 10,600 224 14 128,000
Secondary metal content of brass mill products:
2003 677,000 491 5,820 144,000 W W 829,000
2004 706,000 475 6,160 150,000 W W 865,000
Secondary metal content of brass and bronze castings:
2003 38,000 r 1,510 r 1,080 1,950 r 121 r 75 r 42,800 r
2004 39,100 1,520 1,130 2,030 182 62 44,000rRevised. W Withheld to avoid disclosing company proprietary data; included in "Total."1Data are rounded to no more than three significant digits; may not add to totals shown.2Includes approximately 97% from scrap and 3% from other than scrap in 2003 and approximately 96% from scrap and 4% from other
than scrap in 2004.
21.14 U.S.GeoLoGICALSUrveyMINerALSyeArBook—2004
TABLE 10
CONSUMPTION AND YEAREND STOCKS OF COPPER-BASE SCRAP1
(Metric tons, gross weight)
2003 2004
Scrap type and processor Consumption Stocks Consumption Stocks
No. 1 wire and heavy:
Smelters, refiners, and ingot makers 68,400 r 942 r 58,600 1,030
Brass and wire-rod mills 377,000 (2) 394,000 (2)
Foundries and miscellaneous manufacturers 33,300 r (2) 27,200 (2)
No. 2 mixed heavy and light:
Smelters, refiners, and ingot makers 29,600 r 1,090 r 28,800 2,100
Brass and wire-rod mills 5,750 (2) 6,250 (2)
Foundries and miscellaneous manufacturers 2,650 r (2) 3,570 (2)
Total unalloyed scrap:
Smelters, refiners, and ingot makers 98,000 r 2,030 r 87,400 3,130
Brass and wire-rod mills 383,000 17,600 401,000 28,800
Foundries and miscellaneous manufacturers 36,000 r 2,400 r 30,700 2,550
Red brass:3
Smelters, refiners, and ingot makers 25,100 r 1,600 r 26,300 1,630
Brass mills 11,900 (2) 14,200 (2)
Foundries and miscellaneous manufacturers 10,800 (2) 9,820 (2)
Leaded yellow brass:
Smelters, refiners, and ingot makers 7,190 r 748 r 8,140 797
Brass mills 297,000 (2) 314,000 (2)
Foundries and miscellaneous manufacturers 1,210 r (2) 1,150 (2)
Yellow and low brass, all plants 51,700 r 756 r 42,600 1,090
Cartridge cases and brass, all plants 80,500 (2) 86,700 (2)
Auto radiators:
Smelters, refiners, and ingot makers 26,700 r 1,470 r 25,000 1,560
Foundries and miscellaneous manufacturers 3,680 (2) 4,300 (2)
Bronzes:
Smelters, refiners, and ingot makers 8,390 r 983 r 11,100 946
Brass mills and miscellaneous manufacturers 17,200 r (2) 18,400 (2)
Nickel-copper alloys, all plants 17,400 r 338 r 20,900 246
Low grade and residues; smelters, refiners, and
miscellaneous manufacturers 32,200 1,040 r 35,300 619
Other alloy scrap:4
Smelters, refiners, and ingot makers 1,100 326 r 1,130 402
Brass mills and miscellaneous manufacturers 5,230 r (2) 6,000 (2)
Total alloyed scrap:
Smelters, refiners, and ingot makers 89,100 r 7,270 r 95,500 7,290
Brass mills 458,000 26,500 480,000 25,000
Foundries and miscellaneous manufacturers 49,900 r 2,620 r 50,000 2,160
Total scrap:
Smelters, refiners, and ingot makers 187,000 r 9,300 r 183,000 10,400
Brass and wire-rod mills 841,000 44,100 880,000 53,900
Foundries and miscellaneous manufacturers 85,900 r 5,010 r 80,700 4,710rRevised.1Data are rounded to no more than three significant digits; may not add to totals shown.2Individual breakdown is not available; included in "Total unalloyed scrap," "Total alloyed scrap," and "Total scrap."3Includes cocks and faucets, commercial bronze, composition turnings, gilding metal, railroad car boxes, and siliconbronze.4Includes aluminum bronze, beryllium copper, and refinery brass.

Copper—2004 21.15
TABLE 11
CONSUMPTION OF PURCHASED COPPER-BASE SCRAP1, 2
(Metric tons, gross weight)
From new scrap From old scrap Total
Type of operation 2003 2004 2003 2004 2003 2004
Ingot makers 23,000 r 40,200 110,000 r 91,700 133,000 r 132,000
Smelters and refineries 16,200 16,200 37,600 34,900 53,800 51,100
Brass and wire-rod mills 808,000 843,000 32,600 37,700 841,000 880,000
Foundries and miscellaneous manufacturers 41,600 r 42,600 44,200 r 38,200 85,900 r 80,700
Total 889,000 r 941,000 225,000 r 202,000 1,110,000 1,140,000rRevised.1Data are rounded to no more than three significant digits; may not add to totals shown.2Consumption at brass and wire-rod mills assumed equal to receipts.
TABLE 12
FOUNDRIES AND MISCELLANEOUS MANUFACTURERS CONSUMPTION OF
BRASS INGOT, REFINED COPPER AND COPPER SCRAP IN THE UNITED STATES1
(Metric tons)
Ingot type or material consumed 2003 2004
Tin bronzes 23,500 r 22,800
Leaded red brass and semired brass 57,300 r 55,300
Yellow, leaded, low brass2 5,460 r 6,440
Manganese bronze 5,640 r 3,940
Nickel silver3 2,850 2,260
Aluminum bronze 3,580 r 3,590
Hardeners and master alloys4 1,750 2,040
Lead free alloys5 377 864
Total brass ingot 100,000 r 97,200
Refined copper 59,500 r 57,400
Copper scrap 85,900 r 80,700rRevised.1Data are rounded to no more than three significant digits; may not add to totals shown.2Includes brass and silicon bronze.3Includes brass, copper nickel, and nickel bronze.4Includes special alloys.5Includes copper-bismuth and copper-bismuth-selenium alloys.
TABLE 13
AVERAGE PRICES FOR COPPER SCRAP AND ALLOY-INGOT, BY TYPE
(Cents per pound)
Dealers' buying (New York)
Brass mills Refiners No. 2 Red brass turnings
Year No. 1 scrap No. 2 scrap scrap and borings
2003 80.17 70.42 52.70 38.65
2004 126.41 107.62 86.86 55.14
Source: American Metal Market.
21.16 U.S.GeoLoGICALSUrveyMINerALSyeArBook—2004
TA
BL
E 1
4
U.S
. EX
POR
TS
OF
UN
MA
NU
FAC
TU
RE
D C
OPP
ER
(C
OPP
ER
CO
NT
EN
T),
BY
CO
UN
TR
Y1
Ore
and
con
cent
rate
Mat
te, a
sh a
nd p
reci
pita
tes
Ref
ined
Una
lloye
d co
pper
scr
apB
liste
r an
d an
odes
Tot
al
Qua
ntity
Val
ueQ
uant
ityV
alue
Qua
ntity
Val
ueQ
uant
ityV
alue
Qua
ntity
Val
ueQ
uant
ityV
alue
Cou
ntry
(met
ric
tons
) (t
hous
ands
)(m
etri
c to
ns)
(tho
usan
ds)
(met
ric
tons
) (t
hous
ands
)(m
etri
c to
ns)
(tho
usan
ds)
(met
ric
tons
) (t
hous
ands
) (m
etri
c to
ns)
(tho
usan
ds)
2003
9,86
0$1
8,70
015
,600
$24,
200
93,3
00$1
78,0
0031
6,00
0$3
43,0
0026
,100
$44,
200
460,
000
$608
,000
2004
:
Bel
gium
611
4519
998
750
3,85
04,
490
1,32
02,
200
6,22
07,
470
Can
ada
18,2
0034
,100
18,8
0022
,300
2,23
05,
830
33,3
0043
,500
22,4
0044
,200
94,9
0015
0,00
0
Chi
na2,
340
4,88
052
232
23,9
0060
,600
222,
000
257,
000
307
1,13
024
8,00
032
4,00
0
Ger
man
y32
5323
128
7010
68,
830
15,3
001,
880
4,40
010
,800
20,0
00
Hon
g K
ong
229
378
1220
1128
3,91
09,
480
3,41
011
,500
7,57
021
,400
Indi
a56
9821
552,
940
4,00
04,
160
5,90
016
455
87,
340
10,6
00
Japa
n2,
510
7,18
012
221
866
178
7,93
015
,800
705
1,66
011
,300
25,1
00
Kor
ea, R
epub
lic o
f23
388
115,
060
14,5
0022
,400
40,9
008,
910
35,6
0036
,400
91,0
00
Mal
aysi
a33
55(2
)3
417
578
555
137
419
753
1,05
0
Mex
ico
115
201
2,65
03,
710
20,5
0053
,500
4,56
012
,300
221
514
28,0
0070
,200
Peru
----
----
424
----
(2)
35
27
Sing
apor
e--
--19
5739
9015
717
265
42,
210
870
2,53
0
Spai
n30
851
9--
----
--37
121
347
1,18
069
21,
820
Tai
wan
109
172
58
29,0
0059
,700
11,3
0021
,000
1,32
04,
380
41,8
0085
,300
Tha
iland
610
57
538
1,65
094
678
417
259
21,
670
3,05
0
Uni
ted
Kin
gdom
3773
8714
159
057
934
5647
41,
450
1,22
02,
300
Oth
er23
537
424
422
632
,300
31,2
001,
310
2,53
04,
010
8,55
038
,100
42,9
00
Tot
al24
,200
48,2
0022
,100
27,2
0011
8,00
023
3,00
032
5,00
043
0,00
046
,400
121,
000
536,
000
859,
000
-- Z
ero.
1 Dat
a ar
e ro
unde
d to
no
mor
e th
an th
ree
sign
ific
ant d
igits
; may
not
add
to to
tals
sho
wn.
2 L
ess
than
½ u
nit.
Sour
ce:
U.S
. Cen
sus
Bur
eau.

Copper—2004 21.17
Bd
TA
BL
E 1
5
U.S
. EX
POR
TS
OF
CO
PPE
R S
EM
IMA
NU
FAC
TU
RE
S, B
Y C
OU
NT
RY
1
Pipe
s an
d tu
bing
Plat
es, s
heet
s, f
oil,
bars
are
wir
e, in
clud
ing
wir
e ro
Wir
e an
d ca
ble,
str
ande
dC
oppe
r su
lfat
e
Qua
ntity
Val
ueQ
uant
ityV
alue
Qua
ntity
Val
ueQ
uant
ityV
alue
Qua
ntity
Val
ue
Cou
ntry
(met
ric
tons
)(t
hous
ands
)(m
etri
c to
ns)
(tho
usan
ds)
(met
ric
tons
)(t
hous
ands
)(m
etri
c to
ns)
(tho
usan
ds)
(met
ric
tons
)(t
hous
ands
)
2003
23,9
00$7
6,70
020
,300
$73,
600
115,
000
$243
,000
28,0
00$1
42,0
002,
070
$1,9
40
2004
:
Aus
tral
ia8
715
774
122
127
2,49
0--
--
Bra
zil
8331
672
1,25
027
504
6169
2--
--
Can
ada
9,25
040
,400
9,55
043
,500
14,0
0044
,500
6,23
023
,800
818
934
Chi
na34
109
1,03
03,
930
472
1,30
01,
720
5,83
013
414
3
Den
mar
k(3
)17
(3)
412
467
66--
--
Fran
ce13
048
088
602
232
2,60
081
2,15
0--
--
Ger
man
y5
8756
73,
660
150
4,33
016
74,
340
5345
Hon
g K
ong
1040
2,06
09,
040
9284
019
12,
150
----
Ital
y11
446
334
247
817
049
317
----
Japa
n37
163
411
2,11
017
878
396
3,37
012
717
8
Kor
ea, R
epub
lic o
f1
1113
683
929
210
299
3,44
016
20
Mal
aysi
a21
51,
140
3433
748
384
2128
0--
--
Mex
ico
13,4
0051
,500
13,1
0039
,300
130,
000
398,
000
17,3
0092
,100
3650
Net
herl
ands
565
3936
223
509
114
3,32
015
12
Saud
i Ara
bia
271
2,52
015
9--
--15
348
7--
--
Sing
apor
e8
6118
41,
180
3919
269
1,22
05
10
Swed
en--
--10
165
1630
813
486
----
Tai
wan
5922
783
64,
100
4117
587
801
1632
Tha
iland
457
609
3,07
043
365
3536
3--
--
Uni
ted
Kin
gdom
5034
511
01,
550
5440
397
2,21
09
9
Oth
er1,
090
4,36
070
24,
890
2,08
08,
790
5,16
024
,900
212
280
Tot
al24
,800
102,
000
29,6
0012
0,00
014
8,00
046
4,00
032
,400
175,
000
1,44
01,
710
-- Z
ero.
1 Dat
a ar
e ro
unde
d to
no
mor
e th
an th
ree
sign
ific
ant d
igits
; may
not
add
to to
tals
sho
wn.
2 Tot
al r
evis
ed e
xpor
ts o
f w
ire
rod
in 2
003
wer
e 10
0,01
4 m
etri
c to
ns (
t) v
alue
d at
$19
7 m
illio
n, a
nd in
200
4, w
ire
rod
expo
rts
wer
e 12
8,53
6 t v
alue
d at
$38
9 m
illio
n.3 L
ess
than
½ u
nit.
Sour
ce:
U.S
. Cen
sus
Bur
eau,
adj
uste
d by
the
U.S
. Geo
logi
cal S
urve
y fo
r m
iscl
assi
fied
wir
e ro
d sh
ipm
ents
to M
exic
o.

21.18 U.S.GeoLoGICALSUrveyMINerALSyeArBook—2004
s
TA
BL
E 1
6
U.S
. IM
POR
TS
FOR
CO
NSU
MPT
ION
OF
UN
MA
NU
FAC
TU
RE
D C
OPP
ER
(C
OPP
ER
CO
NT
EN
T),
BY
CO
UN
TR
Y1
Ore
and
con
cent
rate
Mat
te, a
sh a
nd p
reci
pita
teB
liste
r an
d an
ode
Ref
ined
Una
lloye
d sc
rap
Tot
al
Qua
ntity
Val
ue2
Qua
ntity
Val
ue2
Qua
ntity
Val
ue2
Qua
ntity
Val
ue2
Qua
ntity
Val
ue2
Qua
ntity
Val
ue2
Cou
ntry
(met
ric
tons
)(t
hous
ands
)(m
etri
c to
ns)
(tho
usan
ds)
(met
ric
tons
)(t
hous
ands
)(m
etri
c to
ns)
(tho
usan
ds)
(met
ric
tons
)(t
hous
ands
)(m
etri
c to
ns)
(tho
usan
ds)
2003
27,1
00$1
6,60
01,
500
$2,0
3015
7,00
0$3
93,0
0088
2,00
0$1
,580
,000
19,6
00$2
4,60
01,
090,
000
$2,0
20,0
00
2004
:
Bra
zil
----
----
----
15,6
0047
,700
----
15,6
0047
,700
Can
ada
516
881
9934
875
,500
223,
000
278,
000
666,
000
6,37
013
,600
360,
000
904,
000
Chi
le--
----
--48
,900
130,
000
311,
000
875,
000
----
360,
000
1,00
0,00
0
Cos
ta R
ica
----
----
----
----
1,40
01,
260
1,40
01,
260
Dom
inic
an R
epub
lic--
----
----
----
--44
644
444
644
4
Finl
and
----
----
----
9427
2--
--94
272
Ger
man
y--
----
----
--21
,000
68,3
0048
1221
,000
68,3
00
Hon
dura
s--
----
----
----
--1,
430
1,98
014
31,
980
Japa
n--
--(3
)3
1940
4,38
015
,700
6569
54,
460
16,4
00
Mex
ico
22,4
0024
,100
206
115
8,63
029
,500
19,3
0055
,900
10,3
0013
,000
60,7
0012
3,00
0
Nam
ibia
----
----
7,71
022
,600
----
----
7,71
022
,600
Peru
----
----
10,2
0018
,300
152,
000
429,
000
5816
916
2,00
044
7,00
0
Tai
wan
----
1,33
03,
290
----
(3)
2--
--1,
330
3,29
0
Uni
ted
Kin
gdom
----
----
382
2718
055
42,
240
584
2,50
0
Oth
er--
--45
9313
976,
000
8,56
02,
770
3,61
010
,100
12,4
00
Tot
al22
,900
25,0
001,
680
3,85
015
1,00
042
3,00
080
7,00
02,
170,
000
23,4
0037
,100
1,01
0,00
02,
660,
000
-- Z
ero.
1 Dat
a ar
e ro
unde
d to
no
mor
e th
an th
ree
sign
ific
ant d
igits
; may
not
add
to to
tals
sho
wn.
2 Cos
t, in
sura
nce,
fre
ight
val
ue a
t U.S
. por
t.3 L
ess
than
½ u
nit.
Sour
ce:
U.S
. Cen
sus
Bur
eau.
Copper—2004 21.19
Qua
ntity
Val
ue3
Qua
ntity
Val
ue3
Qua
ntity
Val
ue3
Qua
ntity
Val
ue3
Qua
ntity
Val
ue3
Cou
ntry
(met
ric
tons
) (t
hous
ands
) (m
etri
c to
ns)
(tho
usan
ds)
(met
ric
tons
) (t
hous
ands
) (m
etri
c to
ns)
(tho
usan
ds)
(met
ric
tons
) (t
hous
ands
)
2003
75,1
00$2
08,0
0065
,500
$197
,000
230,
000
$474
,000
5,
990
$22,
100
50,9
00$3
7,60
0
2004
:
Aus
tral
ia--
--48
41,
580
----
130
----
Bra
zil
199
1,06
01,
000
4,16
015
,700
111,
000
1318
----
Bel
gium
(4)
2369
348
5234
1--
--97
096
5
Can
ada
193
1,08
08,
990
36,4
0014
3,00
042
0,00
01,
240
3,96
08,
600
8,57
0
Chi
le13
045
24,
440
16,2
002
4--
--79
63
Chi
na10
643
31,
230
5,43
064
293
2,10
04,
070
5,88
05,
130
Finl
and
5452
74,
230
19,3
0084
72,
880
4334
7--
--
Fran
ce(4
)50
3,38
012
,300
408
4,23
010
22,
180
380
392
Ger
man
y12
468
632
,900
115,
000
799
4,16
065
43,
640
6712
2
Isra
el--
--(4
)8
1714
11,
970
11,7
00--
--
Ital
y--
--3,
450
11,8
0011
957
104
1822
Japa
n(4
)7
4,21
031
,800
309
2,49
011
153
2013
5
Lux
embo
urg
----
477
4,88
0--
----
----
--
Mex
ico
2183
2,03
07,
790
39,2
0011
2,00
093
512
34,0
0033
,200
Nor
way
----
----
----
533
----
Peru
----
3,97
013
,600
704
2,30
029
997
078
368
1
Rus
sia
----
9034
329
,400
134,
000
----
139
102
Swed
en--
--9,
730
41,6
0032
154
1431
----
Tai
wan
(4)
1989
617
664
2,75
017
336
4,54
03,
080
Tur
key
----
----
9,90
040
,700
946
3,78
0--
--
Uni
ted
Kin
gdom
(4)
2168
43,
400
554
2,20
017
218
----
Oth
er13
064
02,
150
8,61
031
42,
580
388
2,02
054
040
3
Tot
al95
75,
090
83,6
0033
5,00
024
2,00
084
2,00
0
7,92
034
,100
56,1
0052
,900
TA
BL
E 1
7
U.S
. IM
POR
TS
FOR
CO
NSU
MPT
ION
OF
CO
PPE
R S
EM
IMA
NU
FAC
TU
RE
S, B
Y C
OU
NT
RY
1
Pipe
s an
d tu
bing
Plat
es, s
heet
s, f
oil,
bars
Bar
e w
ire,
incl
udin
g w
ire
rod2
Wir
e an
d ca
ble,
str
ande
dC
oppe
r su
lfat
e
4 Les
s th
an ½
uni
t.
Sour
ce:
U.S
. Cen
sus
Bur
eau.
-- Z
ero.
1 Dat
a ar
e ro
unde
d to
no
mor
e th
an th
ree
sign
ific
ant d
igits
; may
not
add
to to
tals
sho
wn.
2 Tot
al r
evis
ed im
port
s of
wir
e ro
d in
200
3 w
ere
212,
000
met
ric
tons
(t)
val
ued
at $
394
mill
ion,
and
in 2
004,
wir
e ro
d im
port
s w
ere
241,
910
t val
ued
at $
832
mill
ion.
3 C
ost,
insu
ranc
e, f
reig
ht v
alue
at U
.S. p
ort.

21.20 U.S.GeoLoGICALSUrveyMINerALSyeArBook—2004
TABLE 18
U.S. EXPORTS OF COPPER SCRAP, BY COUNTRY1
Unalloyed copper scrap Copper-alloy scrap
2003 2004 2003 2004
Quantity Value Quantity Value Quantity Value Quantity Value
Country (metric tons) (thousands) (metric tons) (thousands) (metric tons) (thousands) (metric tons) (thousands)
Belgium 2,630 $4,420 3,850 $4,490 6,010 $8,370 8,200 $8,930
Canada 21,200 20,600 33,300 43,500 17,500 23,200 15,000 27,000
China 225,000 233,000 222,000 257,000 245,000 174,000 239,000 220,000
Germany 7,900 8,510 8,830 15,300 7,680 7,310 13,800 20,600
Hong Kong 2,530 2,140 3,910 9,480 9,600 4,790 11,000 9,800
India 5,550 5,120 4,160 5,900 45,400 38,800 45,100 45,000
Japan 6,790 9,730 7,930 15,800 9,110 15,600 9,660 25,900
Korea, Republic of 25,400 32,500 22,400 40,900 15,500 25,600 16,300 40,000
Mexico 3,200 8,320 4,560 12,300 808 1,380 1,570 4,720
Taiwan 8,500 11,400 11,300 21,000 6,860 10,200 13,700 26,300
Other 6,650 6,920 3,060 4,210 10,000 11,800 15,800 23,600
Total 316,000 343,000 325,000 430,000 373,000 321,000 389,000 451,0001Data are rounded to no more than three significant digits; may not add to totals shown.
Source: U.S. Census Bureau.
TABLE 19
U.S. IMPORTS FOR CONSUMPTION OF COPPER SCRAP, BY COUNTRY1
Unalloyed copper scrap Copper-alloy scrap
Quantity Value2 Gross weight Copper contente, 3 Value2
Country or Territory (metric tons) (thousands) (metric tons) (metric tons) (thousands)
2003 19,600 $24,600 71,000 51,500 $99,600
2004:
Canada 6,370 13,600 44,500 32,100 90,400
Costa Rica 1,400 1,260 516 372 733
El Salvador 758 1,230 224 161 391
Germany 48 12 1,130 812 5,510
Guatemala 271 278 1,050 755 1,990
Honduras 1,430 1,980 625 450 685
Mexico 10,300 13,000 22,100 15,900 31,200
Taiwan -- -- 1,480 1,060 5,970
United Kingdom 554 2,240 1,030 740 2,690
Venezuela -- -- -- -- --
Other 2,310 3,410 5,610 4,040 10,800
Total 23,400 37,100 78,300 56,400 150,000eEstimated. -- Zero.1Data are rounded to no more than three significant digits; may not add to totals shown.2Cost, insurance, freight value at U.S. port.3Content is estimated by U.S. Geological Survey to be 72% of gross weight.
Source: U.S. Census Bureau.

Copper—2004 21.21
TABLE 20
COPPER: WORLD MINE PRODUCTION, BY COUNTRY1, 2
(Metric tons)
Country 2000 2001 2002 2003 2004e
Argentina 145,197 191,667 r 204,029 r 199,020 r 177,143 3
Armenia 12,234 16,460 16,641 18,000 e 17,700
Australia:
Concentrates 732,000 769,000 787,000 763,000 795,800 3
Leaching, electrowon 97,000 102,000 96,000 e 67,000 58,300 3
Total 829,000 871,000 883,000 e 830,000 854,100 3
Bolivia 110 18 e 3 182 r 182
Botswana4 20,977 19,209 21,182 24,289 r 21,195 3
Brazil 31,786 32,734 r 32,711 r 26,275 r 98,700 3
Bulgaria 92,000 88,000 92,800 91,700 93,000
Burma:
Concentratese 100 -- -- -- --
Leaching, electrowon 26,711 25,800 r 27,500 r 27,900 31,756 3
Total 26,811 25,800 r 27,500 r 27,900 31,756 3
Canada, concentrates 633,855 633,531 603,498 557,082 r 563,741 3
Chile:5
Concentrates 3,229,800 3,200,800 2,979,000 3,251,100 r 3,776,200 p, 3
Leaching, electrowon 1,372,600 1,538,200 1,602,000 1,653,100 r 1,636,300 p, 3
Total 4,602,400 4,739,000 4,581,000 4,904,200 r 5,412,500 p, 3
China:e
Concentrates 593,000 587,000 568,000 r 610,000 r 610,000
Leaching, electrowon 20,000 18,000 25,000 10,000 r 10,000
Total 613,000 605,000 593,000 r 620,000 r 620,000
Colombia 2,062 2,192 1,853 1,599 1,600
Congo (Kinshasa):e, 6
Concentrates 21,000 38,000 28,300 29,100 33,800
Leaching, electrowon -- r -- r 9,600 r 34,800 r 42,000
Total 21,000 38,000 r 37,900 63,900 75,800
Cubae 1,346 3 1,000 r 1,000 r -- --
Cyprus, leaching, electrowon 5,197 5,176 3,695 r 2,552 r 1,240 3
Ecuadore 100 100 100 100 100
Finland 14,354 13,715 14,400 14,900 15,500
Georgiae 8,000 8,000 10,000 12,000 12,000
India 31,900 32,400 31,500 28,500 r 28,800 3
Indonesia6 1,012,054 1,081,040 1,171,726 r 1,005,831 r 840,318 3
Iran:e
Concentrates 125,000 121,000 121,000 130,000 178,000
Leaching, electrowon 10,000 12,000 12,000 12,000 12,000
Total 135,000 133,000 133,000 142,000 190,000
Japan 1,211 744 750 e 1,300 r 790
Kazakhstane 430,000 470,100 3 490,000 485,000 461,000 3
Korea, Northe 12,000 r 12,000 r 12,000 r 12,000 r 12,000
Macedoniae 6,000 r 9,000 r 5,600 r 4,000 r 5,000
Mexico:
Concentrates 308,966 310,623 260,574 284,653 r 333,540 3
Leaching, electrowon 55,600 60,500 69,000 e 71,000 r 72,000
Total 364,566 371,123 329,574 355,653 r 405,540 3
Mongolia 125,227 133,503 131,705 131,600 132,000
Morocco 7,080 5,800 5,000 4,900 4,900
Namibia 5,620 12,392 18,012 16,200 r 13,800
Pakistan -- -- -- 3,200 15,000
Papua New Guinea 200,900 218,000 e 211,311 190,200 173,400 3
See footnotes at end of table.

21.22 U.S.GeoLoGICALSUrveyMINerALSyeArBook—2004
TABLE 20—Continued
COPPER: WORLD MINE PRODUCTION, BY COUNTRY1, 2
(Metric tons)
Country 2000 2001 2002 2003 2004e
Peru:
Concentrates 426,614 590,896 686,748 660,025 868,574 3
Leaching, electrowon 127,310 131,139 156,465 171,198 167,000 3
Total 553,924 722,035 843,213 831,223 1,035,574 3
Philippines 30,644 20,322 18,364 20,400 6,000 3
Poland 454,100 474,000 502,800 495,000 531,000 3
Portugal 76,200 82,900 77,000 e 78,000 96,000
Romania7 16,079 19,185 18,962 21,317 20,000
Russiae 570,000 600,000 695,000 675,000 675,000
Saudi Arabiae 900 800 800 800 500
Serbia and Montenegroe 86,100 r 31,000 r 36,900 r 26,400 r 30,000South Africa 137,092 141,865 129,589 89,500 e 87,000Spain 23,312 9,700 -- -- e --
Sweden 77,765 74,269 72,100 83,100 r 85,500Tanzania, in concentrates and bullion -- 2,645 2,700 3,303 r 3,400
Turkey7 76,253 56,864 48,253 58,000 e 49,000
United States:6
Concentrates 887,000 714,000 601,000 525,000 576,000 3
Leaching, electrowon 557,000 624,000 542,000 591,000 584,000 3
Total 1,440,000 1,340,000 1,140,000 1,120,000 1,160,000 3
Uzbekistane 70,000 78,000 80,000 80,000 80,000Zambia:
Concentrates 184,100 233,000 251,100 269,000 r 344,300 3
Leaching, electrowon 65,000 79,000 78,900 80,000 82,600Total 249,100 312,000 8 330,000 349,000 r 426,900 3
Zimbabwe, concentrates 2,104 2,057 2,502 2,767 r 2,383 3
Grand total 13,300,000 r 13,700,000 13,700,000 r 13,700,000 r 14,600,000
Of which:
Concentrates 10,900,000 11,100,000 11,000,000 11,000,000 r 11,900,000
Leaching, electrowon 2,340,000 r 2,600,000 r 2,620,000 r 2,720,000 r 2,700,000eEstimated. pPreliminary. rRevised. -- Zero.1World totals, U.S. data, and estimated data are rounded to no more than three significant digits; may not add to totals shown.2Table represent copper content by analysis of concentrates produced (includes cement copper, if applicable), except where otherwisenoted.
Table includes data available through July 22, 2005.3Reported figure.4Copper content of pelletized nickel-copper matte produced in smelter.5Reported by Comision Chilena del Cobre. Includes recoverable copper content of nonduplicative mine and metal products producedfrom domestic ores and concentrates and leach production for electrowinning.6Recoverable content.7Excludes copper content of pyrite.8Data are for fiscal years beginning April 1 of year stated.

Copper—2004 21.23
TABLE 21
COPPER: WORLD SMELTER PRODUCTION, BY COUNTRY1, 2
(Metric tons, gross weight)
Country 2000 2001 2002 2003 2004e
Armenia, primarye 4,000 4,000 6,700 7,500 7,500
Australia, primary 394,000 455,000 458,000 e 435,000 443,000 3
Austria, secondary 70,000 e 68,642 64,932 75,000 r 88,000
Belgium, secondary 144,700 138,200 125,900 117,500 120,700 3
Botswana, primary4 18,722 19,209 21,590 27,400 r, e 21,400
Brazil, primary 185,345 212,243 189,651 173,373 r 186,000
Bulgaria:
Primary 173,000 152,000 167,000 199,300 220,000
Secondarye 5,000 5,000 15,000 16,000 7,000
Total 178,000 157,000 182,000 215,300 227,000
Canada:
Primary 543,593 601,359 513,934 430,116 446,221 3
Secondary 60,109 41,640 24,761 26,789 29,962 3
Total 603,702 642,999 538,695 456,905 476,183 3
Chile, primary 1,460,400 1,503,200 r 1,438,700 r 1,542,400 1,563,800 3
China:e
Primary 1,020,000 1,120,000 1,180,000 1,380,000 r 1,400,000
Secondary 180,000 190,000 310,000 350,000 440,000
Total 1,200,000 1,310,000 1,490,000 1,730,000 r 1,840,000
Congo (Kinshasa), primary, electrowone -- r -- r -- r -- r --
Finland:
Primary 155,400 169,300 160,900 160,600 170,400 3
Secondarye 2,000 2,000 2,000 2,000 2,000
Total 157,400 171,300 162,900 162,600 172,400 3
Germany:
Primary 310,000 r 303,000 r 327,100 r 288,800 278,600 3
Secondary 399,472 r 390,773 r 368,791 r 306,600 r 262,600 3
Total 709,472 r 693,773 r 695,891 r 595,400 r 541,200 3
India, primarye 256,000 293,000 385,400 3 391,000 400,900 3
Indonesia, undifferentiated 173,726 217,500 211,200 247,400 211,600 3
Iran, undifferentiatede, 5 135,000 135,000 146,000 150,000 209,000
Japan:
Primary 1,331,352 1,328,489 1,317,291 1,343,353 1,270,495 3
Secondary 149,282 139,764 182,069 172,724 194,927 3
Total 1,480,634 1,468,253 1,499,360 1,516,077 1,465,422 3
Kazakhstan, undifferentiated 413,859 433,600 446,200 431,930 445,200 3
Korea, North, primary and secondarye 15,000 r 15,000 r 15,000 r 15,000 r 15,000
Korea, Republic of, undifferentiated 424,100 r 428,500 r 430,000 r 460,000 e 430,000 3
Mexico:
Primary 297,000 r 310,000 r 248,000 r 220,100 r 285,000
Secondarye 5,000 5,000 5,000 5,000 5,000
Total 302,000 r 315,000 r 253,000 r 225,100 r 290,000
Namibia, primary6, 7 5,082 27,015 26,703 26,036 24,700
Oman, primary 23,790 24,200 24,000 17,000 e 24,000
Peru, primary 366,700 396,400 379,600 r 376,100 r 397,800 3
Philippines, primary 160,000 165,000 165,800 227,900 220,000
Poland:
Primary 462,800 485,900 511,000 516,500 r 541,000
Secondarye 19,700 27,900 30,000 30,000 30,000
Total 482,500 513,800 541,000 546,500 r 571,000 3
Romania:
Primary 16,429 9,279 8,871 4,493 r 61 3
Secondarye 2,000 2,000 2,000 500 --
Total 18,429 11,279 10,871 4,993 r 61 3
See footnotes at end of table.
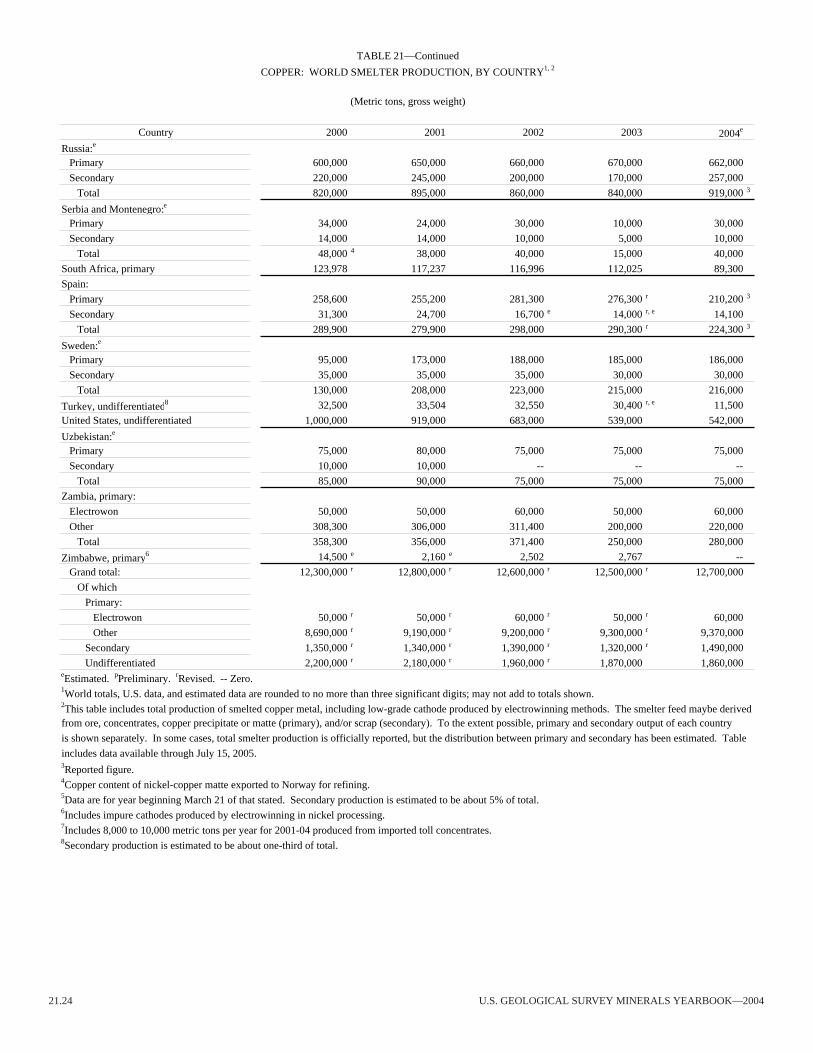
21.24 U.S.GeoLoGICALSUrveyMINerALSyeArBook—2004
TABLE 21—Continued
COPPER: WORLD SMELTER PRODUCTION, BY COUNTRY1, 2
(Metric tons, gross weight)
Country 2000 2001 2002 2003 2004e
Russia:e
Primary 600,000 650,000 660,000 670,000 662,000
Secondary 220,000 245,000 200,000 170,000 257,000
Total 820,000 895,000 860,000 840,000 919,000 3
Serbia and Montenegro:e
Primary 34,000 24,000 30,000 10,000 30,000
Secondary 14,000 14,000 10,000 5,000 10,000
Total 48,000 4 38,000 40,000 15,000 40,000
South Africa, primary 123,978 117,237 116,996 112,025 89,300
Spain:
Primary 258,600 255,200 281,300 276,300 r 210,200 3
Secondary 31,300 24,700 16,700 e 14,000 r, e 14,100
Total 289,900 279,900 298,000 290,300 r 224,300 3
Sweden:e
Primary 95,000 173,000 188,000 185,000 186,000
Secondary 35,000 35,000 35,000 30,000 30,000
Total 130,000 208,000 223,000 215,000 216,000
Turkey, undifferentiated8 32,500 33,504 32,550 30,400 r, e 11,500
United States, undifferentiated 1,000,000 919,000 683,000 539,000 542,000
Uzbekistan:e
Primary 75,000 80,000 75,000 75,000 75,000
Secondary 10,000 10,000 -- -- --
Total 85,000 90,000 75,000 75,000 75,000
Zambia, primary:
Electrowon 50,000 50,000 60,000 50,000 60,000
Other 308,300 306,000 311,400 200,000 220,000
Total 358,300 356,000 371,400 250,000 280,000
Zimbabwe, primary6 14,500 e 2,160 e 2,502 2,767 --
Grand total: 12,300,000 r 12,800,000 r 12,600,000 r 12,500,000 r 12,700,000
Of which
Primary:
Electrowon 50,000 r 50,000 r 60,000 r 50,000 r 60,000
Other 8,690,000 r 9,190,000 r 9,200,000 r 9,300,000 r 9,370,000
Secondary 1,350,000 r 1,340,000 r 1,390,000 r 1,320,000 r 1,490,000
Undifferentiated 2,200,000 r 2,180,000 r 1,960,000 r 1,870,000 1,860,000eEstimated. pPreliminary. rRevised. -- Zero.1World totals, U.S. data, and estimated data are rounded to no more than three significant digits; may not add to totals shown.2This table includes total production of smelted copper metal, including low-grade cathode produced by electrowinning methods. The smelter feed maybe derivedfrom ore, concentrates, copper precipitate or matte (primary), and/or scrap (secondary). To the extent possible, primary and secondary output of each country
is shown separately. In some cases, total smelter production is officially reported, but the distribution between primary and secondary has been estimated. Table
includes data available through July 15, 2005.3Reported figure.4Copper content of nickel-copper matte exported to Norway for refining.5Data are for year beginning March 21 of that stated. Secondary production is estimated to be about 5% of total.6Includes impure cathodes produced by electrowinning in nickel processing.7Includes 8,000 to 10,000 metric tons per year for 2001-04 produced from imported toll concentrates.8Secondary production is estimated to be about one-third of total.

Copper—2004 21.25
TABLE 22
COPPER: WORLD REFINERY PRODUCTION, BY COUNTRY1, 2
(Metric tons)
Country 2000 2001 2002 2003e 2004
Argentina, secondarye 16,000 16,000 16,000 16,000 16,000
Australia:e
Electrowon 97,000 102,000 96,000 67,400 3 58,300
Primary 390,000 456,000 449,000 416,600 3 431,800
Total 487,000 558,000 545,000 484,000 3 490,100
Austria:e
Primary 2,000 -- -- -- --
Secondary 77,000 69,000 65,000 75,000 88,000
Total 79,000 3 69,000 65,000 75,000 88,000
Belgium:e
Primary4 236,100 3 236,000 207,000 208,000 223,000
Secondary 187,000 187,000 216,000 215,000 174,000
Total 423,100 423,000 423,000 423,000 397,000
Brazil, primary 185,345 212,243 189,651 173,900 r, 3 174,000 e
Bulgaria:e
Primary 27,500 29,400 3 38,000 43,000 r 52,300
Secondary 5,000 5,000 3,000 2,000 r 3,000
Total 32,500 34,400 41,000 45,000 r 55,300
Burma, electrowon 26,711 25,800 r 27,500 r 27,900 31,800
Canada:
Primary 490,093 524,920 513,934 430,116 3 495,900
Secondary 61,300 42,800 24,761 26,789 3 31,100
Total 551,393 567,720 538,695 456,905 3 527,000
Chile:
Electrowon 1,372,600 1,538,200 1,602,000 1,653,100 r, 3 1,636,300
Primary 1,295,700 1,344,000 1,248,100 1,248,800 r, 3 1,258,800
Total 2,668,300 2,882,200 2,850,100 2,901,900 r, 3 2,895,100
China:e
Electrowon 20,800 18,000 20,000 10,000 10,000
Primary 1,003,000 1,200,000 1,280,000 1,420,000 r 1,600,000
Secondary 347,000 300,000 350,000 430,000 r 520,000
Total 1,370,800 3 1,518,000 3 1,650,000 1,860,000 r 2,130,000
Congo (Kinshasa), primary -- r -- r -- r -- r --
Cyprus, electrowon 5,197 5,176 3,695 r 2,552 r, 3 1,240
Egypt, secondarye 4,000 r 4,000 r 4,000 r 4,000 4,000
Finland:e
Primary 100,000 105,000 112,000 r 120,000 128,000
Secondary 14,000 15,000 15,000 16,000 16,000
Total 114,000 120,000 127,000 r 136,000 144,000
France, secondarye 1,500 -- -- -- --
Germany:
Primary 245,000 352,400 r 330,900 242,500 r, 3 283,700 p
Secondary 464,400 r 341,400 r 364,900 355,000 r, 3 369,000 p
Total 709,400 r 693,800 r 695,800 597,500 r, 3 652,700 p
Hungary, secondarye 12,000 10,000 10,000 10,000 10,000
India:e
Primary, electrolytic 234,000 310,000 3 354,000 375,000 381,000
Secondary 9,000 18,000 20,000 19,000 20,000
Total 243,000 328,000 374,000 394,000 401,000
Indonesia, primary 158,400 212,500 192,400 223,300 3 210,500
Iran:5
Electrowone 10,000 12,000 12,000 12,000 12,000
Primary6 132,000 132,000 143,000 134,632 3 190,000 e
Total 142,000 144,000 155,000 146,632 3 202,000 e
See footnotes at end of table.

21.26 U.S.GeoLoGICALSUrveyMINerALSyeArBook—2004
TABLE 22—Continued
COPPER: WORLD REFINERY PRODUCTION, BY COUNTRY1, 2
(Metric tons)
Country 2000 2001 2002 2003e 2004
Italy, secondary 32,800 35,500 32,400 26,700 30,000
Japan:
Primary 1,292,351 1,287,165 1,211,111 1,251,728 3 1,188,491Secondary 149,260 138,526 189,968 178,637 3 191,653
Total 1,441,611 1,425,691 1,401,079 1,430,365 3 1,380,144
Kazakhstan, primary 394,722 425,700 453,000 432,901 3 445,200
Korea, North, primarye 13,000 r 13,000 r 13,000 r 13,000 r 13,000Korea, Republic of, primary 467,900 473,624 495,400 r 505,900 r, 3 491,900Mexico:
Primary:
Electrowon 55,600 59,800 69,100 76,000 r 72,000 e
Other 340,400 333,000 215,000 r, e 199,000 r 239,000 e
Secondarye 15,000 15,000 35,000 35,000 35,000
Totale 411,000 407,800 3 319,100 r, e 310,000 346,000
Mongolia, electrowon 641 1,476 1,500 1,341 r, 3 1,500 e
Norway, primary6 27,000 e 26,700 30,500 e 35,900 3 35,600
Oman, primarye 24,281 3 24,000 24,000 17,000 17,000Peru: .
Primary:
Electrowon 127,311 131,139 156,465 171,198 3 167,000
Other 324,417 340,736 346,277 345,848 3 338,308Total 451,728 471,875 502,742 517,046 3 505,308
Philippines, primary 159,000 164,530 144,315 171,200 3 175,000Poland:
Primary 498,100 498,451 508,674 510,000 510,000Secondary 19,700 30,286 19,146 20,000 20,000
Total 517,800 528,737 527,820 530,000 530,000
Romania:
Primary 13,803 18,500 11,453 16,739 r, 3 24,383
Secondarye 4,000 4,000 2,000 2,000 2,000Total 17,803 22,500 e 13,453 18,739 r, 3 26,383
Russia:
Primary 620,000 650,000 670,000 e 670,000 662,000
Secondary 220,000 244,500 200,000 e 170,000 257,000
Total 840,000 894,500 870,000 e 840,000 919,000
Serbia and Montenegro:
Primary 45,602 32,365 35,897 9,000 r 25,000
Secondarye 14,000 10,000 10,000 5,000 r 10,000Total 59,602 42,365 45,897 14,000 r 35,000
South Africa, primary6 105,500 104,700 99,100 93,300 3 91,295
Spain:e
Primary 258,000 235,100 3 272,000 259,000 193,200 3
Secondary 58,000 55,600 3 37,000 35,000 35,000Total 316,000 290,700 3 309,000 294,000 3 228,200 3
Sweden:e
Primary 105,000 179,000 3 199,000 189,000 210,000Secondary 25,000 25,000 25,000 25,000 25,000
Total 130,000 204,000 3 224,000 214,000 235,000
Taiwan, secondarye 4,000 4,000 4,000 4,000 4,000Thailand, primary -- -- -- -- 20,000
Turkey:e
Primary 59,100 54,400 39,000 40,000 45,000Secondary 5,000 4,000 2,000 5,000 5,000
Total 64,100 58,400 41,000 45,000 50,000See footnotes at end of table.

Copper—2004 21.27
TABLE 22—Continued
COPPER: WORLD REFINERY PRODUCTION, BY COUNTRY1, 2
(Metric tons)
Country 2000 2001 2002 2003e 2004
Ukraine, secondary -- -- 10 20 20
United Kingdom, secondarye 3 3 -- -- -- --
United States:
Primary:
Electrowon 566,000 628,000 600,000 591,000 3 584,000Other 1,030,000 1,000,000 841,000 662,000 3 671,000
Secondary 208,000 172,000 69,900 53,300 3 50,800Total 1,800,000 1,800,000 1,510,000 1,310,000 3 1,310,000
Uzbekistan:e
Primary 75,000 80,000 75,000 75,000 75,000Secondary 10,000 10,000 -- -- --
Total 85,000 90,000 75,000 75,000 75,000
Zambia, primary:
Electrowon7 50,000 79,000 83,700 109,000 r, 3 120,900Other 227,400 217,500 253,100 240,800 r, 3 277,300
Total 277,400 296,500 336,800 349,800 r, 3 398,200
Zimbabwe, primary 7,200 e 5,300 e 2,502 r 2,767 r, 3 2,383Grand total 14,900,000 15,600,000 r 15,400,000 r 15,200,000 15,800,000
Of which:
Primary:
Electrowon 2,330,000 2,600,000 2,670,000 2,720,000 r 2,700,000Other 10,600,000 11,300,000 11,000,000 r 10,800,000 r 11,200,000
Secondary 1,960,000 r 1,760,000 r 1,720,000 1,730,000 r 1,920,000eEstimated. pPreliminary. rRevised. -- Zero.1World totals, U.S. data, and estimated data are rounded to no more than three significant digits; may not add to totals shown.2This table includes total production of refined copper whether produced by pyrometallurgical or electrolytic refining methods and whether derived from primary unrefined copper or from scrap. Copper cathode derived from electrowinning processing is also included. Table includes data available through
July 22, 2005.3Reported figure.4Includes reprocessed leach cathode from Congo (Kinshasa).5Data are for Iranian years beginning March 21 of that stated.6May include secondary.7Electrowon covers only high-grade electrowon cathodes reported as "finished production leach cathodes."