by barry lipton, david colón, and john robertson …€¦ · 1 september 2013 by barry lipton,...
TRANSCRIPT
1
September 2013
by Barry Lipton, David Colón, and John Robertson WORKERS COMPENSATION
PRESCRIPTION DRUG STUDY:
2013 UPDATE
INTRODUCTION
With medical expenditures growing at a faster rate than indemnity benefits in workers compensation (WC), NCCI periodically re-examines WC prescription drug (Rx) costs, which have been a significant driver of medical costs.
NCCI has performed several studies on the use of prescription drugs in WC. Our initial report, published in 2003 (see [1] in references), showed that utilization (as opposed to price) increases were the driving force behind total per-claim WC Rx cost increases. Several drugs, such as Actiq, Mobic, and OxyContin have shown significant changes in market share since 2003. In our most recent study, from 2011 [2], NCCI demonstrated that increased physician dispensing is associated with increased drug costs per claim. All of our previous studies are available on ncci.com.
KEY FINDINGS
Prescription costs per claim continue to grow
Utilization is a major driver of total cost changes
The share of Rx costs for physician-dispensed drugs continues to increase
Narcotics account for 25% of drug costs
More than 45% of narcotics costs are for drugs with Oxycodone HCL as an active ingredient
OUTLINE
The major topics covered in this report are:
The countrywide share of WC medical costs due to prescription drugs
The impact of price and utilization changes on those costs
Prescribing patterns
Physician dispensing
Use of narcotics in WC
STUDY DATA
Two WC data sources were used in this study—sample data provided by carriers and NCCI’s Medical Data Call (MDC). Both of these data sources include medical services for both lost-time and medical-only claims.
The sample data provided by carriers is nationwide1 data and includes services provided from 1996 to 2011 for claims
occurring from 1994 to 2011, evaluated as of June 2012.
1 Nationwide sample provided by carriers (excluding ND, OH, WA, WV, and WY)
Prescription Costs per Medical Claim Vary by State

2
The MDC data used captures transaction-level detail on medical services provided during 2011, evaluated as of March 2012. NCCI collects the Call for the 35 jurisdictions where NCCI provides ratemaking services and for seven additional states on behalf of the independent state rating organizations in those states.
2
“Prescription drug” or “Rx”, as used in this study, is defined as a drug identified with a National Drug Code (NDC) or a carrier-specialized drug code. Drug costs that are bundled with other services and included in codes such as Hospital Revenue Codes, Healthcare Common Procedure Code System (HCPCS), or Current Procedural Terminology (CPT) are not included in this study.
TERMINOLOGY
A few terms we will use throughout this study are:
Accident Year (AY)—The year in which an injury occurs.
Service Year (SY)—The year in which services are performed.
Relative Service Year (RSY)—The year in which services are performed relative to the accident year. For example, a service performed in 2011 for an accident that occurred in 2009 would be in the third relative service year.
2 The 35 jurisdictions for which NCCI provides ratemaking services are AK, AL, AR, AZ, CO, CT, DC, FL, GA, HI, IA, ID, IL, KS, KY, LA, MD,
ME, MO, MS, MT, NE, NH, NM, NV, OK, OR, RI, SC, SD, TN, UT, VA, VT, and WV. The seven independent bureau states for which NCCI collects the Medical Data Call are IN, MA, MN, NC, NJ, NY, and WI.

3
RX SHARE OF TOTAL MEDICAL
Exhibit 1 displays our current and prior [2] best estimates of the Rx share of total medical costs by accident year.3
Here, the Rx share of total medical cost is the estimated ultimate ratio of Rx to medical costs in WC. The general upward trend in the estimates is indicative of a faster Rx cost growth than total medical cost growth. In the most recent accident years, the cost growth has flattened.
3 WC looks at costs by accident year because insurance coverage continues (potentially for many years) following the date of injury in WC. This
“long-tail” feature of WC is distinct from most other lines of insurance coverage, which are usually confined to the 12-month policy year for which premium is charged. As a result, other types of insurance coverage are much more sensitive to short-term increases in costs, while WC is subject to substantial long-term cost pressures.
Source: Derived from nationwide sample provided by carriers (excluding ND, OH, WA, WV, and WY)
Prior Study: “Workers Compensation Prescription Drug Study—2011 Update” available at ncci.com
Exhibit 1
18% 18% 18%
19%
10%
15%
20%
1999 2000 2001 2002 2003 2004 2005 2006 2007 2008 2009 2010 2011
Es
tim
ate
d R
x S
hare
of
To
tal M
ed
ica
l a
t U
ltim
ate
Accident Year
The Indicated Rx Share of Total Medical Remains Relatively Stable
Best Estimate(Current Study)
Best Estimate(Prior Study)

4
The estimated ultimate shares are based on the observed and projected incremental shares4 of Rx paid to total
medical paid, shown in Exhibits 2 and 3, and on an estimated payout pattern for total medical.
The observed and projected incremental Rx shares for Relative Service Years 1 through 9 are shown in Exhibit 2. As observed in prior studies, incremental Rx shares generally display two distinct patterns:
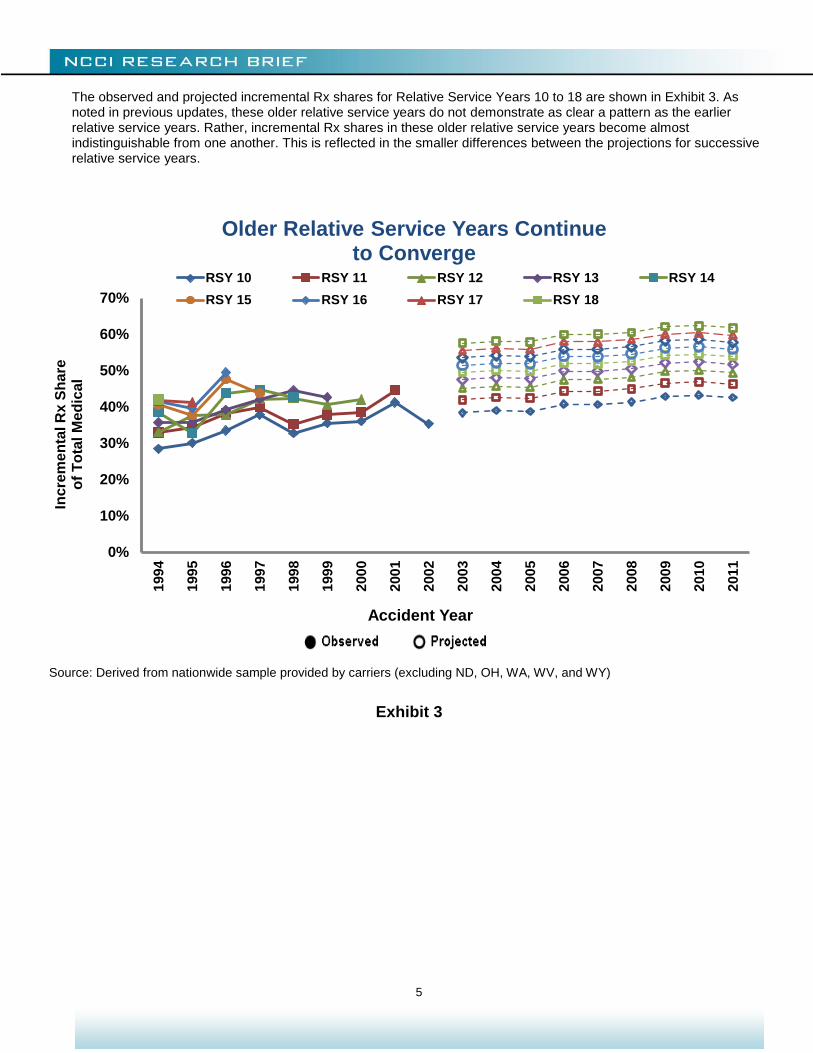
1. The shares increase as claims age. The later relative service years have systematically higher Rx shares of total medical than the earlier relative service years. Rx costs for one- to two-year-old claims compose only around 3% of total medical costs, but as shown in Exhibit 3, Rx costs on claims more than 11 years old make up more than 40% of the incremental medical costs.
2. For more recent accident years, the Rx share of total medical costs is greater than for older accident years, as evidenced by the general upward trend of each line.
The projections are based on a statistical model that gives consideration to trends by service year, relative service year, and accident year. Details are given in Appendix 1.
4 The incremental Rx share of total medical costs is defined as WC Rx costs for a given relative service year and accident year divided by WC
medical costs for the same relative service year and accident year.
Source: Derived from nationwide sample provided by carriers (excluding ND, OH, WA, WV, and WY)
Exhibit 2
0%
5%
10%
15%
20%
25%
30%
35%
40%
45%
1994
1995
1996
1997
1998
1999
2000
2001
2002
2003
2004
2005
2006
2007
2008
2009
2010
2011
Inc
rem
en
tal R
x S
hare
o
f To
tal M
ed
ica
l
Accident Year
Incremental Rx Share of Medical Costs Remain Relatively Stable
RSY 1 RSY 2 RSY 3 RSY 4 RSY 5
RSY 6 RSY 7 RSY 8 RSY 9
5
The observed and projected incremental Rx shares for Relative Service Years 10 to 18 are shown in Exhibit 3. As noted in previous updates, these older relative service years do not demonstrate as clear a pattern as the earlier relative service years. Rather, incremental Rx shares in these older relative service years become almost indistinguishable from one another. This is reflected in the smaller differences between the projections for successive relative service years.
Source: Derived from nationwide sample provided by carriers (excluding ND, OH, WA, WV, and WY)
Exhibit 3
0%
10%
20%
30%
40%
50%
60%
70%
199
4
199
5
199
6
199
7
199
8
199
9
200
0
200
1
200
2
200
3
200
4
200
5
200
6
200
7
2008
200
9
201
0
2011
Incre
me
nta
l R
x S
ha
re
of
To
tal M
ed
ical
Accident Year
Older Relative Service Years Continue to Converge
RSY 10 RSY 11 RSY 12 RSY 13 RSY 14
RSY 15 RSY 16 RSY 17 RSY 18
6
PRICE AND UTILIZATION
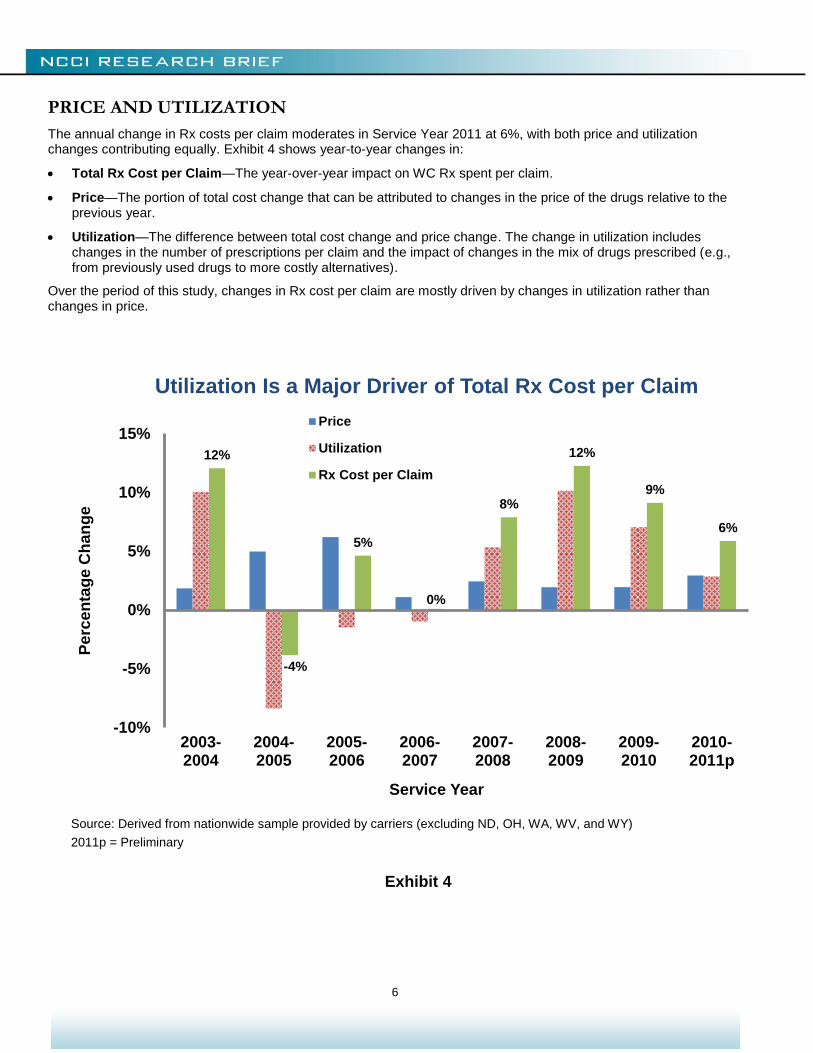
The annual change in Rx costs per claim moderates in Service Year 2011 at 6%, with both price and utilization changes contributing equally. Exhibit 4 shows year-to-year changes in:
Total Rx Cost per Claim—The year-over-year impact on WC Rx spent per claim.
Price—The portion of total cost change that can be attributed to changes in the price of the drugs relative to the previous year.
Utilization—The difference between total cost change and price change. The change in utilization includes changes in the number of prescriptions per claim and the impact of changes in the mix of drugs prescribed (e.g., from previously used drugs to more costly alternatives).
Over the period of this study, changes in Rx cost per claim are mostly driven by changes in utilization rather than changes in price.
Source: Derived from nationwide sample provided by carriers (excluding ND, OH, WA, WV, and WY)
2011p = Preliminary
Exhibit 4
12%
-4%
5%
0%
8%
12%
9%
6%
-10%
-5%
0%
5%
10%
15%
2003-2004
2004-2005
2005-2006
2006-2007
2007-2008
2008-2009
2009-2010
2010-2011p
Pe
rce
nta
ge C
han
ge
Service Year
Utilization Is a Major Driver of Total Rx Cost per Claim
Price
Utilization
Rx Cost per Claim
7
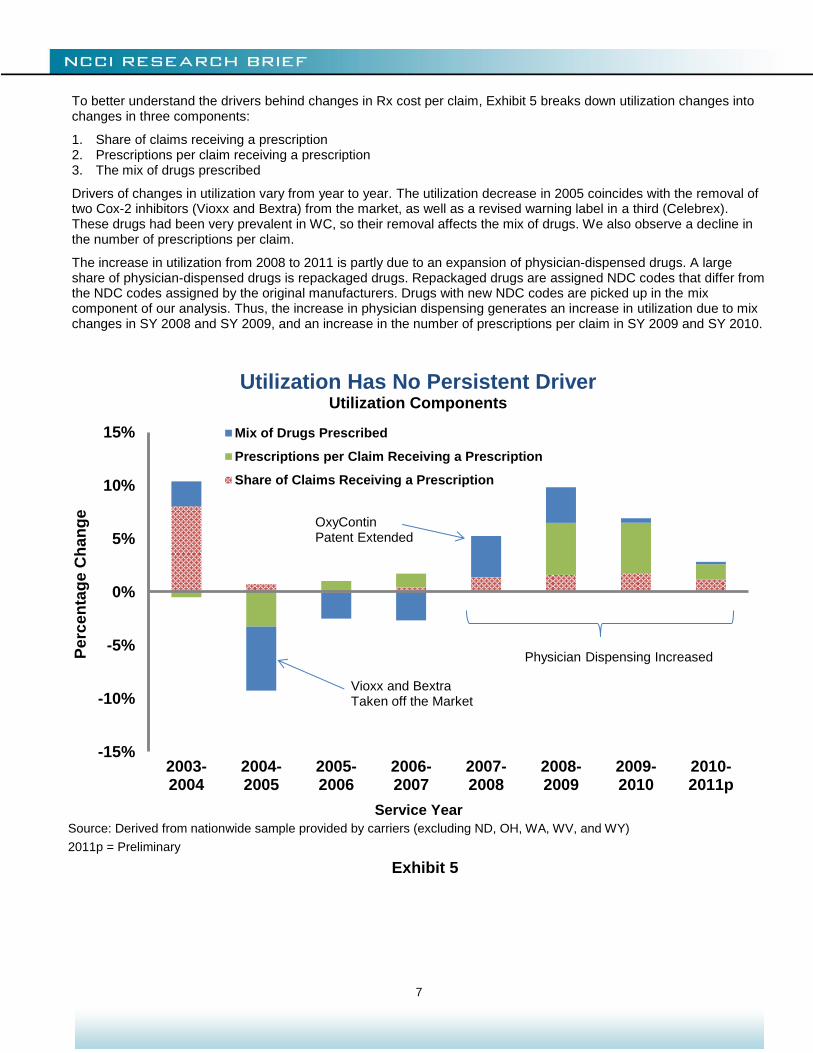
To better understand the drivers behind changes in Rx cost per claim, Exhibit 5 breaks down utilization changes into changes in three components:
1. Share of claims receiving a prescription 2. Prescriptions per claim receiving a prescription 3. The mix of drugs prescribed
Drivers of changes in utilization vary from year to year. The utilization decrease in 2005 coincides with the removal of two Cox-2 inhibitors (Vioxx and Bextra) from the market, as well as a revised warning label in a third (Celebrex). These drugs had been very prevalent in WC, so their removal affects the mix of drugs. We also observe a decline in the number of prescriptions per claim.
The increase in utilization from 2008 to 2011 is partly due to an expansion of physician-dispensed drugs. A large share of physician-dispensed drugs is repackaged drugs. Repackaged drugs are assigned NDC codes that differ from the NDC codes assigned by the original manufacturers. Drugs with new NDC codes are picked up in the mix component of our analysis. Thus, the increase in physician dispensing generates an increase in utilization due to mix changes in SY 2008 and SY 2009, and an increase in the number of prescriptions per claim in SY 2009 and SY 2010.
Source: Derived from nationwide sample provided by carriers (excluding ND, OH, WA, WV, and WY)
2011p = Preliminary
Exhibit 5
-15%
-10%
-5%
0%
5%
10%
15%
2003-2004
2004-2005
2005-2006
2006-2007
2007-2008
2008-2009
2009-2010
2010-2011p
Pe
rce
nta
ge
Ch
an
ge
Service Year
Utilization Has No Persistent Driver Utilization Components
Mix of Drugs Prescribed
Prescriptions per Claim Receiving a Prescription
Share of Claims Receiving a Prescription
Vioxx and Bextra Taken off the Market
OxyContin Patent Extended
Physician Dispensing Increased

8
Exhibit 6 shows that most of the growth in Rx cost per claim since 2007 is due to the growth in cost per claim of physician-dispensed drugs. Physician-dispensed Rx average cost per claim grew by about 25% in Service Year 2008, from $24 to $30, and doubled over the next three years. However, Rx cost per claim for drugs dispensed by others had a steady growth of about 5% per year during the same period.
Physician dispensing has contributed to the growth in the number of prescriptions per claim, as shown in Exhibit 7. Between 2007 and 2011, the number of prescriptions per claim dispensed by a physician has increased 14%, from 1.4 to 1.6, although the peak was in 2009, at 1.9. In comparison, the number of prescriptions per claim dispensed by others increased by 8% during the same period, from 3.9 to 4.2. Later sections of this report provide additional analysis of physician dispensing.
Source: Derived from nationwide sample provided by carriers (excluding ND, OH, WA, WV, and WY)
Relative Service Years (RSY) 1 through 10
Claim counts based on claims with a medical service by RSY 2 (AY 2011 is projected)
Exhibit 6
$150 $166 $158 $165 $166 $175
$189 $200 $205
$19
$23 $23
$25 $24 $30
$40
$51 $60
$168
$188 $181
$189 $190 $205
$230
$251 $265
$0
$50
$100
$150
$200
$250
$300
2003 2004 2005 2006 2007 2008 2009 2010 2011Service Year
Dispensed by Others Dispensed by Physicians
Do
lla
rs P
aid
per
Me
dic
al C
laim
Physician-Dispensed Rx Average Cost per Claim More Than Doubled Since 2007

9
Physician dispensing has contributed to the growth in the number of prescriptions per claim, as shown in Exhibit 7. Between 2007 and 2011, the number of prescriptions per claim dispensed by a physician has increased 14%, from 1.4 to 1.6, although the peak was in 2009, at 1.9. In comparison, the number of prescriptions per claim dispensed by others increased by 8% during the same period, from 3.9 to 4.2. Later sections of this report provide additional analysis of physician dispensing.
Source: Derived from nationwide sample provided by carriers (excluding ND, OH, WA, WV, and WY)
Relative Service Years (RSY) 1 through 10
Claim counts based on claims with a medical service by RSY 2 (AY 2011 is projected)
Exhibit 7
4.1 4.1 3.9 3.9 3.9 3.7 3.6 4.0 4.2
1.2 1.3 1.3 1.3 1.4 1.6 1.9
1.8 1.6
5.3 5.3 5.1 5.2 5.3 5.3
5.5 5.8 5.9
0
1
2
3
4
5
6
2003 2004 2005 2006 2007 2008 2009 2010 2011
Service Year
Dispensed by Others Dispensed by Physicians
Nu
mb
er
of
Pre
sc
rip
tio
ns
p
er
Cla
im
The Number of Prescriptions per Claim Continues to Grow
10
WORKERS COMPENSATION PRESCRIBING PATTERNS
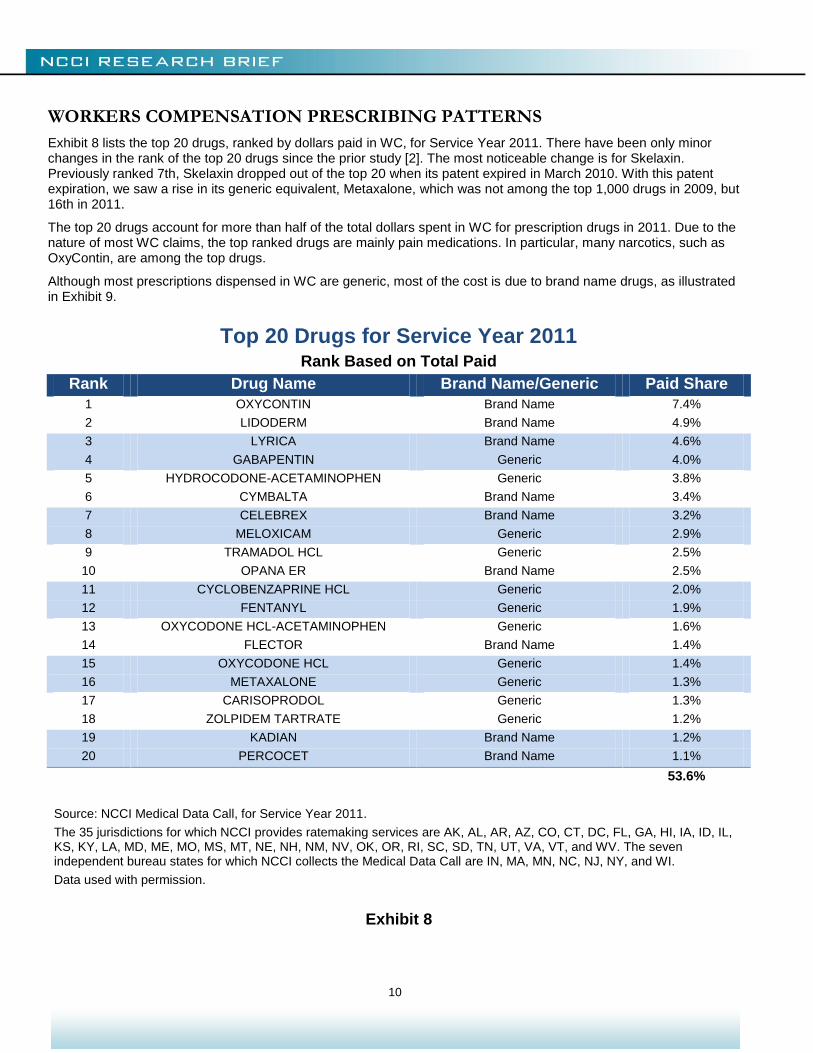
Exhibit 8 lists the top 20 drugs, ranked by dollars paid in WC, for Service Year 2011. There have been only minor changes in the rank of the top 20 drugs since the prior study [2]. The most noticeable change is for Skelaxin. Previously ranked 7th, Skelaxin dropped out of the top 20 when its patent expired in March 2010. With this patent expiration, we saw a rise in its generic equivalent, Metaxalone, which was not among the top 1,000 drugs in 2009, but 16th in 2011.
The top 20 drugs account for more than half of the total dollars spent in WC for prescription drugs in 2011. Due to the nature of most WC claims, the top ranked drugs are mainly pain medications. In particular, many narcotics, such as OxyContin, are among the top drugs.
Although most prescriptions dispensed in WC are generic, most of the cost is due to brand name drugs, as illustrated in Exhibit 9.
Top 20 Drugs for Service Year 2011 Rank Based on Total Paid
Rank Drug Name Brand Name/Generic Paid Share
1 OXYCONTIN Brand Name 7.4%
2 LIDODERM Brand Name 4.9%
3 LYRICA Brand Name 4.6%
4 GABAPENTIN Generic 4.0%
5 HYDROCODONE-ACETAMINOPHEN Generic 3.8%
6 CYMBALTA Brand Name 3.4%
7 CELEBREX Brand Name 3.2%
8 MELOXICAM Generic 2.9%
9 TRAMADOL HCL Generic 2.5%
10 OPANA ER Brand Name 2.5%
11 CYCLOBENZAPRINE HCL Generic 2.0%
12 FENTANYL Generic 1.9%
13 OXYCODONE HCL-ACETAMINOPHEN Generic 1.6%
14 FLECTOR Brand Name 1.4%
15 OXYCODONE HCL Generic 1.4%
16 METAXALONE Generic 1.3%
17 CARISOPRODOL Generic 1.3%
18 ZOLPIDEM TARTRATE Generic 1.2%
19 KADIAN Brand Name 1.2%
20 PERCOCET Brand Name 1.1%
53.6%
Source: NCCI Medical Data Call, for Service Year 2011.
The 35 jurisdictions for which NCCI provides ratemaking services are AK, AL, AR, AZ, CO, CT, DC, FL, GA, HI, IA, ID, IL, KS, KY, LA, MD, ME, MO, MS, MT, NE, NH, NM, NV, OK, OR, RI, SC, SD, TN, UT, VA, VT, and WV. The seven independent bureau states for which NCCI collects the Medical Data Call are IN, MA, MN, NC, NJ, NY, and WI.
Data used with permission.
Exhibit 8

11
Source: NCCI Medical Data Call, for Service Year 2011.
The 35 jurisdictions for which NCCI provides ratemaking services are AK, AL, AR, AZ, CO, CT, DC, FL, GA, HI, IA, ID, IL, KS, KY, LA, MD, ME, MO, MS, MT, NE, NH, NM, NV, OK, OR, RI, SC, SD, TN, UT, VA, VT, and WV. The seven independent bureau states for which NCCI collects the Medical Data Call are IN, MA, MN, NC, NJ, NY, and WI.
Data used with permission.
Exhibit 9
Brand Name Drugs Are Prescribed Less Often
But Are More Expensive
Service Year 2011

12
PHYSICIAN DISPENSING
Usually, when a doctor prescribes a drug for a patient, the patient obtains the drug from a pharmacy. But sometimes the doctor fills the prescription in their own office. Some reasons for this include:
The physician wants the patient to start taking the drug immediately and dispenses enough medication to last until the patient can get to a pharmacy
The physician cannot be sure what the right medication or dosage should be and dispenses a few days’ supply of medication to determine whether that course is effective
It might be inconvenient for the patient to get to a pharmacy
The physician is looking to increase revenue by retaining some of the business they would otherwise send to pharmacies
The cost per unit of physician-dispensed drugs is often higher than the cost per unit of the same drug dispensed by a pharmacy. Factors contributing to lower per-unit costs for drugs supplied by pharmacies include:
Overall economies of scale
Pharmacies often dispense larger quantities of drugs in each transaction
Pharmacies can be part of a Pharmacy Benefit Manager’s (PBM’s) network; PBMs can lower costs by:
Negotiating lower prices from manufacturers and pharmacies and then passing these savings on to WC carriers
Using formularies (lists of approved drugs) to increase use of generics and other less expensive, but therapeutically equivalent, drugs
Providing management reports detailing provider prescribing patterns and drug usage by injured worker
13
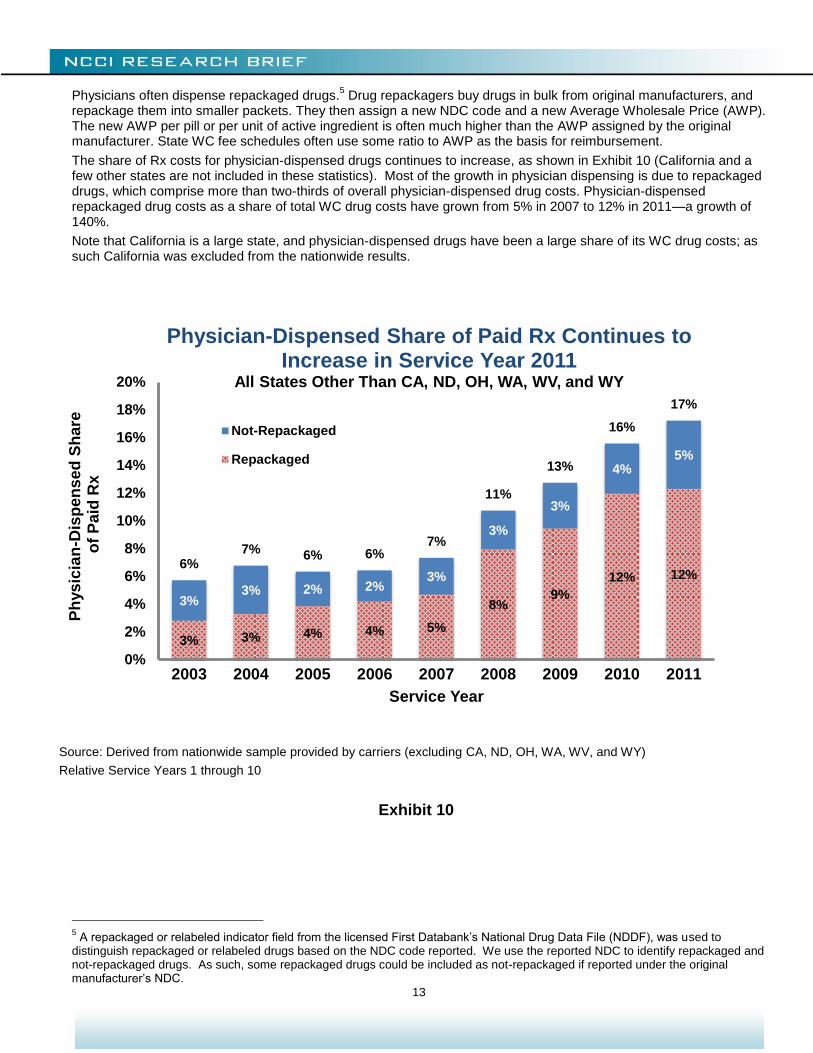
Physicians often dispense repackaged drugs.5 Drug repackagers buy drugs in bulk from original manufacturers, and
repackage them into smaller packets. They then assign a new NDC code and a new Average Wholesale Price (AWP). The new AWP per pill or per unit of active ingredient is often much higher than the AWP assigned by the original manufacturer. State WC fee schedules often use some ratio to AWP as the basis for reimbursement.
The share of Rx costs for physician-dispensed drugs continues to increase, as shown in Exhibit 10 (California and a few other states are not included in these statistics). Most of the growth in physician dispensing is due to repackaged drugs, which comprise more than two-thirds of overall physician-dispensed drug costs. Physician-dispensed repackaged drug costs as a share of total WC drug costs have grown from 5% in 2007 to 12% in 2011—a growth of 140%.
Note that California is a large state, and physician-dispensed drugs have been a large share of its WC drug costs; as such California was excluded from the nationwide results.
5 A repackaged or relabeled indicator field from the licensed First Databank’s National Drug Data File (NDDF), was used to
distinguish repackaged or relabeled drugs based on the NDC code reported. We use the reported NDC to identify repackaged and not-repackaged drugs. As such, some repackaged drugs could be included as not-repackaged if reported under the original manufacturer’s NDC.
Source: Derived from nationwide sample provided by carriers (excluding CA, ND, OH, WA, WV, and WY)
Relative Service Years 1 through 10
Exhibit 10
3% 3% 4% 4% 5%
8% 9%
12% 12%
3% 3% 2% 2%
3%
3%
3%
4% 5%
6% 7% 6% 6%
7%
11%
13%
16%
17%
0%
2%
4%
6%
8%
10%
12%
14%
16%
18%
20%
2003 2004 2005 2006 2007 2008 2009 2010 2011
Ph
ys
icia
n-D
isp
en
se
d S
hare
o
f P
aid
Rx
Service Year
Physician-Dispensed Share of Paid Rx Continues to Increase in Service Year 2011
All States Other Than CA, ND, OH, WA, WV, and WY
Not-Repackaged
Repackaged

14
Many states have recently implemented physician dispensing cost containment measures. Most of the recent reforms set limits on reimbursement for prescription medicines based on the original manufacturer’s Average Wholesale Price (AWP). These measures mostly prevent dispensers of repackaged drugs from drastically increasing the drug’s price relative to the original manufacturer’s AWP. For a list of recent state reforms limiting reimbursements for repackaged drugs, see Appendix 2.
In Exhibit 11, we look at the impact of the April 2011 Georgia reform which limits reimbursement for repackaged drugs. There was a 9% drop in the share of drug costs due to physician dispensing from SY 2010 to SY 2011. This might be due to a reduction in physician dispensing of repackaged drugs, or might be due to a reduction in the reimbursement to the physician for repackaged drugs.
Source: Derived from sample data provided by carriers
Relative Service Years 1 through 10
Exhibit 11
13% 15%
17% 15%
14%
28%
36%
39%
35%
0%
5%
10%
15%
20%
25%
30%
35%
40%
45%
2003 2004 2005 2006 2007 2008 2009 2010 2011
Ph
ys
icia
n-D
isp
en
se
d S
hare
o
f P
aid
Rx
Service Year
April 2011 Georgia Reform Limits Reimbursement for Repackaged Drugs

15
PHYSICIAN DISPENSING PATTERNS
Physician dispensing varies by state. Exhibit 12 shows the shares of physician-dispensed Rx to total Rx in Service Year 2011 by state. In some states where physician dispensing is highly regulated, e.g., Massachusetts, Montana, New Jersey, New York, and Texas, the share of physician dispensing to total Rx in Service Year 2011 is less than 10%. However, in states where regulation is not as strict, the share of physician-dispensed drugs often exceeds 15%.
Source: NCCI Medical Data Call, for all states except CA, DE, MI, PA, and TX, which were derived from sample data provided by carriers
Relative Service Years 1 through 10
Data used with permission
Exhibit 12
Physician Dispensing Varies by State
Physician-Dispensed Share of Paid Rx Service Year 2011

16
Exhibit 13 shows the top 10 physician-dispensed drugs for Service Year 2011. Most physician-dispensed drugs are generics. Within the top 10 physician-dispensed drugs, seven out of the 10 are generic, while in the top 10 drugs dispensed overall (see Exhibit 8) only three are generic. The prevalence of generics in physician-dispensed drugs is also confirmed in Exhibit 14. In Service Year 2011, generics account for a higher proportion of the number of prescriptions dispensed by physicians (82%) than of total prescriptions (76%, see Exhibit 9). Similarly, generics account for a higher proportion of the costs arising from prescriptions dispensed by physicians (64%) than of total prescriptions (44%).
Top 10 Physician-Dispensed Drugs for Service Year 2011
Rank Based on Total Paid
Rank Drug Name Brand Name/Generic Paid Share
1 MELOXICAM Generic 9.3%
2 TRAMADOL HCL Generic 5.4%
3 GABAPENTIN Generic 4.5%
4 LIDODERM Brand Name 4.4%
5 CARISOPRODOL Generic 4.4%
6 HYDROCODONE-ACETAMINOPHEN Generic 4.2%
7 OMEPRAZOLE Generic 3.3%
8 CYCLOBENZAPRINE HCL Generic 3.2%
9 LYRICA Brand Name 2.8%
10 CELEBREX Brand Name 2.2%
43.7%
Source: NCCI Medical Data Call, for Service Year 2011.
The 35 jurisdictions for which NCCI provides ratemaking services are AK, AL, AR, AZ, CO, CT, DC, FL, GA, HI, IA, ID, IL, KS, KY, LA, MD, ME, MO, MS, MT, NE, NH, NM, NV, OK, OR, RI, SC, SD, TN, UT, VA, VT, and WV. The seven independent bureau states for which NCCI collects the Medical Data Call are IN, MA, MN, NC, NJ, NY, and WI.
Data used with permission.
Exhibit 13

17
There are some potential reasons why physicians tend to dispense more generic medications than pharmacies. One possibility is that fee schedule rules generally allow a higher price deviation from AWP and a higher dispensing fee for generic drugs than for brand name drugs. Another possible explanation is restrictions on physician dispensing of narcotics in some states. As we saw in Exhibit 8, brand-name narcotics such as OxyContin and Opana are among the top drugs in WC. Physicians tend to dispense more of the Non-Steroidal Anti-Inflammatory Drugs (NSAID), such as Meloxicam, to treat pain, and these are more likely to be available as a generic.
Source: NCCI Medical Data Call, for Service Year 2011.
The 35 jurisdictions for which NCCI provides ratemaking services are AK, AL, AR, AZ, CO, CT, DC, FL, GA, HI, IA, ID, IL, KS, KY, LA, MD, ME, MO, MS, MT, NE, NH, NM, NV, OK, OR, RI, SC, SD, TN, UT, VA, VT, and WV. The seven independent bureau states for which NCCI collects the Medical Data Call are IN, MA, MN, NC, NJ, NY, and WI.
Data used with permission.
Exhibit 14
Physicians Mostly Dispense Generic Drugs
Shares of Physician-Dispensed Drugs Service Year 2011
18
NARCOTICS IN WORKERS COMPENSATION
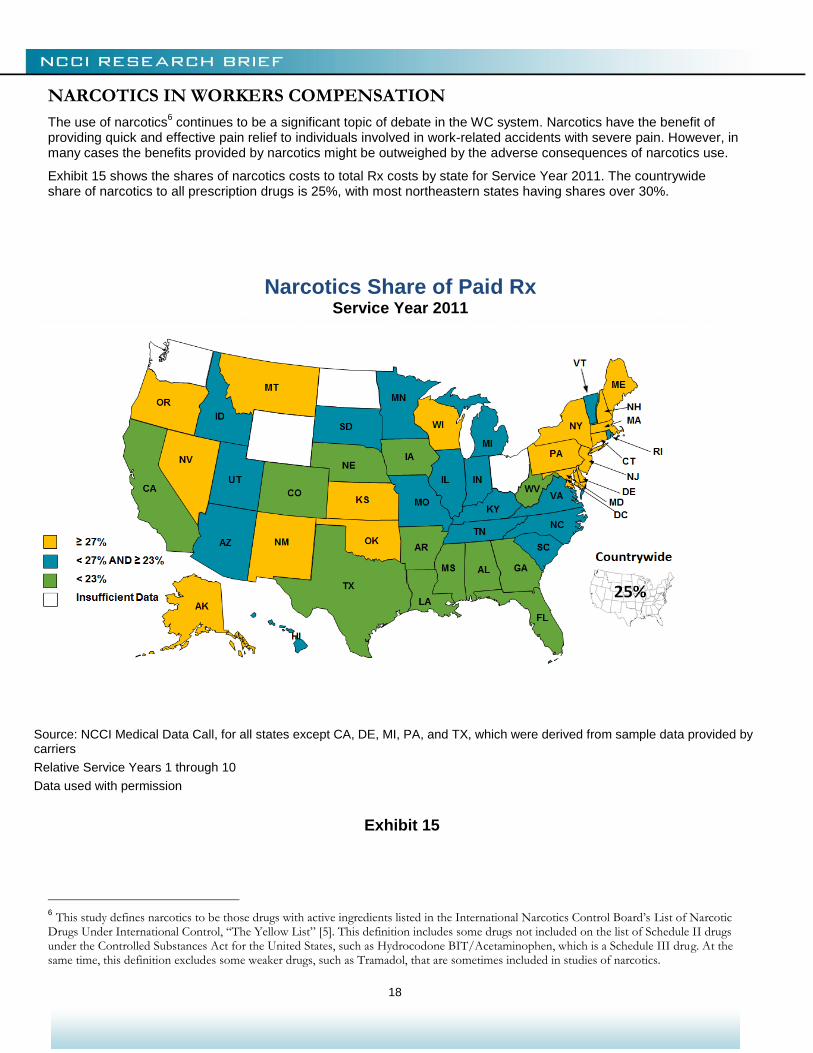
The use of narcotics6 continues to be a significant topic of debate in the WC system. Narcotics have the benefit of
providing quick and effective pain relief to individuals involved in work-related accidents with severe pain. However, in many cases the benefits provided by narcotics might be outweighed by the adverse consequences of narcotics use.
Exhibit 15 shows the shares of narcotics costs to total Rx costs by state for Service Year 2011. The countrywide share of narcotics to all prescription drugs is 25%, with most northeastern states having shares over 30%.
6 This study defines narcotics to be those drugs with active ingredients listed in the International Narcotics Control Board’s List of Narcotic
Drugs Under International Control, “The Yellow List” [5]. This definition includes some drugs not included on the list of Schedule II drugs under the Controlled Substances Act for the United States, such as Hydrocodone BIT/Acetaminophen, which is a Schedule III drug. At the same time, this definition excludes some weaker drugs, such as Tramadol, that are sometimes included in studies of narcotics.
Source: NCCI Medical Data Call, for all states except CA, DE, MI, PA, and TX, which were derived from sample data provided by carriers
Relative Service Years 1 through 10
Data used with permission
Exhibit 15
Narcotics Share of Paid Rx Service Year 2011
19
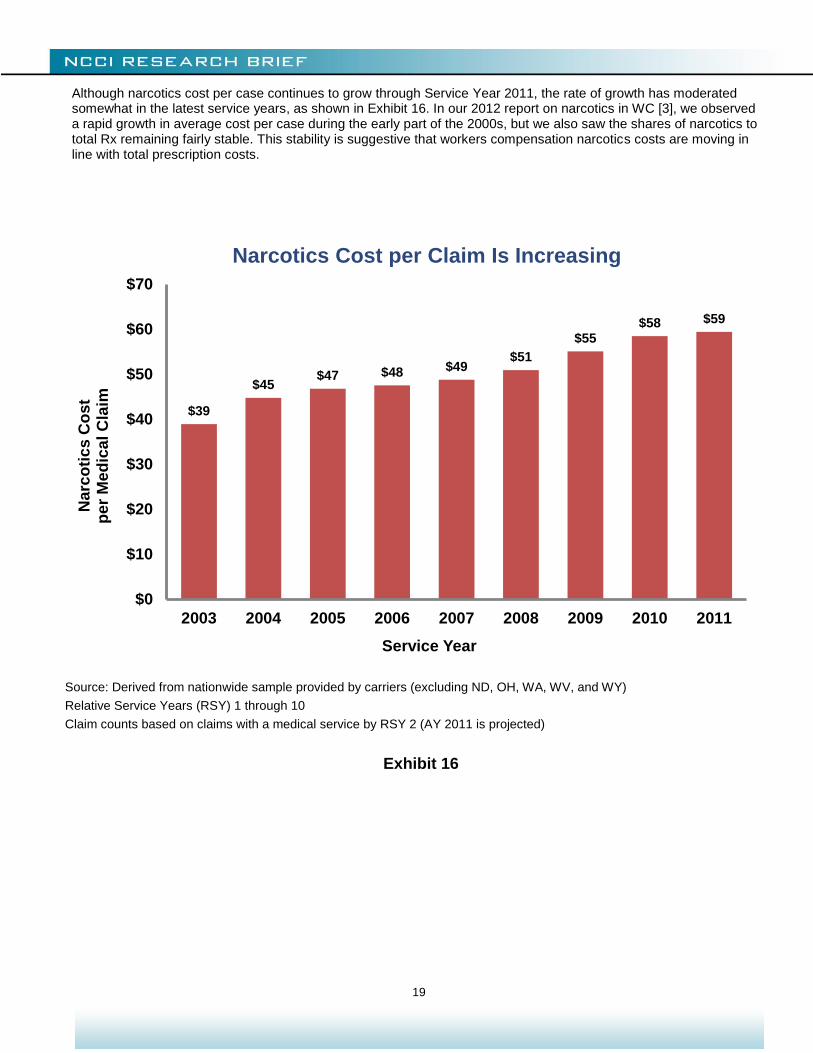
Although narcotics cost per case continues to grow through Service Year 2011, the rate of growth has moderated somewhat in the latest service years, as shown in Exhibit 16. In our 2012 report on narcotics in WC [3], we observed a rapid growth in average cost per case during the early part of the 2000s, but we also saw the shares of narcotics to total Rx remaining fairly stable. This stability is suggestive that workers compensation narcotics costs are moving in line with total prescription costs.
Source: Derived from nationwide sample provided by carriers (excluding ND, OH, WA, WV, and WY)
Relative Service Years (RSY) 1 through 10
Claim counts based on claims with a medical service by RSY 2 (AY 2011 is projected)
Exhibit 16
$39
$45 $47 $48 $49
$51
$55 $58 $59
$0
$10
$20
$30
$40
$50
$60
$70
2003 2004 2005 2006 2007 2008 2009 2010 2011
Service Year
Narc
oti
cs
Co
st
p
er
Me
dic
al C
laim
Narcotics Cost per Claim Is Increasing
20
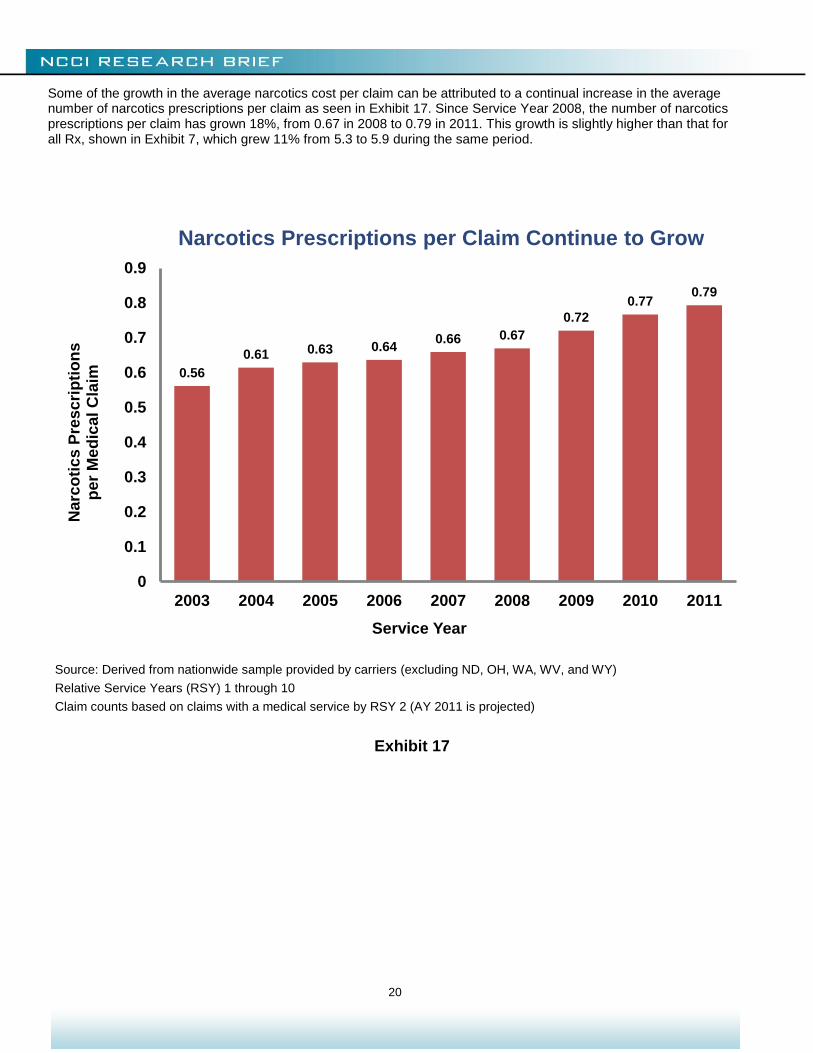
Some of the growth in the average narcotics cost per claim can be attributed to a continual increase in the average number of narcotics prescriptions per claim as seen in Exhibit 17. Since Service Year 2008, the number of narcotics prescriptions per claim has grown 18%, from 0.67 in 2008 to 0.79 in 2011. This growth is slightly higher than that for all Rx, shown in Exhibit 7, which grew 11% from 5.3 to 5.9 during the same period.
Source: Derived from nationwide sample provided by carriers (excluding ND, OH, WA, WV, and WY)
Relative Service Years (RSY) 1 through 10
Claim counts based on claims with a medical service by RSY 2 (AY 2011 is projected)
Exhibit 17
0.56
0.61 0.63 0.64 0.66 0.67
0.72
0.77 0.79
0
0.1
0.2
0.3
0.4
0.5
0.6
0.7
0.8
0.9
2003 2004 2005 2006 2007 2008 2009 2010 2011
Service Year
Narc
oti
cs
Pre
sc
rip
tio
ns
p
er
Me
dic
al C
laim
Narcotics Prescriptions per Claim Continue to Grow

21
Exhibit 18 looks at the distribution of the number of narcotics prescriptions for individual claimants in the first 12 months following an injury. The share of claimants not receiving narcotics has been declining. Equivalently, there has been an increase in the share of claimants receiving at least one narcotic prescription.
Sometimes a claimant with low to moderate pain gets one prescription for a narcotic. The claimant might use little or none of the prescription and not refill it. If the observed increase in the number of narcotic prescriptions per claim was due to this type of claim, then we would see an increase in the share of claimants receiving exactly one narcotic prescription. Instead, from AY 2005 to AY 2010, we observe a very slight decrease in the share of claims receiving exactly one narcotic prescription and an increase in the share of claims receiving more than one narcotic prescription. The most notable change is for the share of claims receiving at least five narcotic prescriptions—this share grew from 4.3% in AY 2005 to 5.6% in AY 2010. This could be the result of scripts being written for smaller amounts of narcotics, necessitating more frequent refills, or it could be that claimants are getting more narcotics within the first 12 months after injury.
Source: Derived from nationwide sample provided by carriers (excluding ND, OH, WA, WV, and WY)
Shares based on narcotics and other drugs received within one year of injury
*Share of claims with at least one Rx during Accident Year 2010 is 39% (similar to prior accident years)
Exhibit 18
65.6%
20.2%
5.9% 2.6% 1.5%
4.3%
63.9%
19.8%
6.1% 2.9% 1.7%
5.6%
0%
10%
20%
30%
40%
50%
60%
70%
0 1 2 3 4 5 or More
Sh
are
of
Cla
ims
Number of Narcotics Prescriptions
2005 2006 2007 2008 2009 2010
Claims by Number of Narcotics Prescriptions in the First 12 Months Following Injury
As a Percentage of Claimants Who Received at Least One Prescription for Any Type of Drug*
Accident Year
22
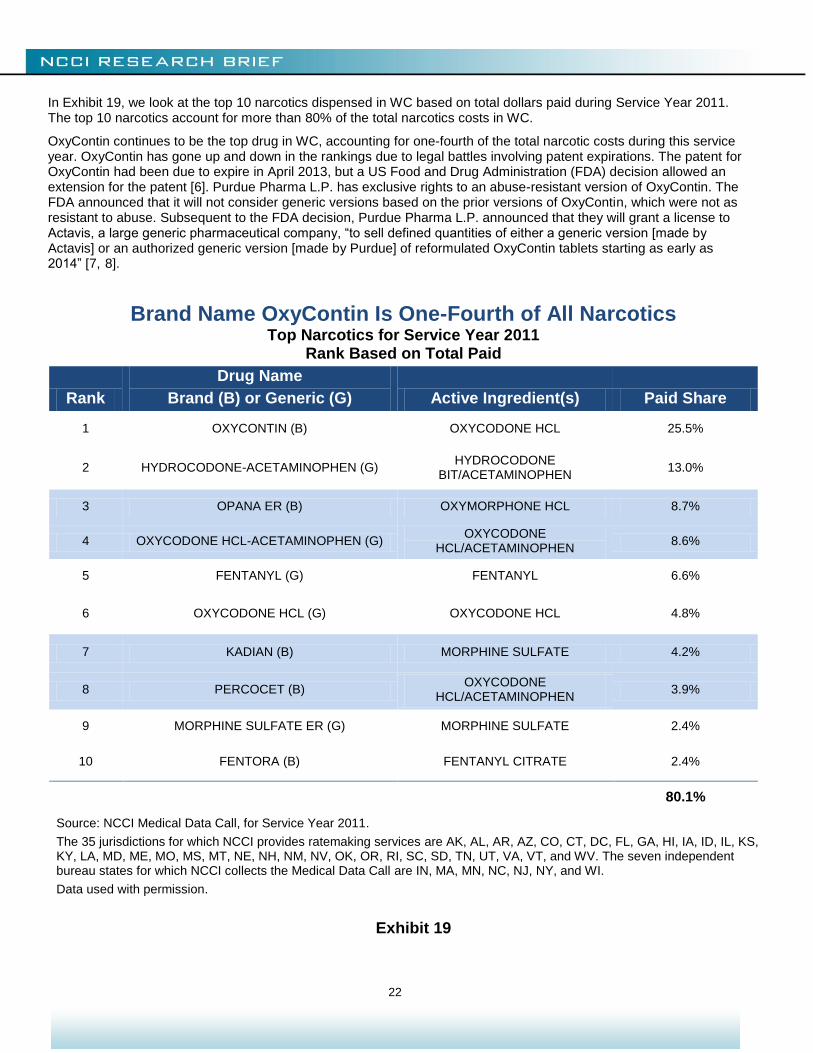
In Exhibit 19, we look at the top 10 narcotics dispensed in WC based on total dollars paid during Service Year 2011. The top 10 narcotics account for more than 80% of the total narcotics costs in WC.
OxyContin continues to be the top drug in WC, accounting for one-fourth of the total narcotic costs during this service year. OxyContin has gone up and down in the rankings due to legal battles involving patent expirations. The patent for OxyContin had been due to expire in April 2013, but a US Food and Drug Administration (FDA) decision allowed an extension for the patent [6]. Purdue Pharma L.P. has exclusive rights to an abuse-resistant version of OxyContin. The FDA announced that it will not consider generic versions based on the prior versions of OxyContin, which were not as resistant to abuse. Subsequent to the FDA decision, Purdue Pharma L.P. announced that they will grant a license to Actavis, a large generic pharmaceutical company, “to sell defined quantities of either a generic version [made by Actavis] or an authorized generic version [made by Purdue] of reformulated OxyContin tablets starting as early as 2014” [7, 8].
Brand Name OxyContin Is One-Fourth of All Narcotics Top Narcotics for Service Year 2011
Rank Based on Total Paid
Rank
Drug Name
Brand (B) or Generic (G) Active Ingredient(s) Paid Share
1 OXYCONTIN (B) OXYCODONE HCL 25.5%
2 HYDROCODONE-ACETAMINOPHEN (G) HYDROCODONE
BIT/ACETAMINOPHEN 13.0%
3 OPANA ER (B) OXYMORPHONE HCL 8.7%
4 OXYCODONE HCL-ACETAMINOPHEN (G) OXYCODONE
HCL/ACETAMINOPHEN 8.6%
5 FENTANYL (G) FENTANYL 6.6%
6 OXYCODONE HCL (G) OXYCODONE HCL 4.8%
7 KADIAN (B) MORPHINE SULFATE 4.2%
8 PERCOCET (B) OXYCODONE
HCL/ACETAMINOPHEN 3.9%
9 MORPHINE SULFATE ER (G) MORPHINE SULFATE 2.4%
10 FENTORA (B) FENTANYL CITRATE 2.4%
80.1%
Source: NCCI Medical Data Call, for Service Year 2011.
The 35 jurisdictions for which NCCI provides ratemaking services are AK, AL, AR, AZ, CO, CT, DC, FL, GA, HI, IA, ID, IL, KS, KY, LA, MD, ME, MO, MS, MT, NE, NH, NM, NV, OK, OR, RI, SC, SD, TN, UT, VA, VT, and WV. The seven independent bureau states for which NCCI collects the Medical Data Call are IN, MA, MN, NC, NJ, NY, and WI.
Data used with permission.
Exhibit 19
23
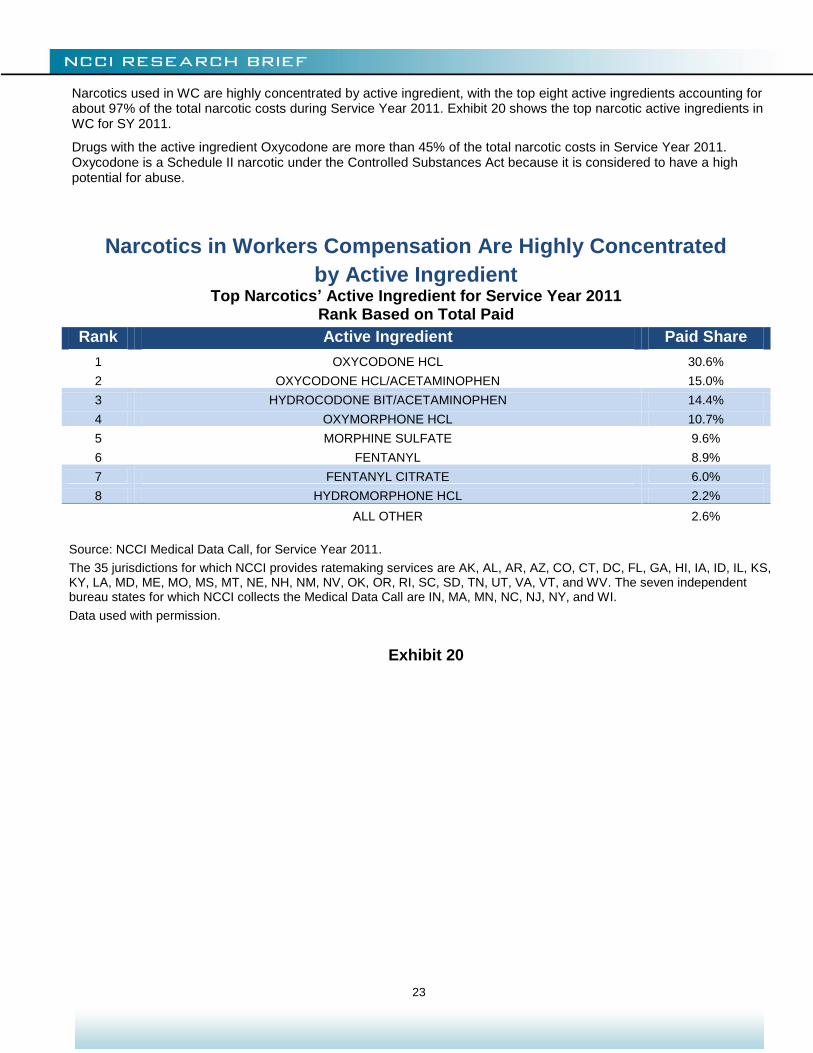
Narcotics used in WC are highly concentrated by active ingredient, with the top eight active ingredients accounting for about 97% of the total narcotic costs during Service Year 2011. Exhibit 20 shows the top narcotic active ingredients in WC for SY 2011.
Drugs with the active ingredient Oxycodone are more than 45% of the total narcotic costs in Service Year 2011. Oxycodone is a Schedule II narcotic under the Controlled Substances Act because it is considered to have a high potential for abuse.
Narcotics in Workers Compensation Are Highly Concentrated
by Active Ingredient Top Narcotics’ Active Ingredient for Service Year 2011
Rank Based on Total Paid
Rank Active Ingredient Paid Share
1 OXYCODONE HCL 30.6%
2 OXYCODONE HCL/ACETAMINOPHEN 15.0%
3 HYDROCODONE BIT/ACETAMINOPHEN 14.4%
4 OXYMORPHONE HCL 10.7%
5 MORPHINE SULFATE 9.6%
6 FENTANYL 8.9%
7 FENTANYL CITRATE 6.0%
8 HYDROMORPHONE HCL 2.2%
ALL OTHER 2.6%
Source: NCCI Medical Data Call, for Service Year 2011.
The 35 jurisdictions for which NCCI provides ratemaking services are AK, AL, AR, AZ, CO, CT, DC, FL, GA, HI, IA, ID, IL, KS, KY, LA, MD, ME, MO, MS, MT, NE, NH, NM, NV, OK, OR, RI, SC, SD, TN, UT, VA, VT, and WV. The seven independent bureau states for which NCCI collects the Medical Data Call are IN, MA, MN, NC, NJ, NY, and WI.
Data used with permission.
Exhibit 20

24
CLOSING REMARKS
Prescription drug costs continue to be a significant share of WC medical costs. Physician dispensing has contributed to the growth in prescription drug costs in recent years. Georgia’s legislative reform appears to have reduced its share of prescription drug costs due to physician dispensing. Narcotics continue to be a large share of prescription drug costs.
NCCI will continue to look for drivers of WC Rx costs and will continue to monitor and report on prescription drugs and other important issues that affect the workers compensation industry.
Chris Laws, Patrick O’Brien, and Jim Stevens contributed to this study.
25
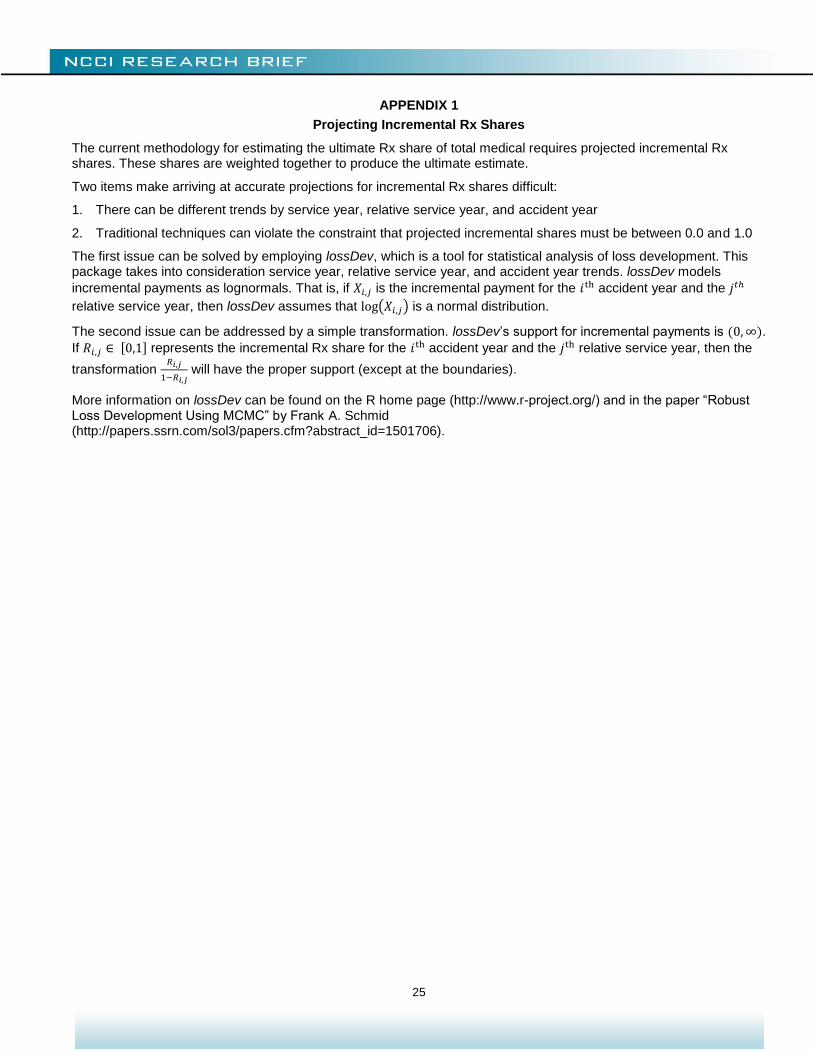
APPENDIX 1
Projecting Incremental Rx Shares
The current methodology for estimating the ultimate Rx share of total medical requires projected incremental Rx shares. These shares are weighted together to produce the ultimate estimate.
Two items make arriving at accurate projections for incremental Rx shares difficult:
1. There can be different trends by service year, relative service year, and accident year
2. Traditional techniques can violate the constraint that projected incremental shares must be between 0.0 and 1.0
The first issue can be solved by employing lossDev, which is a tool for statistical analysis of loss development. This package takes into consideration service year, relative service year, and accident year trends. lossDev models
incremental payments as lognormals. That is, if is the incremental payment for the accident year and the
relative service year, then lossDev assumes that ( ) is a normal distribution.
The second issue can be addressed by a simple transformation. lossDev’s support for incremental payments is . If [ ] represents the incremental Rx share for the accident year and the relative service year, then the
transformation
will have the proper support (except at the boundaries).
More information on lossDev can be found on the R home page (http://www.r-project.org/) and in the paper “Robust Loss Development Using MCMC” by Frank A. Schmid (http://papers.ssrn.com/sol3/papers.cfm?abstract_id=1501706).

26
APPENDIX 2
States Recently Limiting Reimbursement for Repackaged Drugs in Workers Compensation
As of June 10, 2013
State
Effective Date
AL 04/01/11
AZ 10/01/09
CO 01/01/12
CT 07/15/12
FL 07/01/13
GA 04/01/11
ID 07/01/13
IL 11/20/12
IN 07/01/13
MI 12/26/12
MS 07/01/10
OK 01/01/12
SC 12/19/11
TN 08/09/12

27
APPENDIX 3 Top 10 Prescription Drugs in WC for Service Year 2011
1. OXYCONTIN (Ox i KON tin) is a controlled-release narcotic painkiller prescribed for around-the-clock relief of
moderate to severe pain. 2. LIDODERM (LYE doe derm) is used to relieve the pain associated with sunburn; insect bites; poison ivy; poison
oak; poison sumac; minor cuts, scratches, and burns; sores in the mouth; dental procedures; hemorrhoids; and shingles (herpes infection).
3. LYRICA (LEE-rick-uh) is an anti-epileptic drug, also called an anticonvulsant. It is also used to treat pain caused by nerve damage in people with diabetes (diabetic neuropathy), herpes zoster (post-herpetic neuralgia), or neuropathic pain associated with spinal cord injury.
4. GABAPENTIN (ga bah PEN tin) (generic form of Neurontin, approved in 2003) is used in the treatment of some types of seizures and the management of postherpetic neuralgia (nerve pain caused by the herpes virus or shingles).
5. HYDROCODONE W/ACETAMINOPHEN (hye droe KOE done)/(ah see ta MIH no fen) (generic form of Vicodin) is a narcotic analgesic used to relieve moderate to severe pain.
6. CYMBALTA (sim BALL ta) is used to treat major depression—a disorder marked by continuing, serious, and overwhelming feelings of depression that interfere with daily functioning. It is used to treat diabetic peripheral neuropathy, a painful nerve disorder associated with diabetes that affects the hands, legs, and feet.
7. CELEBREX (SELL eh breks) is a nonsteroidal anti-inflammatory drug (NSAID) used to treat pain or inflammation caused by many conditions such as arthritis, ankylosing spondylitis, and menstrual pain. It is also used in the treatment of hereditary polyps in the colon.
8. MELOXICAM (mell OX ih kam) (generic form of Mobic) is used to relieve the pain and stiffness of osteoarthritis and rheumatoid arthritis.
9. TRAMADOL HCL (TRA ma dol)/(HYE droe KLOR ide) (generic form of Ultram) is prescribed to relieve moderate to moderately severe pain.
10. OPANA ER (oxymorphone) (ox ee MOR fone) is an opioid pain medication. An opioid is sometimes called a narcotic. Oxymorphone is used to treat moderate to severe pain. The extended-release form of this medication is for around-the-clock treatment of pain.
Source: drugs.com Note: These drugs might also be used for purposes other than those listed.

28
APPENDIX 4
State Differences in Per-Claim Rx Costs
Exhibit 21 categorizes states into high-, typical-, and low-cost states based on estimated per-claim Rx costs at ultimate. In this exhibit:
High-cost states are estimated to have an ultimate per-claim Rx cost of more than or equal to 1.5 times the median estimate
Typical-cost states are estimated to have an ultimate per-claim Rx cost between 1.5 and 0.8 times the median estimate
Low-cost states are estimated to have an ultimate per-claim Rx cost of less than or equal 0.8 to times the median estimate
Appendix 5 provides a brief discussion on why per-claim Rx costs at ultimate is our preferred metric.
Source: Derived from nationwide sample provided by carriers (excluding ND, OH, WA, WV, and WY).
Estimates based on AY 2009 to 2011. Claim counts based on claims with a medical service by RSY 2 (AY 2011 is projected).
All states have (or are expected to have) at least 2,500 medical claims per year.
Ranges are determined by comparing individual state averages to the medians by year.
High Cost is average relativity >= 1.5; Low Cost is average relativity <= 0.8.
Exhibit 21
Prescription Costs per Medical Claim Vary by State

29
APPENDIX 5
Estimating Per-Claim WC Rx Costs at Ultimate
Two separate but related items to consider when comparing per-claim Rx costs between states are treatment patterns and the persistence of medical payments.
Treatment patterns can vary by state. Doctors in State A may treat injuries more aggressively than doctors in State B. This could initially lead to higher per-claim Rx costs in State A. However, if claimants in State B have sustained Rx use over a longer time horizon, then per-claim Rx costs in State B may eventually exceed those in State A.
Medical costs, including Rx, for WC injuries are covered indefinitely. Even after 18 relative service years, only approximately 85% of all medical payments have been made. This means that a substantial portion of costs are not observed in our dataset. Furthermore, as seen in Exhibit 2, the incremental Rx share of medical costs increases with relative service year. This serves to amplify the impact of state differences in the persistence of medical payments after 18 relative service years.
Exhibit 21 shows how per-claim Rx costs develop differently by state. Oregon initially has lower than average per-claim Rx costs but is expected to reach average cost levels at ultimate. Oklahoma initially has higher than average per-claim Rx costs but is expected to drop to average cost levels at ultimate.

30
REFERENCES
1 Emond, Jeanne and Barry Llewellyn. August 2003. “Prescription Drugs: Comparison of Drug Costs and Patterns of Use in Workers Compensation and Group Health Plans.” NCCI. https://www.ncci.com/documents/rx.pdf
2 Lipton, Barry, Chris Laws, and Linda Li. August 2011. “Workers Compensation Prescription Drug Study: 2011 Update.” NCCI. https://www.ncci.com/documents/2011_ncci_research_rxdrug_study.pdf
3 Laws, Chris. May 2012. “Narcotics in Workers Compensation.” NCCI. https://www.ncci.com/documents/narcotics-wc.pdf
4 Lipton, Barry, Chris Laws, and Linda Li. January 2010. “Workers Compensation Prescription Drug Study: 2010 Update.” NCCI. https://www.ncci.com/documents/2010_ncci_research_rxdrug_study.pdf
5 “List of Narcotics Drugs Under International Control,” 50th edition. International Narcotics Control Board. December 2011. http://www.incb.org/documents/Narcotic-Drugs/Yellow_List/NAR_2011_YellowList_50edition_EN.pdf Accessed on February 7, 2013.
6 “FDA approves abuse-deterrent labeling for reformulated OxyContin,” U.S. Food and Drug Administration April 16, 2013 http://www.fda.gov/NewsEvents/Newsroom/PressAnnouncements/ucm348252.htm
7 “Purdue Pharma L.P. Announces Resolution of OxyContin (oxycodone HCl controlled-release) Tablets CII Patent Lawsuit with Actavis, Inc.,” Purdue Pharma L.P. April 26, 2013 http://www.purduepharma.com/news-media/2013/04/purdue-pharma-l-p-announces-resolution-of-oxycontin-oxycodone-hcl-controlled-release-tablets-cii-patent-lawsuit-with-actavis-inc/
8 “Actavis, Purdue Settle Generic OxyContin Lawsuits” manufacturing.net April 29, 2013, http://www.manufacturing.net/news/2013/04/actavis-purdue-settle-generic-oxycontin-lawsuits
RELATED PUBLICATIONS
Swedlow, L. Gardner, and J. Ireland, “CWCI Research Brief: Differences in Outcomes for Injured Workers Receiving Physician-Dispensed Repackaged Drugs in the California Workers’ Compensation System,” CWCI, February 2013
Swedlow and J. Ireland, “Estimated Savings from Enhanced Opioid Management Controls through 3rd Party Payer Access to the Controlled Substance Utilization Review and Evaluation System (CURES),” CWCI, January 2013
D. Wang, D. Hashimoto, K. Mueller, “Longer-Term Use of Opioids,” WCRI, October 2012
D. Wang, “Physician Dispensing in Workers’ Compensation,” WCRI, July 2012
© Copyright 2013 National Council on Compensation Insurance, Inc. All Rights Reserved. THE RESEARCH ARTICLES AND CONTENT DISTRIBUTED BY NCCI ARE PROVIDED FOR GENERAL INFORMATIONAL PURPOSES ONLY AND ARE PROVIDED “AS IS.” NCCI DOES NOT GUARANTEE THEIR ACCURACY OR COMPLETENESS NOR DOES NCCI ASSUME ANY LIABILITY THAT MAY RESULT IN YOUR RELIANCE UPON SUCH INFORMATION. NCCI EXPRESSLY DISCLAIMS ANY AND ALL WARRANTIES OF ANY KIND INCLUDING ALL EXPRESS, STATUTORY AND IMPLIED WARRANTIES INCLUDING THE IMPLIED WARRANTIES OF MERCHANTABILITY AND FITNESS FOR A PARTICULAR PURPOSE.