by: achmadi partowijoto & ratna hidayat iwp & … achmadi partowijoto & ratna hidayat...
TRANSCRIPT

MONITORING AND STUDIES ON MONITORING AND STUDIES ON WATER QUALITY IN RIVERS AND WATER QUALITY IN RIVERS AND
RELATED WATER BODIES IN RELATED WATER BODIES IN INDONESIAINDONESIA
By: Achmadi By: Achmadi PartowijotoPartowijoto & & RatnaRatna HidayatHidayatIWP & RDCWRIWP & RDCWR
IntroductionIntroduction
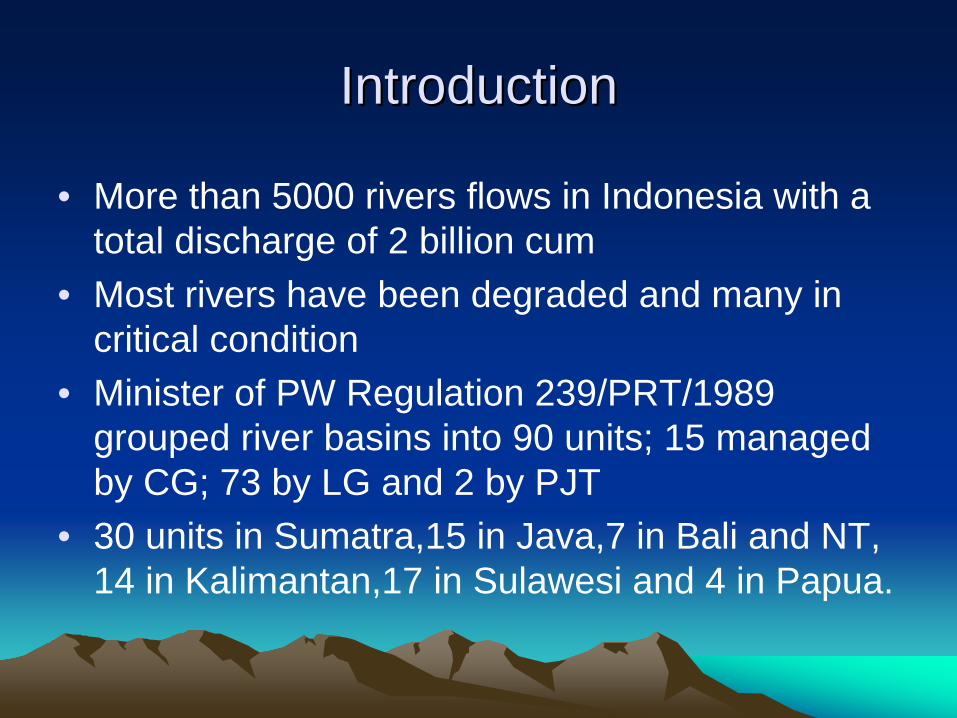
• More than 5000 rivers flows in Indonesia with a total discharge of 2 billion cum
• Most rivers have been degraded and many in critical condition
• Minister of PW Regulation 239/PRT/1989 grouped river basins into 90 units; 15 managed by CG; 73 by LG and 2 by PJT
• 30 units in Sumatra,15 in Java,7 in Bali and NT, 14 in Kalimantan,17 in Sulawesi and 4 in Papua.

In the near futureIn the near future
• River basin to be managed as PJT : J. Seluna, Serayu, Bengawan Sala, Ciliwung-Cisadane, W.Sekampung-W.Seputih, and Jeneberang
• At present there are 136 units, may increase in response to local government proposals
• Many river basins are critical: 22 in 1984; 39 in 1994; 42 in 1998; 58 in 2000, and more in 2005
• River potential are evaluated from both water quantity and quality, where pollution sources may derive from domestic, industrial and agricultural waste
Monitoring and studiesMonitoring and studies
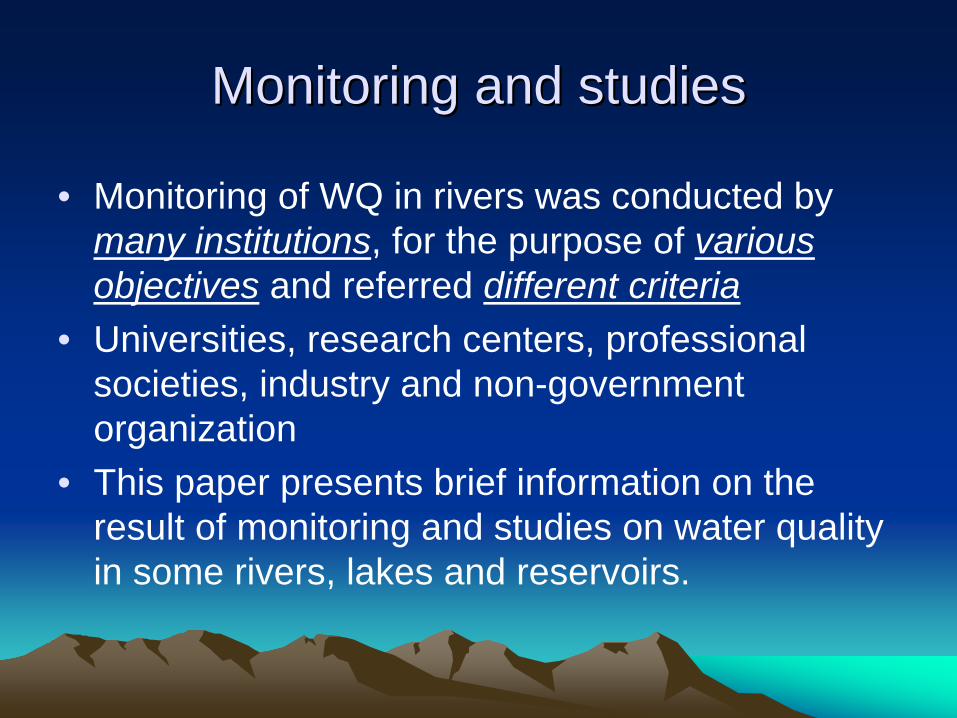
• Monitoring of WQ in rivers was conducted by many institutions, for the purpose of various objectives and referred different criteria
• Universities, research centers, professional societies, industry and non-government organization
• This paper presents brief information on the result of monitoring and studies on water quality in some rivers, lakes and reservoirs.

Classification of water qualityClassification of water quality• According to GR 82/2001 water is classified into :• Class I ; water used as raw water for drinking, or
other uses with similar quality requirements• Class II ; water used for recreation, fishery, life stock
and irrigation, or other uses with similar quality requirements.
• Class III ; water used for fishery, life stock and irrigation, or other uses with similar quality requirements
• Class IV ; water used for irrigation or other uses with similar quality requirements.

MONITORING OF WATER MONITORING OF WATER QUALITY IN RIVERS QUALITY IN RIVERS
(30 PROVINCES)(30 PROVINCES)

Map of Indonesia Map of Indonesia
INDONESIA
KalimantanSumatra Sulawesi
Maluku PapuaJava Bali
N. Tenggara

BOD and CODBOD and COD
• Majority of rivers exceed standard criteria for BOD, highest in Citarum (162) and Tallo (160), one meet criteria is river Dendeng in East NT
• Majority are high in COD (>100 mg/L), far exceed criteria for Class I and II (Deli,Citarum, Kahayan, Tallo, Palu, B.Gajah, B.Merah, Anafre)
• BOD : 26 % meet criteria for Class I and 33 % for Class II. COD: 29 % meet criteria for Class I
• pH: 90 % meet standard criteria of Class I and II, rivers Batanghari,Musi,Kapuas,Ciliwung,Citarumare low in pH and Kampar very low (4,9).

DO and TSSDO and TSS
• For DO, 40 % met the standard criteria of Class I, 72 % of Class II
• Rivers Deli, Ciliwung, Citarum and Surabaya showed values approaching to zero.
• For TSS, 71 % meet the standard criteria for water quality of Class I
• Rivers Progo; Kahayan, Martapura and Anafreshowed a wide range of TSS and the highest value detected in river Jeneberang

Nitrogen and PhosphorusNitrogen and Phosphorus• 78 % of rivers met standard criteria of Class I
and II for NO2. • NO3, 78% meet standard criteria of Class I and
II. For NO2 rivers Progo and Tukad Badungexceed standard criteria
• NH3, most rivers such as Deli, Tallo, Rangkuiand Anafre, showed high value exceed the standard criteria at most stations
• Highest concentration was detected in river Anafre (55.2 mg/L) and river Brantas (32.8 mg/L)
• PO4, almost all rivers exceed the standard criteria of Class I and II, highest concentration detected in Batang Agam (13.5 mg/L)

Fecal Fecal ColiformColiform and Total and Total ColiformColiform
• Majority of rivers flowing in densely populated urban and industrial areas, particularly in Java, tend to be highly polluted by bacteria.
• Those particular rivers are Progo in Yogyakarta, Ciliwung in Jakarta and Citarum in West Java
• Highest concentration of bacteria coli detected in Ciliwung with FC/TC concentration approaching/ over 1 million cells

Status of RiversStatus of Rivers
• The status of water quality in rivers are classified based on GR No.82/2001 and Minister of Environment Decree No.115, 2003
• The status is differentiated for up-stream (US) and down-stream (DS), parameters vary for different provinces
• The status are categorized into normal or not polluted (NP), lightly polluted (LP), moderately polluted (MP) and highly polluted (HP).

Status of rivers at US and DSStatus of rivers at US and DS
• For US: 2,5% NP, 56% LP, 23% MP and 8% HP• US meet standard criteria are: Tamiang,Progo,
Dendeng, Jangkok, Palu, Batu Merah, Tabobo.• US heavily polluted are : Ciliwung, Cisadane,
and Kahayan• For DS: 10% NP, 40% LP, 42% MP and 3% HP • DS meet standard criteria are: Tamiang,
Rangkui, Kapuas, Jeneberang,Tabobo

WQ status of rivers WQ status of rivers in Sumatrain Sumatra
LPLPBabelRangkuiLPLPLampungS.Kampung
LP-MPLPS. SumatraMusiMPMPJambiB. HariMPLPW. SumatraB. AgamMPLP-MPRiauKamparLPLPN. Sumatra DeliNPNP-LPAcehK.TamiangDSUSProvinceRiver

WQ status of rivers WQ status of rivers in Javain Java--BaliBali--NTNT
LPNPEast NTDendengMPLPWest NTJangkokLPLPBaliBadung-MPEast JavaBrantas
MPNP-LPYogyakartaProgoMPMPWest JavaCitarumHPHPJakarta CiliwungLPHPBantenCisadaneDSUSProvinceRiver

WQ status of rivers WQ status of rivers in Kalimantanin Kalimantan
LPLPE.KalimantanMahakam
MPLPS.KalimantanMartapura
LP-MPLP-HPC.KalimantanKahayan
NP-LPLPW.KalimantanKapuas
DSUSProvinceRiver

WQ status of rivers WQ status of rivers in in SulawesiSulawesi
NPLPN. MalukuTaboboMPLPPapuaAnafre
MPLPMalukuBatu GajahMPMPSE.SulawesiKonawehaLPLPS.SulawesiJeneberangLPMPC.SulawesiPaluLPLPGorontaloBoneLPLPN.SulawesiTondanoDSUSProvinceRiver

MONITORING OF WATER MONITORING OF WATER QUALITY IN 16 RIVERSQUALITY IN 16 RIVERS
(SUMATRA,JAVA,KALIMANTAN(SUMATRA,JAVA,KALIMANTAN

Observation and parametersObservation and parameters
• Monitoring of water quality were conducted at 16 (sixteen) rivers in Sumatra, Java and Kalimantan in 2001-2002
• The observations were differentiated between the up stream and the down stream part of each river
• The parameters used in the observation are BOD, COD, DO, TDS, TSS

WQ in 6 rivers (Sumatra,2000/01)WQ in 6 rivers (Sumatra,2000/01)
22.0321.0
--
5.24.9
15.146.6
2.520.5
UD
LampPangubuan
20.0356.0
--
5.43.6
12.718.5
4.38.3
UD
LampTerusan
--
45.035.0
4.23.9
8.012.5
3.75.3
UD
SouthSum
Musi
--
55.079.0
4.22.4
--
--
UD
RiauSiak
87.0370.0
--
6.57.6
7.545.5
4.37.4
UD
JambiB.Hari
10.0 40.0
0.52.5
7.5 5.9
0-
--
UD
WestSum
B.Hari
TDS mg/L
TSS mg/L
DO mg/L
COD mg/L
BODmg/L
U/DProvRiver

WQ in six rivers (Java,00/01)WQ in six rivers (Java,00/01)
--
--
5.25.4
14.616.6
27.44.5
UD
Yogyakarta
Opak
--
86.0259.0
--
88.21197.2
35.656.3
UD
Mokevaart
--
30.040.0
--
22.960.3
11.223.9
UD
Cipinang
--
105.588.0
--
34.829.8
17.815.4
UD
JakartaCiliwung
--
55.213.3
--
8.222.4
1.84.8
UD
BantenCiujung
202.5137.6
--
5.72.8
30.958.2
--
UD
W.JavaCitarum
TDS mg/L
TSS mg/L
DO mg/L
COD mg/L
BODmg/L
U/DProvRiver

WQ in 3 rivers (Kalimantan,00/01)WQ in 3 rivers (Kalimantan,00/01)
13.045.0
76.0230.0
4.602.02
--
--
UD
S.KalMartapura
16.414.4
21.016.0
--
23.032.5
12.814.4
UD
W.KalKapuas
23.010.3
115.0113.0
5.104.65
37.546.9
22.211.0
UD
E.KalMahakam
TDSmg/L
TSSmg/L
DOmg/L
CODmg/L
BODmg/L
U/DProvRiver

Cases of river pollutionCases of river pollution
• River Rokan, Riau, uncontrolled disposal of liquid waste from PT Mahkota, 2002
• River Siak, Riau, liquid waste from pulp & paper factory, 2002
• River Citarik, West Java, caustic soda from pipe leakage in textile factory, 2001 (skin irritation)
• River Banger, Central Java, liquid waste from textile factories in Pekalongan (dead life stock)
• River Ngringo, Central Java, liquid waste from MSG Factory
Monitoring in BaliMonitoring in Bali
MONITORING OF WATER QUALITY IN 25 RIVERS AND 4 LAKES (BALI)
Result of monitoringResult of monitoring
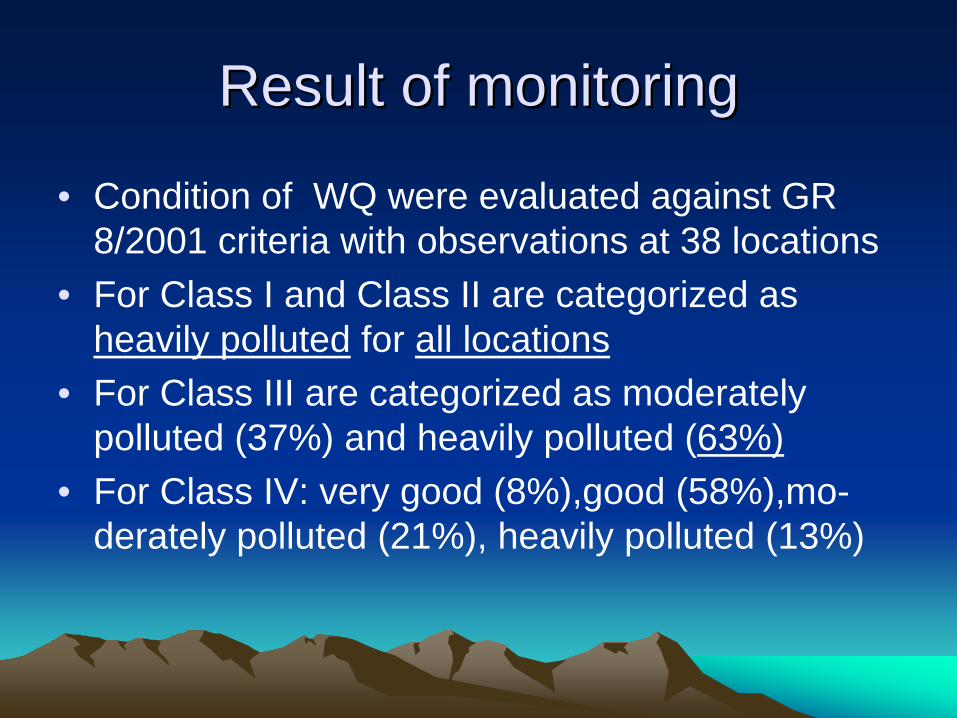
• Condition of WQ were evaluated against GR 8/2001 criteria with observations at 38 locations
• For Class I and Class II are categorized as heavily polluted for all locations
• For Class III are categorized as moderately polluted (37%) and heavily polluted (63%)
• For Class IV: very good (8%),good (58%),mo-derately polluted (21%), heavily polluted (13%)

MONITORING ON WATER QUALITY IN 22 RIVERS (SUMATRA)

WQ in 22 rivers in SumatraWQ in 22 rivers in Sumatra
• Observation on water quality in 22 rivers in Sumatra was conducted in 1989-1990
• The rivers are located in Aceh, N. Sumatra, W. Sumatra, Jambi, S. Sumatra and Lampung
• Rivers were classified into Class A, Class B and Class C
• The criteria for the classification are : turbidity (A<50; B = 50-100; C>100 mg/L) and coli (A<5000; B<20.000; C>20.000 (total/100 ml)

Classification of rivers in SumatraClassification of rivers in Sumatra
Asahan at Porsea,Siruar,TanggaBt Tambuo-Ikua LabuahKomering-Sungai Dua
N. SumatraW.SumatraS. Sumatra
Class A
Peusangan-MatangDeli,Semayang,Asahan-T.Balai,MerbauTapung Kn-Kotagaro, Tapung Kr-TandunBatang Agam, Kampung DurianBatang tambir,Rantau Panjang, W.Seputih-P.Ratu, W.Pangubuan-T. Besar
AcehN.SumatraRiauW.SumatraJambiLampung
Class C
SiakBatang Hari, Batang TembesiMusi-PulokertoWay Seputih Dalam
RiauJambiS.SumatraLampung
Class B
RiversProvince

WQ of rivers in Java, Sumatra WQ of rivers in Java, Sumatra and Kalimantanand Kalimantan
12.06.1Kapuas30.09.1Musi64.04.9Brantas28.07.5Madiun25.06.2Cisadane14.64.4Ciliwung24.09.90Cisangkuy
7.7-14.5
1.8 -33.0
North Java (Citarum, Cimanuk, Cipunagara, Cisanggarung, Pemali, Comal, Sambong, Pekalongan)
CODmg/L
BODmg/L
River

WQ in river WQ in river CidanauCidanau, , BantenBanten
• Observation at 14 (fourteen) sampling stations from up stream to down stream
• River water are neutral to basic, lowest pH is 6.6 (13) and the highest pH is 8.8 (2)
• Electrical conductivity range from 2 (3) to 3.2 (9), turbidity from 16 (11) to 90 (5)
• DO vary from 1.9 (4) to 5.1 (3), temperature from 25.6 0C (3) to 28.8 0C (12), NO2 from 2 (7,8,12) to 4 mg/l (1,2,5,6,9,10).

WQ of rivers in 9 citiesWQ of rivers in 9 cities
• Observation on river water quality was conducted in 1993-1998
• Observation covered 9 (nine) rivers in Sumatra, Java, Bali, Kalimantan and Sulawesi
• The parameters are FC, DO, NH3, Cu, Cr, Cd, Pb, Zn, and Phenol
• Result of the study showing parameters exceeding the standard criteria of Class B is presented in the following table

Parameters exceed standard criteriaParameters exceed standard criteria
FC,NH3-N,DOT. BadungDenpasar9NH3-N,DOTondanoManado8FC,NH3-N,DOKapuasPontianak7NH3-N,DOSiakPekanbaru6NH3-N,DOMusiPalembang5FC,NH3N,DO,Cr,Cd,PbK. SurabayaSurabaya4FC,NH3-N,DOK. GarangSemarang3FC,NH3-N,DOCikapundungBandung2FC,DO,NH-3-N,CU,ZnCiliwungJakarta1
Parameter exceeding standard criteria (Group B)
RiverCityNo

Study of river Study of river CiliwungCiliwung, West Java, West Java
• Implemented in 2004 with 15 (fifteen) sampling stations
• Cover physical, chemical and biological parameters
• BOD plays an important role, FC and TC significantly decrease the water quality
• Bacteria pollute river water starting from up stream to the down stream.
• The river status decrease from Puncak (50) at up stream to Manggarai(85) at down stream

Ten year Clean River Program Ten year Clean River Program in Jakarta (1989in Jakarta (1989--98)98)
6354,1201.4419.7955610,590Ciliwung2101,9401.0318.79484537Cipinang1671,6701.4056.7152324,220Moke
vaart21842313091863336Grogol
7882065010. ,301,7201,050Cakung
Aft.Bef.Aft.Bef.Aft.Bef.
(mg/L)
TSS(mg/L)COD(mg/L)BOD River

WQ study in river WQ study in river CitarumCitarum
• Study on water quality of river Citarum was conducted for 10 (ten) years from 1993 to 1999.
• The observation use BOD as the parameter for water quality
• The BOD increase in 7 sampling locations and decrease in 3 locations
• Highest BOD was detected at Nanjung and increasing, the lowest in R.Dengklok and decreasing during the period
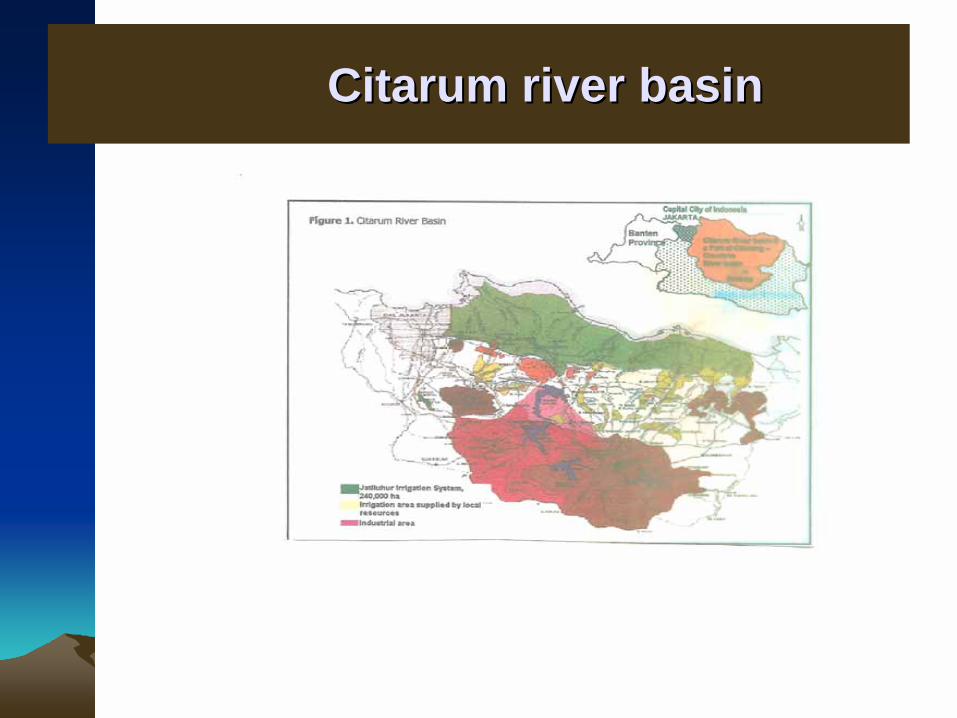
CitarumCitarum river basinriver basin

Variation of BOD (mg/L)Variation of BOD (mg/L)
14.1019.8814.55W.PojokK.Bekasi18.6745.1935.43K.MuaraCikaran31.1729.0515.55BandungCikao
236.43197.99186.03NanjungCimahi23.8719.6837.91D. KolotCisangkuy30.2728.3356.88D. KolotCikapundung
34.5076.8010.60
9.20
33.3070.2014.3016.00
31.4360.0112.6710.53
SapanBatujajarTj. PuraR.Dengklok
Citarum199919971993LocationRiver

Other WQ study in Other WQ study in CitarumCitarum
• Other study on water quality in Citarum was conducted at 13 locations in 2001 using physical, chemical and biological parameters
• Criteria used is the National Standard for PW on Water Quality (1990) and Method for Examination of Water Quality (1992)
• Source of pollution are industrial and domestic wastes from Bandung, Purwakarta and Karawang regencies.

PhysicalPhysical--Chemical IndexChemical Index
84CiparayCirase
86BanjaranCisangkuy
91SoreangCiwedey
85CisaruaCimahi
69LedengCibeurem
91Jl. Siliwangi, BdgCikapundung
30Jl. Suci, BandungCidurian
PCILocationTributary

Proposed measures for upper Proposed measures for upper CitarumCitarum (1)(1)
• Reduce pollution by installation of Treatment Plants
• Increase control measures through law enforcement (93% industries own TP but operated improperly)
• Increase public participation in caring the rivers as a vital asset for life
• Limitation of new potential polluters industries through tight licensing

Proposed measures for upper Proposed measures for upper CitarumCitarum (2)(2)
• Increase water holding capacity by construction of small reservoirs
• Reduced Nitrogen and Phosphorus to prevent eutroficcation at Saguling through application of appropriate technology
• Set-up detail of ater Pollution Control action plan and formulating definite task for each involved institution
• Maintain continues monitoring of water quality for evaluation of the action plan achievement

Study in river Study in river BrantasBrantas
• A study on water quality in river Brantas was conducted in 1987 to set-up target for water quality management enacted by Gov.Decree
• Master plan for water quality control was prepared in 1989 and evaluated in 1997
• There are Short Term ( 1995), Intermediate Term ( 2000), and Long Term Plan ( 2010)
• Scenario was set-up to decrease liquid waste load to achieve LTP target to reduced 80 % of industrial and 50% of domestic waste
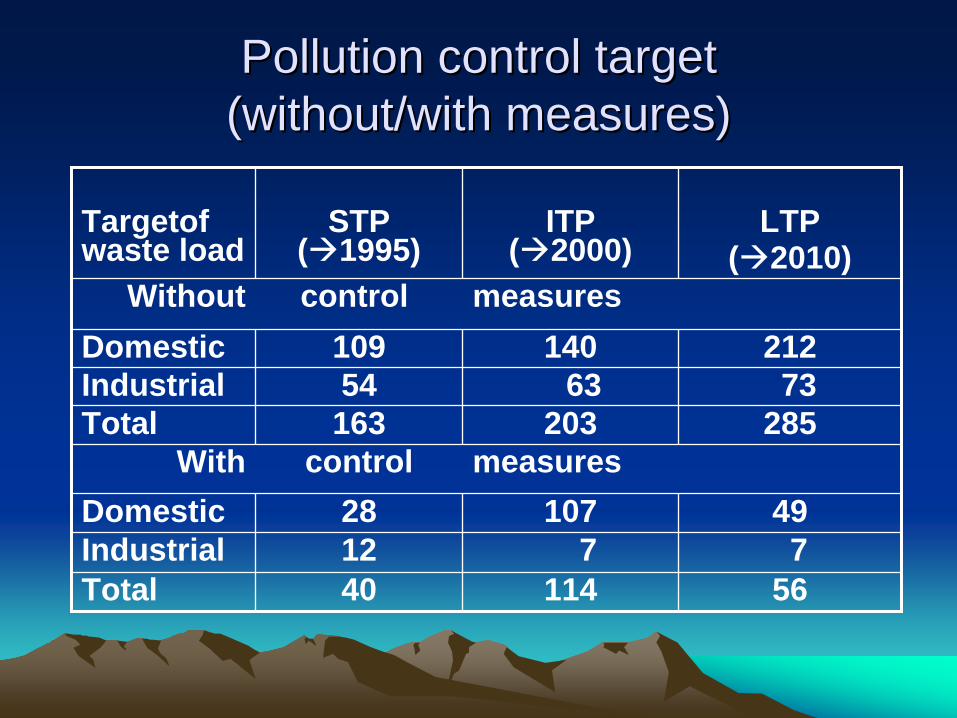
Pollution control target Pollution control target (without/with measures)(without/with measures)
4910728Domestic7712Industrial
5611440Total
212140109Domestic7363 54Industrial
285203163TotalmeasurescontrolWith
measurescontrolWithout
LTP ( 2010)
ITP ( 2000)
STP ( 1995)
Targetofwaste load
STUDIES ON WATER QUALITY IN LAKES
Lake Lake TobaToba and and BaturBatur
• Study on water quality was conducted in lake Toba (North Sumatra) and lake Batur (Bali)
• For BOD both lakes exceed the standard criteria of Class I
• Cadmium was detected at 6 locations in lake Toba
• Existence of heavy metal and organic pollutant of industrial, domestic and agricultural waste from the surrounding area.

Lake Lake CidanauCidanau, , BantenBanten
• Study on water quality in lake Cidanau was conducted at 7 sampling locations
• Water acidity range from pH values of 6 to 7.6• Electrical conductivity range from 103 to 272,
turbidity from 4 to 85 • DO range from 0.20 to 4.66, temperature from
25.6 to 27.0 0C, NO3 are similar at all locations.• Change of water quality is caused by drainage
water from paddy field in upper area

Lake Lake GedeGede and lake and lake CipondohCipondoh
• Study on WQ was conducted in lake Gede(Tangerang) and lake Cipondoh (Bogor) in 1999.
• Water in lake Gede is used to be utilized for fish culture, and from the result of the study it was stated as good in quality
• Water in lake Cipondoh also used for fish culture from the result of the study it was stated as good in quality
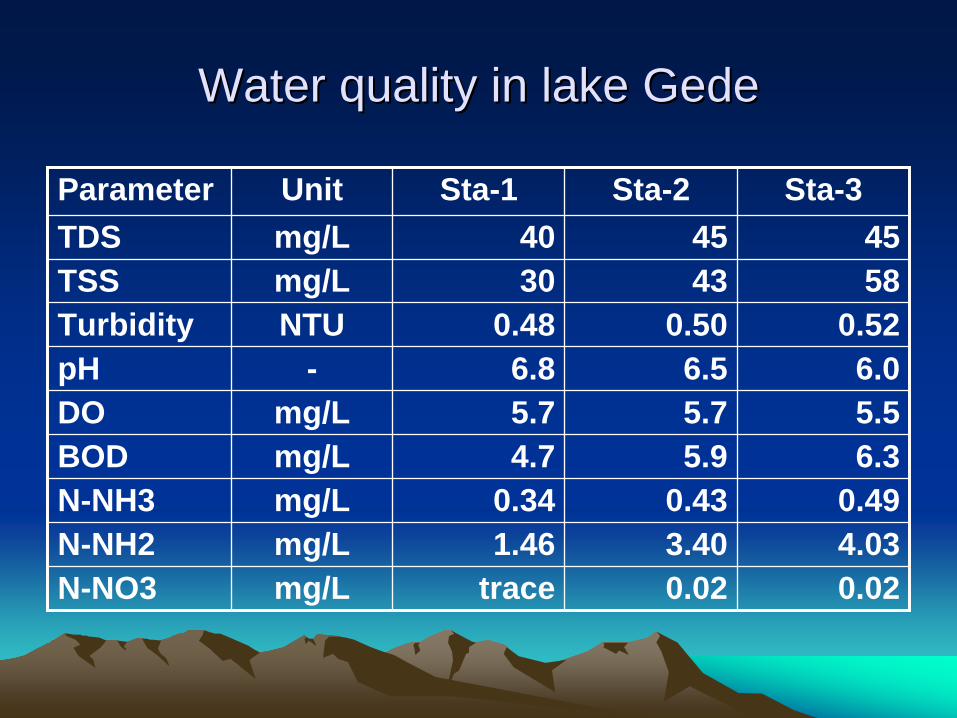
Water quality in lake Water quality in lake GedeGede
0.020.02tracemg/LN-NO34.033.401.46mg/LN-NH20.490.430.34mg/LN-NH3
6.35.94.7mg/LBOD5.55.75.7mg/LDO6.06.56.8-pH
0.520.500.48NTUTurbidity584330mg/LTSS454540mg/LTDS
Sta-3Sta-2Sta-1UnitParameter
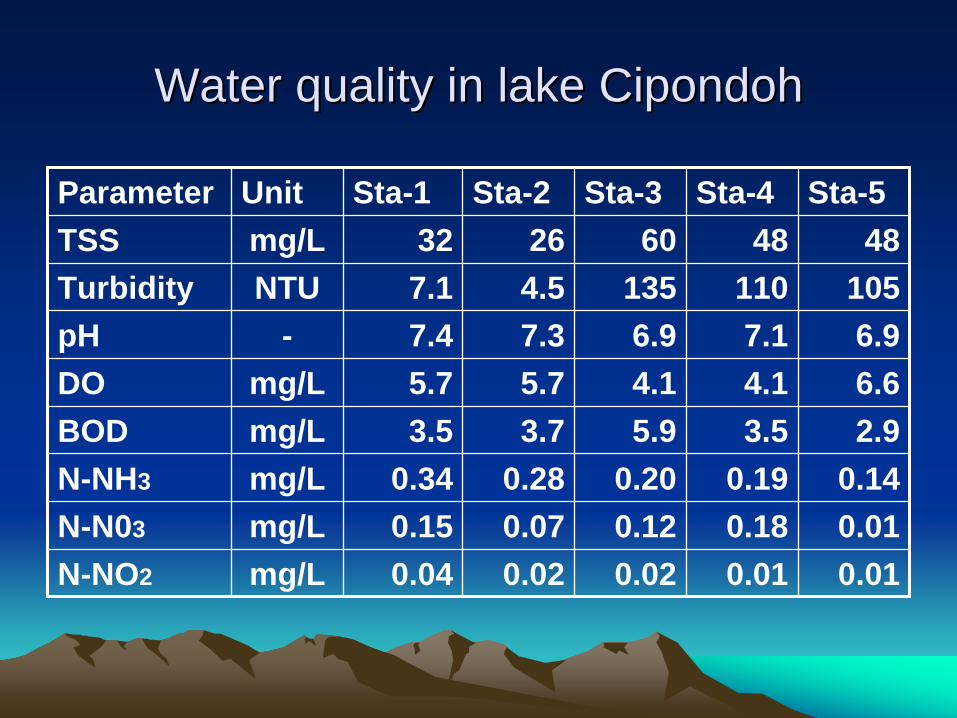
Water quality in lake Water quality in lake CipondohCipondoh
0.010.010.020.020.04mg/LN-NO2
0.010.180.120.070.15mg/LN-N03
0.140.190.200.280.34mg/LN-NH3
2.93.55.93.73.5mg/LBOD6.64.14.15.75.7mg/LDO6.97.16.97.37.4-pH
1051101354.57.1NTUTurbidity4848602632mg/LTSS
Sta-5Sta-4Sta-3Sta-2Sta-1UnitParameter

Recommendation for fisheryRecommendation for fishery
• For fishery development, suggestions include awareness in water quality, preservation and skill development.
• Site selection should consider :a. location ; open to oxygen penetration process from the air, and free from pest andfpollutant disturbanceb. depth of water ; > 4 m for floating net, 1-3 m for embedded net
STUDIES ON WATER QUALITYIN RESERVOIRS
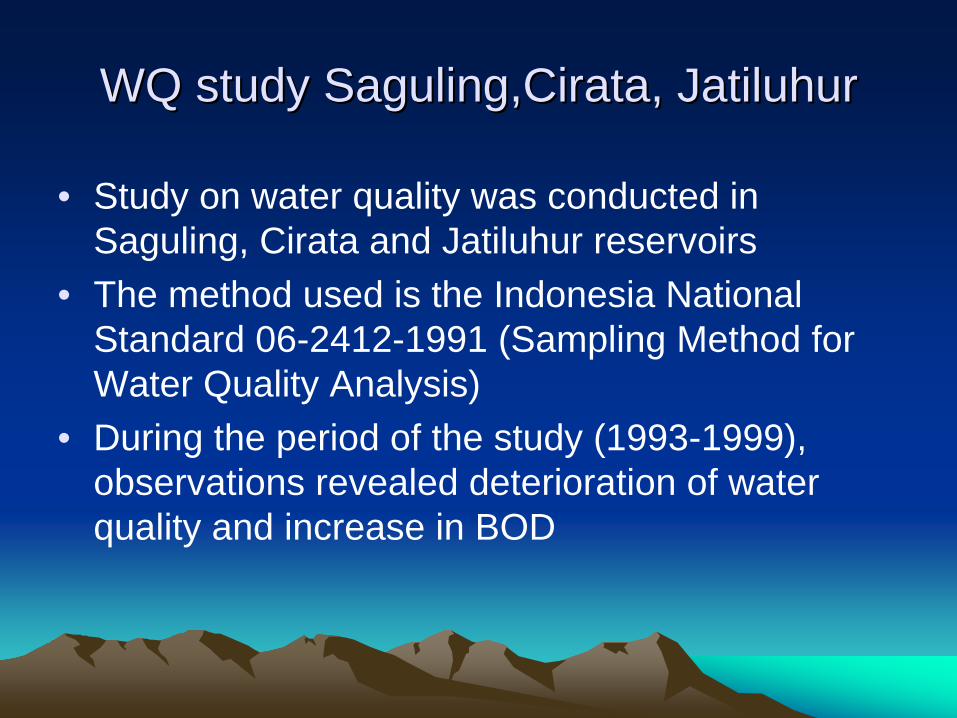
WQ study WQ study Saguling,CirataSaguling,Cirata, , JatiluhurJatiluhur
• Study on water quality was conducted in Saguling, Cirata and Jatiluhur reservoirs
• The method used is the Indonesia National Standard 06-2412-1991 (Sampling Method for Water Quality Analysis)
• During the period of the study (1993-1999), observations revealed deterioration of water quality and increase in BOD

Increase of BOD in the reservoirsIncrease of BOD in the reservoirs
4.742.583.193.000Jatiluhur
18.767.707.152.165Cirata
23.7519.5418.04982Saguling199919971989
(mg/L)BODAverage Capacity(MCM)
Reservoir

Content of Organic MatterContent of Organic Matter
10573516.791Jatiluhur
1.2428.715199.224Cirata
3112.18649.974Saguling
PNOM
(ton/year)ContentReservoir

Fishery area in Fishery area in JatiluhurJatiluhur reservoirreservoir
• Study on water quality at the fishery area of Ciganea in Jatiluhur reservoir was conducted in 1996 to respon the incident of fish death
• Approaching the time of incident, oxygen content was decreasing from 8 to 4 mg/L
• At the time of incident, oxygen content was very low (1-2 mg/L) and ammonia content increased significantly (0.369 to 1.476 mg/L)
• Ten days after, oxygen content increased to 5.86 mg/l and ammonia decreased to traceable

Oxygen content (mg/L)Oxygen content (mg/L)
4.04.5January 5-7After
3.72.1December 5During
7.77.7November 3Prior
2 m depthAt surface Date (1996/97)Time to incident

Recommendations for fish cultureRecommendations for fish culture
• Select appropriate location for fish culture• Limit population to recommended amount• Do not practice excessive fertilization• Preferably use floating type of fertilizer

WQ parameters for WQ parameters for Saguling,Cirata,JatiluhurSaguling,Cirata,Jatiluhur
• Study in 2001 at Saguling, Cirata and Jatiluhurdetected several parameters exceeding the standard criteria of Group B,C and D
• Observation were implemented in July and September 2001 at inlet and outlet of each reservoir
• Depth of the observation is 0.2 m, 5 m,10 m,15 m and 20 m.
• Result of the study is shown in the following table

Parameters exceeding the Parameters exceeding the standard criteria (B,C,D)standard criteria (B,C,D)
-/--/-DO,COD
-/S-/NH3,SDO,COD
0.2/100.2/150.2
Jtl: T.SindangIntakeOutlet
-/DO-/DOCOD
-/DONH3/NH3
DO,COD
0.2/100.2/100.2
Crt: P.BuleudIntakeOutlet
-/DO,SCOD,BOD/CODCOD,S
COD/NH3,DO,SBOD,COD/NH3,DO,COD,SS
0.2/150.2/150.2
Sgl : BongasIntake
Outlet
Sept. 01July 01Depth (m)
Location:

Concluding remarks (1)Concluding remarks (1)
• Results of monitoring and studies on water quality in rivers, lakes and reservoir, showed that many, if not mentioned as most, had been polluted at various level, by domestic, industrial and agricultural wastes, particularly in the densely populated and industrial areas
• Possible causes for pollution of water bodies are lack of public awareness, improper spatial planning, lack of coordination, limited treatment plant, lack of incentives, limited budget allocation and ineffective law enforcement

Concluding remarks (2)Concluding remarks (2)
• Monitoring and studies on water quality have been implemented for many years, but limited to selected locations/subjects, and lack of effective coordination
• Implementation have been done by various institutions (universities, research center, industries, professional societies and NGO)
• Parameter, standard criteria and accuracy vary from one to other institutions and locations, depending on the different objective and budget allocation
• Result and data from the monitoring and studies are not properly distributed among the implementing institutions as well as its desimination to the users

Concluding remarks (3)Concluding remarks (3)
• Coordination and integration in the implementation of monitoring and studies, as well as data exchange and utilization need to be enhanced
• National standard criteria should be comprehensive and integrated in its formulation, well socialized and effectively applied
• Public awareness should be highly motivated and reward system applied for better performance in water quality control and management
• Support from national, regional or international institutions will be very useful to help in achieving better water quality control and management.