business understanding using process mining business understanding using process mining mohammadreza...
TRANSCRIPT

Business Understanding Using Process Mining
MohammadReza Fani Sani1, Hadi Sotudeh2
1,2 Eindhoven University of Technology, Eindhoven, The Netherlands 1- [email protected]
Abstract. Process mining enables multiple types of process analysis based on event data. Using process mining techniques, many of data and business oriented questions can be answered. In this paper, we analyzed a real event log taken from a Dutch financial institute which is about an online-based consumer credit. We apply a range of process mining techniques to find key aspects in this event log. Also, we answered the questions asked by the challenge conductors. In this re-gard, process models, bottlenecks, resource patterns and data quality issues are presented. All of this analysis are performed using existing and dedicated plugins within the process mining tools such as ProM, Celonis, Disco, and SQL server. The results suggest several direction for further analysis.
Keywords: Process Mining; Process Discovery; Resource Analysis; Business Process Intelligence Challenge
1 Introduction
Process mining is a research discipline that acts on the intersection of data-driven meth-ods like machine learning and data mining on the one hand and Business Process Mod-eling (BPM) on the other hand. Process mining consists of three main parts that are process discovery, conformance checking, and process enhancement [1]. Process dis-covery aims at discovering process models from event logs. Conformance checking aims at evaluating to how a process model and event log conform to one another in terms of behavior. Finally, process enhancement wants to improve the quality of pro-cess model by enriching them with other information gained from the event log. This paper was written in order to participate in the BPI2017 challenge (the student category). So, we analyzed an event log of a real-life process, taken from a Dutch fi-nancial institute which domain is consumer credit and their business is mostly online based, using process mining algorithms. The main process of this institute is about loan applications. Each customer can create an application which consists of one or more loan offers, then these offers were handled by the institute and final decisions about them have been made (at most, one of the offers made by an applicant could be ac-cepted).
We find that this event log contains three related processes. Therefore, at first a process for each process and how relate to other processes is discovered. For this purpose we use a novel process discovery algorithm. We show process models that are discovered

using our method on this event log have better replying measures [2]. The explanation of this method is out of the scope of this paper.
Also, we answered the questions that are asked by the challenge conductors. Further-more, we bring results of other analysis, e.g. resource analysis and decision tree. All analyses in this paper are performed using SQL server and existing plug-ins within the process mining tools, i.e. Celonis, ProM, RapidProm, RapidMiner, and Disco. The remainder of this paper is organized as follows. In Section 2, some statistical in-formation that helps in understanding of the event data is provided. Then, the process models of the event log are given in Section 3. Section 4 provides the asked questions and our answer to each of them. Furthermore, Section 5 presents further analysis like resource analysis. Finally, Sections 6 concludes the paper.
2 Data understanding
The event data provided by the company consists of the following parts. For each ap-plication, the following attributes are given:
Requested loan amount The application type Loan Goal Application ID
Also for each offer, we have following attributes: Offer ID The offered amount The initial withdrawal amount The number of payback terms The monthly costs The credit score of the customer The employee who created the offer
Finally, other information such as timestamp, lifecycle, and the employee who execute
activities is recorded1. We used Celonis to convert XES files to CSV ones. To just have analysis on complete cases, we assume that ”O_Accepted”, “O_Cancelled” and “O_Refused” are endpoints for offers and “A_Pending”, “A_Cancelled”, and “A_Denied” are endpoints for appli-cations, so we used these endpoints for filtering out incomplete event logs. In all anal-yses, we just considered the filtered event log that has complete traces. The amounts of cases in raw and filtered event logs are in Table 1.
Table 1. Result of filtering event logs using end points.
Event Logs Raw event log Filtered Event log Application 31509 31411
Offer 42995 42815
1 https://www.win.tue.nl/bpi/doku.php?id=2017

Table 1 shows that there are 180 incomplete offers and 98 incomplete applications in the given event log that we did not consider them in any of our analysis. In Table 2, applications and their offers are divided based on their final decisions. Each application at last should be accepted, denied or cancelled. According to this table, around 55% of applications were accepted, 33% of them were canceled and only 12% of them were declined by the institute.
Table 2. Separating application and their corresponding offers based on their final status.
Event Logs All Accepted Cancelled Denied Application 31417 17277 10413 3752
Offer 42832 24149 13736 4933 Here, we did some exploratory analysis to understand the event log better. For example, we found out that acceptance probability of applications with type of “Limit raise” is very higher than “New credit” ones. The details are given in Table 3.
Table 3. Application types and their final status.
Application Type Application% Case# accepted cancelled denied New credit 89% 28024 53% 35% 13% Limit raise 11% 3388 73% 20% 6%
Then, we looked at the effect of case loan goal on its final status. According to Table 4 "Remaining debt home" has the highest acceptance probability compared to others. As it shown in this table, vehicle related goals like car, motorcycle have lower acceptance rate compared to home related goals. Other interesting finding of these results is the difference between “Unknown” and “Not specified” goals. It seems choosing “Not specified” as a goal for applications increase the probability of their cancellation.
Table 4 Case loan goal types and their final status.
Loan Goal Application% Case# accepted cancelled rejected
Car 30% 9307 51% 36% 12% Home Improvement 24% 7647 59% 30% 11%
Existing Loan Takeover 18% 5574 55% 31% 14% Other, see explanation 9% 2976 51% 36% 14%
Unknown 8% 2363 64% 27% 9% Not specified 3% 1058 41% 45% 14%
Remaining debt home 3% 835 65% 29% 6% Extra spending limit 2% 623 53% 32% 15%
Caravan/ Camper 1% 369 57% 37% 6% Motorcycle 1% 275 50% 37% 12%
Boat 1% 201 57% 37% 5%
Also, we grouped offers based on their requested amount and calculated their ac-ceptance, cancelation and rejection probabilities in Table 5. This table shows that it is more probable for average (between 10,000 and 30,000) amounts to be accepted.

Table 5. Effect of requested amount on applications' final status.
Request amount Application% Cases# accepted canceled Re-jected
0-5000 23% 7344 51% 35% 14% 5000-10000 14% 7062 52% 36% 12% 10000-20000 29% 8990 58% 31% 11% 20000-30000 14% 4364 60% 29% 11%
>30000 12% 3652 55% 34% 11% As mentioned before, there are three groups of activities in the event log and each of them has a specific process; activities which start with “A” are related to application perspective, activities which start with “O” are corresponded to process of loan offers and ones start with “W” are related to workflow of re-sources in the company. Therefore, we separate the filtered event log to three subgroups: only applica-tion events (A_*), only offer events (O_*), and only workflow events (W_*). The statistical information of these separated event logs are given in Table 6.
Table 6. Statistic information of separated event logs.
Original Only A Only O Only W #Traces 31,411 31,411 42,821 31,411 #Events 580678 238,942 193,278 148,481 #EventClass 24 10 8 6 #Resources 144 144 144 144 First Event 1/1/2016 1/1/2016 2/1/ 2016 1/1/2016 Last Event 2/2/2017 1/2/2017 1/2/2017 1/2/2017
Each of A_* and O_* activities only has one event in the event log i.e, stores the com-pletion time of that activity. However, W_* activities have a life cycle, therefore, for one activity there would be several events. The process of their life cycle is presented in Figure 1. According to this figure, first of all, an activity is scheduled, then it will be started. Thereafter, it is possible to suspend and then resumed it for several times. To finish an activity we could use withdraw and ate_abort when the activity is in state of schedule, suspend respectively. If it is in the state of schedule, start respectively, it can be finished using complete state. Most of the activities follow this figure; however, there are some activities that because of data quality problems do not fit into this model. Figure 2 shows this problem using Disco tool. For example, in this figure, it is presented that 120 activities, without sched-uling the activity are started or 778 ones started after they are resumed. There are also 298 incomplete activities (the last states of them are suspend and scheduled). Finally, self-loops in suspend and start states are also considered as data quality problems which is probably caused by data gathering method.

Fig. 1. life cycle of workflow events in Petri Net format.
Fig. 2. Analyzing how workflow events fit to designed models. There are some events that are able to replay with Petri Net of Figure 1.
3 Process Model
A Process model helps to understand the possible behavior in the business. Process discovery, the main sub-field of process mining, aims at discovering process models from process execution data, stored in event logs [1]. In many cases like the current challenge, we don't have any reference process model and discovered process models from the event log to use for further analysis.
Many process discovery algorithms are recommended like Alpha Miner [3], Al-pha++ [4], Inductive Miner [6], Inductive Miner–infrequency [7], and ILP Miner [8]. Also, many commercial tools in process mining domain and some algorithms like Heu-ristic Miner [5] and Fuzzy Miner [9] resulted process models without a clear semantics. These models are useless in distinguishing between concurrencies and choices.
We applied many process mining algorithm on the separated event logs and evalu-ated them based on their soundness, fitness, precision, and simplicity [2]. For evalua-tion of process models, we used "Analyze with Woflan", "Replayed a Log on Petri Net for Conformance Analysis" and "Measure Precision/Generalization" plugins in ProM. If an obtained model of a miner was not sound, we could not calculate other measures. Also, for all algorithms, we calculated F-Measure of the resulted model and picked up the obtained model of the algorithm which has the highest F-Measure. F-Measure is computed by the following formula and used to have a balance between precision and fitness.
F measure (1)
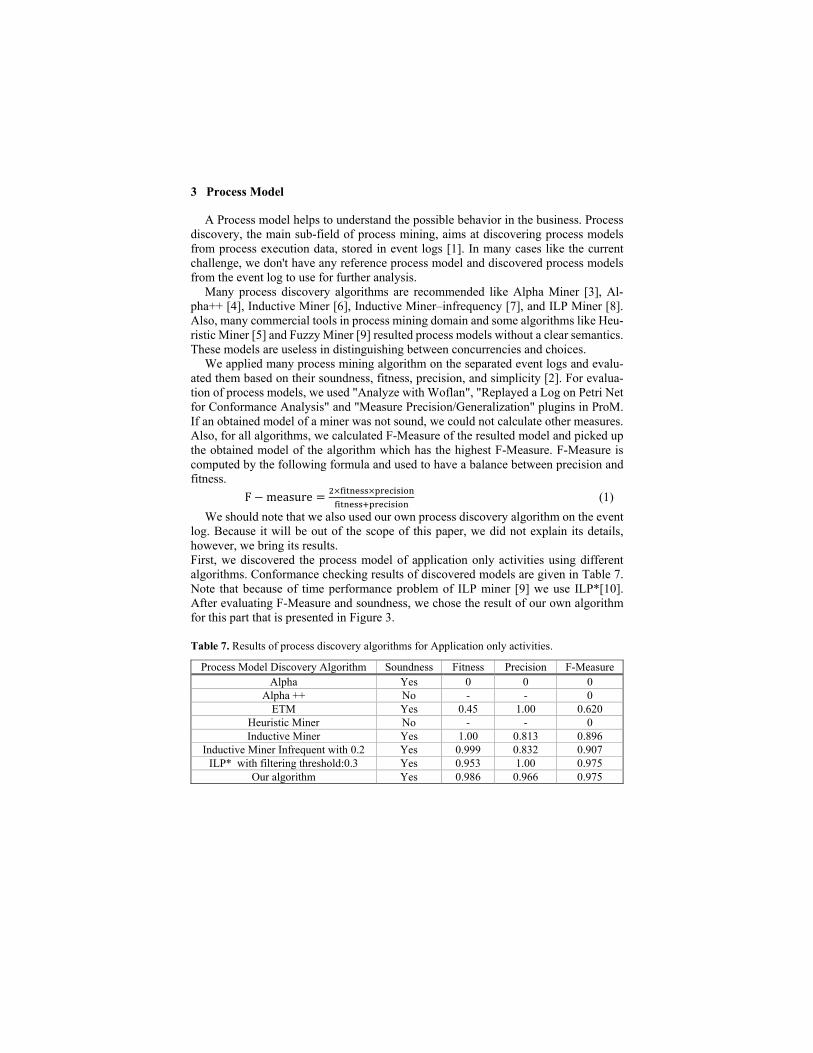
We should note that we also used our own process discovery algorithm on the event log. Because it will be out of the scope of this paper, we did not explain its details, however, we bring its results. First, we discovered the process model of application only activities using different algorithms. Conformance checking results of discovered models are given in Table 7. Note that because of time performance problem of ILP miner [9] we use ILP*[10]. After evaluating F-Measure and soundness, we chose the result of our own algorithm for this part that is presented in Figure 3.
Table 7. Results of process discovery algorithms for Application only activities.
Process Model Discovery Algorithm Soundness Fitness Precision F-Measure Alpha Yes 0 0 0
Alpha ++ No - - 0 ETM Yes 0.45 1.00 0.620
Heuristic Miner No - - 0 Inductive Miner Yes 1.00 0.813 0.896
Inductive Miner Infrequent with 0.2 Yes 0.999 0.832 0.907 ILP* with filtering threshold:0.3 Yes 0.953 1.00 0.975
Our algorithm Yes 0.986 0.966 0.975

Fig. 3. Discovered process model for Application only activities.
As it is indicated in this figure, first an application is created, then it can be submitted. We found that the activity “A_Submitted” was needed only for some “New credit” applications and was not executed for “Limit raise” applications. A sequence of “A_Concept”, “A_Accepted”, and “A_Complete” activities gave us a complete appli-cation. Then, the application could be canceled via “A_Cancelled” or validated by “A_Validating”, the outcome of validation part was “A_Denied”,“ A_Pending”, or “A_Incomplete” activities which refer to rejecting, accepting and incompleteness of application respectively. If an application needs to be completed it should be validated again or canceled.
We also discovered the process model of offer only activities with different process discovery methods and given their conformance checking results in Table 8. After eval-uating F-Measure and soundness results of different process discovery algorithms for this process, we chose our own process model that is presented in Figure 4.
Table 6. Results of process discovery algorithms for Offer only activities.
Process Model Discovery Algorithm Soundness Fitness Precision F-measure Alpha Yes 0 0 0
Alpha ++ No - - 0
ETM Yes 0 1.0 0
Heuristic Miner No - - 0
Inductive Miner Yes 1.00 0.823 0.908 Inductive Miner Infrequent with 0.2 Yes 0.95 0.916 0.953 ILP* with filtering threshold:0.3 Yes 0.953 1.00 0.975
Our algorithm Yes 0.986 1.00 0.992
Fig. 4. Discovered process model for Offer only activities.
In this figure, firstly an offer was created using “O_Create Offer” and “O_Created” activities. Then the offer is sent to the corresponding customer via either “O_Sent
(online only)” or “O_Sent (mail and online)”. Thereafter, the offer can be canceled or it can be returned by the customer. If the offer is returned, it can be refused or accepted by the company.
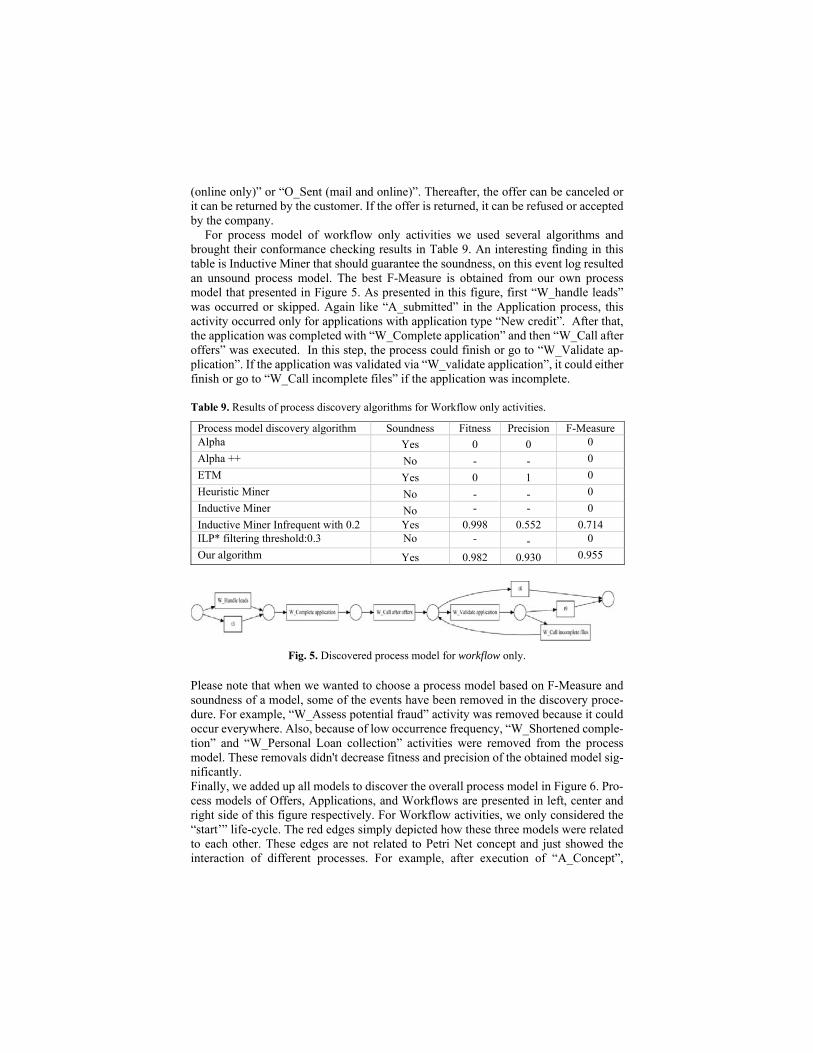
For process model of workflow only activities we used several algorithms and brought their conformance checking results in Table 9. An interesting finding in this table is Inductive Miner that should guarantee the soundness, on this event log resulted an unsound process model. The best F-Measure is obtained from our own process model that presented in Figure 5. As presented in this figure, first “W_handle leads” was occurred or skipped. Again like “A_submitted” in the Application process, this activity occurred only for applications with application type “New credit”. After that, the application was completed with “W_Complete application” and then “W_Call after offers” was executed. In this step, the process could finish or go to “W_Validate ap-plication”. If the application was validated via “W_validate application”, it could either finish or go to “W_Call incomplete files” if the application was incomplete.
Table 9. Results of process discovery algorithms for Workflow only activities.
Process model discovery algorithm Soundness Fitness Precision F-Measure Alpha Yes 0 0 0
Alpha ++ No - - 0
ETM Yes 0 1 0
Heuristic Miner No - - 0
Inductive Miner No - - 0
Inductive Miner Infrequent with 0.2 Yes 0.998 0.552 0.714 ILP* filtering threshold:0.3 No - - 0
Our algorithm Yes 0.982 0.930 0.955
Fig. 5. Discovered process model for workflow only.
Please note that when we wanted to choose a process model based on F-Measure and soundness of a model, some of the events have been removed in the discovery proce-dure. For example, “W_Assess potential fraud” activity was removed because it could occur everywhere. Also, because of low occurrence frequency, “W_Shortened comple-tion” and “W_Personal Loan collection” activities were removed from the process model. These removals didn't decrease fitness and precision of the obtained model sig-nificantly. Finally, we added up all models to discover the overall process model in Figure 6. Pro-cess models of Offers, Applications, and Workflows are presented in left, center and right side of this figure respectively. For Workflow activities, we only considered the “start’” life-cycle. The red edges simply depicted how these three models were related to each other. These edges are not related to Petri Net concept and just showed the interaction of different processes. For example, after execution of “A_Concept”,

“W_Complete application” from Workflow process occurred and after that “A_Ac-cepted” from Application process was done. In the same way, this activity caused to at least one offer is created.
A_Create Application
A_Submitted
A_Concept
A_Accepted
A_incomplete
A_Complete
A_Validating
A_PendingA_Denied
A_Cancelled
W_Handle lead
W_Complete application
W_Coll after offer
W_Validate application
W_Coll incomplete files
O_Created Offer
O_Created
O_Sent(Online) O_Sent(mail&Online)
O_Returned
O_Cancelled
O_Accepted O_Refused
Fig. 6. Obtained model for all subgroups together.

After “O_Accepted” and “A_Pending”, “O_Cancelled” occurred a lot because an ap-plication could have more than one offer, but just one of them was accepted.
4 Challenge's Questions
The company is interested in answers to the following questions: 1. What are the throughput times per part of the process, the difference between
the time spent in the company's systems waiting for processing by a user and the time spent waiting on input from the applicant as this is currently unclear in particular [Answered in section 4.1].
2. What is the influence of the frequency of incompleteness on the final out-come? The hypothesis here is that if applicants are confronted with more re-quests for completion, they are more likely to not accept the final offer [An-swered in section 4.2].
3. How many customers ask for more than one offer (where it matters if these offers are asked for in a single conversation or in multiple conversations)? How does the conversion compare between applicants for whom a single offer is made and applicants for whom multiple offers are made? [Answered in sec-tion 4.3].
4.1 First Question
In order to find throughput times per part of the process, we used discovered process models that are presented in Section 3. In this regard, for performance analysis purpose we applied "Replay a Log on Petri Net for Performance/Conformance Analysis" plugin in ProM on each part of the process model. Figure 7, shows the performance analysis of Application only activities.
Fig. 7. Performance Analysis of Application Only activities
As for Application activities, we only have the completion time of activities, so, we can only compute waiting time for them and throughput time can't be calculated. According to this figure, "A_cancelled" takes 28.25 days in average (frequency: 9,366 and stand-ard deviation: 10,14 days), then "A_validating" takes 9.82 days in average (frequency:

21,766 and standard deviation: 6,8 days). We cannot take "A_cancelled" as a bottleneck because cancellation, because it is mostly inside of customers not the company. Also, there is possible to be some rules that after a period withouth response the applications are applications are cancelled. But, "A_validating" could be a good option to consider as a bottleneck and it seems it is possible to be improved in the future. Similarly, in Figure 8 the performance analysis for Offer only activities is presented.
Fig. 8. Performance Analysis for Offer Only activities
Similar to the previous case, we only have complete activities in Offer activities, so we can only compute waiting time for them and throughput time is not calculable. In this figure, “O_cancelled” takes in average 24.96 days (frequency: 19,695 and standard de-viation: 13.46 days), then “O_returned” takes 8.79 days in average (frequency: 20,801 and standard deviation: 5.5 days). Similar to applications, we can't take “O_cancelled” as a bottleneck because cancellation of a case takes time usually by users and it hard to be improved. However, “O_returned” could be a good option to consider as a bottle-neck here, as it takes 8.78 days in average which is a big number compared to others. For workflow activities, we have more information so we use Table 10 to analyze the performance. In this table, each line correspond to one of workflow activities and we show that how many times each activity executed in different applica-tions. As it was presented in Figure 1, each activity has a life cycle, so total duration means the time between schedule to complete, ate_abort or withdraw. Suspend duration shows in average, how much time each activity be suspended. Finally, active duration compute by subtract of total duration and suspend duration. Note, "W_Shortened completion" and "W_Personal Loan collection" activities were not taken into account because of their low frequencies. As it shown in Table 10, the most throughput time in workflow activities relates to “W_Call after offers” that in average takes 14 weeks. Considering its fre-quency, in our view it is the most important activity that should be improved to have higher performance. With attention to suspend time of this activity, it is obvious that most of the time this activity is in suspend status.

Table 10. Performance analysis of workflow activities. Durations are computed in seconds and relate to average of different executions.
Event Name
Even
t C
oun
t
Ap
plication
C
oun
t
Total
Du
ration
Su
spend D
uration
Active
Du
ration
Su
spend
Cou
nt
W_Validate application 38,922 21,825 143,333 142,468 865 1.46 W_Call after offers 34,468 31,264 1,200,672 1,100,830 99,841 1.74 W_Complete application 31,434 31,411 134,701 78,404 56,296 1.04 W_Call incomplete files 22,968 14,958 344,345 343,731 613 2.57 W_Handle leads 20,362 20,339 3,970 209 3,761 0.06 W_Assess potential fraud 327 303 323,807 311,565 12,241 3.17
Another activity that effects on total duration of an application and also time of resource on company is “W_Complete application”. If the company decide to increase its performance these two activities would be the first candidate. Be-cause, they related to all applications (unlike “W_Call incomplete files” that just covers around half of the application) and they take lots of time from re-sources in the company. Even if we just consider active duration of these activ-ities, they takes more time to be completed. In another analysis we want to discover which applications take longer to be completed. Then, using Disco and its performance view that is shown in Figure 9, we could discover how much of applications are done fast or slow.
Fig. 9. Duration of applications.
We divided the applications based on their durations to four parts that is shown in Table 11.

Table 11. Applications divided the applications based on their durations.
Intervals (days)
Number of cases
Application Pending
Application Denied
Application canceled
0 - 5.72 1247(12%) 33.44% 13.23% 50.12%
5.73 - 25.74 17785(59%) 75.65% 16.91% 7.19%
25.75 - 34.32 8793(31%) 20.98% 4.05% 74.68%
34.33 - 288.9 3672(11%) 40.41% 5.96% 52.89%
In the first interval, canceled probability is higher than pending (accepting) and denied ones, but in the second interval pending probability is higher than denied and canceled ones. In the third interval, canceled probability is higher than denied and canceled ones which shows that there is a deadline of about 30 days for applications to cancel them if applicants don't send offers back. To be summarized we understand that most of the time spend for each application in cancelled cases are relate to customers. However, there are some activities like “W_Call after offers” that are take lots of time from the company’s resource.
4.2 Second question
To answer the second question we separated different applications by the number of times they have been requested for completion. The result of this analysis is given in Table 12.
Table 12. Effect of number of requests for competition on the application final result.
Number of requests for completion Cancelled Pending
Denied Total
0 224,331 (51%) 137,322 (31.2%) 77,355 (17.6%)
439,008
1 27,983 (6.9%) 326,927 (81.7%) 45,168 (11.2%)
400,078
2 13,575 (6%) 197,680 (87.4%) 14,883 (6.5%)
226,138
3 5,139 (5.8%) 78,026 (88.2%) 5,296 (5.9%)
88,461
4 1,848 (5.9%) 26,935 (86.8%) 2,221 (7.1%)
31,004
5 746 (7.2%) 9,186 (88.7%) 413 (3.9%) 10,345 6 0 (0%) 2263 (100%) 0 (0%) 2263 7 127 (11.4%) 829 (75%) 149(13.4%) 1105
We can reject the mentioned hypothesis in this question because applicants who are confronted with more requests for completion, they are more likely to accept the final offer. As the number of requests for completion increases, their pending probability increases too.
4.3 Third question
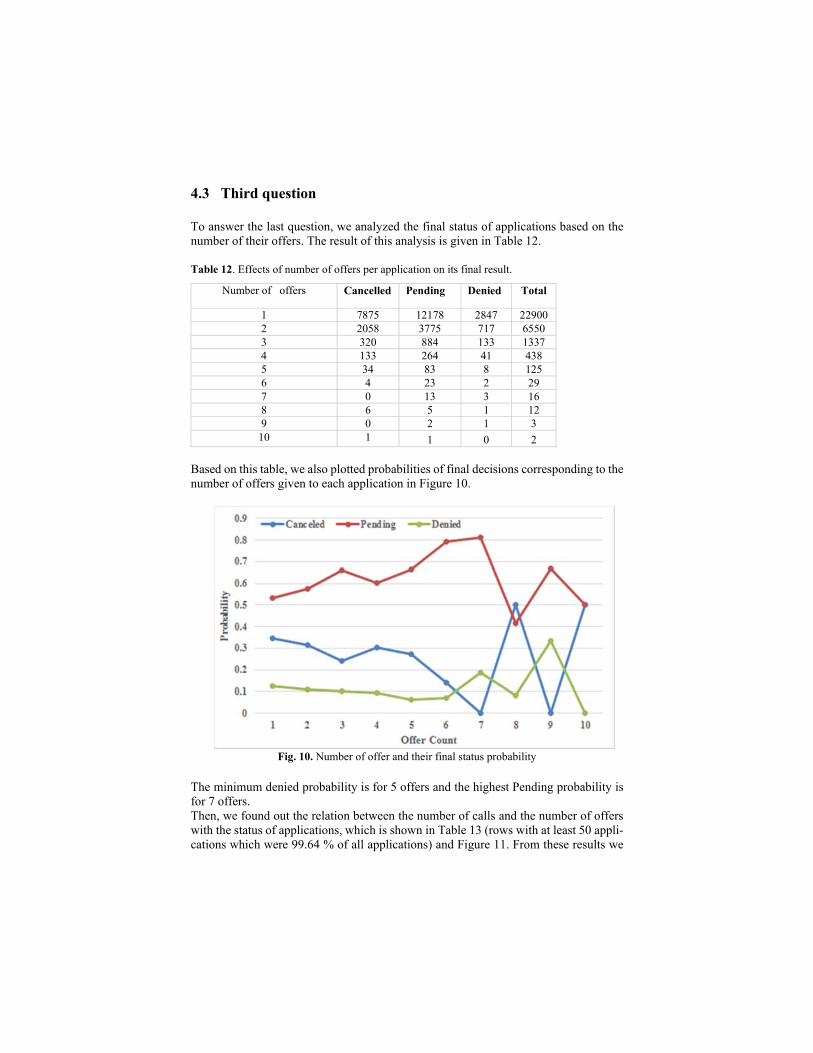
To answer the last question, we analyzed the final status of applications based on the number of their offers. The result of this analysis is given in Table 12.
Table 12. Effects of number of offers per application on its final result.
Number of offers Cancelled Pending Denied Total
1 7875 12178 2847 22900 2 2058 3775 717 6550 3 320 884 133 13374 133 264 41 438 5 34 83 8 125 6 4 23 2 29 7 0 13 3 16 8 6 5 1 12 9 0 2 1 3 10 1 1 0 2
Based on this table, we also plotted probabilities of final decisions corresponding to the number of offers given to each application in Figure 10.
Fig. 10. Number of offer and their final status probability
The minimum denied probability is for 5 offers and the highest Pending probability is for 7 offers. Then, we found out the relation between the number of calls and the number of offers with the status of applications, which is shown in Table 13 (rows with at least 50 appli-cations which were 99.64 % of all applications) and Figure 11. From these results we

could say that with increasing the number of offers per call, the acceptance rate of ap-plications will increased.
Table 13. Role of offers per calls rate on acceptance of applications.
Calls offers rate Cancelled probability
Pending probability
Denied Probability
Total
2 1 0.5 36.69 50.73 12.59 2336 2 2 1 24.55 61.08 14.37 668 1 1 1 33.88 53.80 12.33 20433 2 3 1.5 11.68 76.64 11.68 137 1 2 2 32.08 57.41 10.51 5860 1 3 3 25.35 64.89 9.76 1199 1 4 4 30.45 60.64 8.91 404 1 5 5 28.45 64.66 6.90 116
Fig. 11. Relation between number of offers and calls and their final status probability
5 Further Analysis
In this part, we did more analyses to discover interesting trends and dependencies. We used dotted chart plug-in in section 5.1, resource analysis was given in section 5.2, and analyses of decision tree was done in section 5.3. At last, in section 5.4 we bring the discovered interesting patterns that effect on the fraud detection of the company.
5.1 Visualization
We looked at the dotted chart and tried to find interesting trends. We imported the workflow event log in ProM and looked at the dotted chart view (helicopter view). We

sorted traces by the starting time of them and color different activities. As you see in Figure 12, it is like a line which means arrival rate is almost consistent.
Fig. 12. Dotted chart view for workflow event log.
It seems fewer works had been done in the summer because fewer applications arrived in the summer or many employees were in holidays. In addition, there are several ac-tivities that had been done in a batch (Figure 13) which means a responsible agent/user did all of those activities once (maybe he/she waited for another response, or he/she was not at work that moment).These kind of handling activities caused to increase the overall throughput time of applications and at much as possible the company should avoid resources from doing in this way.
Fig. 13. Batch processing in workflow event log.
Then, we imported Application event log and looked at the sorted dotted chart of it.

Fig. 14. Dotted chart view for application event log.
Now, we found out that there are fewer applications in summer and that is why em-ployees work less in summer from the plot related to employee's events.
4.2 Resource Analysis
About 27.43 percent of all events in A_* were done by User1. Based on other attributes such as short intervals between activities, only a computer agent could do that, we con-cluded that User1 is a computer agent. User1 did about 18.9 percent of all activities of W_*, It seems this result is because activities such as scheduling or alerting were done automatically using this agent. The activities of this user is given in Table 12. Such Activities have been done quickly after the previous activity (they were done by many different users) but the procedure should be automated. We found that all applications were “A_accepted”. Due to the financial crisis, the case volume has gone up considerably compared to 2012. In the description of this challenge, it was mentioned that there are 149 resources in this event log, but we only found 145 resources in the non-filtered event log. In the next analysis, we wanted to focus on workflow activities and how resources were
assigned to each activity. We only considered "start" life-cycle of activities. Also,
"W_Shortened completion" and "W_Personal Loan collection" activities were not
taken into account because of their low frequencies. In Table 15, the result of this anal-
ysis is shown. Most of the activities had been done with different users except
"W_Handle leads" and "W_Assess potential fraud" that seems they are more specific
tasks and just a group of resources handle them.
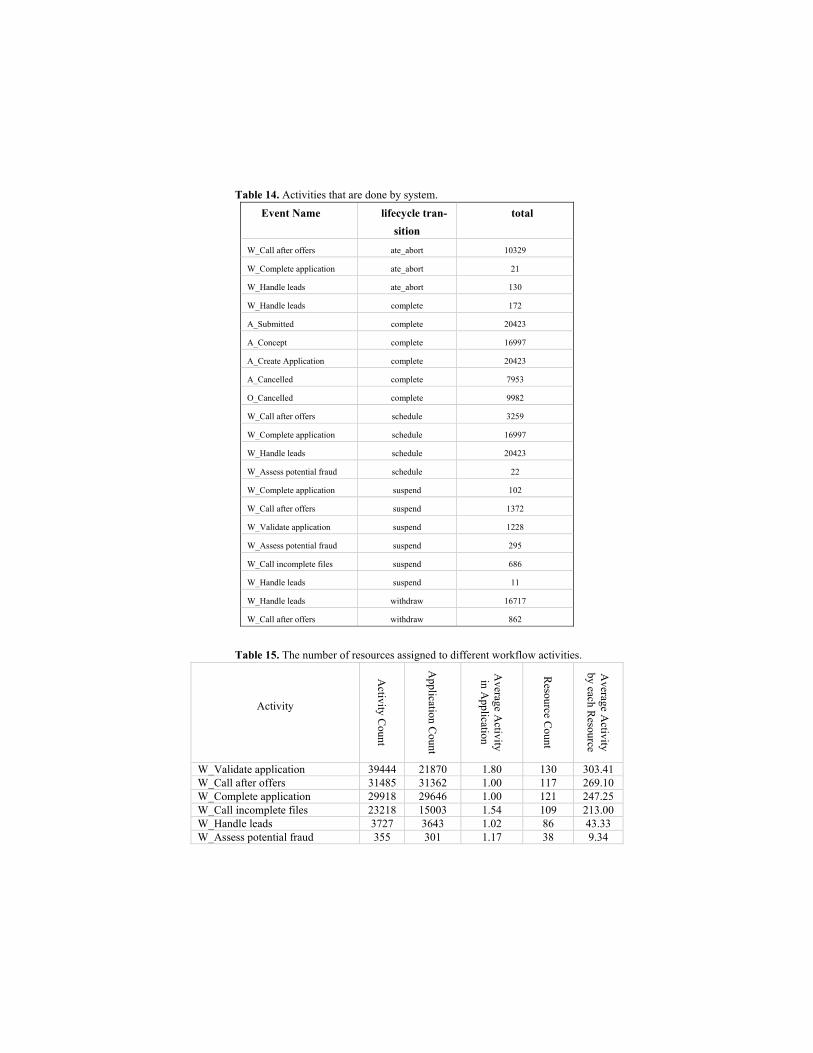
Table 14. Activities that are done by system.
Event Name lifecycle tran-
sition
total
W_Call after offers ate_abort 10329
W_Complete application ate_abort 21
W_Handle leads ate_abort 130
W_Handle leads complete 172
A_Submitted complete 20423
A_Concept complete 16997
A_Create Application complete 20423
A_Cancelled complete 7953
O_Cancelled complete 9982
W_Call after offers schedule 3259
W_Complete application schedule 16997
W_Handle leads schedule 20423
W_Assess potential fraud schedule 22
W_Complete application suspend 102
W_Call after offers suspend 1372
W_Validate application suspend 1228
W_Assess potential fraud suspend 295
W_Call incomplete files suspend 686
W_Handle leads suspend 11
W_Handle leads withdraw 16717
W_Call after offers withdraw 862
Table 15. The number of resources assigned to different workflow activities.
Activity
Activity C
ount
Application C
ount
Average A
ctivity in A
pplication
Resource C
ount
Average A
ctivity by each R
esource
W_Validate application 39444 21870 1.80 130 303.41 W_Call after offers 31485 31362 1.00 117 269.10 W_Complete application 29918 29646 1.00 121 247.25 W_Call incomplete files 23218 15003 1.54 109 213.00 W_Handle leads 3727 3643 1.02 86 43.33 W_Assess potential fraud 355 301 1.17 38 9.34

In Figure 15, we showed that how different activities were assigned to different re-
sources. In each chart, the x-axis corresponds to the resources and y-axis relates to the
number of times that activity was assigned to the corresponding resource. Results indi-
cate that "W_Call after offers" and "W_Complete application" had a very similar pat-
tern and they needed similar expertise. However, other ones had different patterns, for
example, "W_Validate application" were usually done with a specific group of re-
sources.
Fig. 15. How different resources assigned to different workflow activities.
To illustrate more, in the next analysis we focused more on the role of resources. In
Figure 16, each circle corresponds to the percentage of a resource workload which was
allocated for a specific activity. As it was shown, there are many resources that almost
do either "W_Validate application" or "W_Call incomplete files" activities; however,
for other activities, resources were not assigned just to them and they do different ac-
tivities.
Fig. 16. How different resources assigned to different workflow activities.

Based on these results and performance analysis outputs it seems that having more expertise resources that just handle one of "W_Call after offers" and "W_Complete application" may increase the performance of them and decrease the throughput time of applications.
4.3 Decision Tree
We came up with a decision tree related to this event log. We used RapidProm to con-struct a workflow to obtain a decision tree: This decision tree is about accepted and unaccepted loan offers. The RapidProm workflow is shown in the following figure.
Fig. 17. The designed workflow in RapidMiner to obtain a decision tree
The selected attributes to construct the decision tree are shown in Figure 18.
Fig. 18. Attributes of that are used in decision tree.

In the Figure 19 the discovered decision tree is shown. In this figure, True stands for pending loan offers and False stands for other statuses.
Fig. 19. Obtained decision tree Performance metrics of the obtained model are high enough to accept the decision tree:
accuracy: 73.55% precision: 72.76% (positive class: true) recall: 99.55% (positive class: true)
4.4 Subgroup Discovery
In the last analysis, we wanted to find in which scenario, more “W_Assess for po-tential fraud” were executed. For this purpose we use subgroup discovery algorithm [11]. The application of subgroup discovery in process mining is presented in [12].Us-ing this technique, we found that if some specific resources participated in the applica-tion procedure, then there would be more chance that application was checked for pos-sible fraud. The results of this analysis are given in Table 16. For example, the results show that 90% of applications that "User_143" took part in them are checked for fraud. Note that in general the percentage of applications that assessed for fraud is 0.9%.
Analysis showed that some factors like resource had an effect on acceptance rate. For example, if an application was completed by "User_10", then the acceptance rate of application would be 61%, but if it was completed by "User_57", then its acceptance rate would be 45%. Another interesting pattern was acceptance rate of applications with loan goal of "Unknown" which was 64%, but for those with "unspecified" goal, the acceptance rate was 40%. The last line in Table 16 explains that if an application is done fast there is a few probability to be assessed for fraud. Note that this probability

for applications with long duration time is around 1.5 %. However, the results show that random assessing for fraud detection is not done in this company and they mostly assess the fraud based on other observations.
Table 16. Results of applying subgroup discovery technique to investigate which parameters
have more role in applications that assessed for fraud. Parameter Assessed for fraud Total Application User_138 81% 123 User_144 89% 84 User_143 90% 70Denied 4% 3747
User_144 Complete Appli-cation
71% 7
Motorcycle 3% 275 Application that are done
in 6 days 0.48% 6
Conclusion
In this paper we try to apply a range of process mining algorithm to discover knowledge about a Dutch financial institute event log. We firstly filter the event log to just consider the complete traces. Then we separate the event log in to three event logs and apply some of popular process discovery algorithms on them to discover their process models. Also we use conformance checking techniques to analyze which process models are replaying the behaviour in the log better. We also show in a simple way how these three processes are relate to each other. Then we apply performance analysis techniques to find the bottlenecks. Also, we answers the questions that are asked by challenge conductors. We also benefit from some other process mining techniques, e.g. subgroup discovery and decision tree analysis to find interesting patterns in this event log.
We find that there are some logging problem in the system that may cause some prob-lems on data quality issues. Also, we think that the company could increase its perfor-mance by having more specific tasks for resources and avoiding doing activity in a batch way. Furthermore, we believe that the company could provide more general pol-icies for assessing applications for fraude.

References
[1] van der Aalst, Wil MP. Process mining: data science in action. Springer, 2016. [2] Buijs, Joos CAM, Boudewijn F. Van Dongen, and Wil MP van Der Aalst. "On the role of fitness, precision, generalization and simplicity in process discovery." OTM Confederated International Conferences" On the Move to Meaningful Internet Sys-tems". Springer Berlin Heidelberg, 2012. [3] Van der Aalst, Wil, Ton Weijters, and Laura Maruster. "Workflow mining: Discov-ering process models from event logs." IEEE Transactions on Knowledge and Data Engineering 16.9 (2004): 1128-1142. [4] Wen, Lijie, Jianmin Wang, and Jiaguang Sun. "Detecting implicit dependencies be-tween tasks from event logs." Frontiers of WWW Research and Development-APWeb 2006 (2006): 591-603. [5] Weijters, A. J. M. M., and J. T. S. Ribeiro. "Flexible heuristics miner (FHM)." Com-putational Intelligence and Data Mining (CIDM), 2011 IEEE Symposium on. IEEE, 2011. [6] Leemans, Sander JJ, Dirk Fahland, and Wil MP van der Aalst. "Discovering block-structured process models from event logs-a constructive approach." International Con-ference on Applications and Theory of Petri Nets and Concurrency. Springer Berlin Heidelberg, 2013. [7] Leemans, Sander JJ, Dirk Fahland, and Wil MP van der Aalst. "Discovering block-structured process models from event logs containing infrequent behaviour." Interna-tional Conference on Business Process Management. Springer International Publishing, 2013. [8] Buijs, Joos CAM, Boudewijn F. Van Dongen, and Wil MP van Der Aalst. "On the role of fitness, precision, generalization and simplicity in process discovery." OTM Confederated International Conferences" On the Move to Meaningful Internet Sys-tems". Springer Berlin Heidelberg, 2012. [9] Günther, Christian W., and Wil MP Van Der Aalst. "Fuzzy mining–adaptive process simplification based on multi-perspective metrics." International Conference on Busi-ness Process Management. Springer Berlin Heidelberg, 2007. [10] van Zelst, Sebastiaan J., et al. "Discovering Relaxed Sound Workflow Nets using Integer Linear Programming." arXiv preprint arXiv:1703.06733 (2017). [11] Lavrač, Nada, et al. "Subgroup discovery with CN2-SD." Journal of Machine Learning Research 5.Feb (2004): 153-188. [12] Fani Sani, Mohammadreza, et al. "Subgroup discovery in Process Mining." Lec-ture Notes in Business Information Processing. Vol 255 (2017).