business-driven service delivery cmg – philadelphia, pa brian j coryea solution sales director
TRANSCRIPT

Business-driven Service DeliveryCMG – Philadelphia, PA
Brian J CoryeaSolution Sales Director

2
Challenges for IT Operations2. End users don’t tell us!
2,00
0,00
0 cu
stom
ers
Poorexperience
22%
Positiveexperience
78%
Complain2%
Do notcomplain
98%
440,000customers
Source: Gartner, “How to Approach Customer Experience Management”
1. We don’t know about performance issues until end users tell us.
73%of IT service issues are discovered by end users
Source: Forrester study commissioned by Compuware
3
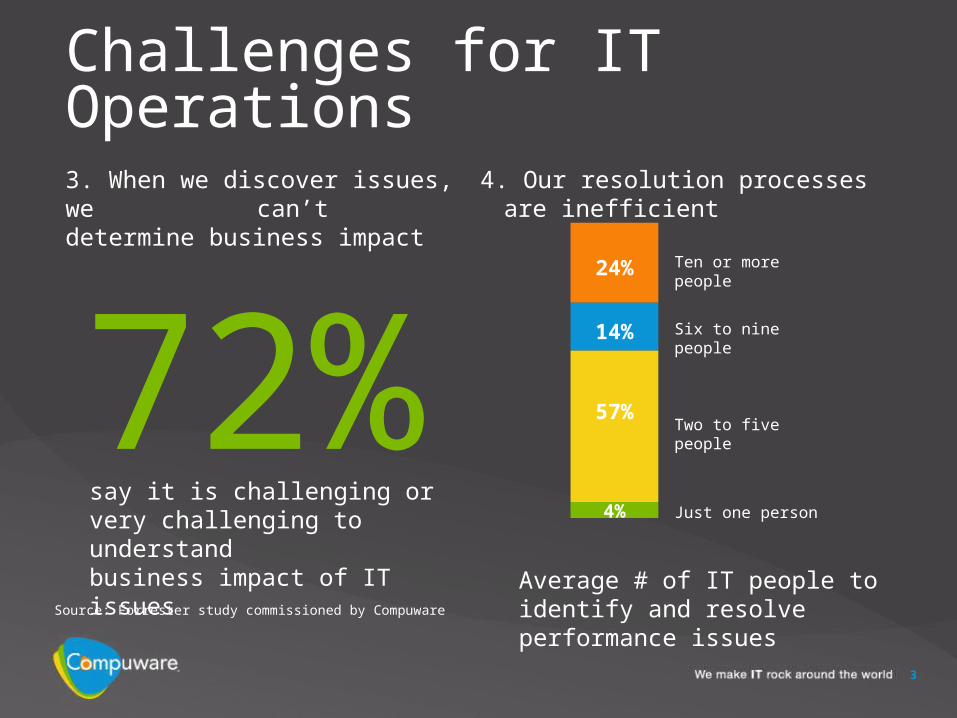
Challenges for IT Operations4. Our resolution processes are inefficient
Average # of IT people to identify and resolve performance issues
Just one person
Ten or more people
Six to nine people
Two to five people
4%
57%
14%
24%
3. When we discover issues, we can’t determine business impact
Source: Forrester study commissioned by Compuware
72%say it is challenging or very challenging to understand business impact of IT issues

4
Impact of Service Delivery Challenges
Lost or delayed revenue
Diminished brand equity
Customer/user dissatisfaction
Competitive disadvantage
Increased time-to-market
Business
Credibility loss
Inefficient resource allocation
Deployment failures
Outsourcing threat
SLA non-compliance
Unnecessary capacity investments
Inability to demonstrate ROI
IT Operations
5
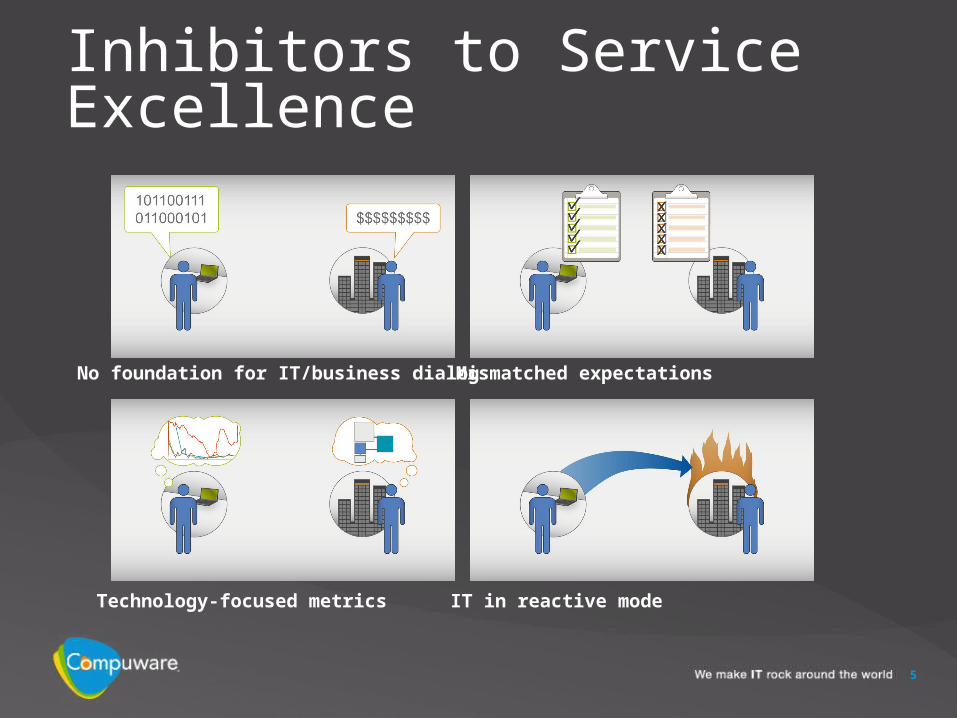
Inhibitors to Service Excellence
No foundation for IT/business dialog Mismatched expectations
Technology-focused metrics IT in reactive mode

6
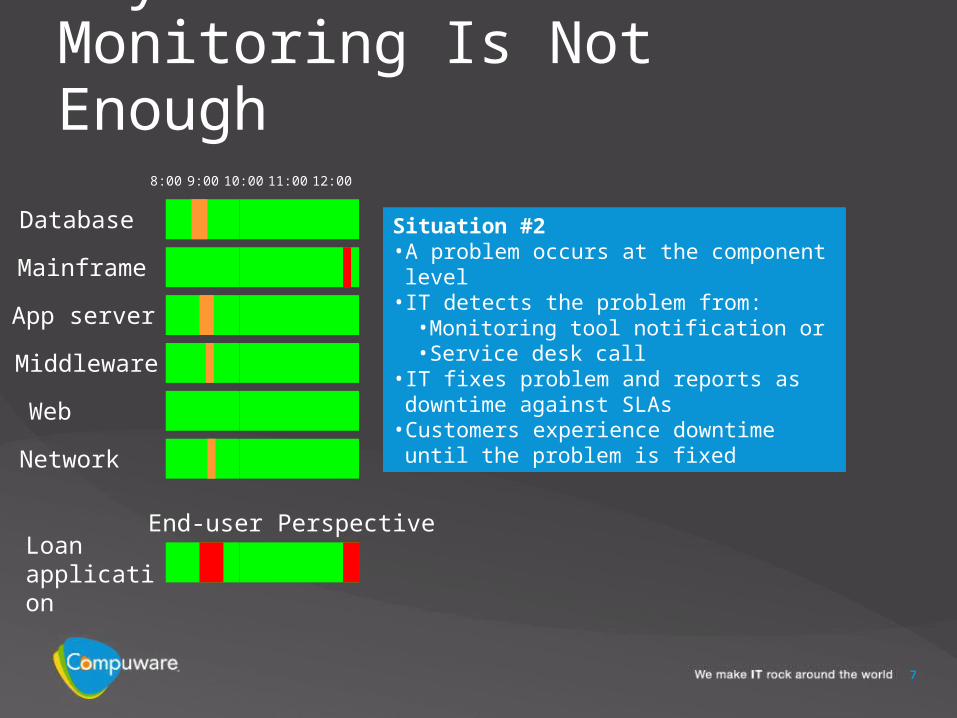
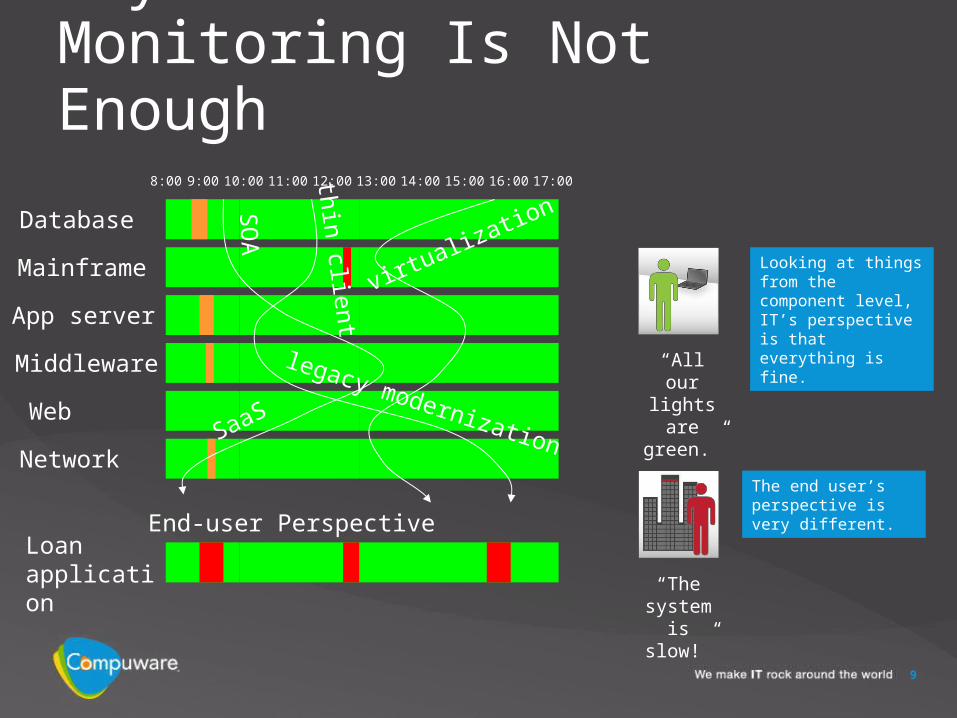
Why Traditional Monitoring Is Not Enough
End-user Perspective
Network
Web
Middleware
App server
Mainframe
Database
Loan application
8:00 9:00 10:00
Situation #1• “Normal” slow-downs occur at component level • In IT’s view no real downtime has occurred• Performance is unacceptable to end user• Difficult for IT to pinpoint the source of the problem.
• Do we need to add network bandwidth? • Server capacity? • Is there an application issue?
7
Why Traditional Monitoring Is Not Enough
End-user Perspective
Network
Web
Middleware
App server
Mainframe
Database
Loan application
11:00 12:00
Situation #2• A problem occurs at the component level• IT detects the problem from:
• Monitoring tool notification or• Service desk call
• IT fixes problem and reports as downtime against SLAs
• Customers experience downtime until the problem is fixed
8:00 9:00 10:00
8
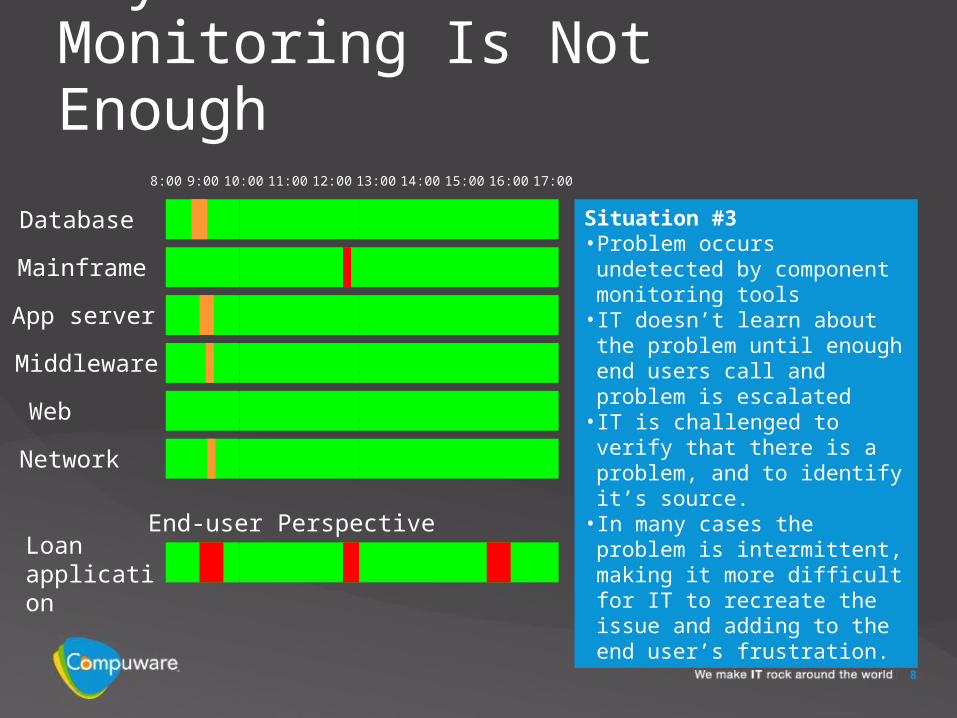
Why Traditional Monitoring Is Not Enough
End-user Perspective
Network
Web
Middleware
App server
Mainframe
Database
Loan application
13:00 14:00 15:00 16:00 17:00
Situation #3• Problem occurs undetected by
component monitoring tools• IT doesn’t learn about the
problem until enough end users call and problem is escalated
• IT is challenged to verify that there is a problem, and to identify it’s source.
• In many cases the problem is intermittent, making it more difficult for IT to recreate the issue and adding to the end user’s frustration.
11:00 12:008:00 9:00 10:00
9
13:00 14:00 15:00 16:00 17:0011:00 12:008:00 9:00 10:00
Why Traditional Monitoring Is Not Enough
End-user Perspective
Network
Web
Middleware
App server
Mainframe
Database
Loan application
“All our lights are green.”
“The system is slow!”
Looking at things from the component level, IT’s perspective is that everything is fine.
The end user’s perspective is very different.
virtualization
thin client
SO
A
SaaS
legacy modernization
10
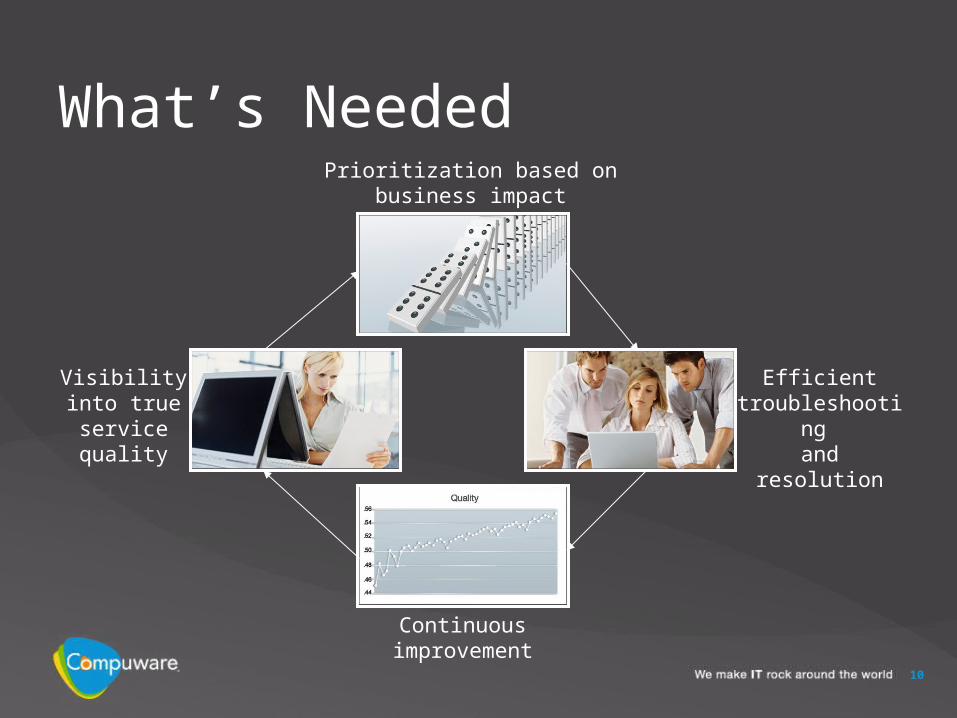
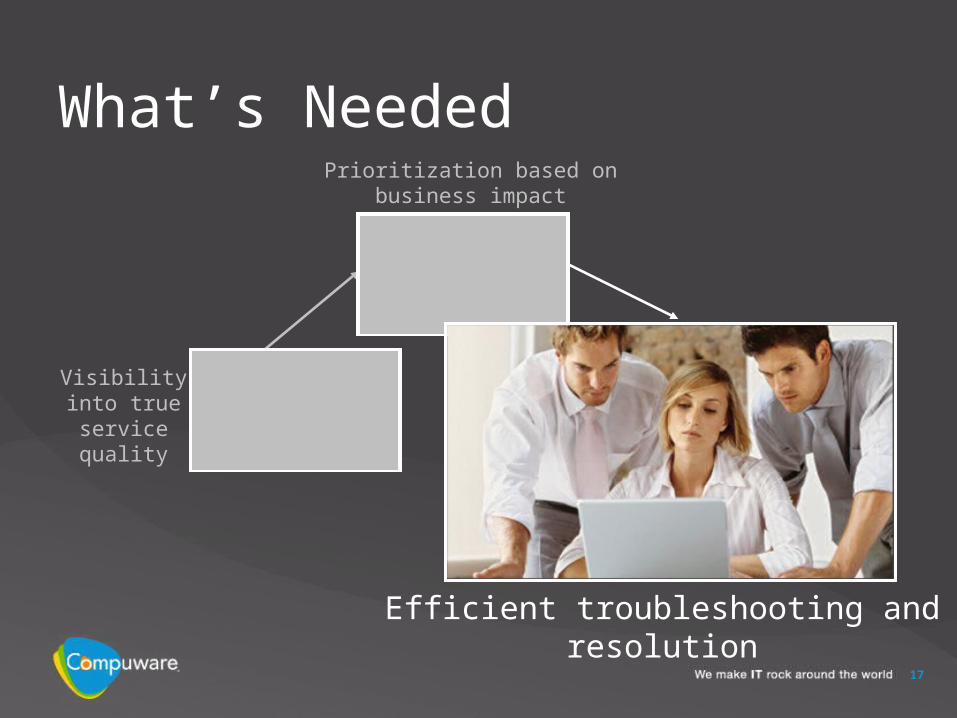
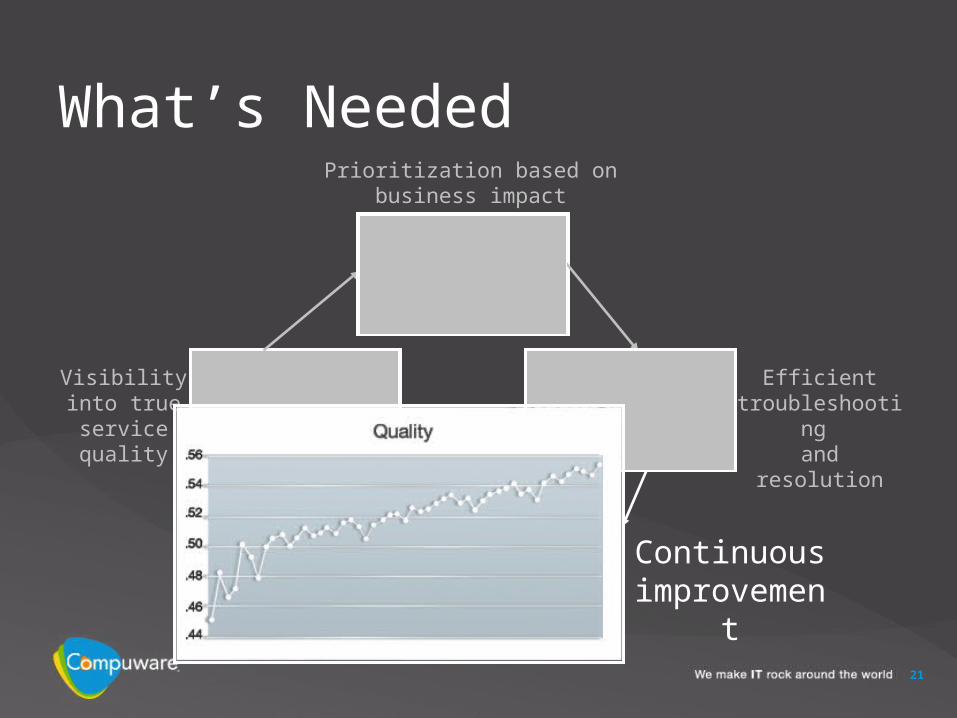
What’s NeededPrioritization based on
business impact
Efficient troubleshooting and resolution
Continuous improvement
Visibility into true service
quality
11
Visibility into true service quality
What’s Needed
12
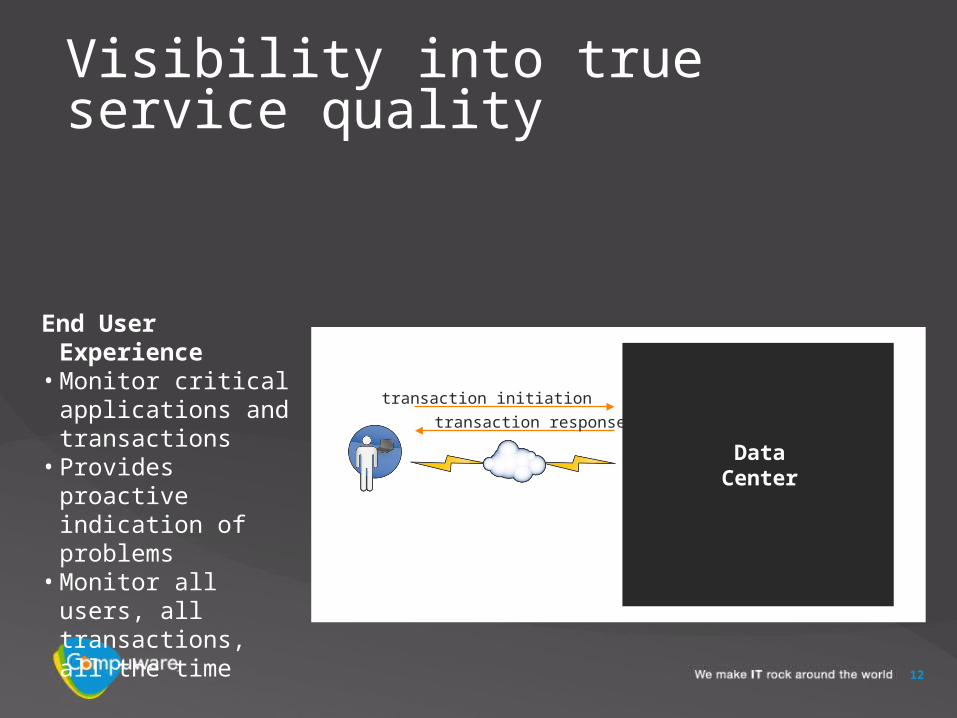
Visibility into true service quality
DataCenter
transaction initiation
transaction response
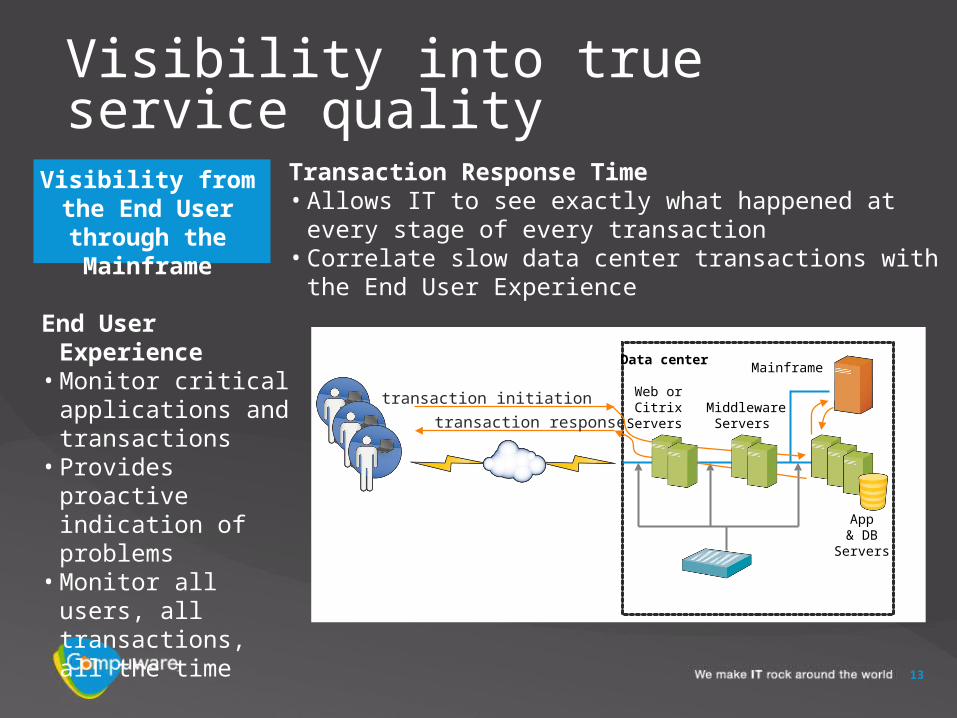
End User Experience• Monitor critical
applications and transactions
• Provides proactive indication of problems
• Monitor all users, all transactions, all the time
13
End User Experience• Monitor critical
applications and transactions
• Provides proactive indication of problems
• Monitor all users, all transactions, all the time
Transaction Response Time• Allows IT to see exactly what happened at every stage of
every transaction• Correlate slow data center transactions with the End User
Experience
Visibility from the End User through
the Mainframe
transaction initiation
transaction response
Web or Citrix
Servers
App& DB
Servers
Middleware Servers
Mainframe Data center
Visibility into true service quality

14
Prioritization based on business impact
Visibility into true service
quality
What’s Needed
15
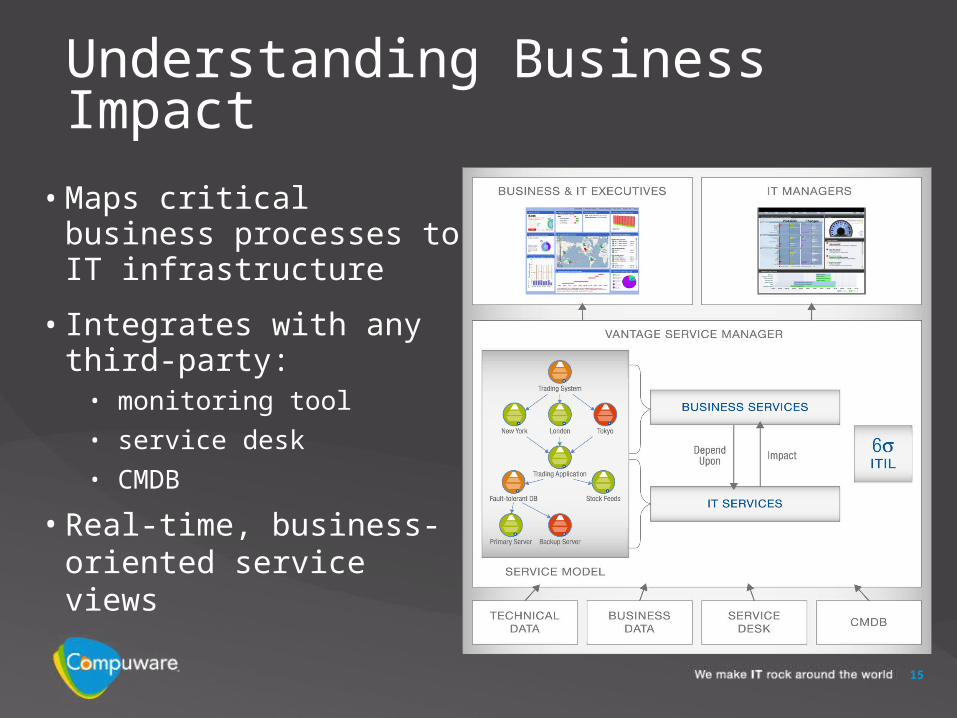
Understanding Business Impact
• Maps critical business processes to IT infrastructure
• Integrates with any third-party:
• monitoring tool
• service desk
• CMDB
• Real-time, business-oriented service views
16
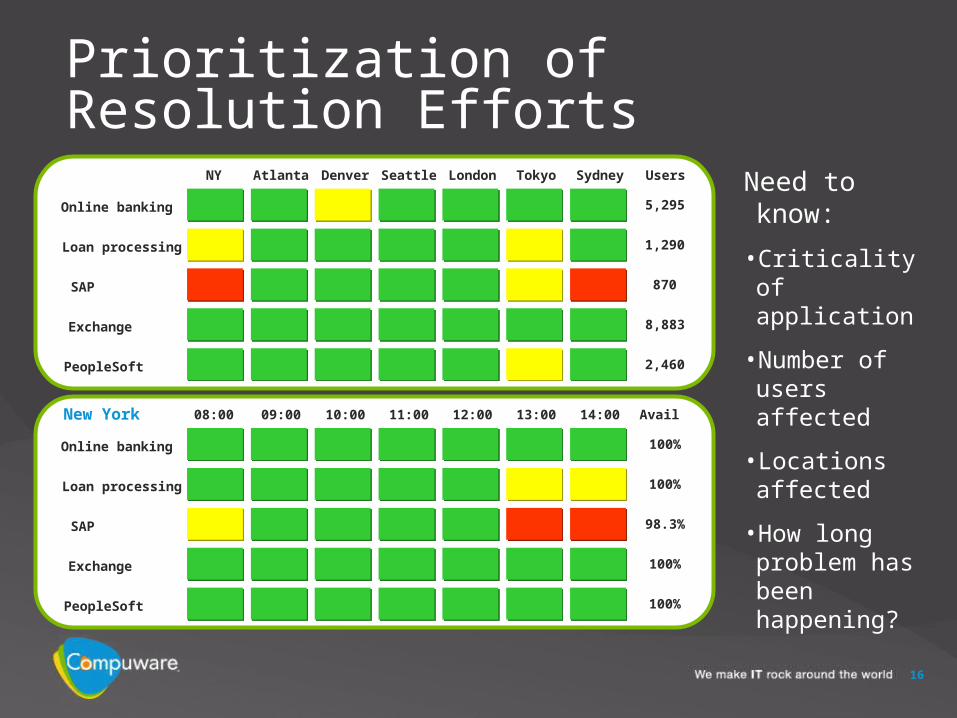
Prioritization of Resolution EffortsNeed to know:
• Criticality of application
• Number of users affected
• Locations affected
• How long problem has been happening?
Online banking
SAP
Exchange
PeopleSoft
Loan processing
NY Atlanta Denver Seattle London Tokyo Sydney Users
5,295
1,290
870
8,883
2,460
Online banking
SAP
Exchange
PeopleSoft
Loan processing
08:00 09:00 10:00 11:00 12:00 13:00 14:00 Avail
100%
100%
98.3%
100%
100%
New York
17
Prioritization based on business impact
Efficient troubleshooting and resolution
Visibility into true service
quality
What’s Needed
18
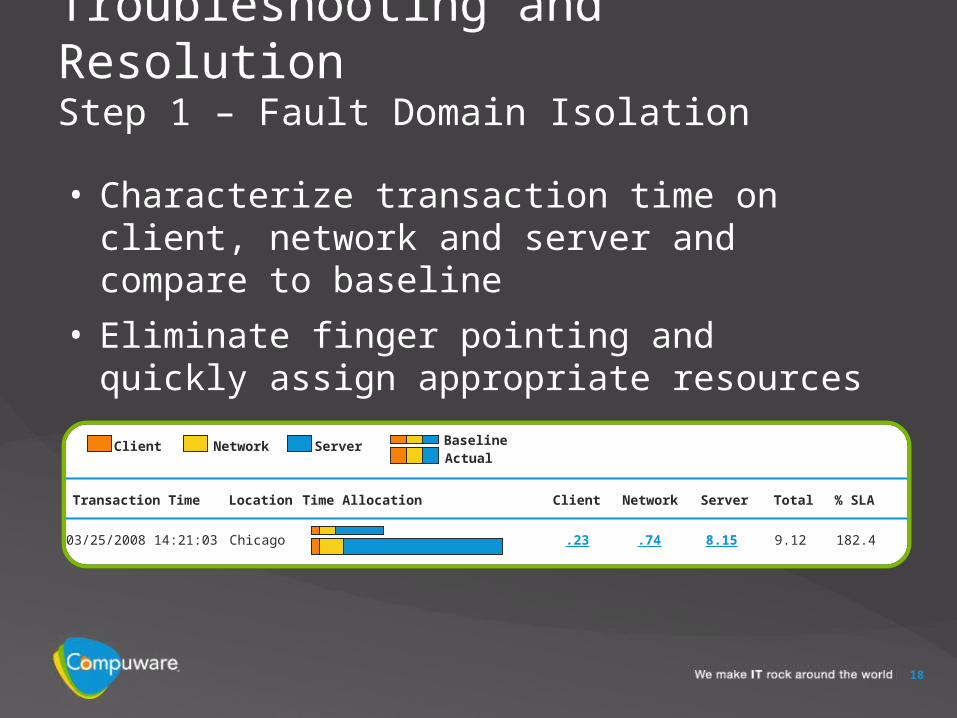
Troubleshooting and ResolutionStep 1 – Fault Domain Isolation
• Characterize transaction time on client, network and server and compare to baseline
• Eliminate finger pointing and quickly assign appropriate resources
Client Network Server BaselineActual
03/25/2008 14:21:03 Chicago .23 .74 8.15 9.12 182.4
Client Network Server Total % SLATransaction Time Location Time Allocation
19
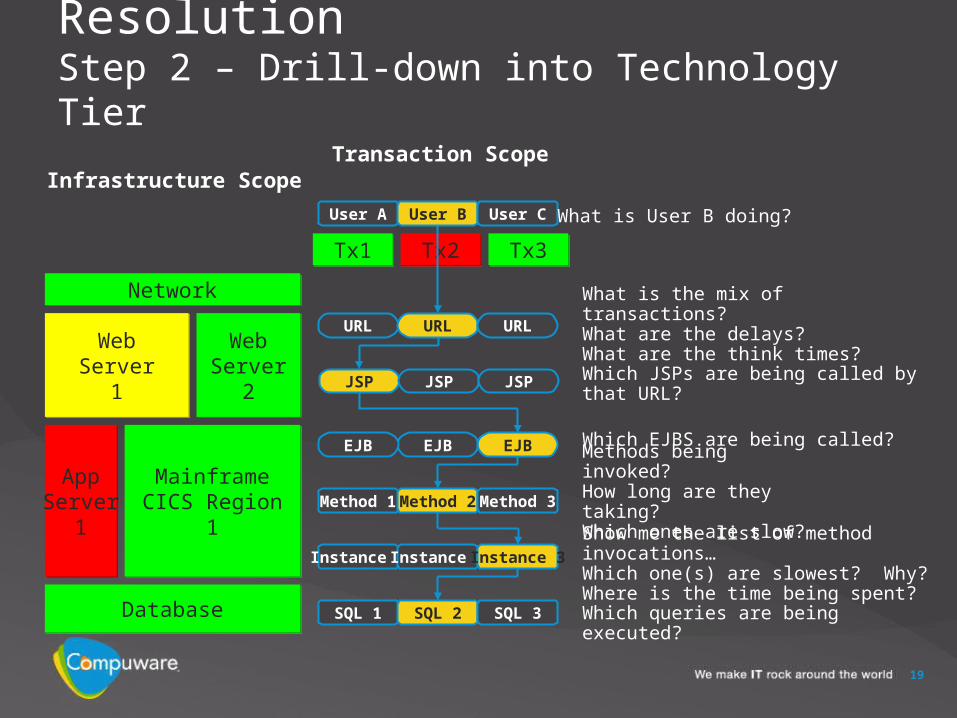
Troubleshooting and ResolutionStep 2 – Drill-down into Technology Tier
Infrastructure ScopeTransaction Scope
User A User B User C
Tx1Tx1 Tx2Tx2 Tx3Tx3
NetworkNetwork
WebServer
1
WebServer
1
WebServer
2
WebServer
2
AppServer
1
AppServer
1
MainframeCICS Region
1
MainframeCICS Region
1
DatabaseDatabase
URL URL URL
JSP JSP JSP
EJBEJBEJB
Method 1 Method 2 Method 3
Instance 1 Instance 2 Instance 3
SQL 1 SQL 2 SQL 3
What is User B doing?
What is the mix of transactions?What are the delays?What are the think times?
Which JSPs are being called by that URL?
Which EJBS are being called?
Methods being invoked?How long are they taking?Which ones are slow?
Show me the list of method invocations…Which one(s) are slowest? Why?Where is the time being spent?
Which queries are being executed?
20
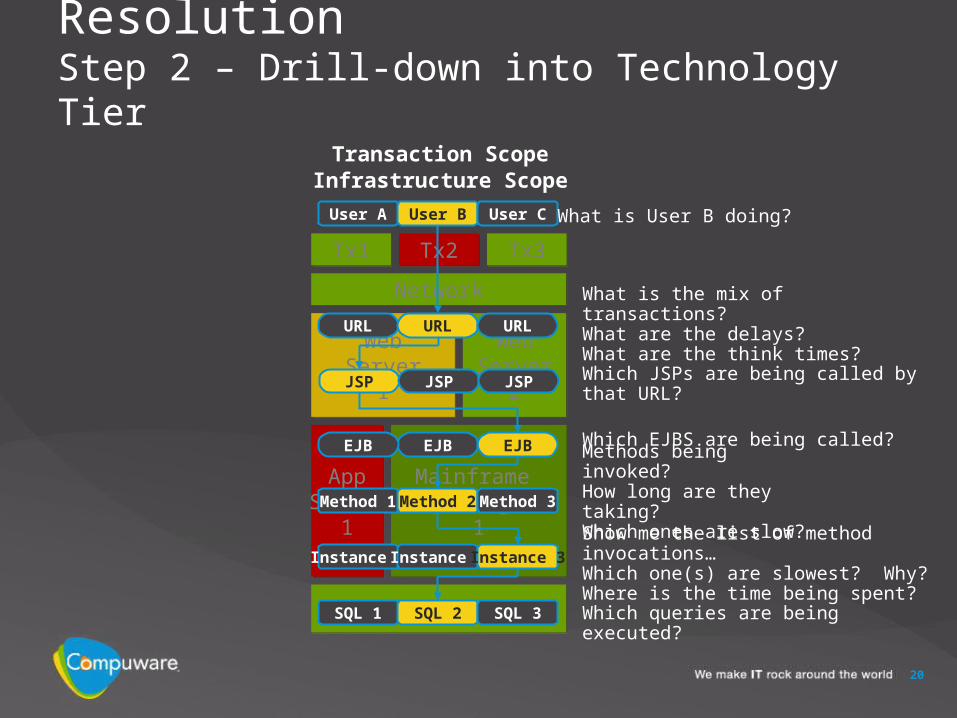
Troubleshooting and ResolutionStep 2 – Drill-down into Technology Tier
User A User B User C
Infrastructure Scope
Tx1Tx1 Tx2Tx2 Tx3Tx3
NetworkNetwork
WebServer
1
WebServer
1
WebServer
2
WebServer
2
AppServer
1
AppServer
1
Mainframe CICS Region
1
Mainframe CICS Region
1
DatabaseDatabase
URL URL URL
JSP JSP JSP
EJBEJBEJB
Method 1 Method 2 Method 3
Instance 1 Instance 2 Instance 3
SQL 1 SQL 2 SQL 3
What is User B doing?
What is the mix of transactions?What are the delays?What are the think times?
Which JSPs are being called by that URL?
Which EJBS are being called?
Methods being invoked?How long are they taking?Which ones are slow?
Show me the list of method invocations…Which one(s) are slowest? Why?Where is the time being spent?
Which queries are being executed?
Transaction Scope
21
Prioritization based on business impact
Efficient troubleshooting and resolution
Continuous improvement
Visibility into true service
quality
What’s Needed
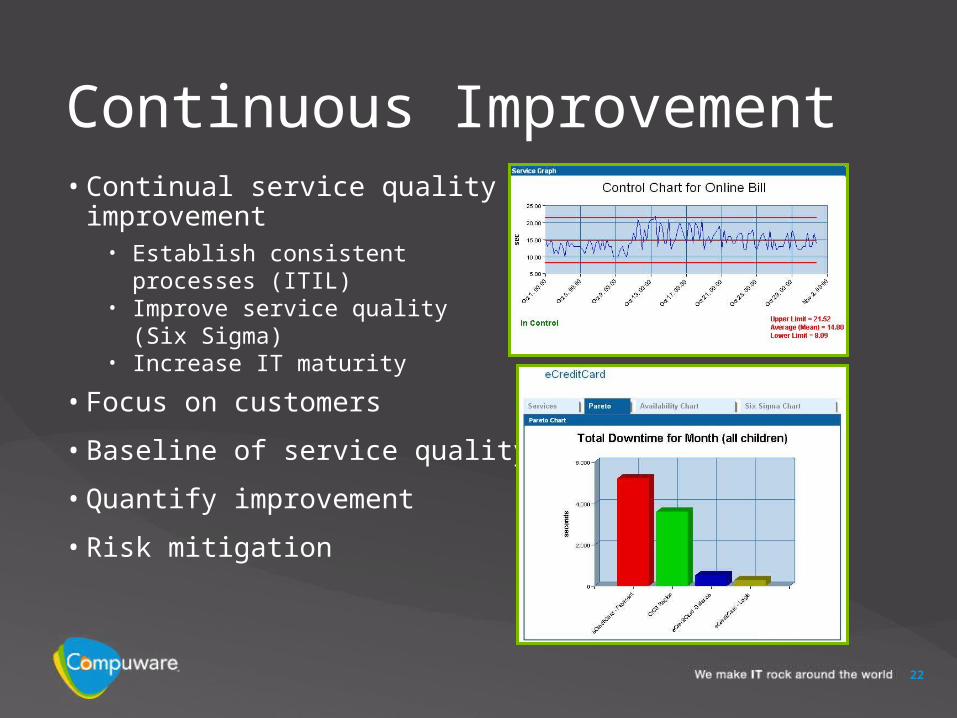
22
Continuous Improvement• Continual service quality
improvement• Establish consistent
processes (ITIL)• Improve service quality
(Six Sigma)• Increase IT maturity
• Focus on customers
• Baseline of service quality
• Quantify improvement
• Risk mitigation

23
Prioritization based on business impact
Efficient troubleshooting and resolution
Continuous improvement
Visibility into true service
quality
What’s Needed
© 2008 Compuware Corporation — All Rights Reserved