building strengths shaping the fu tur e annual report 2014.pdfbulk edible oils and fats we produce...
TRANSCRIPT

Mewah InternatIonal Inc. ANNUAL REPORT 2014
Shaping ThE FuTurE
Building STrEngThS

sayOKto
!
sayOKto
!

contentSCorporate Profile 2
Group Structure 5
Chairman’s Message 6
CEO’s Message 7
Board of Directors 8
Senior Management 11
Operations and Financial Review 13
Forward Looking Strategy 19
Research and Development 20
Risk Management 21
Corporate Social Responsibility 23
Corporate Governance 25
Financial Statements 37
Statistics of Shareholdings 118
Notice of Annual General Meeting 121
Corporate Information 125
Mewah InternatIonal Inc.
We are a global agri-business focused on edible oils and fats with refineries and processing facilities in Malaysia and Singapore, established brands and sales to customers in over 100 countries.
We are strategically positioning ourselves to become a global consumer products business by expanding range of consumer products, offering specialised applications and customer solutions while consolidating our position in oils and fats business.
MEwAh INTERNATIONAL INc. ANNUAL REPORT 2014
1
Sales volume of
4.0 million M.t.
Sales in over
100 countries
europe
Pacific oceania
Middle east
africaamericas asia

Corporate profile Building StrengthS Shaping the Future
2
corPorate ProfIle
Our operations are integrated throughout the value chain of edible oils and fats, from sourcing of raw materials, refining, processing, packing, branding to marketing and distributing to end customers under our own brands.
Mewah Group is an integrated agri-business focused on edible oils and fats. One of the largest palm oil processors in the world by capacity, Mewah produces a wide range of refined and fractionated vegetable oils and fats principally from palm oil. It also produces oils and fats from lauric oils, such as palm kernel oil and coconut oil; and from soft oils, such as soybean oil, canola oil, sunflower seed oil and corn oil. Featuring integrated operations throughout the edible oils and fats value chain, from sourcing and processing of raw materials to packing, branding, merchandising, shipping and distribution of the products, Mewah’s products are sold to customers in more than 100 countries, duly supported by its wide range of brands including long established and well recognized Oki and Moi brands.
Mewah has been in operation since the 1950s. Since then it has established packing operations importing RBD palm oil and RBD palm olein from refineries in Johor, Malaysia, repacking them in the facilities in Singapore and distributing them first in Singapore and later, globally. In 1987, Mewah commenced refining crude palm oil in its first refinery in Selangor, Malaysia with a production capacity of 400 MT a day or approximately 140,000 MT annually.
Today, Mewah has grown to be one of the largest edible oils and fats businesses with a current total refining capacity of 10,000 MT a day or 3.5 million MT annually. Mewah currently has four refineries and processing plants, two packing plants, a biodiesel plant and a dairy manufacturing facility in Malaysia and one packing plant in Singapore.
Mewah strives to be a global consumer products business by expanding range of consumer products, offering specialised applications and customer solutions while consolidating its position in oils and fats business.
To support its strategic vision and growth plans, after remaining privately controlled business for over 50 years, Mewah went public in 2010 and got listed on the mainboard of the Singapore Exchange Securities Trading Limited. Since going public, Mewah has invested in a new palm-oil refinery, a palm-oil based dairy manufacturing facility and a biodiesel plant in Malaysia. It has also added rice, dairy and palm-based soap to its product portfolio.
The addition of rice and dairy products to our product portfolio has helped us to offer wider range of consumer products to our existing and new customers who import and distribute various end products in the destination markets. The addition of new products under our own brands not only opens up new opportunities for us but also provides significant synergies to our existing business. BuSinESS SEgmEnTSThe Group’s business consists of two business segments namely the Bulk segment and Consumer Pack segment.
Bulk SEgmEnTOur bulk segment produces and sells vegetable-based edible oil and fat products in bulk. These products are refined and fractionated from palm oil, lauric oils, and soft oils. The main
cuStoMerS
uPStreaM
• Plantation• Milling
DownStreaMMIDStreaM
• Consumer packs • Branding• Private Label • Sale / marketing• Distribution
• Refining palm oil• Specialty fats• Applications
developments

Corporate profile Mewah InternatIonal Inc. annual report 2014
3
bulk edible oils and fats we produce are RBD palm oil, RBD palm olein and RBD palm stearin. RBD palm oil is a major component used in the manufacturing of margarines and shortenings and is also used for frying. RBD palm olein is mainly used as cooking oil and in industrial applications for processed foods such as fries and chips. RBD palm stearin is used mainly to manufacture margarine, shortenings, soaps and detergents.
We also produce specialty fats and oils in bulk form. We sell our specialty fats and oils in bulk form primarily to distributors and factories involved in the production of confectionery, bakery products and other food items.
We source the raw materials for our bulk edible oils and fats division, primarily palm oil as well as lauric oils and soft oils, mainly from suppliers in Malaysia where our manufacturing operations are located, or from Indonesia and South America. Our bulk edible oil products are sold to refiners, processers, wholesalers and retailers in the food, animal feed and oleochemicals industries.
ConSumEr paCk SEgmEnTOur consumer pack products division produces vegetable-based edible oil and fat products, including specialty fats, in the form of consumer packs and sells under our own brands such as Oki and Moi, and under the brands of third parties, primarily to importers and distributors at destination markets who in turn sell to supermarkets and retailers for sale to households and other consumers. Our specialty fats
and confectionary oils are sold primarily to distributors, and factories involved in the production of confectionery, bakery products and other food items. We have recently added rice and dairy products in our portfolio, to be sold in consumer pack form, under our own house brands.
The raw materials for our consumer pack products are primarily palm, lauric and soft oils that are sourced in bulk, together with the raw materials for the rest of our business divisions mainly from suppliers located in Malaysia. Our consumer pack products are produced at our Westport and Pasir Gudang refineries in Malaysia and at our packing plants in Malaysia and Singapore.
We manufacture our own packaging for our consumer pack products at our packing plants in Malaysia as well as purchase from third parties.
Our consumer pack products are marketed and sold by our sales offices located in Singapore, Malaysia, Australia, China, India, Europe, Russia and West Africa to customers in more than 100 countries around the world.
Our buyers, importers and distributors of oils and fats have been having long lasting relationship with us. Recent addition of rice and palm oil based dairy products to our portfolio not only adds new stream of income but also helps us to serve our existing customers better as they normally deal in a basket of commodities.
Further processing
Sourcing of refined products
Consumer pack products
Sales, marketingand distribution
Customers
Packing
conSuMer PackBulk
Sourcing of raw materials
Refining and processing
Refined products
Sales, marketing & distribution
Customers

Corporate profile Building StrengthS Shaping the Future
4
manuFaCTuring opEraTionSWith current refining capacity of 3.5 million MT per annum, we are one of the largest palm oil processors in the world. The large size of our plants enables us to achieve economies of scale as we are able to spread capital expenditures and fixed costs over a large volume of products produced and lower our cost of production per MT at each plant.
We currently have four refineries in Malaysia, two packing plants in Malaysia and one packing plant in Singapore. Our refineries in Westport, Pasir Gudang and Sabah are situated near to ports that are located along major shipping routes and have pumping facilities that allow us to receive CPO supplies from and deliver our bulk products to sea-calling vessels directly. We have also recently invested in a palm-oil based dairy manufacturing facility and a biodiesel plant in Westport, Malaysia.
Our plant at Semenyih is strategically located inland near many of our local customers. All our refineries and packing plants are strategically located to easy access of raw materials and distribution facilities which reduces the time to market our products at lower costs.
Apart from the refining of CPO and CPKO (Crude Palm Kernel Oil), our facilities in Malaysia are also able to carry out numerous other functions, such as fractionation and hydrogenation, neutralising, winterizing and texturising, which allow us to produce a variety of products and customise products to suit our customers’ need. With high capacity utilisation, our refineries are one of the most efficiently run refineries in the world. Most of our refineries and processing facilities are ISO certified to provide assurance to our customers that our quality management systems meet specific standards. We have also received various other accreditations and certifications, such as Halal and HACCP certifications, which allow our products to be sold in diversified markets and broader range of customers.
mErChandiSing and gloBal diSTriBuTion CapaBiliTiESWe sell and distribute our bulk and consumer pack products to customers in more than 100 countries in Asia Pacific, the Indian sub-continent, Middle East, Africa and Europe through a well-established global sales and distribution network. We distribute our products through our own distribution network of sales and marketing offices in Singapore, Malaysia, Australia, China, India, Europe, Russia and West Africa. In addition, we employ a multi-cultural marketing team which gives us competitive advantage in accessing and understanding the respective local markets. Aside from the high and consistent quality of our products which plays a fundamental role in our merchandising and distribution network, we are also able to develop products to meet our customers’ specifications and assist them in designing, packaging and branding of products under their respective brands. This has allowed us to forge strong relationship with our key customers from around the world, many of them are well-known large companies, in addition to our timely and reliable supplies of edible oil and fat to meet their needs.
ConSumEr BrandSWe have a wide range of consumer pack products marketed under our house brands, such as ‘Oki’, ‘Mona’, ‘Moi’, ‘Krispi’, ‘Deli’, ‘Turkey’, ‘Cabbage’, ‘Mewah’ and ‘Fry-ola’, we believe many of them are established and well-recognised names. Our ‘Oki’ and ‘Moi’ brands are some of the leading brands of edible oils in Africa. Our consumer pack products are available in countries in the Asia Pacific, the Indian sub-continent, Middle East, Africa and Europe. Following more than 50 years experience in establishing and promoting our brands, we have developed and acquired in-depth knowledge of the types of products, packaging, pricing and display that will appeal to consumers of our targeted markets. As such, we are well positioned to take advantage of potentially growing markets for our consumer pack products.
PenInSular MalaySIa
SIngaPore
eaSt MalaySIa
Pasir Gudang refinery and packing plant
Singapore packing plant
LahadDatu
Raw materials from Peninsular
Malaysia
Raw materials from East Malaysia
Land-based domestic sales
throughout Malaysia
Sea-based international sales to over
100 countries
Westport refinery and
packing plant
Kuala Lumpur
Semenyih Refinery
Johor Port
SaBah

Mewah InternatIonal Inc. annual report 2014
5
GROuP STRuCTuRE
grouP Structure(As at 31 December 2014)
100% 100% 100%One Marthoma(CI) Inc
Hua Guan Inc Pandan LoopInternational Inc
100%100% 100%Ngo Chew HongOleo (S) Pte Ltd
Mewah OleoMalaysia Sdn Bhd
Hua Guan Oleo(S) Pte Ltd
100%10% + 90%83.4%100%
100%Mewah Oils &Fats Pte Ltd
Mewah OilsIndia Pvt Ltd
10% + 90%MOI Commodities India Pvt Ltd
MOI International(Australia) Pty Ltd
Mewah-OilsSdn Bhd
MOI Foods(Shanghai)Co Ltd
100% 100%Ngo Chew Hong Edible Oil Pte Ltd
Ngo Chew HongOils & Fats (M)Sdn Bhd
100%MOIInternational(Singapore)Pte Ltd
90% + 10%MOI Foods Nigeria Limited
49%Prelude GatewaySdn Bhd
100%Ngo Chew HongCorporation Pte Ltd
100%Agri Kurnia Sdn Bhd
100%Mewah Dairies Sdn Bhd
100%MewahCommoditiesPte Ltd
50% + 50%Krispi Oil and Food Products Marketing, Import, Export Trading Company (Turkey)
100%Krispi OilRussia LLC
100%Moi FoodsRomania SRL
1: The chart presents only selective companies. For complete list of Group's subsidiaries, please refer to pages 109 to 117.
100%Container Fabricator(M) Sdn Bhd
100%Moi FoodsMalaysia Sdn Bhd
100%BremfieldSdn Bhd
100%Mewaholeo MarketingSdn Bhd
100%Padat GayaSdn Bhd
100%MewaholeoIndustries Sdn Bhd
100%Mewah DatuSdn Bhd
Building StrengthS Shaping the Future
6
chaIrMan’S MeSSage
CHAIRMAN’S MESSAGE
Palm oil industry is going through a tough phase. In 2014, palm oil prices dropped to 5-year low. Petroleum prices falling by 50% during the year tempered demand for biofuel and record production of competing oilseeds reduced the attractiveness of palm oil.
However, the year ended with positive momentum with some revival in demand from destination markets at low palm oil prices, withdrawal of export duty by the Malaysian government, lower rapeseed oil output in India and a weakening ringgit. By the fourth quarter, the Group saw significant improvement in its financial performance and at the end of the year we were able to report the highest sales volume in the Group’s history.
Importantly, the Group showed strength in the face of adverse conditions. Our strategic expansion into new products like rice and dairy, along with investments in more refining capacity, have started to bear fruit, and given us more flexibility to adapt to unpredictable global developments.
Over the past five decades, the Group has demonstrated a track record of progress, even during challenging periods. Through maintaining a strong focus on building strengths, we stay committed to shape and secure our future.
Looking ahead to 2015, despite expectations of ongoing pressure from low energy prices and high inventories, the Group will continue to benefit from increasingly diverse sources of income along our integrated supply chain, and our more competitive position in the consumer products business. Our focus on long-term planning and our ability to ride out turbulent market conditions see the Group well placed during this period of consolidation in the industry.
We remain grateful for the support of our loyal shareholders, and the Board of Directors is pleased to propose a final exempt dividend of 1.7 Singapore cents per ordinary share for the full year.
Last but not least, I wish to extend my gratitude to our capable employees and Board of Directors, who continue to make Mewah the great organisation it is today. I look forward to bigger and better things ahead. Together, everything is possible.
dr Cheo Tong ChoonChairman and Executive Director
Palm oil industry is going through a tough phase. In 2014, palm oil prices dropped to 5-year low. Petroleum prices falling by 50% during the year tempered demand for biofuel and record production of competing oilseeds reduced the attractiveness of palm oil.

Mewah InternatIonal Inc. annual report 2014
7
CEO’S MESSAGE
ceo’S MeSSage
While 2014 presented challenges for the palm oil industry, our continued investments in new products and increased capacity helped the Group set a new record for sales volume.
Total sales volume for the year rose 7.6% to over 4 million metric tonnes, the most ever in our more than 50 year history. Both Bulk and Consumer Pack segments registered impressive volume growth of 5.4% and 13.4% respectively. In short history of only three years, we are already ranked in top 20 players in the rice industry. Our sales of 3.8 million MT for palm-based oils and fats business are substantially higher than our recently increased installed capacity of 3.5 million MT.
While we are disappointed with net profit of only uS$3.0 million for the year, down from uS$20.0 million in 2013, we are encouraged by our robust performance in fourth quarter and finish a difficult year on a stronger footing.
The Group is increasingly well positioned to weather economic headwinds and benefit from new markets. Recent investments in another refinery and a bio-diesel plant in Malaysia have sharpened our competitiveness, while our diversification into rice and dairy items is strengthening a suite of products that already reaches more than 100 countries around the world. In 2014, the Consumer Pack segment saw sales volume rise 13.4%, and revenue increase 14.4%. Operating margin increased 27.1% for the year.
Our balance sheet remains healthy, with a net debt to equity ratio of 0.50 and low cycle time of 48 days.
looking aheadIn the near term, we expect crude palm oil prices to be supported by recent floods in Malaysia, a lean production season in the first quarter of 2015 and higher subsidies for bio-diesel in Indonesia. However, over the medium term, the industry will continue to see pressure on CPO prices come from low petroleum prices and large soyabean harvests in South America.
We believe the Group is uniquely positioned to address challenges facing the industry. Our value chain is deeply integrated, from the sourcing of raw materials through to the distribution of finished product to end consumers. We expect resilient margins in the distribution part of the value chain will help mitigate the pressure on CPO prices.
As the industry consolidates, the Group will continue to improve our competitiveness with prudent investments and diversification into promising products and markets.
Every year presents fresh challenges and new opportunities. With the support of our shareholders, employees, customers, suppliers and bankers, we look forward to the opportunities that lie ahead.
ms michelle CheoChief Executive Officer and Executive Director
While 2014 presented challenges for the palm oil industry, our continued investments in new products and increased capacity helped the Group set a new record for sales volume.

Building StrengthS Shaping the Future
8
EXECuTiVE dirECTorS
dr ChEo Tong Choon @ lEE Tong Choon Chairman of Board of Directors
Appointed as Director on 29 October 2010Last re-elected on 24 April 2012• MemberofBoardofDirectors• MemberofNominatingCommittee
As the Chairman of the Board, Dr Cheo Tong Choon @ Lee Tong Choon is responsible for leading the Board, facilitating effective contribution from non-executive directors, effective communication with shareholders and promoting high standards of corporate governance. He is responsible for setting the strategic direction of our Group. Dr Cheo has been leading the Group for the past three decades. under his direction, our Group has expanded into refining, manufacturing and trading of palm oil and related products. Dr Cheo obtained a Doctor of Medicine (MD) degree from the university of Saskatchewan, Canada and is a member of the Royal Colleges of Physicians of the united Kingdom in internal medicine. He practiced as a registered medical practitioner from 1975 to 1986 with a group of medical specialists, Drs Bain & Partners in Singapore, before he took over the leadership role in our Group.
mS miChEllE ChEo hui ning Chief Executive Officer
Appointed as Director on 29 October 2010Last Re-elected on 25 April 2013• MemberofBoardofDirectors
Ms Michelle Cheo Hui Ning is responsible for the formulation and execution of overall strategy of the Group and day-to-day operations. Ms Cheo joined the Group in 2003 and has been the leading force to get the Group listed on Singapore Exchange and expand the Group into specialty fats, dairy and biodiesel business. Prior to joining the Group, she worked with Exxon Mobil from 1997 to 2003 in Louisiana, uSA and Singapore in the Oxo-Alcohol plant as technical support. Ms Cheo graduated in 1997 and holds a Chemical Engineering degree from Imperial College, university of London. She also obtained a Master of Business Administration degree from INSEAD in 2004. She is on the committee of Career Women’s Group of the Singapore Chinese Chamber of Commerce.
BoarD of DIrectorS
mS BianCa ChEo hui hSin Chief Operating Officer
Appointed as Director on 29 October 2010Last Re-elected on 28 April 2014• MemberofBoardofDirectors
Ms Bianca Cheo Hui Hsin joined our Group in 2004 and heads the Consumer Pack segment. She has overall responsibility for our branded oil and fats sales, rice and dairy divisions and has been instrumental in expanding Group’s presence in West Africa, Europe and South Americas. Prior to joining our Group, she practiced law in Singapore with Allen & Gledhill LL P from 2000 to 2003 and with Norton Rose LL P from 2003 to 2004. Ms Cheo graduated from the King’s College university of London, with a Bachelor of Laws in 1998 and was admitted as an advocate and solicitor of the Supreme Court of Singapore in 2000.
mS Wong lai WanHead, Risk Management
Appointed as Director on 29 October 2010Last Re-elected on 25 April 2013• MemberofBoardofDirectors
Ms Wong Lai Wan joined our Group in 1987 as a chemist. She has held various portfolios in quality control, production, operations, logistics, marketing, trading, business development and risk management. She is currently responsible for the business development, operational controls and risk management of our Group. She started her career with Pan Century Edible Oils Sdn Bhd as a chemist from 1985 to 1987 before joining the Group. Ms Wong graduated with a Bachelor of Science degree in Chemistry with First Class Honours from universiti Kebangsaan Malaysia in 1985.
mS lEong Choi Foong Head, Finance and Accounts (Malaysia)
Appointed as Director on 29 October 2010Last Re-elected on 28 April 2014• MemberofBoardofDirectors
Ms Leong Choi Foong joined the Group in 1990 as the Finance Manager. She held various positions before her appointment as Group Treasurer in 2010. Currently as Finance and Accounts Head for Malaysia, she is responsible for finance, accounts and taxation functions for our Malaysia business. Prior to joining our Group, she worked as a tax and audit assistant with Othman Hew & Co. between 1980 and 1983 and as a financial
BOARD OF DIRECTORS

Mewah InternatIonal Inc. annual report 2014
9
and management accountant at Southern Bank Berhad, which is now part of CIMB Bank Berhad, between 1984 and 1990. Ms Leong obtained a Bachelor of Accounting degree from the university of Malaya in 1980. She is a member of the Malaysian Association of Certified Public Accountants and a chartered accountant certified by the Malaysian Institute of Accountants.
indEpEndEnT dirECTorS
mr giam Chin Toon Independent Director
Appointed as Director on 29 October 2010Last Re-elected on 28 April 2014Not seeking re-election• MemberofBoardofDirectors• LeadIndependentDirector• Chairman of Nomination Committee, Remuneration
Committee• MemberofAuditCommittee
Mr Giam Chin Toon is a senior partner of the law firm, Wee Swee Teow & Co. He joined the Singapore legal service in 1967 and was a magistrate until 1970. He was also President of the Law Society of Singapore between 1987 and 1989.He has served as arbitrator and counsel in many arbitral and court proceedings. Mr Giam is active in the commercial field and holds directorships in Ascott Residence Trust Management Limited and Singapore Mediation Centre. He is also Singapore’s Ambassador (Non-Resident) to Peru. He has previously served on the boards of Oversea-Chinese Banking Corporation Limited, SembCorp Marine Limited, the Singapore Institute of Directors, Health Sciences Authority, Energy Market Authority, and Raffles Holdings Limited. Mr Giam graduated from the university of Singapore in 1967 with a Bachelor of Laws (Honours) and a Masters of Law degree in 1969.
mr lim hoW TECk Independent Director
Appointed as Director on 29 October 2010Last re-elected on 24 April 2012Not seeking re-election• MemberofBoardofDirectors• ChairmanofAuditCommittee• Member of Remuneration Committee, Nomination
Committee
Mr Lim How Teck is on the board of various companies including Redwood International Pte. Ltd., Heliconia Capital Management Pte Ltd., ARA -CWT Trust Management (Cache)
Limited, PNG Sustainable Development Program Limited, Rickmers Trust Management Pte. Ltd., ARA Asset Management Ltd., The Foundation for Development Cooperation, Accuron Technologies Limited, Public utilities Board, Mizuho Securities (Singapore) Pte Ltd. In the past, during his tenure with Neptune Orient Lines Limited from 1979 to 2005, he held various positions such as Executive Director, Group Chief Financial Officer, Group Chief Operating Officer and Group Deputy Chief Executive Officer.
Mr Lim holds a Bachelor of Accountancy Degree from the university of Singapore. He is also a graduate of the Harvard Graduate School of Business Corporate Financial Management Course and Advanced Management Program. He is a Fellow of the Chartered Institute of Management Accountants of uK, Certified Public Accountants of Australia, Institute of Certified Public Accountants of Singapore, Singapore Institute of Directors and an Associate of the Business Administration of Australia. He was awarded the Public Service Star(BBM) in 2014.
Tan Sri daTo’ ir muhammad radziBin haji manSor Independent Director
Appointed as Director on 29 October 2010Last Re-elected on 28 April 2014• MemberofBoardofDirectors• Member of Audit Committee, Nomination Committee,
Remuneration Committee
Tan Sri Dato’ Ir Muhammad Radzi is currently the Chairman of Kumpulan Fima Berhad (Malaysia), Chairman of International Food Corporation Limited (Papua New Guinea), President-Commissioner of PT XL Axiata Tbk (Indonesia), Chairman of MMSB Consult Sdn Bhd, Chairman of Orenda Kuantum Digital Sdn Bhd and a member of the APEC Business Advisory Council (ABAC Malaysia). He was Chairman of Telekom Malaysia Berhad and its group of companies from July 1999 to July 2009 and from May 2005 to May 2011, he was a member of the board of directors of the Multimedia Development Corporation Sdn Bhd.
Tan Sri Dato’ Ir Muhammad Radzi graduated with a Diploma in Electrical Engineering from Faraday House Engineering College, London in 1962, and a Master of Science degree in Technological Economics from the university of Stirling, Scotland in 1975. Tan Sri Dato’ Ir Muhammad Radzi was made an Honorary Fellow by the ASEAN Federation of Engineering Organisation in 2004, a Fellow of the Institute of Marketing Malaysia and a Fellow of the Institute of Directors, Malaysia in 2007. He was appointed as the Pro-Chancellor of Multimedia university in 2008.
BOARD OF DIRECTORS

Building StrengthS Shaping the Future
10
BOARD OF DIRECTORS
Tan Sri daTuk dr ong Soon hoCk Independent Director
Appointed as Director on 29 October 2010Last Re-elected on 28 April 2014• MemberofBoardofDirectors• MemberofNominatingCommittee,AuditCommittee
Tan Sri Datuk Dr Ong Soon Hock is Emeritus Professor of university Science Malaysia (uSM). As Chairman of Programme Advisory Committee Panel on Food, Nutrition and Quality, Chairman of MPOB Nutrition Projects Committee and as Chairman of International Advisory Panel on Nutrition, Dr Ong is actively involved in various research projects of Malaysian Palm Oil Board. He is also member of the Boards of Directors of Country Heights Holdings Berhad and Edge Education Foundation and Chairman of the Committee on College of Higher Education for the proposed Stella Maris College.
Tan Sri Datuk Dr Ong was a Director of the Malaysian Palm Oil Promotion Council from 1990 to 1996 and was Director General of the Palm Oil Research Institute of Malaysia from 1987 to 1989 where he remained as an advisor until 1990. His contributions to the palm oil industry have led to his receiving several prestigious awards including Merdeka Award, Palm Oil Industry Leadership (PILA) Award and Pioneer in Tocotrienol Research from The Oxygen Club of California. He has 40 years of research and development experience in lipid chemistry and is the registered holder of 16 patents in the field of palm oil related technology.
Tan Sri Datuk Dr Ong graduated with a Bachelor of Science degree with First Class Honours from the university of Malaya. He also obtained a Master of Science from the university of Malaya, a Doctor of Philosophy (PhD) in organic chemistry from King’s College university of London. He was Fulbright-Hays Fellow at MIT. He was Visiting Professor at Dyson Perrins Laboratory, university of Oxford. He is a Senior Fellow of the Academy of Sciences Malaysia with the title “Academician”, Fellow of King’s College, London and Fellow of TWAS Academy of Sciences.
mr roBErT lokE Tan ChEng Independent Director
Proposed appointment, subject to the Shareholders’ approval in the Annual General Meeting on 28 April 2015• MemberofBoardofDirectors• LeadIndependentDirector• Chairman of Nomination Committee, Remuneration
Committee• MemberofAuditCommittee
Mr Robert Loke Tan Cheng has 35 years of banking experience with major global, regional and investment banks in Asia. Mr Loke led Bangkok Bank Berhad for nine years before retiring as Chief Executive and Executive Director in January 2015. In the past, Mr Loke held various positions in Risk Management for Nomura Singapore Limited, Keppel Tatlee Bank and OCBC Group from 1995 to 2006. He was also responsible for Lending and Operational activities for Allied Irish Bank and was a relationship manager for Chase Manhattan bank from 1980 to 1995.
Mr Loke was a member of the Association of Banks in Singapore’s (ABS) standing committee for Risk Management and the Vice-Chairman of the ABS’s Credit Risk task force from 2005 to 2006. He was also an Executive Director of Bangkok Bank Berhad and Director for Bangkok Bank Nominees from Jan 2007 to 2015.
Mr Loke obtained Post Graduate Diploma in Management from McGill university in 1979. He also obtained MBA and Electrical Engineering with cum Laude (Distinction) from Concordia university in 1980 and 1978 respectively.
dr Foo Say mui (Bill) Independent Director
Proposed appointment, subject to the Shareholders’ approval in the Annual General Meeting on 28 April 2015• MemberofBoardofDirectors• ChairmanofAuditCommittee• Member of Remuneration Committee, Nomination
Committee
Dr Foo Say Mui (Bill) has over 30 years’ experience in financial services. He is currently Chairman of unigestion Asia Pte Ltd, an investment management company. He also serves on various charity and non-profit organizations including as Chairman of Salvation Army Advisory Board, Chairman of Heartware Network, a youth related charity and member of the National university of Singapore President’s Advancement Advisory Council. Dr Foo has also served as an Independent Director and Chair of various Audit Committees on boards including International Enterprise Singapore, Temasek Life Sciences Ventures Pte Ltd and Yellow Pages Ltd.
During his tenure at ANZ from 1999 to 2015, his positions included Singapore CEO and Vice Chairman of South and South East Asia. Working with Schroders from 1993 to 1999, Dr Foo held various positions including as President Director and Regional Head of Investment Banking.
Dr Foo holds a B.Admin from Concordia university, MBA from McGill university and an Honorary Doctor of Commerce from James Cook university.
BoarD of DIrectorS

Mewah InternatIonal Inc. annual report 2014
11
SENIOR MANAGEMENT
dr ChEo Tong Choon @ lEE Tong Choon
Dr Cheo Tong Choon @ Lee Tong Choon is our Chairman and Executive Director. Details of his working experience and qualifications are set out in“Board of Directors”.
mS miChEllE ChEo hui ning
Ms Michelle Cheo Hui Ning is our Executive Director and Chief Executive Officer. Details of her working experience and qualifications are set out in “Board of Directors”.
mS BianCa ChEo hui hSin
Ms Bianca Cheo Hui Hsin is our Executive Director and Chief Operating Officer. Details of her working experience and qualifications are set out in “Board of Directors”.
mr rajESh Chopra
Mr Rajesh Chopra, Group Chief Financial Officer joined Mewah in May 2010 and currently leads the Finance, Accounts, Corporate Affairs and Investors Relations functions of the Group. His past employments include 12 years engagement with Olam International Limited and 4 years with Tata Steel Ltd. He completed his audit articleship with Ernst and Young group, 1988 to 1991. Mr Chopra obtained a Bachelor of Commerce (Honours) degree from Delhi university in 1988, became a Chartered Accountant of the Institute of Chartered Accountants of India in 1991 and Cost and Works Accountant of the Institute of Cost and Works Accountants of India in 1991. He obtained a Masters of Business Administration from the London Business School, university of London in 2007. He is also a holder of the Certificate in Investor Relations from the Investor Relations Society of uK and Investor Relations Professionals Association (Singapore).
mr Shyam kumBhaT
Mr Shyam Kumbhat is the Head, Trading and Merchandising. He is responsible for overseeing our palm oil bulk trading and marketing activities. He joined our Group in 1995 as the president of Mewah Oils & Fats Pte Ltd. He has more than 30 years of experience in the edible oils and fats industry. Prior to joining our Group, Mr Kumbhat worked with Pan Century Edible Oils Sdn Bhd, a member of the India-based multinational Birla Group as Vice President, Marketing from 1977 to 1995. He obtained a Bachelor of Commerce degree with a major in Advanced Accountancy from the university of Rajasthan Jaipur, India in 1962.
mS Wong lai Wan
Ms Wong Lai Wan is our Executive Director and Head, Risk Management. Details of her working experience and qualifications are set out in “Board of Directors”.
mS lEong Choi Foong
Ms Leong Choi Foong is our Executive Director and Head, Finance and Accounts (Malaysia). Details of her working experience and qualifications are set out in “Board of Directors”.
mS agnES lim SiEW Choo
Ms Agnes Lim Siew Choo is the Head, Operations in Malaysia. She joined our Group in 1988 as Factory Operations Executive, and subsequently progressed to overseeing the factory operations of our Malaysian subsidiaries as the Group expanded. Her present portfolio spans Production, Quality Assurance, Procurement, as well as ensuring all local and overseas delivery commitments. Prior to joining us, Ms Lim worked with Southern Edible Oils Sdn Bhd from 1983 to 1988 as an Operations Executive, and was responsible for receiving and dispatching edible oil, production planning and the fulfillment of local and overseas shipment requirements. She obtained a Bachelor of Arts degree from The university of York, in Toronto, Canada in 1982.
SenIor ManageMent

Building STrEngThS

Mewah InternatIonal Inc. annual report 2014
13
oPeratIonS anD fInancIal revIew
FY 2012 FY 2013 FY 2014
IncoMe StateMentRevenue 3,621 3,194 3,439
Operating margin 108.2 115.5 94.6
Profit after tax 23.5 20.0 3.0
Earnings per share (uS cents per share) 1.64 1.39 0.18
Balance SheetFixed investments 357 366 382
Working capital 538 393 424
total investments 895 759 806Equity 560 557 536
Gross debt 384 265 331
Cash (49) (63) (61)
Net debt 335 202 270
total capital 895 759 806
Debt to equity 0.69 0.48 0.62
Net Debt to equity 0.60 0.36 0.50
Net asset value per share (uS cents per share) 37.38 37.25 35.92
In US$’ million, unless stated otherwise
FY 2012 FY 2013 FY 2014
SegMental PerforMance
Sales volume (Mt’000)Bulk 2,576 2,707 2,852
Consumer Pack 825 1,026 1,164
Total 3,401 3,733 4,016
operating margin (uS$’million)Bulk 64.5 73.7 41.6
Consumer Pack 43.8 41.7 53.0
Total 108.2 115.5 94.6
operating margin per Mt (uS$)Bulk 25.0 27.2 14.6
Consumer Pack 53.1 40.6 45.6
Total 31.8 30.9 23.6
OPERATIONS AND FINANCIAL REVIEW

Building StrengthS Shaping the Future
14
OPERATIONS AND FINANCIAL REVIEW
oPeratIonS anD fInancIal revIewpalm oil induSTry in 2014Palm oil industry continued to witness tough operating environment during the year amidst falling and volatile CPO prices. The prices touched 5-year low of 1,900 ringgit in August-end, declining 35% from 2,900 ringgit in mid-March before bouncing back 20% to close the year at 2,300 ringgit.
Drought conditions in Indonesia and Malaysia at the start of the year and growing concerns of El-Nino developing in the later part of the year pushed CPO prices up in the early part of the year. As concerns about the El-Nino subsided and outlook improved for palm oil production, prices started declining. 50% plunge in energy prices during the year impacted the viability of biofuel and record global oilseed supply of the competing oils made palm oil less attractive. Weak demand for palm oil coupled with all-time record production in Indonesia and Malaysia resulted in stocks pile-ups during the year. The prices got support towards the end of the year largely due to Malaysian Government’s decision to scrap the export duty to reduce inventories in the country, low rapeseed oil production in India and buyers at destination markets getting attracted at the lower prices. Weaker ringgit towards the end of the year also made Palm Oil attractive for international buyers.
group’S SalES VolumEThe Group achieved record sales volume of 4.016 million MT, crossing four million MT mark for the first time in its history.
Sales volume of 4.016 million MT for 2014 was 7.6% higher than volume achieved last year. Bulk segment registered volume growth of 5.4% and contributed 71.0% of total volume. Consumer Pack segment achieved growth of 13.4% contributing 29.0% of total volume.
Consumer Pack Bulk
FY2012
3,401
825
2,576
FY2013
3,733
1,026
2,707
FY2014
4,016
1,164
2,852
Sales volume (Mt’000)
cPo prices (ringgit)
Sales volume vs refining capacity (Mt’million)
Sales volume Refining capacity
FY2012 FY2014FY2013
2.8 3.52.8
3.5 3.83.3
Our rice business achieved volume of 243 thousand MT ranking us amongst the top 20 players in the industry.
Our palm-based oils and fats business registered sales volume of 3.8 million MT and was significantly higher than the production from our recently increased installed capacity of 3.5 million MT.
1/1/
2014
1,800
2,200
2,000
2,400
2,600
2,800
3,000
1/2/
2014
1/4/
2014
1/5/
2014
1/6/
2014
1/7/
2014
1/8/
2014
1/9/
2014
1/10
/201
4
1/11
/201
4
1/12
/201
4
1/3/
2014

Mewah InternatIonal Inc. annual report 2014
15
OPERATIONS AND FINANCIAL REVIEW
geograPhIcal SPreaD
Bulk Sales
71%Malaysia/
Singapore
21%Rest of world
total Sales
52%Malaysia/
Singapore
31%Middle
East
29%Africa
consumer Pack Sales
12%Malaysia/
Singapore
22%Middle East
11%Others Asia
17%Rest of world
50%Africa
WEll diVErSiFiEd SalES rEVEnuEThe Group achieved sales revenue of uS$3,439 million in 2014 registering a growth of 7.7% over the last year.
Bulk segment registered revenue growth of 4.8% and contributed 68.3% of total revenue. Consumer Pack segment achieved growth of 14.4% contributing 31.7% of total revenue.
We strive to diversify our sales revenue across the globe and our efforts continued in 2014. During the year, based on billing address, we sold to customers in more than 100 countries. 48% of total sales were made as destination sales, selling the products to customers in countries other than Malaysia and Singapore. Destination sales remained diversified with Middle East, Africa, Asia and rest of world contributing 31%, 29%, 21% and 19% respectively of total destination sales.
Destination sales for both Bulk and Consumer Pack segments remained strong. 29% of Bulk segment sales were made to destination markets with Middle East, Asia and rest of world contributing 45%, 34% and 21% respectively. 88% of Consumer Consumer Pack Bulk
FY2012
3,621
971
2,649
FY2013
3,194
953
2,241
FY2014
3,439
1,090
2,349
Sales revenue (uS$’million)
Pack segment sales were made to destination markets with Africa, Middle East, Asia and rest of world contributing 50%, 22%, 11% and 17% respectively.
29%Destination
48%Destination
88%Destination
19%Rest of world
45%Middle
East
34%Others
Asia
21%Others
Asia

Building StrengthS Shaping the Future
16
OPERATIONS AND FINANCIAL REVIEW
oPeratIonS anD fInancIal revIewopEraTing marginS The Group measures and tracks the performance in terms of operating margin per MT and total operating margin. OM is calculated as revenue, less cost of sales (excluding depreciation), selling and distribution expenses and foreign exchange gains or losses.
Over the period of last five decades, we have developed a proven integrated business model of participating in the midstream and downstream parts of the value chain in the attractive palm oil industry, built inherent operational flexibility, developed sound risk management practices, and established our own brands and global distribution capabilities that have helped us to deliver robust operating margins during normal industry conditions and resilient margins during tough economic cycles.
Volatile and tough industry conditions resulted in lower operating margin of uS$23.6 per MT, compared to uS$30.9 achieved last year. Industry conditions, particularly for the refiners, remained challenging resulting in Bulk segment margin decreasing to uS$14.6 per MT compared to uS$27.2 achieved last year. Despite lower margins achieved for Bulk segment, our Group’s integrated business model with participation in large part of the value chain and ability to sell in global markets under its own brands through well established distribution networks helped to maintain healthy margins for the Consumer Pack business. Consumer Pack segment margins improved to uS$45.6 per MT compared to uS$40.6 last year. Addition of rice and dairy products, duly supported by our recent investment in dairy manufacturing facilities, has improved our competitive position in the consumer products business. Bulk and Consumer Pack segments contributed 44.0% and 56.0% of total operating margin respectively.
operating margin per Mt (uS$)
FY2012 FY2013 FY2014
Total 31.8 30.9 23.6
Bulk 25.0 27.2 14.6
Consumer Pack 53.1 40.6 45.6
operating margin (uS$ in million)
Consumer Pack Bulk
FY2012
108.2
FY2013
115.5
FY2014
94.6
53.0
64.5
43.8 41.7
41.673.7

Mewah InternatIonal Inc. annual report 2014
17
OPERATIONS AND FINANCIAL REVIEW
STrong BalanCE ShEETWe manage our capital structure very actively by maintaining prudent debt to equity ratio and maintaining healthy combination of equity, long-term debt and short-term debt to fund long-term investment and working capital.
As at 31 Dec 2014, we maintained prudent debt to equity ratio of 0.62 or net debt to equity ratio of 0.50. Current low net debt to equity ratio, well below our target limit of 1.5 provides enough scope for us to raise additional debt to support our growth plans.
Due to nature of our investments, we target to keep net debt to equity ratio of less than 1.0 for long term investments and less than 2.0 for working capital. As at 31 Dec 2014, long-term investments of uS$382.1 million were funded by equity and long-term debt of 73.1% and 26.9% respectively giving net debt to equity ratio of 0.37. Working capital of uS$423.9 million was funded by equity and current net-debt of 60.4% and 39.6% respectively giving net debt to equity ratio of 0.66.
We maintain adequate working capital credit lines to support our business. Our current working capital lines utilisation was 26.8% of total credit lines available.
Our efficient, large scale, integrated production facilities and strong distribution network continued to help us to keep our cycle time very short at 48 days in 2014.
Debt to equity and net debt to equity
Debt to equity Net debt to equity
FY2012
0.690.60
0.480.36
0.500.62
FY2013 FY2014
Balance sheet (uS$’mil)
Investment Capital
806.0
52.6%Working
capital
39.6%Current net debt
26.9%Non-current debt
60.4%Equity
73.1%Equity
47.4%Long-term
investments
806.0
423.9
382.1279.5
102.6
256.1
167.8

Shaping ThE FuTurE

Mewah InternatIonal Inc. annual report 2014
19
FORWARD LOOKI NG STRATEGY
forwarD lookIng StrategyTo grow our business in a sustainable way, we strive to become a global consumer products business by expanding range of consumer products, offering specialised applications and customer solutions while consolidating our position in oils and fats business.
We are currently a major player in the palm oil industry, a position built over the past five decades. To grow our business in a sustainable way, we strive to become a global consumer products business by expanding range of consumer products, offering specialised applications and customer solutions while consolidating our position in oils and fats business.
We believe that the current global and challenging conditions for the Palm oil industry are resulting in the industry to consolidate and will benefit stronger players in the long run. We continue to build a strong platform by investing in manufacturing facilities within palm oil value chain and also by adding new products to our portfolio to embrace new opportunities in the ever-changing environment.
We have recently completed our fourth refinery in Sabah, Malaysia, increasing our installed capacity from 2.8 million MT to 3.5 million MT. Strategically located within the Palm Oil Industrial Cluster of Lahad Datu, the investment further consolidates our position as an integrated vegetable oil and fats business. It will not only increase our refining capacity but also increase our access to CPO while opening up new destination markets. Expected production from increased capacity of 3.5 million MT is substantially lower than our sales volume of 3.8 million MT achieved in 2014.
To participate in the larger part of the value chain within Palm Oil Industry, we have also recently invested in a biodiesel plant in Westport, Selangor, Malaysia, next to our largest
refinery which opens up new growth opportunities in the downstream part of the value chain of palm oil industry.
We have also recently completed the installation of a manufacturing facility in Malaysia to produce dairy products. As palm oil is one of the important raw materials for the production of dairy products, the investment will have production synergies with our current palm oil business. The investment is also expected to have significant marketing and distribution synergies with our current Consumer Pack segment.
We continue to explore more consumer products that could be sold as a basket of products to our existing and prospective customers. We have included rice in our product portfolio, sourcing rice from Asia and selling in Africa and Middle East under our own brands. In the third full year of operations itself, we have already established our position and are currently ranked amongst top 20 players in the industry.
Working closely with the customers, we continue to develop and offer specialised applications and customer solutions for different industries such as confectionaries, bakeries, food ingredients and infant nutrition businesses.
Investing in brands remains of paramount important to us. We continue to drive our marketing efforts by investing in advertising campaigns, billboards and other promotional events.
Integrated vegetable oils &
fats Business
global consumer Products Business
Broaden and deepen marketing and distribution network4
Consolidate the position in palm based oils and fats business
1
Specialised applications &
Customer solutions
2
Expand range of consumer
products
3

Building StrengthS Shaping the Future
20
reSearch anD DeveloPMent
RESEARCH AND DEVELOPMENT
With the increasing consumer awareness on healthy food products, our R&D direction is aligned with the global trend and needs. Innovation and renovation activities have driven our product range to transform towards healthier direction, such as continuous improvement on allergen-free food products as to cater for global market requirements and provide unique product proposition for consumers.
At Mewah Group, the driving force behind our R&D model is the passion for innovation and the satisfaction of fulfilling customers’ needs.
R&D is a catalyst of change in product innovation and renovation which drives company’s growth. Highly value added products draw clear differentiation from competitors.
The fundamental of R&D is the mastermind of Product Technology and Process Technology which translates consumer requirements into products at quality and competitive position guided by pragmatic and dynamic commercial insights.
Our Innovation and Knowledge Management Centre (IKMC) consists of technologists with expertise in bakery, confectionary fat, non-food as well as applications and pilot plants to support R&D activities of different categories.
We are backed by our dedicated team and state-of-the art facilities such as Nuclear Magnetic Resonance spectrophotometer, Gas Chromatography, High Pressure Liquid Chromatography and texture analyser equipment to facilitate the R&D process of designing products/solutions that meet the dynamic landscape. Besides having the pilot scale plants to furnish us for running trials on our distinctive formulations for existing range of products, our newly installed enzymatic inter-esterification and computerised- controlled hydrogenation pilot plant also help to enhance our research and development capabilities for product range diversification. Application and sensory facilities are well- equipped in our research centre as to ensure that solutions provided to customers meet their intended purposes.
Though at its early stages, our R&D department for dairy products has positioned well on par with key dairy players locally. We are in a direction on the right track to achieve more in the forthcoming years. We have already developed the range for Sweetened Creamer products successfully and are working on new formulations to extend our range of offerings to meet different consumer requirements and different consumer segments.
As customer is our top priority, we strive towards excellence for product innovation and quality to deliver cost-effective and quality solutions through our passion for R&D and embracing the good manufacturing practices.
With the increasing consumer awareness on healthy food products, our R&D direction is aligned with the global trend and needs. Innovation and renovation activities have driven our product range to transform towards healthier direction, such as continuous improvement on allergen-free food products as to cater for global market requirements and provide unique product proposition for consumers.
With our R&D capacity and capability built over decades, we are committed to bring Mewah Group to greater height by collaborating with reputable research centres to ride on technology and innovation-driven solution bandwagon to provide healthier choice products on table.

Mewah InternatIonal Inc. annual report 2014
21
RIS K MANAGEMENT
rISk ManageMentOur system comprises of processes and policies designed to address risks such as commodity prices, foreign currency exchange rates, interest rates, counterparties’ credit and liquidity.
As a result of our Group’s global operating and financing activities, we are exposed to various types of market risks, including fluctuations in agricultural commodity prices, foreign currency exchange rates, interest rates, counterparty credit and liquidity risk. We use certain financial instruments to hedge the risk of commercial exposures and we do not hold such financial instruments for speculative purposes. These market risk management activities are governed by our risk management system that is designed to identify, quantify, monitor and manage various risks encountered in our operations and minimise the adverse effects from the unpredictability of financial market risks on our financial performance.
Our system comprises of processes and policies designed to address risks such as commodity prices, foreign currency exchange rates, interest rates, counterparties’ credit and liquidity. Our risk management system is based on the following main principles:
riSk goVErnanCE STruCTurEThe on-going compliance of these risk management processes and policies are carried out by the heads of the respective operating units. Our risk governance structure consists of a team of employees led by our Executive Director, Ms Wong Lai Wan in the Risk Department of our Singapore office, who is responsible for monitoring and improving the overall effectiveness of our risk management system, the
review and setting of trade positions and limits to manage our overall risk exposure. The Risk Department monitors and assesses risks on a regular basis and holds periodical meetings with our marketing and operations teams. The Risk Department has the authority to make temporary increases or changes to risk limits but such increases or changes must at all times remain within our overall risk management guidelines and framework of the Group.
Where the execution of any activity will result in the breach of any applicable limits in our risk management guidelines and framework, specific approval for that activity must be sought, and obtained from the Executive Risk Management Team prior to the execution of the activity. Any risk-related issues which are outside the scope of our risk management guidelines and framework are reported to the committee consisting of our Executive Directors, Dr Cheo Tong Choon @ Lee Tong Choon, Ms Michelle Cheo, Ms Bianca Cheo, Ms Wong Lai Wan and our Group Chief Financial Controller, Mr Rajesh Chopra (the “Executive Risk Management Team”).
SETTing oF riSk limiTSThe Executive Risk Management Team establishes and reviews periodically our overall risk tolerance thresholds, measured in terms of Value-At-Risk (“VAR”). The team is responsible for overall systems, procedures and processes for risk management including derivatives trading. Such risk tolerance threshold is based on a percentage of total

Building StrengthS Shaping the Future
22
RIS K MANAGEMENT
shareholders’ funds, and/or the budgeted annual operating profit, after taking into account, among other things, the Executive Risk Management Team’s view on the overall production capacity of refining and processing operations and the market in which trading activities take place, the price (and price trend) of raw materials, the track record of management in managing its risk exposures in the prior period, and the financial budgets including projected sales volume and turnover. The risk tolerance threshold is also based on the counterparty’s background, financial performance and management team. The risk tolerance threshold refers to the maximum potential loss if all trading and operations across all products and geographical regions materialise at the same time. Such threshold limits are approved and reviewed by Audit Committee.
rEporTing and rEViEWing STruCTurEOur Risk Department is responsible for the capture and measurement of Group-wide risk and ensuring compliance with our risk management system, procedures and processes. The Risk Department analyses and reviews our daily risk exposure with oversight from the Executive Risk Management Team. Any changes to our risk management system, standards, practices, policies and risk appetite require the approval of our Board. With respect to risks related to the use of derivative financial instruments, once limits for derivatives positions have been established by our Executive Risk Management
Team, our Risk Department monitors our trading activities to ensure compliance with these limits. If additional exposure is required, the trading department approaches the Risk Department to approve an increase in the limits. On a case-by-case basis, the Risk Department makes a recommendation to the Executive Risk Management Team to change established limits. If approved by the Executive Risk Management Team, the revised limits implemented and monitored by the Risk Department. Any breach (whether of trading limits or non-adherence to established policies), disclosed or revealed by the Risk Department, will be acted upon by the Executive Risk Management Team. Where the Executive Risk Management Team considers the breach to be significant (whether in terms of financial impact or otherwise), the Executive Risk Management Team will report the breach to the Board.
Our Internal Audit Department reviews our internal control systems regularly on an annual basis to ensure compliance with the risk management system and internal control procedures of the Company. Any material findings such as breaches of trading limits or non-adherence to established risk management policies will be reported to our Audit Committee as and when they arise. Our Audit Committee regularly reviews our internal control systems, internal audit reports and risk tolerance threshold limits. The Company also engages external professionals from time to time to review and improve on our internal control systems.
rISk ManageMent

Mewah InternatIonal Inc. annual report 2014
23
CORPORATE SOCIAL RESPONSIBILITY
corPorate SocIal reSPonSIBIlIty
At Mewah Group, we believe that corporate success and social welfare are interdependent and as such we believe in Creating Share Value, or CSV. We strive to create value for our shareholders by embracing responsibility for our activities on the environment, consumers, employees, suppliers, competitors and communities we operate in. As a socially responsible corporation, we strive to honour the triple bottom line: People, Planet and Profit.
Our Corporate Social Responsibility Policy or CSR Policy can be divided into following broader categories:
• EthicalBusinessConduct• HumanCapital–TalentManagement• FairEmploymentPractices• WorkplaceHealthandSafety• Community• Environment
EThiCal BuSinESS ConduCTWe value the principles of integrity, honesty and accountability and in full compliance with the law of every country and region we operate in. We are committed to conducting our business responsibly through:• Ethicalbusinesspracticesthroughoutouroperations;• Fair treatment of all our stakeholders including our
employees, suppliers, customers, service providers and all other parties that deal with us in our business operations;
• High standards for all matters relating to health, safety,security and the environment;
• Transparentbusinesspoliciesandpractices.
human CapiTal –TalEnT managEmEnTThe Group is committed to recruit, employ and promote employees on the sole basis of the qualifications and abilities needed for the work to be performed.
The Group recognises that one of the cornerstones of its success is our employees and we are committed to invest in our people. We believe that having a highly motivated, well trained and involved set of employees is crucial to the enduring success of our corporation.
To this end, we will ensure that our employees are developed to their fullest potential and talent, and their competency are fully recognised and rewarded. Department heads, who are also the mentors, will continuously assess and evaluate their subordinates to ensure that there is a structured career development in accordance to their potential, talent and competency.
We will continue to attract, motivate and retain our talented employees at all levels by providing them with job security and
ample opportunities to grow with the company. We strive to provide all employees with career and personal development opportunities and to promote a continuous learning through training and development, both on-the-job and formal learning, job rotations and overseas assignments. We continuously recruit fresh graduates from reputable universities worldwide to be part of our team. Potential leaders will undergo a comprehensive, 2-year Leadership Training Programme to prepare them to take on challenging roles within the Group.
We believe that an all-rounder workforce is essential for motivation and enduring. Aside from providing job satisfaction, we encourage our employees to have a balanced work life by organising and promoting social activities.
Fair EmploymEnT praCTiCESWe believe in providing equal opportunities and follow fair employment practices. The Group recognises the value of its employees and long term retention as key to the success of the business. The Group aims to attract and retain skilled employees by giving them job security.
WorkplaCE hEalTh and SaFETyThe Group aims to provide each employee with a safe place to work. All group locations are required to abide by local health and safety regulations. We conduct regular work risk assessments, vigorously taking action to address any identified risks by setting up protective guidance, employing the usage of personal protective equipment, embarking on work sites audits and inspections, as well as regular reviews and controls of safety risks. We strive to achieve zero loss work day due to work place accidents.
All our refineries have adopted the latest OHSAS (International Occupational Health and Safety Management System) guidelines with the objective to build a demonstrably sound occupational health and safety workplace. Mewaholeo Industries Sdn Bhd was the first company under Mewah Group to be certified with OHSAS 18001 in February 2010. All our refineries have the quality management system ISO 9001, ISO 14001 and HACCP in place. Additionally, Mewah Oils Sdn Bhd has been certified for food safety with FSSC 22000 in December 2014.

Building StrengthS Shaping the Future
24
CORPORATE SOCIAL RESPONSIBILITY
CommuniTyWe encourage our businesses units to support the particular needs of local communities by contributing to local charities and through employee-participation events to achieve a better sustainable way of living for those less fortunate in the society. In 2014, the activities included visiting various children’s welfare and old folks’ homes, organising blood donation drive, giving donations to various charitable organisations contributing time, essential items, and financial support. We also work to continuously improve the activities by communicating and contributing widely with the society.
Despite the scale of the task, we believe in returning back to community, we care.
EnVironmEnTour Sustainability visionAs an integrated agribusiness, we face a complex myriad of issues relating to our supply chain, our refinery operation and our market place. Over the years, we have established strategies which emphasise on delivering high quality and sustainable palm oil. We believe that environmental sustainability can only come about by working closely with all the major industry stakeholders in the supply chain. Therefore, we have made the sustainable palm oil sourcing as the backbone of our sourcing strategy. At the same time, we recognise the importance of Traceable Palm Oil and we are looking forward that our palm oil are traceable from ports and refineries back to oil palm mills and plantations.
Sustainable Palm oil PolicyIn 2014, Mewah published our first Sustainable Palm Oil Policy. We have enhanced our existing commitments to the RSPO Principles & Criteria with three specific objectives:
1. To build a traceable and transparent supply chain. 2. To accelerate the journey to no deforestation and to reject
peat land development in our supply chain. 3. To ensure protection of the rights of workers, indigenous
peoples and local communities.
underlining these commitments, we have channeled our energy and resources on sustainable growth and improved operations. We have been collaborating closely with our suppliers and other relevant stakeholders to develop and implement a defined action plan. We are committed to achieve our set objectives.
traceable Palm oil frameworkMewah Group has developed a Traceable Palm Oil Framework to trace the origin of our palm oil. At the initial stage, we review each of our supplier through desktop assessment and in-house risk profiling analysis. With the traceability process developing well, we are progressing fast to the next step of assessing the suppliers’ practices. Based on the risk analysis results, our sustainability team will perform the site assessment of the suppliers’ mills based on general guidelines, procedures and questionnaires that are in line with industrial standards.
At the time of publishing of this report, 88.50% of our crude palm oil supply was fully Traceable to Specific Mills. Additionally, we also have the visibility of over 200 CPO mills in Malaysia, representing over 50% of the total operating CPO mills in Malaysia.
rSPo certification StatusMewah Group has long been committed to the RSPO certification. We have been a member of the RSPO since 2010, and have been actively involved in many aspects of its initiatives, including contributing to its various working groups.
Today, our Peninsular Malaysia refineries are fully certified for Segregation and Mass Balance. We also have stepped up our efforts to certify our newly commissioned refinery Mewah Datu Sdn Bhd in 2014 for Segregation and Mass Balance, to put it at par with all other manufacturing entities of Mewah Group.
International Sustainability & carbon certification (IScc)ISCC is an international system for certifying biomass and bioenergy. It incorporates sustainability criteria such as reduction of greenhouse gas emissions, sustainable use of land, protection of natural biospheres and social sustainability. Mewah Oils Sdn Bhd is the first refinery in Mewah Group to be certified with ISCC. Additionally, our biodiesel factory, Bremfield Sdn Bhd which has recently commissioned in 2014, has already secured ISCC certificate.
The achievement of ISCC certification signifies that the Group’s relevant products comply with the strict sustainability criteria set by the European union’s Renewable Energy Directive. Certification of other refineries will be determined based on commercial considerations.
Company Sustainability Certification Start of validity of
certificate
Expiration of validity of
certificate
Mewah Oils Sdn Bhd RSPO Mass Balance (MB) and Segregation (SG) 23 November 2010 22 November 2015
Mewaholeo Industries Sdn Bhd RSPO Mass Balance (MB) and Segregation (SG) 31 May 2012 30 May 2017
MOI Foods Malaysia Sdn Bhd RSPO Mass Balance (MB) and Segregation (SG) 9 September 2011 8 September 2016
Ngo Chew Hong Oils & Fats (M) Sdn Bhd RSPO Mass Balance (MB) 15 October 2011 14 October 2016
Mewah Oils Sdn Bhd ISCC Eu – Refinery 15 September 2014 14 September 2015
Bremfield Sdn Bhd ISCC Eu - Biodiesel Plant 25 November 2014 24 November 2015

25
Mewah InternatIonal Inc. annual report 2014Corporate GovernanCe
CorporateGovernanCe
the Board of Directors of Mewah considers good corporate governance as a fundamental part of its responsibilities to protect and enhance shareholder value and the financial performance of the Group. the Group is committed to maintain a high standard of corporate governance on the principles of effective leadership, accountability, integrity and openness as set out by the revised Code of Corporate Governance 2012 (the “2012 Code”) issued by the Monetary authority of Singapore on 2 May 2012 and is effective for annual reports relating to financial years commencing from 1 november 2012. Where there are any deviations, appropriate explanations have been provided in this report.
Guideline Disclosurepage of reference
in this report
1.3 Delegation of authority by the Board to board committees 26
1.4 number of meetings held by the Board and board committees and the attendance 26
1.5 type of material transactions that require the Board approval 27
1.6 Induction, orientation and training for directors 27
2.3 & 2.4 Independence of directors 28
3.1 relationship between the Chairman and the Ceo 29
4.1 names of the members and the key terms of reference of the nominating Committee (“nC”)
29
4.4 Maximum number of listed company board representations which directors may hold 30
4.6 process for the selection, appointment and re-appointment of new directors 30
4.7 Key information regarding directors 30
5.1 assessment of the Board, its board committees and each director 30
7.1 names of the members and the key terms of reference of the remuneration Committee (“rC”)
31
7.3 names and firms of remuneration consultants 31
9 & 9.6 remuneration policies and procedures 31
9.1, 9.2, 9.3 & 9.4 remuneration of directors, the Ceo, the top five key management personnel and immediate family members of a director or the Ceo
32
9.5 Details and important terms of employee share schemes 33
11.3 Board’s comments on the adequacy and effectiveness of the internal controls 33
12.1 names of the members and the key terms of reference of the audit Committee (“aC”) 34
12.6 amount of audit and non-audit fees paid to the external auditors 34
12.7 existence of a whistle-blowing policy 35
12.8 Summary of the aC’s activities and measures taken to keep abreast of changes to significant accounting standards and issues
34
15.4 Steps taken to solicit and understand the views of the shareholders 35
15.5 payment of dividends 35

26
Building StrengthS Shaping the FutureCorporate GovernanCe
CorporateGovernanCe
prInCIpLe 1the Board’s conduct of affairsEffective Board to lead and control the company
Board ResponsibilityMewah is led and controlled by an effective Board that works closely with management for the success of the Group. the Board is responsible for providing entrepreneurial leadership, setting strategic objectives, and ensuring that the necessary financial and human resources are in place for the Group to meet its objectives. the Board has overall responsibility in establishing a framework of prudent and effective controls which enables risks to be assessed and managed effectively.
While providing leadership and strategic direction, the Board gives due recognition to expectations of different stakeholders such as shareholders, lenders, employees, government agencies, suppliers, customers, competitors, business partners and service providers. the Board is responsible in ensuring that the direction set is aligned to the Group’s established values and standards and due weightage is given to sustainability issues. It is also responsible for reviewing the management performance on a regular and continuous basis.
all Board members contribute their independent judgment, diversified knowledge and experience to decide on issues of strategy outlook, social and environmental issues, resources, standards of conduct and review of performance.
Board Committeesto assist the Board in the execution of its duties, the Board has delegated specific functions to the following board committees:
- audit Committee, responsible for the functions as set out in principle 12 of this report.
- nominating Committee, responsible for the functions as set out in principle 4 of this report.
- remuneration Committee, responsible for the functions as set out in principle 7 of this report.
Board Meeting and Attendancethe Board convenes scheduled meeting on a quarterly basis to coincide with the announcement of the Group’s quarterly results. ad hoc meetings are convened as and when necessary to attend any pressing matters requiring the Board’s consideration and decision in between the scheduled meetings. to facilitate the Board’s decision-making process, the Company’s articles of association provides for Directors to participate in Board meetings by teleconference or video conference. Decisions of the Board and board committees may also be obtained via circulation.
the Directors’ attendance at the Board and board committee meetings during the financial year ended 31 December 2014 is set out as follows:
name Board Meeting
audit Committee
Meeting
nominating Committee
Meeting
remuneration Committee
Meeting
Dr Cheo tong Choon @ Lee tong Choon 4 2
Ms Michelle Cheo Hui ning 4
Ms Bianca Cheo Hui Hsin 4
Ms Leong Choi Foong 4
Ms Wong Lai Wan 4
Mr Giam Chin toon 4 4 2 2
Mr Lim How teck 4 4 2 2
tan Sri Dato’ Ir Muhammad radzi Bin Haji Mansor 4 4 2 2
tan Sri Datuk Dr ong Soon Hock 3 1
no. of meetings held 4 4 2 2

27
Mewah InternatIonal Inc. annual report 2014Corporate GovernanCe
CorporateGovernanCe
Matters requiring Board approvalthe Board sets the strategic direction for the management and day-to-day operational decisions are taken by the management. the following matters of strategic importance have been reserved for the Board’s decision:
- Group’s strategy and business plans - Capital expenditure, investments and divestments
exceeding certain material limits - all capital-related matters including increase, decrease or
reorganisation - Dividend policy and dividend payments - risk strategy and risk limit approvals - approval of credit limits and trade terms with related parties
Induction, orientation and trainingat the time of appointment, directors are provided with formal letters setting out their duties and obligations. the Group also conducts an orientation program for new directors to familiarise them with the business activities of the Group, its strategic direction and corporate governance practices. First time directors are provided training on areas such as accounting, risk management, legal, compliance and industry-specific knowledge. all the directors are also given regular training and updates on relevant, specific matters relevant to facilitate them to carry out their role effectively. the directors are also encouraged to participate in external training at the Group’s expense. During the year, no new directors were appointed requiring such induction and training. to facilitate ongoing knowledge enhancement for existing directors, the following orientations and trainings were provided during the year:
- Challenges being faced by palm oil industry and Group’s strategy to consolidate its position
- overview of rice and dairy industries and Group’s growth plan for consumer products business
- Inherent trading and operating risks in Group’s business and Group’s risk management practices
- Update on new legislations, regulations and developments relevant to the Group.
- external seminars and conferences for specific directors on taxes, compliances, industry specific knowledge and leadership programs.
prInCIpLe 2Board Composition and GuidanceStrong and independent element on the Board
Board Compositionthe Board comprises nine members, four of whom are non-executive independent directors. the current Board possesses diversified and varied expertise and knowledge in the areas of the Group’s palm oil business and geographical operations, as well as in the areas of strategy formulation, manufacturing, marketing, legal, taxation, finance, accounting and corporate compliances. With their varied experience in different industries and areas of expertise, non-executive directors play a crucial role in challenging the Board to develop strategies in the best interest of the Group. they also contribute independent perspective in reviewing the performance of the management in meeting agreed goals and objectives and monitor performance reporting.
the Group emphasises great importance to gender equality. the Company has four women on the Board, namely Ms Michelle Cheo Hui ning, Ms Bianca Cheo Hui Hsin, Ms Leong Choi Foong and Ms Wong Lai Wan.
the composition and the effectiveness of the Board are reviewed on an annual basis by the nominating Committee to ensure that there is an appropriate mix of expertise and experience to fulfil its duties. In line with periodical renewal of the Board to gain diversified and varied expertise, two of the Independent Directors are not seeking re-election and two new Independent Directors are to be appointed in the forthcoming aGM. a brief profile of each Director is given on pages 8 to 10 of this annual report.

28
Building StrengthS Shaping the FutureCorporate GovernanCe
CorporateGovernanCe
the nature of the current Directors’ appointments on the Board and details of their membership on board committees are set out below:
name Board Membershipaudit
Committeenominating Committee
remunerationCommittee
Dr Cheo tong Chooon @ Lee tong Choon executive Director and Chairman of Board
Member
Ms Michelle Cheo Hui ning executive Director and Chief executive officer
Ms Bianca Cheo Hui Hsin executive Director and Chief operating officer
Ms Leong Choi Foong executive Director and Head, Finance and accounts (Malaysia)
Ms Wong Lai Wan executive Director and Head, risk Management
Mr Giam Chin toon1 Lead Independent Director Member Chairman Chairman
Mr Lim How teck1 Independent Director Chairman Member Member
tan Sri Dato’ Ir Muhammad radzi Bin Haji Mansor Independent Director Member Member Member
tan Sri Datuk Dr ong Soon Hock Independent Director Member
Mr robert Loke tan Cheng2 Lead Independent Director Member Chairman Chairman
Dr Foo Say Mui (Bill)2 Independent Director Chairman Member Member
1 not seeking re-election2 proposed appointment is subject to the Shareholders’ approval in the annual General Meeting on 28 april 2015
Independence of Directorsall non-executive directors are independent i.e. they have no relationship with the Group, its related companies, its 10% shareholders, or their officers that could interfere, or be reasonably perceived to interfere, with the exercise of the director’s independent business judgment with a view to the best interests of the Group, and they are able to exercise objective judgment on corporate affairs independently from management and its 10% shareholders.
all directors are required to disclose timely, any relationship or appointments which would impair their independence to the Board. Based on the evaluations and results of a review conducted by the nominating Committee, the Board views all non-executive directors of the Company as independent and that there are no relationships which are likely to affect the director’s judgment. also, none of the non-executive director has served on the Board beyond nine years from the date of his first appointment.

29
Mewah InternatIonal Inc. annual report 2014Corporate GovernanCe
CorporateGovernanCe
prInCIpLe 3Chairman and Chief executive officerSeparate Chairman and Chief Executive Officer
Chairman and Chief Executive Officerthe roles of the Chairman and the Chief executive officer (“Ceo”) are separate to ensure an appropriate balance of power, increased accountability and greater capacity of the Board for independent decision making.
the Chairman, Dr Cheo tong Choon @ Lee tong Choon is an executive Director and is responsible for leading the Board and facilitating its effectiveness while promoting a culture of openness and debate within the Board. He, as the Chairman, sets the agenda, ensures that the directors receive complete, adequate and timely information and that adequate time is available for discussion for matters on the agenda, particularly on matters relating to strategies. He is also responsible for constructive relations within the Board, and between the Board and the management. He is responsible to facilitate effective contribution of non-executive directors, effective communication with shareholders and promoting standards of corporate governance.
as an executive Director, Dr Cheo also plays an important role to align the management with the Board and ensure the execution of the strategies and direction decided by the Board. Dr Cheo has been the force behind the success of the Group and works closely with the Ceo and the management.
Ms Michelle Cheo Hui ning, daughter of Dr Cheo tong Choon @ Lee tong Choon is the Ceo and the executive Director. She is responsible for execution of overall strategy of the Group and day-to-day operations.
Lead Independent DirectorSince the Chairman and the Ceo are immediate family members, the Board has appointed Mr. Giam Chin toon as the Lead Independent Director. the Lead Independent Director has a pivotal role to ensure a balance of power and authority,
such that no one individual represents a considerable concentration of power. the Lead Independent Director acts as a bridge between the Independent Directors and the Chairman as well as representing shareholders’ interests. He also provides continuity of leadership at the Board level in the absence of the Chairman.
on the sidelines of every board meeting, the independent directors meet without the presence of the other directors and the feedback is provided by the Lead Independent Director to the Chairman after the meeting.
prInCIpLe 4Board MembershipFormal and transparent process for the appointment of new directors to the Board
the Board has established a nominating Committee (the “nC”) to make recommendations to the Board on all Board appointments. nC comprises Lead Independent Director Mr Giam Chin toon, Independent Directors tan Sri Datuk Dr ong Soon Hock, tan Sri Dato’ Ir Muhammad radzi Bin Haji Mansor, Mr Lim How teck, and executive Director Dr Cheo tong Choon @ Lee tong Choon. the Chairman of the nominating Committee is Mr Giam Chin toon.
nC is responsible for:(i) reviewing and assessing candidates for directorships
(including executive directorships) before making recommendations to the Board for appointment of Directors;
(ii) re-nomination of the Directors in accordance with the articles of association, having regard to the Director’s contribution and performance;
(iii) determining annually whether or not a Director is independent; and
(iv) deciding whether or not a Director is able to and has been adequately carrying out his duties as a director.

30
Building StrengthS Shaping the FutureCorporate GovernanCe
CorporateGovernanCe
the nC also makes recommendations on training and professional development needs of the Directors and how the Board’s performance is to be evaluated. the Board has implemented a process to be carried out by the nC for assessing the effectiveness of the Board as a whole and for assessing the contribution by each individual Director to the effectiveness of the Board. Details of the process are explained under principle 5, Board performance.
the Board has not set the maximum number of board representations which any director may hold. the nC continuously assesses the performance of individual directors taking into consideration the director’s number of board representation and other principal commitments. the nC is satisfied that sufficient time and attention is being given to the affairs of the Group by each director.
each member of the nC is required to abstain from deliberating, participating or voting in the matters relating to him including the assessment of his performance and re-nomination as director.
all Board appointments are approved by way of written resolutions based on the recommendations of the nC. In searching, nominating and selecting new directors, the nC will continue to tap on the resources of director’s personal contacts and recommendations of potential candidates and participate in the shortlisting and interviewing process, if required. the nC will engage external agencies to assist if required, at the expense of the Group.
In assessing re-appointment of the directors, the nC evaluates based on several criteria including, qualifications, contributions and independence of the directors. In accordance with the Company’s articles of association, each director shall retire at least once every three years. a retiring director shall be eligible for re-election subject to approval by the shareholders at the annual General Meeting (“aGM”). new directors will hold office only until the next aGM following their appointments and they will be eligible for re-election. Such Directors are not taken into account in determining the number of Directors who are to retire by rotation. the Board generally does not have a practice of appointing alternate directors.
Key information regarding each director’s qualifications, shareholdings, relationships (if any), date of first appointment, directorship and other principal commitments is presented in the ‘Board of Directors’ and ‘Directors’ report’ of this annual report.
prInCIpLe 5Board performanceFormal assessment of the effectiveness of the Board and its members
the nC has in place a process for the evaluation of the Board’s effectiveness as a whole, its board committees and a process for assessing the contribution by the Chairman and each individual director to the effectiveness of the Board. the evaluation is done through written assessments by individual directors. the assessment is based on objective performance criteria including the Board’s understanding of the Group’s business operations, development of strategic directions, the effectiveness of the Board meetings to facilitate discussion and decision on critical and major corporate matters, as well as individual’s contribution and commitment to their roles. the collated findings are reported and recommendations are submitted to the Board for review and to further enhance the Board’s effectiveness.
prInCIpLe 6access to InformationBoard members to have complete, adequate and timely information
as a general rule, board papers and related materials e.g. background or explanatory information, are required to be sent to directors at least three calendar days before the board meeting so that the members may better understand the matters prior to the board meeting to enable constructive discussion and queries to be raised in the meeting. However, sensitive matters may be tabled at the meeting itself or discussed without any papers being distributed. the directors are also provided with the names and contact details of the Group’s senior management and the Company Secretary to

31
Mewah InternatIonal Inc. annual report 2014Corporate GovernanCe
CorporateGovernanCe
facilitate direct access to the senior management and the Company Secretary.
the Group fully recognises that the flow of relevant information on an accurate and timely basis is critical for the Board to be effective in discharge of its duties. Management is therefore expected to provide the Board with accurate information in a timely manner concerning the Group’s progress or shortcomings in meeting its strategic business objectives or financial targets and other information relevant to the strategic issues facing the Group.
the role of the Company Secretary is clearly defined and includes the responsibility of ensuring that the board procedures are followed and that applicable rules and regulations are complied with. the Company Secretary is required to attend all board meetings. the appointment and removal of the Company Secretary is a matter for the Board as a whole.
Subject to the approval of the Chairman, the directors, whether as a Group or individually, may seek and obtain independent professional advice to assist them in their duties, at the expense of the Group.
prInCIpLe 7procedures for Developing remuneration policiesA formal and transparent procedure for developing policy
the remuneration Committee (the “rC”) comprises entirely of independent directors. the rC is chaired by Mr Giam Chin toon with tan Sri Dato’ Ir Muhammad radzi Bin Haji Mansor and Mr Lim How teck as its members.
the rC is responsible for recommending to the Board a framework of remuneration for the Directors and key executives, and determining specific remuneration packages for each Director and the Chief executive officer. the recommendations of the rC are submitted for endorsement by the entire Board. all aspects of remuneration, including but not limited to directors’ fees, salaries, allowances, bonuses, options and benefits in kind are covered by the remuneration
Committee. each member of the remuneration Committee is required to abstain from voting on any resolutions and making recommendations and/ or participating in any deliberations of the remuneration Committee in respect of his own remuneration package.
the rC has access to appropriate advice from within and/or outside the Group on the remuneration of Directors and key executives. It ensures that in the event of such advice being sought, existing relationships, if any, between the Group and its appointed remuneration consultants will not affect the independence and objectivity of the remuneration consultants. In the financial year 2014, the rC did not engage any remuneration consultants.
the rC is also responsible in reviewing the Group’s obligations arising in the event of termination of the executive directors’ and key management personnel’s contract of service, to ensure that such contracts of service contain fair and reasonable termination clauses which are not overly generous. the rC aims to be fair and avoid rewarding poor performance.
prInCIpLe 8Level and Mix of remunerationAlignment of remuneration to long term interest and risk policies of the company
a competitive remuneration and reward system based on individual performance is important in order to retain and incentivise the best talents. the Group’s level and mix of remuneration is aligned with the long term interests and risks policies of the Group and is also responsive to the economic climate as well as the performance of the Group, business units and individuals.
non-executive Directors are paid Directors’ fees which comprise a basic fee and additional fees for appointments on other board committees. as an executive Director, the Ceo does not receive Directors’ fees but is remunerated as a member of management.

32
Building StrengthS Shaping the FutureCorporate GovernanCe
CorporateGovernanCe
prInCIpLe 9Disclosure on remunerationClear disclosure of remuneration policy, level and mix of remuneration, and procedure for setting remuneration
the breakdown of the remuneration of the Directors and employees who are immediate family members of a director of the Company, for the financial year ended 31 December 2014 is as follows:
name Fixed Salaryvariable Income
Benefits in Kind total
remuneration Band S$’000
executive Directors
Dr Cheo tong Choon @ Lee tong Choon 80% 20% <1% 100% 3,250 to 3,500
Ms Michelle Cheo Hui ning 79% 20% 1% 100% 1,000 to 1,250
Ms Bianca Cheo Hui Hsin 79% 20% 1% 100% 1,000 to 1,250
Ms Wong Lai Wan 59% 37% 4% 100% 250 to 500
Ms Leong Choi Foong 82% 17% 1% 100% 250 and below
Independent non-executive Directors
Mr Giam Chin toon 100% - - 100% 250 and below
Mr Lim How teck 100% - - 100% 250 and below
tan Sri Dato’ Ir Muhammad radzi Bin Haji Mansor 100% - - 100% 250 and below
tan Sri Datuk Dr ong Soon Hock 100% - - 100% 250 and below
nameFamily relationship with any director and/or
substantial shareholderremuneration
Band S$’000
employees who are immediate family members of a Director (remuneration exceeding S$50,000)
Mr Cheo Jian Jia Son of Dr Cheo tong Choon @ Lee tong Choon; Brother of Ms Michelle Cheo Hui ning and Ms Bianca Cheo Hui Hsin
250 to 500
Ms Cheo Chong Cher
Sisters of Dr Cheo tong Choon @ Lee tong Choon; aunts of Ms Michelle Cheo Hui ning and
Ms Bianca Cheo Hui Hsin
250 to 500
Ms Cheo Sor Cheng angeline 250 to 500
Ms Cheo Su Ching 250 and below
Ms alicia Cheo 250 and below
Ms Cheo Soh Hua @ Lee Soh Hua 250 and below
Mr Cheo teong eng Brother of Dr Cheo tong Choon @ Lee tong Choon; Uncle of Ms Michelle Cheo Hui ning and Ms Bianca Cheo Hui Hsin
250 and below

33
Mewah InternatIonal Inc. annual report 2014
audit Committees in Singapore, the Board also reviews and approves any media release of its financial results. negative assurance statements given by the Board to accompany the quarterly financial results announcements are supported by management’s representations to the Board on the integrity of the Group’s financial statements and internal control systems.
prInCIpLe 11risk Management and Internal ControlsSound system of internal controls;prInCIpLe 13Internal auditEstablishment of an effective internal audit function
Based on the internal controls established and maintained by the Group, work performed by the internal auditors, work performed by external auditors for the purpose of the statutory audit and reviews performed by management, various board committees and the Board, the audit Committee and the Board are satisfied with the adequacy and effectiveness of the internal controls, including financial, operational, compliance and information technology controls, and risk management systems.
the Chief executive officer and Chief Financial officer have also provided a written confirmation to the Board that to the best of their understanding (a) the financial records have been properly maintained, the financial statements give a true and fair view of the Group’s operations and finances and (b) the Group’s risk management and internal control systems are effective.
the internal audit function of the Group is carried out by in-house Group Internal audit Department (“Ia”). the Ia is suitably staffed by qualified executives who carry out their work based on the Standards for the professional practice of Internal auditing set by the Institute of Internal auditors. the Ia’s direct and primary line of reporting is to the Chairman of the audit Committee, and administratively to the Chief executive officer. the audit Committee approves the hiring, removal, evaluation, and compensation of the head of Ia.
the role of the internal auditors is to assist the audit Committee to provide reasonable assurance that the Group maintains a sound system of internal controls by regular monitoring of key controls and procedures and ensuring their effectiveness, undertaking investigations as directed by the audit Committee, and conducting regular in-depth audits of high risk areas.
top Five Key Management personnel
remuneration paid to the top five key management personnel ranged between S$250,000 and S$1,750,000 and aggregated to S$3,437,000, 55%, 44%, 1% of which was fixed salary, variable income and benefits in kind respectively.
In considering the disclosure of remuneration of the directors, immediate family members of a director or key management personnel, the Group measured the industry conditions in which the Group operates and the confidential nature of the remuneration. the Group believes that more detailed disclosures such as disclosure of remuneration on individually named basis for key personnel, exact amounts for directors, and disclosure in incremental bands of S$50,000 for the immediate family members of the directors would be detrimental to the long term interest of the Group and in attracting, retaining and motivating the employees of the Group.
remuneration of executive directors and key executives includes a variable component which is linked directly to performance measures identified by the Group. the quantum of variable component is dependent on the individual performance against those measures that includes, knowledge and understanding of the Group and industry, execution of strategies, personal qualities, as well as performance of the Group in general.
the Company did not have any employee share schemes for the financial year 2014.
prInCIpLe 10accountabilityBalanced and understandable assessment of the Company’s performance, position and prospects
the Board has embraced openness and transparency in the conduct of the Group’s affairs, whilst preserving the commercial interests of the Group. Financial reports and other price-sensitive information are disseminated to shareholders through announcements via SGXnet to the SGX, press releases, the Company’s website, and public webcast and media and analyst briefings.
the Board reviews the financial reports to ensure that the disclosure of material information to shareholders is in compliance with statutory requirements and the Listing Manual of the SGX-St and approves the financial reports before the release. as recommended in the Guidebook for
Corporate GovernanCe
CorporateGovernanCe

34
Building StrengthS Shaping the Future
the audit Committee ensures that the Ia are adequately resourced and have appropriate standing within the Group and ensures, on an annual basis, the adequacy of the internal audit function and reviews the adequacy and effectiveness of the internal audit function.
the Group’s Ia conduct an annual review of the effectiveness of the Group’s material internal controls, including financial, operational, compliance, information technology controls, and risk management. any material non-compliance or failures in internal controls and recommendations for improvements are reported to the audit Committee. the audit Committee also reviews the effectiveness of the actions taken by management on the recommendations made by the internal and external auditors in this respect.
the Group Internal audit adopted a risk-based auditing approach that focuses on material internal controls, including financial, operational and compliance controls. audits were carried out on all significant business units in the Group, inclusive of limited review performed on dormant and inactive companies. all the Group Internal audit’s reports are submitted to the audit Committee for deliberation with copies of these reports extended to the Chairman, Chief executive officer and the relevant senior management officers. In addition, Ia’s summary of findings and recommendations are discussed at the audit Committee meetings.
prInCIpLe 12audit CommitteeEstablishment of Audit Committee with written terms of reference
the audit Committee (“aC”) comprises entirely non-executive and independent directors, namely Mr Lim How teck, tan Sri Dato’ Ir Muhammad radzi Bin Haji Mansor and Mr Giam Chin toon. the Board considers the members of the aC are appropriately qualified with sufficient and relevant financial management expertise and experience to discharge its functions. the aC is also kept abreast of changes to accounting standards and issues which have a direct impact on financial statements through meetings with the external auditors who will update the aC on recent related developments. It held four meetings in FY 2014. the aC has met with the internal and external auditors without the presence of the management once during the year.
the aC is guided by the following terms of reference which defines its scope of authority:
(i) commissioning internal investigations and reviewing any significant findings and otherwise carrying out its obligations under rule 719 of the SGX-St Listing Manual (for example, in relation to any suspected fraud or irregularity or suspected infringement of any Singapore laws or regulations or rules of the SGX-St or any other regulatory authority of Singapore, which has or is likely to have a material impact on the Company’s operating results or financial position);
(ii) assisting the Board in the discharge of its responsibilities on financial and accounting matters;
(iii) recommending the appointment and dismissal of internal auditors and reviewing the audit plans, scope of work and results of the audits compiled by the Group’s internal and external auditors;
(iv) reviewing the co-operation given by the Group’s officers to the external auditors;
(v) nominating external auditors for re-appointment; (vi) reviewing the integrity of any financial information
presented to the Company’s shareholders; (vii) reviewing interested person transactions and potential
conflicts of interest, if any; (viii) reviewing all hedging policies and instruments to be
implemented by the Group, if any; (ix) reviewing all investment instruments that are not
principal protected; (x) reviewing and evaluating the Group’s administrative,
operating and internal accounting controls and procedures; and
(xi) reviewing the Group’s risk management structure and any oversight of risk management processes and activities to mitigate and manage risk at acceptable levels determined by the Board.
each member of the audit Committee must abstain from voting on any resolution in respect of matters in which he is interested.
the audit Committee has conducted annual review on the independence and objectivity of the external auditors as well as non-audit services provided by them and is satisfied that the nature and extent of such services do not affect the independence of the external auditor. Details of the fees paid and payable to the auditors in respect of audit and non-audit services are set out in the notes to financial statements of
Corporate GovernanCe
CorporateGovernanCe

35
Mewah InternatIonal Inc. annual report 2014
this annual report. the Group has complied with rule 712, and rule 715 read with rule 716 of the SGX Listing Manual in relation to its auditors.
the Group has put in place a policy on whistle-blowing, approved by the audit Committee and endorsed by the Board to facilitate the reporting of activities or practices which are malpractice, illegal act or omission of work by an employee. Details of the whistle blowing policies and arrangements have been made available to all employees. By creating an atmosphere of openness and trust, the Group encourages the employees to use internal mechanisms for reporting any malpractice, illegal acts or omissions by any of Group’s employees or ex-employees and such reports will be treated fairly and be protected from reprisal.
prInCIpLe 14 Shareholder rightsAll shareholders are treated fairly and equitably;prInCIpLe 15Communication with shareholdersRegular, effective and fair communication with shareholders;prInCIpLe 16Conduct of shareholder meetingsGreater shareholder participation at Annual General Meetings
the Group values dialogue with its shareholders and believes in regular, effective and fair communication with its shareholders. the Group is committed to upholding high standard of disclosure and continues to keep all stakeholders informed of its corporate activities on a timely and consistent basis. the Company disseminates all price sensitive and material information to its shareholders via SGXnet on a non-selective basis. Financial and other performance data of the Group as well as business units, where appropriate, is provided to shareholders in order to have a better insight into the Group’s performance. the date of the release of quarterly results is disclosed at least two weeks prior to the date of announcement through SGXnet. on the day of announcement, the financial statements as well as the accompanying press release and presentation slides are released onto the SGX-St website as well as on the Company website at www.mewahgroup.com. thereafter, a briefing or teleconference by management is jointly held for media and analysts.
all shareholders of the Company whose names are registered in the Depository register and the register of Members are entitled to attend the general meetings of the Company. Shareholders are informed of shareholders’ meetings through notices published in the newspapers and reports or circulars sent to all shareholders. all shareholders have the opportunity to participate effectively in and vote at general meetings of shareholders and have been informed of the rules, including voting procedures, which govern general meetings of shareholders. they are encouraged to meet with the Board and senior management so as to have a greater insight into the Group’s developments. If any shareholder is unable to attend, he is allowed to appoint up to two proxies to vote on his behalf at the meeting through proxy forms sent in advance.
at shareholders’ meetings, each distinct issue is proposed as a separate resolution and the results of the votes are announced at the shareholders’ meetings.
the Chairmen of each board committee and management are required to be present to address questions at the annual General Meeting. external auditors are also present at such meetings to assist the directors to address shareholders’ queries, if necessary. Minutes of shareholder meetings are available upon request by registered shareholders.
Furthermore, to show appreciation for the support of the shareholders, the Board of Directors has proposed a final exempt dividend of S$0.017 per ordinary share.
Dealings in Securitiesthe Group has adopted a Best practice Code – trading in Company’s Securities. as per the policy, the Company, its Directors and all employees of the Group are prohibited from dealing in the Company’s shares two weeks before the announcement of the Group’s first quarter, second quarter and third quarter results and one month before the announcement of full year results, and ending with one business day after the announcement of the results. Directors and all employees are also prohibited from trading in the Company’s securities on short-term considerations, defined as 30 days from last dealing; and in situations where the insider trading laws and rules would prohibit trading.
the directors’ interests in shares of the Company are found on pages 38 to 39 of this report.
Corporate GovernanCe
CorporateGovernanCe

36
Building StrengthS Shaping the Future
Interested Person Transactionsthe Company has established procedures to ensure that all transactions with interested persons are reported on a timely manner to the aC and that the transactions are carried out on a normal commercial terms and will not be prejudicial to the interests of the Company and its minority shareholders. the Company’s disclosures in respect of interested person transactions for the financial year ended 31 December 2014 are as follows:
name of Interested person
aggregate value of all Ipt during the period under review (excluding transactions
less than SGD100,000 and transactions conducted under shareholders’ mandate
pursuant to rule 920)
aggregate value of all Ipt conducted under shareholders’ mandate pursuant to rule 920
(excluding transactions less than SGD100,000)
FY 2014 US$’000
FY 2014 US$’000
prelude Gateway Sdn. Bhd. 2 3,283
perfect venue Sdn. Bhd 2,309 nIL
ecolex Sdn. Bhd. 1,115 38,903
Containers printers pte Ltd nIL 5,255
nature International pte Ltd nIL 34,329
Mr Cheo Seng Jin 852 nIL
Mr Cheo tiong Choon 852 nIL
Kent Holidays (S) pte Ltd 213 nIL
Choon Heng Logistics pte Ltd 57 nIL
expertway (M) Sdn Bhd 31 nIL
Statement by Audit Committee and Board of DirectorsIn accordance with rule 716 of the Listing Manual, the audit Committee and the Board of Directors of the Company have satisfied themselves that the appointment of different auditors for certain of its overseas subsidiaries as disclosed on page 117, would not compromise the standard and effectiveness of the audit of the Group.
Material Contractsthere was no material contracts entered into by the Company or any of its subsidiaries involving the interests of the Chief executive officer, any Director, or controlling shareholder subsisting at the end of financial year ended 31 December 2014 and no material contracts entered into since the end of the previous financial year.
Corporate GovernanCe
CorporateGovernanCe

NOTES TO THE FINANCIAL STATEMENTSFor the financial year ended 31 December 2014
MeWaH InternatIonaL InC. annUaL report 2014
37
FInanCIaL StateMentS
FInanCIaLStateMentS
38 Directors’ report
41 Statement by Directors
42 Independent auditor’s report
43 Consolidated Income Statement
44 Consolidated Statement of Comprehensive Income
45 Balance Sheet – Group
46 Balance Sheet – Company
47 Consolidated Statement of Changes in equity
48 Consolidated Statement of Cash Flows
49 notes to the Financial Statements

38
Building StrengthS Shaping the FutureDIreCtorS’ report
DIreCtorS’ reportFor the financial year ended 31 December 2014
the directors present their report to the members together with the audited financial statements of the Group for the financial year ended 31 December 2014 and the balance sheet of the Company as at 31 December 2014.
DIreCtorS
the directors of the Company in office at the date of this report are as follows:
Dr Cheo tong Choon @ Lee tong Choon Ms Michelle Cheo Hui ning Ms Bianca Cheo Hui Hsin Ms Leong Choi Foong Ms Wong Lai Wan Mr Giam Chin toon tan Sri Dato’ Ir Muhammad radzi Bin Haji Mansor Mr Lim How teck tan Sri Datuk Dr ong Soon Hock
arranGeMentS to enaBLe DIreCtorS to aCquIre ShareS anD DeBentureS
neither at the end of nor at any time during the financial year was the Company a party to any arrangement whose object was to enable the directors of the Company to acquire benefits by means of the acquisition of shares in, or debentures of, the Company or any other body corporate.
DIreCtorS’ IntereStS In ShareS or DeBentureS
(a) according to the register of directors’ shareholdings, none of the directors holding office at the end of the financial year had any interest in the shares or debentures of the Company or its related corporations, except as follows:
no. of ordinary shares
Holdings registered in name of director or nominee
Holdings in which director is deemed to have an interest
at 31.12.2014 at 1.1.2014 at 31.12.2014 at 1.1.2014
Dr Cheo tong Choon @ Lee tong Choon 10,984,000 - 691,461,220 620,008,220
Ms Michelle Cheo Hui ning 2,000,000 - 622,461,220 566,008,220
Ms Bianca Cheo Hui Hsin - - 622,461,220 566,008,220
Ms Leong Choi Foong 94,000 94,000 - -
Ms Wong Lai Wan 224,000 224,000 20,000 20,000
Mr Giam Chin toon 200,000 200,000 - -
tan Sri Dato’ Ir Muhammad radzi Bin
Haji Mansor 20,000 20,000 - -
Mr Lim How teck 300,000 300,000 - -
tan Sri Datuk Dr ong Soon Hock 30,000 30,000 - -

39
Mewah InternatIonal Inc. annual report 2014DIreCtorS’ report
DIreCtorS’ reportFor the financial year ended 31 December 2014
DIreCtorS’ IntereStS In ShareS or DeBentureS (ContInueD)
(b) the directors’ interests in the ordinary shares of the Company as at 21 January 2015 were the same as those as at 31 December 2014.
DIreCtorS’ ContraCtuaL BeneFItS
Since the end of the previous financial year, no director has received or become entitled to receive a benefit by reason of a contract made by the Company or a related corporation with the director or with a firm of which he is a member or with a company in which he has a substantial financial interest, except as disclosed in the accompanying financial statements and in this report.
auDIt CoMMIttee
the members of the audit Committee at the end of the financial year were as follows:
Mr Lim How teck (Chairman)tan Sri Dato’ Ir Muhammad radzi Bin Haji MansorMr Giam Chin toon
all members of the audit Committee were non-executive directors.
the audit Committee carried out its functions in accordance with Section 201B(5) of the Singapore Companies act. In performing those functions, the Committee reviewed:
• thescopeandtheresultsofinternalauditprocedureswiththeinternalauditor;
• theauditplanoftheCompany’sindependentauditorandanyrecommendationsoninternalaccountingcontrolsarisingfrom the statutory audit;
• theassistancegivenbytheCompany’smanagementtotheindependentauditor;and
• thebalancesheetoftheCompanyandtheconsolidatedfinancialstatementsoftheGroupforthefinancialyearended31 December 2014 before their submission to the Board of Directors, as well as the Independent auditor’s report on the balance sheet of the Company and the consolidated financial statements of the Group.
the audit Committee has recommended to the Board that the independent auditor, pricewaterhouseCoopers LLp, be nominated for re-appointment at the forthcoming annual General Meeting of the Company.

40
Building StrengthS Shaping the FutureDIreCtorS’ report
DIreCtorS’ reportFor the financial year ended 31 December 2014
InDepenDent auDItor
the independent auditor, pricewaterhouseCoopers LLp, has expressed its willingness to accept re-appointment.
on behalf of the directors
Dr Cheo tong Choon @ Lee tong Choon Ms Michelle Cheo Hui ningDirector Director
4 March 2015

41
Mewah InternatIonal Inc. annual report 2014StateMent BY DIreCtorS
StateMent BY DIreCtorSFor tHe FInanCIaL Year enDeD 31 DeCeMBer 2014
In the opinion of the directors,
(a) the balance sheet of the Company and the consolidated financial statements of the Group as set out on pages 43 to 117 are drawn up so as to give a true and fair view of the state of affairs of the Company and of the Group as at 31 December 2014, and of the results of the business, changes in equity and cash flows of the Group for the financial year then ended; and
(b) at the date of this statement, there are reasonable grounds to believe that the Company will be able to pay its debts as and when they fall due.
on behalf of the directors
Dr Cheo tong Choon @ Lee tong Choon Ms Michelle Cheo Hui ning Director Director
4 March 2015

42
Building StrengthS Shaping the Future
InDepenDent auDItor’S report to tHe MeMBerS oF MeWaH InternatIonaL InC.
InDepenDent aUDItor’S report
report on the FInanCIaL StateMentS
We have audited the accompanying financial statements of Mewah International Inc. (the “Company”) and its subsidiaries (the “Group”) set out on pages 43 to 117, which comprise the consolidated balance sheet of the Group and balance sheet of the Company as at 31 December 2014, the consolidated income statement, consolidated statement of comprehensive income, statement of changes in equity and statement of cash flows of the Group for the financial year then ended, and a summary of significant accounting policies and other explanatory information.
Management’s Responsibility for the Financial StatementsManagement is responsible for the preparation of financial statements that give a true and fair view in accordance with Singapore Financial reporting Standards, and for devising and maintaining a system of internal accounting controls sufficient to provide a reasonable assurance that assets are safeguarded against loss from unauthorised use or disposition; and transactions are properly authorised and that they are recorded as necessary to permit the preparation of true and fair profit and loss accounts and balance sheets and to maintain accountability of assets.
Auditor’s Responsibilityour responsibility is to express an opinion on these financial statements based on our audit. We conducted our audit in accordance with Singapore Standards on auditing. those standards require that we comply with ethical requirements and plan and perform the audit to obtain reasonable assurance about whether the financial statements are free from material misstatement.
an audit involves performing procedures to obtain audit evidence about the amounts and disclosures in the financial statements. the procedures selected depend on the auditor’s judgement, including the assessment of the risks of material misstatement of the financial statements, whether due to fraud or error. In making those risk assessments, the auditor considers internal control relevant to the entity’s preparation of financial statements that give a true and fair view in order to design audit procedures that are appropriate in the circumstances, but not for the purpose of expressing an opinion on the effectiveness of the entity’s internal control. an audit also includes evaluating the appropriateness of accounting policies used and the reasonableness of accounting estimates made by management, as well as evaluating the overall presentation of the financial statements.
We believe that the audit evidence we have obtained is sufficient and appropriate to provide a basis for our audit opinion.
OpinionIn our opinion, the consolidated financial statements of the Group and the balance sheet of the Company are properly drawn up in accordance with Singapore Financial reporting Standards so as to give a true and fair view of the state of affairs of the Group and of the Company as at 31 December 2014, and the results, changes in equity and cash flows of the Group for the financial year ended on that date.
pricewaterhouseCoopers LLppublic accountants and Chartered accountants
Singapore, 4 March 2015

43
Mewah InternatIonal Inc. annual report 2014
ConSoLIDateD InCoMe StateMentFor the financial year ended 31 December 2014
ConSoLIDateD InCoMe StateMent
note 2014 2013
uS$’000 US$’000
revenue 4 3,438,819 3,193,733
Cost of sales 5 (3,206,239) (2,952,355)
Gross profit 232,580 241,378
other income 6 5,561 5,654
other losses 7 (20,930) (11,690)
expenses
- Selling and distribution (128,530) (126,438)
- administrative (72,852) (72,901)
- Finance 8 (12,299) (13,377)
Share of profit of associated company 80 74
profit before tax 10 3,610 22,700
Income tax expense 11 (583) (2,695)
profit after tax 3,027 20,005
profit after tax attributable to:
equity holders of the Company 2,695 20,931
non-controlling interests 332 (926)
3,027 20,005
earnings per share attributable to equity holders of the Company (expressed in US cents per share)
- Basic and diluted 12 0.18 1.39
the accompanying notes form an integral part of these financial statements.

44
Building StrengthS Shaping the Future
ConSoLIDateD StateMent oF CoMprehenSIve InCoMeFor the financial year ended 31 December 2014
ConSoLIDateD StateMent oF CoMpreHenSIve InCoMe
2014 2013
uS$’000 US$’000
profit after tax 3,027 20,005
other comprehensive loss:
Items that may be reclassified subsequently to profit or loss:
Currency translation differences arising from foreign subsidiaries (11,664) (15,026)
total comprehensive (loss)/income, net of tax (8,637) 4,979
total comprehensive (loss)/income attributable to:
equity holders of the Company (9,466) 6,212
non-controlling interests 829 (1,233)
(8,637) 4,979
the accompanying notes form an integral part of these financial statements.

45
Mewah InternatIonal Inc. annual report 2014
BaLanCe Sheet – Groupas at 31 December 2014
BaLanCe SHeet – GroUp
note 2014 2013uS$’000 US$’000
aSSetSCurrent assetsInventories 13 294,368 247,486trade receivables 14 290,287 292,702other receivables 15 28,079 27,685Current income tax recoverable 6,876 9,779Derivative financial instruments 16(a) 48,825 31,277Cash and cash equivalents 17 60,825 63,145
729,260 672,074
non-current assetsDeferred income tax assets 24 11,417 10,862property, plant and equipment 18 346,923 347,167Leasehold prepayments 19 34,781 18,459Investment in associated company 20(a) 379 323Derivative financial instruments 16(b) 668 550
394,168 377,361
total assets 1,123,428 1,049,435
LIaBILItIeSCurrent liabilitiestrade payables 21 147,007 141,042other payables 22 43,018 39,589Current income tax liabilities 2,573 2,832Derivative financial instruments 16(a) 42,756 21,459Borrowings 23 228,665 178,562
464,019 383,484
non-current liabilitiesDeferred income tax liabilities 24 21,247 22,345Borrowings 23 102,590 86,781
123,837 109,126
total liabilities 587,856 492,610
net aSSetS 535,572 556,825
equItYCapital and reserves attributable to equity holders of the
Company:Share capital 25 1,501 1,507Share premium 25 180,012 185,416retained profits 27(a) 390,730 396,776other reserves 26 (33,259) (22,308)
538,984 561,391non-controlling interests (3,412) (4,566)total equity 535,572 556,825
the accompanying notes form an integral part of these financial statements.

46
Building StrengthS Shaping the Future
BaLanCe Sheet – CoMpanYas at 31 December 2014
BaLanCe SHeet – CoMpanY
note 2014 2013uS$’000 US$’000
aSSetSCurrent assetsother receivables 15 205,643 195,670Cash and cash equivalents 17 56 75
205,699 195,745
non-current assetsInvestments in subsidiaries 20(b) 849 820
total assets 206,548 196,565
LIaBILItIeS
Current liabilitiesother payables 22 142 148Current income tax liabilities 147 162
289 310
non-current liabilitiesDeferred income tax liabilities 24 366 307
total liabilities 655 617
net aSSetS 205,893 195,948
equItYCapital and reserves attributable to equity holders of the
Company:Share capital 25 1,501 1,507Share premium 25 180,012 185,416retained profits 27(b) 20,871 9,025other reserves 26 3,509 -
total equity 205,893 195,948
the accompanying notes form an integral part of these financial statements.

47
Mewah InternatIonal Inc. annual report 2014
ConSoLIDateD StateMent oF ChanGeS In equItYFor the financial year ended 31 December 2014
ConSoLIDateD StateMent oF CHanGeS In eQUItY
attr
ibut
able
to e
quity
hol
ders
of t
he C
ompa
ny
not
eSh
are
capi
tal
US$
’000
Shar
e pr
emiu
mU
S$’0
00
Capi
tal
rede
mpt
ion
rese
rve
US$
’000
Mer
ger
rese
rve
US$
’000
Gen
eral
re
serv
eU
S$’0
00
asse
t re
valu
atio
n re
serv
eU
S$’0
00
Curre
ncy
tran
slatio
n re
serv
eU
S$’0
00
reta
ined
profi
tsU
S$’0
00to
tal
US$
’000
non
-co
ntro
lling
in
tere
sts
US$
’000
tota
l eq
uity
U
S$’0
00
2014
Begi
nnin
g of
fina
ncia
l yea
r1,
507
185,
416
-(5
0,70
6)(2
,608
)10
,058
20,9
4839
6,77
656
1,39
1(4
,566
)55
6,82
5
acqu
isitio
n of
a su
bsid
iary
un
der c
omm
on c
ontr
ol34
--
-(2
,299
)-
--
-(2
,299
) -
(2,2
99)
Shar
e pu
rcha
sed
and
canc
elle
d25
& 2
6(6
)(5
,404
)3,
509
--
--
-(1
,901
)-
(1,9
01)
Div
iden
ds28
--
--
--
-(8
,741
)(8
,741
)-
(8,7
41)
Capi
tal c
ontr
ibut
ion
from
no
n-co
ntro
lling
inte
rest
s-
--
--
--
--
325
325
tota
l com
preh
ensiv
e lo
ss fo
r th
e fin
anci
al y
ear
--
--
--
(12,
161)
2,69
5(9
,466
)82
9(8
,637
)
end
of fi
nanc
ial y
ear
1,50
118
0,01
23,
509
(53,
005)
(2,6
08)
10,0
588,
787
390,
730
538,
984
(3,4
12)
535,
572
2013
Begi
nnin
g of
fina
ncia
l yea
r1,
507
185,
416
-(5
0,70
6)(2
,608
)10
,058
35
,667
38
3,94
6 56
3,28
0 (3
,333
)55
9,94
7
Div
iden
ds28
--
--
--
-(8
,101
)(8
,101
)-
(8,1
01)
tota
l com
preh
ensiv
e in
com
e fo
r the
fina
ncia
l yea
r-
--
--
-(1
4,71
9)20
,931
6,21
2(1
,233
)4,
979
end
of fi
nanc
ial y
ear
1,50
718
5,41
6-
(50,
706)
(2,6
08)
10,0
5820
,948
396,
776
561,
391
(4,5
66)
556,
825
the
acco
mpa
nyin
g no
tes f
orm
an
inte
gral
par
t of t
hese
fina
ncia
l sta
tem
ents
.

48
Building StrengthS Shaping the FutureConSoLIDateD StateMent oF CaSH FLoWS
ConSoLIDateD StateMent oF CaSh FLoWSFor the financial year ended 31 December 2014
note 2014 2013uS$’000 US$’000
Cash flows from operating activities profit after tax 3,027 20,005adjustments for:
- Income tax expense 583 2,695- amortisation 1,305 1,270- Depreciation 17,512 18,212- Gain on disposal of property, plant and equipment - net (142) (368)- property, plant and equipment written off 28 151- Impairment loss on property, plant and equipment - 330- Interest income (3,933) (4,267)- Interest expense 12,299 13,377- Share of profit of associated company (80) (74)- Loss on liquidation of subsidiaries 92 -- exchange differences (net) 3,564 4,938
operating cash flows before working capital changes 34,255 56,269
Changes in operating assets and liabilities:- Inventories (46,882) (4,040)- trade and other receivables (1,196) 217,159- trade and other payables 9,394 (108,950)- Derivative financial instruments 3,631 35,564
Cash flows (used in)/generated from operations (798) 196,002Interest received 3,214 3,676Interest paid (12,299) (13,377)Income tax refund received 678 1,864net cash flows (used in)/from operating activities (9,205) 188,165
Cash flows from investing activitiesDecrease/(Increase) in other receivables 3,450 (110)additions to property, plant and equipment (38,048) (53,079)additions of leasehold prepayments 19 (17,627) (1,949)proceeds from disposal of property, plant and equipment 232 536acquisition of a subsidiary under common control 34 (2,299) -net cash flows used in investing activities (54,292) (54,602)
Cash flows from financing activitiesDividends paid to equity holders of the Company 28 (8,741) (8,101)Decrease/(Increase) in restricted short term deposit 661 (2,677)proceeds from long term borrowings 70,096 37,129repayment of long term borrowings (37,221) (26,996)net proceeds/(repayment) from short term borrowings 40,128 (120,686)repayment of finance lease liabilities (41) (239)Interest received 719 591Share purchased and cancelled 25 (1,901) -net cash flows from/(used in) financing activities 63,700 (120,979)
net change in cash and cash equivalents 203 12,584Cash and cash equivalents at beginning of financial year 59,976 48,557effect of changes in exchange rate on cash and cash equivalents (1,827) (1,165)Cash and cash equivalents at end of financial year 17 58,352 59,976
the accompanying notes form an integral part of these financial statements.
49
NOTES TO THE FINANCIAL STATEMENTS
NOTES TO THE FINANCIAL STATEMENTSFor the financial year ended 31 December 2014
Mewah InternatIonal Inc. annual report 2014
these notes form an integral part of and should be read in conjunction with the accompanying financial statements.
1. GeneraL InForMatIon
Mewah International Inc. (the “Company”) is listed on the Singapore exchange and incorporated and domiciled in the Cayman Islands. the address of its registered office is Harbour place, 2nd Floor, 103 South Church Street, p.o. Box 472, George town, Grand Cayman, KY1-1106, Cayman Islands. the principal place of business of the Company is at 5, International Business park, #05-00, Mewah Building, Singapore 609914.
the principal activity of the Company is that of investment holding. the principal activities of its subsidiaries are disclosed in note 37 of the financial statements.
2. SIGnIFICant aCCountInG poLICIeS
2.1 Basis of preparation
these financial statements have been prepared in accordance with Singapore Financial reporting Standards (“FrS”) under the historical cost convention, except as disclosed in the accounting policies below.
the preparation of financial statements in conformity with FrS requires management to exercise its judgement in the process of applying the Group’s accounting policies. It also requires the use of certain critical accounting estimates and assumptions. the areas involving a higher degree of judgement or complexity, or areas where assumptions and estimates are significant to the financial statements, are disclosed in note 3.
Interpretations and amendments to published standards effective in 2014
on 1 January 2014, the Group adopted the new or amended FrS and Interpretations of FrS (“Int FrS”) that are mandatory for application for the financial year. Changes to the Group’s accounting policies have been made as required, in accordance with the transitional provisions in the respective FrS and Int FrS.
the adoption of these new or amended FrS and Int FrS did not result in substantial changes to the accounting policies of the Group and the Company and had no material effect on the amounts reported for the current or prior financial years except for the following:
FRS 112 Disclosures of Interests in Other Entities the Group has adopted the above new FrS on 1 January 2014. the amendment is applicable for annual periods beginning on or after 1 January 2014. It sets out the required disclosures for entities reporting under the new FRS 110 Consolidated Financial Statements and FRS 111 Joint Arrangements, and replaces the disclosure requirements currently found in FRS 27 (revised 2011) Separate Financial Statements and FRS 28 (revised 2011) Investments in Associates and Joint Ventures.
the Group has applied FrS 112 retrospectively in accordance with the transitional provisions (as amended subsequent to the issuance of FrS 112 in September 2011) in FrS 112 and amended for consolidation exceptions for ‘investment entity’ from 1 January 2014. the Group has incorporated the additional required disclosures into the financial statements.
2.2 revenue recognition
revenue for the Group represents the fair value of the consideration received or receivable from the gross inflow of economic benefits during the financial year arising from the course of ordinary activities of the Group’s business. revenue is presented net of goods and services tax, rebates and discounts, and after eliminating sales within the Group.

50
NOTES TO THE FINANCIAL STATEMENTSFor the financial year ended 31 December 2014
NOTES TO THE FINANCIAL STATEMENTS Building StrengthS Shaping the Future
2. SIGnIFICant aCCountInG poLICIeS (ContInueD)
2.2 revenue recognition (continued)
the Group recognises revenue when the amount of revenue and related cost can be reliably measured, it is probable that the collectability of the related receivables is reasonably assured and when the specific criteria for each of the Group’s activities are met as follows:
(a) Sale of goods
revenue from sale of goods is recognised when significant risks and rewards of ownership are transferred to the buyer and there is neither continuing managerial involvement to the degree usually associated with ownership nor effective control over the goods sold.
(b) Interest income
Interest income is recognised using the effective interest method.
(c) Rental income
rental income from operating leases (net of any incentives given to the lessees) is recognised on a straight-line basis over the lease term.
2.3 Group accounting
(a) Subsidiaries
(i) Consolidation
Subsidiaries are all entities (including structured entities) over which the Group has control. the Group controls an entity when the Group is exposed to, or has rights to, variable returns from its involvement with the entity and has the ability to affect those returns through its power over the entity. Subsidiaries are fully consolidated from the date on which control is transferred to the Group. they are deconsolidated from the date on that control ceases.
In preparing the consolidated financial statements, transactions, balances and unrealised gains on transactions between group entities are eliminated. Unrealised losses are also eliminated but are considered an impairment indicator of the asset transferred. accounting policies of subsidiaries have been changed where necessary to ensure consistency with the policies adopted by the Group.
non-controlling interests comprise the portion of a subsidiary’s net results of operations and its net assets, which is attributable to the interests that are not owned directly or indirectly by the equity holders of the Company. they are shown separately in the consolidated statement of comprehensive income, statement of changes in equity, and balance sheet. total comprehensive income is attributed to the non-controlling interests based on their respective interests in a subsidiary, even if this results in the non-controlling interests having a deficit balance.

51
NOTES TO THE FINANCIAL STATEMENTS
NOTES TO THE FINANCIAL STATEMENTSFor the financial year ended 31 December 2014
Mewah InternatIonal Inc. annual report 2014
2. SIGnIFICant aCCountInG poLICIeS (ContInueD)
2.3 Group accounting (continued)
(a) Subsidiaries (continued)
(ii) Acquisitions
the acquisition method of accounting is used to account for business combinations entered into by the Group, except for business combination under common control.
the consideration transferred for the acquisition of a subsidiary or business comprises the fair value of the assets transferred, the liabilities incurred and the equity interests issued by the Group. the consideration transferred also includes any contingent consideration arrangement and any pre-existing equity interest in the subsidiary measured at their fair values at the acquisition date.
If the business combination is achieved in stages, the acquisition date carrying value of the acquirer’s previously held equity interest in the acquiree is re-measured to fair value at acquisition date; any gains or losses arising from such re-measurement are recognised in profit or loss.
acquisition-related costs are expensed as incurred.
Identifiable assets acquired and liabilities and contingent liabilities assumed in a business combination are, with limited exceptions, measured initially at their fair values at the acquisition date.
on an acquisition-by-acquisition basis, the Group recognises any non-controlling interest in the acquiree at the date of acquisition either at fair value or at the non-controlling interest’s proportionate share of the acquiree’s identifiable net assets.
the excess of (i) the consideration transferred, the amount of any non-controlling interest in the acquiree and the acquisition-date fair value of any previous equity interest in the acquiree over the (ii) fair values of the identifiable net assets acquired, is recorded as goodwill. please refer to note 2.5 for the subsequent accounting policy on goodwill.
acquisitions of entities under common control have been accounted for using the pooling-of-interest method. Under this method:
• ThefinancialstatementsoftheGrouphavebeenpreparedasiftheGroupstructureimmediatelyafterthe transaction has been in existence since the earliest date the entities are under common control;
• Theassetsandliabilitiesarebroughtintothefinancialstatementsattheirexistingcarryingamountsfromthe perspective of the controlling party;
• Theincomestatementincludestheresultsoftheacquiredentitiessincetheearliestdatetheentitiesareunder common control;
• Thecomparativefiguresof theGroup represent the incomestatement, statementof comprehensiveincome, balance sheet, statement of cash flows and statement of changes in equity have been prepared as if the combination had occurred from the date when the combining entities or businesses first came under common control;
52
NOTES TO THE FINANCIAL STATEMENTSFor the financial year ended 31 December 2014
NOTES TO THE FINANCIAL STATEMENTS Building StrengthS Shaping the Future
2. SIGnIFICant aCCountInG poLICIeS (ContInueD)
2.3 Group accounting (continued)
(a) Subsidiaries (continued)
(ii) Acquisitions (continued)
• Thecostofinvestmentisrecordedattheaggregateofthenominalvalueoftheequitysharesissued,cashand cash equivalents and fair values of other consideration; and
• Onconsolidation, thedifferencebetweenthecostof investmentandthenominalvalueof thesharecapital of the merged subsidiary is taken to merger reserve. Cash paid/payable arising from the acquisition under common control is also taken to the merger reserves.
(iii) Disposals
When a change in the Group’s ownership interest in a subsidiary results in a loss of control over the subsidiary, the assets and liabilities of the subsidiary including any goodwill are derecognised. amounts previously recognised in other comprehensive income in respect of that entity are also reclassified to profit or loss or transferred directly to retained profits if required by a specific Standard.
any retained equity interest in the entity is remeasured at fair value. the difference between the carrying amount of the retained interest at the date when control is lost and its fair value is recognised in profit or loss. please refer to note 2.6 for the accounting policy on investments in subsidiaries in the separate financial statements of the Company.
(b) Transactions with non-controlling interests
Changes in the Group’s ownership interest in a subsidiary that do not result in a loss of control over the subsidiary are accounted for as transactions with equity owners of the subsidiary. any difference between the change in the carrying amounts of the non-controlling interest and the fair value of the consideration paid or received is recognised in general reserve within equity attributable to the equity holders of the subsidiary.
(c) Associated company
associated company is entity over which the Group has significant influence, but not control, generally accompanied by a shareholding giving rise to voting rights of 20% and above but not exceeding 50%. Investment in associated company is accounted for in the consolidated financial statements using the equity method of accounting less impairment losses, if any.
(i) Acquisitions
Investment in associated company is initially recognised at cost. the cost of an acquisition is measured at the fair value of the assets given, equity instruments issued or liabilities incurred or assumed at the date of exchange, plus costs directly attributable to the acquisition. Goodwill on associated company represents the excess of the cost of acquisition of the associated company over the Group’s share of the fair value of the identifiable net assets of the associated company and is included in the carrying amount of the investment.

53
NOTES TO THE FINANCIAL STATEMENTS
NOTES TO THE FINANCIAL STATEMENTSFor the financial year ended 31 December 2014
Mewah InternatIonal Inc. annual report 2014
2. SIGnIFICant aCCountInG poLICIeS (ContInueD)
2.3 Group accounting (continued)
(c) Associated company (continued)
(ii) Equity method of accounting
In applying the equity method of accounting, the Group’s share of its associated company’s post-acquisition profits or losses are recognised in profit or loss and its share of post-acquisition other comprehensive income is recognised in other comprehensive income. these post-acquisition movements and distributions received from the associated company are adjusted against the carrying amount of the investment. When the Group’s share of losses in an associated company equals to or exceeds its interest in the associated company, including any other unsecured non-current receivables, the Group does not recognise further losses, unless it has obligations to make or has made payments on behalf of the associated companies. If the associated company subsequently reports profits, the Group resumes recognising its share of those profits only after its share of the profits equals the share of losses not recognised.
Unrealised gains on transactions between the Group and its associated company are eliminated to the extent of the Group’s interest in the associated company. Unrealised losses are also eliminated unless the transaction provides evidence of impairment of the assets transferred. the accounting policies of associated company are changed where necessary to ensure consistency with the accounting policies adopted by the Group.
(iii) Disposals
Investments in associated companies are derecognised when the Group loses significant influence. If the retained equity interest in the former associated company is a financial asset, the retained equity interest is measured at fair value. the difference between the carrying amount of the retained interest at the date when significant influence is lost, and its fair value and any proceeds on partial disposal, is recognised in profit or loss.
please refer to note 2.6 for the accounting policy on investment in associated company in the separate financial statements of the Company.
2.4 property, plant and equipment
(a) Measurement
(i) Property, plant and equipment
all property, plant and equipment are initially recognised at cost and subsequently carried at cost less accumulated depreciation and accumulated impairment losses.
When an asset is revalued, any accumulated depreciation at the date of revaluation is eliminated against the gross carrying amount of the asset. the net amount is then restated to the revalued amount of the asset.
Increases in carrying amounts arising from revaluation, including currency translation differences, are recognised in other comprehensive income, unless they offset previous decreases in the carrying amounts of the same asset, in which case, they are recognised in profit or loss. Decreases in carrying amounts that offset previous increases of the same asset are recognised in other comprehensive income. all other decreases in carrying amounts are recognised in profit or loss.

54
NOTES TO THE FINANCIAL STATEMENTSFor the financial year ended 31 December 2014
NOTES TO THE FINANCIAL STATEMENTS Building StrengthS Shaping the Future
2. SIGnIFICant aCCountInG poLICIeS (ContInueD)
2.4 property, plant and equipment (continued)
(a) Measurement (continued)
(i) Property, plant and equipment (continued)
on 1 January 2007, the Group has elected to adopt FrS 101 exemption to deem the previous revaluation of certain property, plant and equipment as deemed cost (note 18(c)).
(ii) Components of costs
the cost of an item of property, plant and equipment initially recognised includes its purchase price and any cost that is directly attributable to bringing the asset to the location and condition necessary for it to be capable of operating in the manner intended by management. Cost also includes borrowing costs that are directly attributable to the acquisition, construction or production of a qualifying asset (refer to note 2.8 on borrowing costs).
(b) Depreciation
Depreciation is calculated using the straight-line method to allocate their depreciable amounts over their estimated useful lives as follows:
Leasehold land and buildings amortised over the period of leases (30 to 99 years)Freehold buildings 2%plant and equipment 2% to 5%Furniture, fixtures and office equipment 5% to 20%Motor vehicles 20%
Freehold land and capital expenditure in progress are stated at cost and not depreciated.
the residual values, estimated useful lives and depreciation method of property, plant and equipment are reviewed, and adjusted as appropriate, at each balance sheet date. the effects of any revision are recognised in profit or loss when the changes arise.
(c) Subsequent expenditure
Subsequent expenditure relating to property, plant and equipment that has already been recognised is added to the carrying amount of the asset only when it is probable that future economic benefits associated with the item will flow to the Group and the cost of the item can be measured reliably. all other repair and maintenance expenses are recognised in profit or loss when incurred.
(d) Disposal
on disposal of an item of property, plant and equipment, the difference between the disposal proceeds and its carrying amount is recognised in profit or loss within “other gains/losses”. any amount in revaluation reserve relating to that asset is transferred to retained profits directly.

55
NOTES TO THE FINANCIAL STATEMENTS
NOTES TO THE FINANCIAL STATEMENTSFor the financial year ended 31 December 2014
Mewah InternatIonal Inc. annual report 2014
2. SIGnIFICant aCCountInG poLICIeS (ContInueD)
2.5 Intangible assets
Goodwill on acquisitions
Goodwill on acquisitions of subsidiaries and businesses on or after 1 January 2010 represents the excess of (i) the sum of the consideration transferred, the amount of any non-controlling interest in the acquiree and the acquisition-date fair value of any previously-held equity interest in the acquiree over (ii) the fair value of the identifiable net assets acquired.
Goodwill on acquisitions of subsidiaries and businesses prior to 1 January 2010 and on acquisition of associated company represents the excess of the cost of the acquisition over the fair value of the Group’s share of the identifiable net assets acquired.
Goodwill on subsidiaries is recognised separately as intangible assets and carried at cost less accumulated impairment losses. Goodwill on associated company is included in the carrying amount of the investment.
Gains and losses on the disposal of subsidiaries and associated company include the carrying amount of goodwill relating to the entity sold, except for goodwill arising from acquisitions prior to 1 January 2001. Such goodwill was adjusted against retained profits in the year of acquisition and is not recognised in profit or loss on disposal.
2.6 Investments in subsidiaries and associated company
Investments in subsidiaries and associated company are carried at cost less accumulated impairment losses in the Company’s balance sheet. on disposal of such investments, the difference between disposal proceeds and the carrying amounts of the investments are recognised in profit or loss.
2.7 Impairment of non-financial assets
(a) Goodwill
Goodwill recognised separately as an intangible asset is tested for impairment annually and whenever there is indication that the goodwill may be impaired.
For the purpose of impairment testing of goodwill, goodwill is allocated to each of the Group’s cash-generating-units (“CGU”) expected to benefit from synergies arising from the business combination.
an impairment loss is recognised when the carrying amount of a CGU, including the goodwill, exceeds the recoverable amount of the CGU. the recoverable amount of a CGU is the higher of the CGU’s fair value less cost to sell and value-in-use. the total impairment loss of a CGU is allocated first to reduce the carrying amount of goodwill allocated to the CGU and then to the other assets of the CGU pro-rata on the basis of the carrying amount of each asset in the CGU.
an impairment loss on goodwill is recognised as an expense and is not reversed in a subsequent period.

56
NOTES TO THE FINANCIAL STATEMENTSFor the financial year ended 31 December 2014
NOTES TO THE FINANCIAL STATEMENTS Building StrengthS Shaping the Future
2. SIGnIFICant aCCountInG poLICIeS (ContInueD)
2.7 Impairment of non-financial assets (continued)
(b) Property, plant and equipment Investments in subsidiaries and associated company
property, plant and equipment and investments in subsidiaries and associated company are tested for impairment whenever there is any objective evidence or indication that these assets may be impaired.
For the purpose of impairment testing, the recoverable amount (i.e. the higher of the fair value less cost to sell and the value-in-use) is determined on an individual asset basis unless the asset does not generate cash inflows that are largely independent of those from other assets. If this is the case, the recoverable amount is determined for the CGU to which the asset belongs.
If the recoverable amount of the asset (or CGU) is estimated to be less than its carrying amount, the carrying amount of the asset (or CGU) is reduced to its recoverable amount.
the difference between the carrying amount and recoverable amount is recognised as an impairment loss in profit or loss, unless the asset is carried at revalued amount, in which case, such impairment loss is treated as a revaluation decrease. please refer to note 2.4 for the treatment of a revaluation decrease in property, plant and equipment.
an impairment loss for an asset other than goodwill is reversed only if, there has been a change in the estimates used to determine the asset’s recoverable amount since the last impairment loss was recognised. the carrying amount of this asset is increased to its revised recoverable amount, provided that this amount does not exceed the carrying amount that would have been determined (net of any accumulated amortisation or depreciation) had no impairment loss been recognised for the asset in prior years.
a reversal of impairment loss for an asset other than goodwill is recognised in profit or loss, unless the asset is carried at revalued amount, in which case, such reversal is treated as a revaluation increase. However, to the extent that an impairment loss on the same revalued asset was previously recognised as an expense, a reversal of that impairment is also recognised in profit or loss.
2.8 Borrowing costs
Borrowing costs are recognised in profit or loss using the effective interest method except for those costs that are directly attributable to the construction or development of properties and assets under construction. this includes those costs on borrowings acquired specifically for the construction or development of properties and assets under construction, as well as those in relation to general borrowings used to finance the construction or development of properties and assets under construction.
the actual borrowing costs incurred during the period up to the issuance of the temporary occupation permit less any investment income on temporary investment of these borrowings, are capitalised in the cost of the property under development. Borrowing costs on general borrowings are capitalised by applying a capitalisation rate to the acquisition, construction or production of qualifying assets that are financed by general borrowings.

57
NOTES TO THE FINANCIAL STATEMENTS
NOTES TO THE FINANCIAL STATEMENTSFor the financial year ended 31 December 2014
Mewah InternatIonal Inc. annual report 2014
2. SIGnIFICant aCCountInG poLICIeS (ContInueD)
2.9 Financial assets
(a) Classification
the Group classifies its financial assets in the following categories: at fair value through profit or loss, loans and receivables, held-to-maturity, and available-for-sale. the classification depends on the nature of the asset and the purpose for which the assets were acquired. Management determines the classification of its financial assets at initial recognition and in the case of assets classified as held-to-maturity, re-valuates this designation at each balance sheet date.
(i) Financial assets at fair value through profit or loss
this category has two sub-categories: financial assets held for trading, and those designated at fair value through profit or loss at inception. a financial asset is classified as held for trading if it is acquired principally for the purpose of selling in the short term. Financial assets designated as at fair value through profit or loss at inception are those that are managed and their performances are evaluated on a fair value basis, in accordance with a documented Group investment strategy. Derivatives are also categorised as held for trading unless they are designated as hedges. assets in this category are presented as current assets if they are either held for trading or are expected to be realised within 12 months after the balance sheet date.
(ii) Loans and receivables
Loans and receivables are non-derivative financial assets with fixed or determinable payments that are not quoted in an active market. they are presented as current assets, except for those expected to be realised later than 12 months after the balance sheet date which are presented as non-current assets. Loans and receivables are presented as “trade receivables” (note 14), “other receivables” (note 15) and “cash and cash equivalents” (note 17) on the balance sheet.
(iii) Held-to-maturity financial assets
Held-to-maturity financial assets, are non-derivative financial assets with fixed or determinable payments and fixed maturities that the Group’s management has the positive intention and ability to hold to maturity. If the Group were to sell other than an insignificant amount of held-to-maturity financial assets, the whole category would be tainted and reclassified as available-for-sale. they are presented as non-current assets, except for those maturing within 12 months after the balance sheet date which are presented as current assets.
(iv) Available-for-sale financial assets
available-for-sale financial assets, are non-derivatives that are either designated in this category or not classified in any of the other categories. they are presented as non-current assets unless the investment matures or management intends to dispose of the assets within 12 months after the balance sheet date.

58
NOTES TO THE FINANCIAL STATEMENTSFor the financial year ended 31 December 2014
NOTES TO THE FINANCIAL STATEMENTS Building StrengthS Shaping the Future
2. SIGnIFICant aCCountInG poLICIeS (ContInueD)
2.9 Financial assets (continued)
(b) Recognition and derecognition
regular way purchases and sales of financial assets are recognised on trade date - the date on which the Group commits to purchase or sell the asset.
Financial assets are derecognised when the rights to receive cash flows from the financial assets have expired or have been transferred and the Group has transferred substantially all risks and rewards of ownership. on disposal of a financial asset, the difference between the carrying amount and the sale proceeds is recognised in profit or loss. any amount previously recognised in other comprehensive income relating to that asset is reclassified to profit or loss.
(c) Initial measurement
Financial assets are initially recognised at fair value plus transaction costs except for financial assets at fair value through profit or loss, which are recognised at fair value. transaction costs for financial assets at fair value through profit or loss are recognised immediately as expenses.
(d) Subsequent measurement
available-for-sale financial assets and financial assets at fair value through profit or loss are subsequently carried at fair value. Loans and receivables and held-to-maturity financial assets are subsequently carried at amortised cost using the effective interest method.
Changes in the fair values of financial assets at fair value through profit or loss including the effects of currency translation, interest and dividends, are recognised in profit or loss when the changes arise.
Interest and dividend income on available-for-sale financial assets are recognised separately in profit or loss. Changes in the fair values of available-for-sale debt securities (i.e. monetary items) denominated in foreign currencies are analysed into currency translation differences on the amortised cost of the securities and other changes; the currency translation differences are recognised in profit or loss and the other changes are recognised in other comprehensive income and accumulated in the fair value reserve. Changes in fair values of available-for-sale equity securities (i.e. non-monetary items) are recognised in other comprehensive income and accumulated in the fair value reserve, together with the related currency translation differences.
(e) Impairment
the Group assesses at each balance sheet date whether there is objective evidence that a financial asset or a group of financial assets is impaired and recognises an allowance for impairment when such evidence exists.
(i) Loans and receivables/held-to-maturity financial assets
Significant financial difficulties of the debtor, probability that the debtor will enter bankruptcy, and default or significant delay in payments are objective evidence that these financial assets are impaired.
59
NOTES TO THE FINANCIAL STATEMENTS
NOTES TO THE FINANCIAL STATEMENTSFor the financial year ended 31 December 2014
Mewah InternatIonal Inc. annual report 2014
2. SIGnIFICant aCCountInG poLICIeS (ContInueD)
2.9 Financial assets (continued)
(e) Impairment (continued)
(i) Loans and receivables/held-to-maturity financial assets (continued)
the carrying amount of these assets is reduced through the use of an impairment allowance account which is calculated as the difference between the carrying amount and the present value of estimated future cash flows, discounted at the original effective interest rate. When the asset becomes uncollectible, it is written off against the allowance account. Subsequent recoveries of amounts previously written off are recognised against the same line item in profit or loss.
the impairment allowance is reduced through profit or loss in a subsequent period when the amount of impairment loss decreases and the related decrease can be objectively measured. the carrying amount of the asset previously impaired is increased to the extent that the new carrying amount does not exceed the amortised cost had no impairment been recognised in prior periods.
(ii) Available-for-sale financial assets
In addition to the objective evidence of impairment described in note 2.9(e)(i), a significant or prolonged decline in the fair value of an equity security below its cost is considered as an indicator that the available-for-sale financial asset is impaired.
If any evidence of impairment exists, the cumulative loss that was previously recognised in other comprehensive income is reclassified to profit or loss. the cumulative loss is measured as the difference between the acquisition cost (net of any principal repayments and amortisation) and the current fair value, less any impairment loss previously recognised as an expense. the impairment losses recognised as an expense on equity securities are not reversed through profit or loss.
(f) Offsetting financial instruments
Financial assets and liabilities are offset and the net amount reported in the balance sheet when there is a legally enforceable right to offset and there is an intention to settle on a net basis or realise the asset and settle the liability simultaneously.
2.10 Financial guarantees
the Company has issued corporate guarantees to banks for borrowings of its subsidiaries. these guarantees are financial guarantees as they require the Company to reimburse the banks if the subsidiaries fail to make principal or interest payments when due in accordance with the terms of their borrowings.
Financial guarantees are initially recognised at their fair values plus transaction costs in the Company’s balance sheet.
Financial guarantees are subsequently amortised to profit or loss over the period of the subsidiaries’ borrowings, unless it is probable that the Company will reimburse the banks for an amount higher than the unamortised amount. In this case, the financial guarantees shall be carried at the expected amount payable to the banks in the Company’s balance sheet.
Intra-group transactions are eliminated on consolidation.

60
NOTES TO THE FINANCIAL STATEMENTSFor the financial year ended 31 December 2014
NOTES TO THE FINANCIAL STATEMENTS Building StrengthS Shaping the Future
2. SIGnIFICant aCCountInG poLICIeS (ContInueD)
2.11 Borrowings
Borrowings are presented as current liabilities unless the Group has an unconditional right to defer settlement for at least 12 months after the balance sheet date, in which case they are presented as non-current liabilities.
Borrowings are initially recognised at fair value (net of transaction costs) and subsequently carried at amortised cost. any difference between the proceeds (net of transaction costs) and the redemption value is recognised in profit or loss over the period of the borrowings using the effective interest method.
2.12 trade and other payables
trade and other payables represent liabilities for goods and services provided to the Group prior to the end of financial year which are unpaid. they are classified as current liabilities if payment is due within one year or less (or in the normal operating cycle of the business if longer). If not, they are presented as non-current liabilities.
trade and other payables are initially recognised at fair value, and subsequently carried at amortised cost using the effective interest method.
2.13 Derivative financial instruments
Derivative financial instruments comprise mainly of crude palm oil and palm oil products forward contracts, futures contracts and currency forward contracts.
a derivative financial instrument is initially recognised at its fair value on the date the contract is entered into and is subsequently carried at its fair value. Fair value changes on derivatives that are not designated or do not qualify for hedge accounting are recognised in profit or loss within “cost of sales” when the changes arise.
Derivative financial instruments are reported in the financial statements on a net basis where legal right of setoff exists. Derivative financial instruments are carried as assets when fair value is positive and as liabilities when fair value is negative.
2.14 Fair value estimation of financial assets and liabilities
the fair values of financial instruments traded in active markets (such as exchange-traded and over-the-counter securities and derivatives) are based on quoted market prices at the balance sheet. the quoted market prices used for financial assets are the current bid prices; the appropriate quoted market prices for financial liabilities are the current asking prices.
the Group’s commodities futures contracts are traded in active markets and their fair values reflect quoted prices at the balance sheet date in active markets such as Bursa Malaysia.
the Group’s commodities forward contracts are not traded in an active market and hence their fair values are estimated using a valuation technique as described in note 31 (e).
the fair values of currency forward contracts are determined using actively quoted forward exchange rates.
the fair values of current financial assets and liabilities carried at amortised cost approximate their carrying amounts.

61
NOTES TO THE FINANCIAL STATEMENTS
NOTES TO THE FINANCIAL STATEMENTSFor the financial year ended 31 December 2014
Mewah InternatIonal Inc. annual report 2014
2. SIGnIFICant aCCountInG poLICIeS (ContInueD)
2.15 Leases
(a) When the Group is the lessee:
(i) Lessee - Finance leases
Leases where the Group assumes substantially all risks and rewards incidental to ownership of the leased assets are classified as finance leases.
the leased assets and the corresponding lease liabilities (net of finance charges) under finance leases are recognised on the balance sheet as property, plant and equipment and borrowings respectively, at the inception of the leases based on the lower of the fair value of the leased assets and the present value of the minimum lease payments.
each lease payment is apportioned between the finance expense and the reduction of the outstanding lease liability. the finance expense is recognised in profit or loss on a basis that reflects a constant periodic rate of interest on the finance lease liability.
(ii) Lessee - Operating leases
Leases where substantially all risks and rewards incidental to ownership are retained by the lessors are classified as operating leases. payments made under operating leases (net of any incentives received from the lessors) are recognised in profit or loss on a straight-line basis over the period of the lease. Initial direct costs incurred by the Group in negotiating and arranging operating leases are capitalised as prepayments and recognised in profit or loss over the lease term on a straight-line basis.
Contingent rents are recognised as an expense in profit or loss when incurred.
(b) When the Group is the lessor:
Lessor - Operating leases
Leases where the Group retains substantially all risks and rewards incidental to ownership are classified as operating leases. rental income from operating leases (net of any incentives given to the lessees) is recognised in profit or loss on a straight-line basis over the lease term.
Initial direct costs incurred by the Group in negotiating and arranging operating leases are added to the carrying amount of the leased assets and recognised as an expense in profit or loss over the lease term on the same basis as the lease income.
Contingent rents are recognised as income in profit or loss when earned.
2.16 Inventories
Inventories are carried at the lower of cost and net realisable value. Cost is determined on weighted average basis. the cost of finished goods and work-in-progress comprises raw materials, direct labour, other direct costs and related production overheads (based on normal operating capacity) but excludes borrowing costs. Stores, spares and consumables are stated at cost and are determined on a weighted average basis. net realisable value is the estimated selling price in the ordinary course of business, less the estimated costs of completion and applicable variable selling expenses.
62
NOTES TO THE FINANCIAL STATEMENTSFor the financial year ended 31 December 2014
NOTES TO THE FINANCIAL STATEMENTS Building StrengthS Shaping the Future
2. SIGnIFICant aCCountInG poLICIeS (ContInueD)
2.17 Income taxes
Current income tax for current and prior periods is recognised at the amount expected to be paid to or recovered from the tax authorities, using the tax rates and tax laws that have been enacted or substantively enacted by the balance sheet date.
Deferred income tax is recognised for all temporary differences arising between the tax bases of assets and liabilities and their carrying amounts in the financial statements except when the deferred income tax arises from the initial recognition of goodwill or an asset or liability in a transaction that is not a business combination and affects neither accounting nor taxable profit or loss at the time of the transaction.
a deferred income tax liability is recognised on temporary differences arising on investments in subsidiaries and associated companies, except where the Group is able to control the timing of the reversal of the temporary difference and it is probable that the temporary difference will not reverse in the foreseeable future.
a deferred income tax asset is recognised to the extent that it is probable that future taxable profit will be available against which the deductible temporary differences and tax losses can be utilised.
Deferred income tax is measured:
(i) at the tax rates that are expected to apply when the related deferred income tax asset is realised or the deferred income tax liability is settled, based on tax rates and tax laws that have been enacted or substantively enacted by the balance sheet date; and
(ii) based on the tax consequence that will follow from the manner in which the Group expects, at the balance sheet date, to recover or settle the carrying amounts of its assets and liabilities.
Current and deferred income taxes are recognised as income or expense in profit or loss, except to the extent that the tax arises from a business combination or a transaction which is recognised directly in equity. Deferred tax arising from a business combination is adjusted against goodwill on acquisition.
2.18 provisions
provisions for restructuring costs and legal claims are recognised when the Group has a present legal or constructive obligation as a result of past events, it is more likely than not that an outflow of resources will be required to settle the obligation and the amount has been reliably estimated. restructuring provisions comprise lease termination penalties and employee termination payments. provisions are not recognised for future operating losses.
other provisions are measured at the present value of the expenditure expected to be required to settle the obligation using a pre-tax discount rate that reflects the current market assessment of the time value of money and the risks specific to the obligation. the increase in the provision due to the passage of time is recognised in the profit or loss as finance costs.
Changes in the estimated timing or amount of the expenditure or discount rate are recognised in profit or loss when the changes arise.
63
NOTES TO THE FINANCIAL STATEMENTS
NOTES TO THE FINANCIAL STATEMENTSFor the financial year ended 31 December 2014
Mewah InternatIonal Inc. annual report 2014
2. SIGnIFICant aCCountInG poLICIeS (ContInueD)
2.19 employee compensation
employee benefits are recognised as an expense, unless the cost qualifies to be capitalised as an asset.
(a) Defined contribution plans
Defined contribution plans are post-employment benefit plans under which the Group pays fixed contributions into separate entities such as the Central provident Fund on a mandatory, contractual or voluntary basis. the Group has no further payment obligations once the contributions have been paid.
(b) Employee leave entitlement
employee entitlements to annual leave are recognised when they accrue to employees. accrual is made for the estimated liability for annual leave as a result of services rendered by employees up to the balance sheet date.
2.20 Currency translation
(a) Functional and presentation currency
Items included in the financial statements of each entity in the Group are measured using the currency of the primary economic environment in which the entity operates (“functional currency”). the financial statements are presented in United States Dollar (“presentation currency”), which is also the functional currency of the Company.
(b) Transactions and balances
transactions in a currency other than the functional currency (“foreign currency”) are translated into the functional currency using the exchange rates at the dates of the transactions. Currency exchange differences resulting from the settlement of such transactions and from the translation of monetary assets and liabilities denominated in foreign currencies at the closing rates at the balance sheet date are recognised in profit or loss.
non-monetary items measured at fair values in foreign currencies are translated using the exchange rates at the date when the fair values are determined.
(c) Translation of Group entities’ financial statements
the results and financial position of all the Group entities (none of which has the currency of a hyperinflationary economy) that have a functional currency different from the presentation currency are translated into the presentation currency as follows:
(i) assets and liabilities are translated at the closing exchange rates at the reporting date;
(ii) income and expenses are translated at average exchange rates (unless the average is not a reasonable approximation of the cumulative effect of the rates prevailing on the transaction dates, in which case income and expenses are translated using the exchange rates at the dates of the transactions); and
64
NOTES TO THE FINANCIAL STATEMENTSFor the financial year ended 31 December 2014
NOTES TO THE FINANCIAL STATEMENTS Building StrengthS Shaping the Future
2. SIGnIFICant aCCountInG poLICIeS (ContInueD)
2.20 Currency translation (continued)
(c) Translation of Group entities’ financial statements (continued)
(iii) all resulting currency translation differences are recognised in other comprehensive income and accumulated in the currency translation reserve. these currency translation differences are reclassified to profit or loss on disposal or partial disposal of the entity giving rise to such reserve.
Goodwill and fair value adjustments arising on the acquisition of foreign operations are treated as assets and liabilities of the foreign operations and translated at the closing rates at the reporting date.
2.21 Segment reporting
operating segments are reported in a manner consistent with the internal reporting provided to the executive committee whose members are responsible for allocating resources and assessing performance of the operating segments.
2.22 Cash and cash equivalents
For the purpose of presentation in the consolidated statement of cash flows, cash and cash equivalents include cash on hand, deposits with financial institutions which are subject to an insignificant risk of change in value, and bank overdrafts. Bank overdrafts are presented as current borrowings on the balance sheet.
2.23 Share capital
ordinary shares are classified as equity. Incremental costs directly attributable to the issuance of new ordinary shares are deducted against the share premium account.
When any entity within the Group purchases the Company’s ordinary shares (“treasury shares”), the carrying amount which includes the consideration paid and any directly attributable transaction cost is presented as a component within equity attributable to the Company’s equity holders, until they are cancelled, sold or reissued.
When treasury shares are subsequently cancelled, the cost of treasury shares are deducted against the share capital account if the shares are purchased out of capital of the Company, or against the retained profits of the Company if the shares are purchased out of earnings of the Company.
2.24 Dividends to Company’s shareholders
Dividends to the Company’s shareholders are recognised when dividends are approved for payment.

65
NOTES TO THE FINANCIAL STATEMENTS
NOTES TO THE FINANCIAL STATEMENTSFor the financial year ended 31 December 2014
Mewah InternatIonal Inc. annual report 2014
3. CrItICaL aCCountInG eStIMateS, aSSuMptIonS anD juDGeMentS
estimates, assumptions and judgements are continually evaluated and are based on historical experience and other factors, including expectations of future events that are believed to be reasonable under the circumstances.
(a) Fair value of derivative financial instruments
the Group is exposed to fluctuations in the prices of agri-commodities it deals in, including crude palm oil and palm oil products. the Group minimises the risk arising from such fluctuations by entering into commodities forward contracts and futures contracts. as the Group has not adopted hedge accounting, the fair value changes on these derivative financial instruments are recognised in the profit or loss when the changes arise.
the Group’s commodities futures contracts are traded in active markets and their fair values reflect quoted prices at the balance sheet date in active markets such as Bursa Malaysia.
the Group’s commodities forward contracts are not traded in an active market and hence their fair values are estimated using a valuation technique as described in note 31 (e).
If the commodities prices had been higher or lower by 5% from management’s estimates and other variables remain constant, the Group’s profit after tax would have been lower or higher by US$4,895,000 respectively, arising from the changes in the fair value of the commodities forward contracts and futures contracts.
(b) Impairment of loans and receivables
Management reviews its loans and receivables for objective evidence of impairment on a regular basis. Significant financial difficulties of the debtor, the probability that the debtor will enter bankruptcy, and default or significant delay in payments are considered objective evidence that a receivable is impaired. In determining this, management has made judgement as to whether there is observable data indicating that there has been a significant change in the payment ability of the debtor, or whether there have been significant changes with adverse effect in the technological, market, economic or legal environment in which the debtor operates in.
Where there is objective evidence of impairment, management has made judgements as to whether an impairment loss should be recorded as an expense. In determining this, management has used estimates based on historical loss experience for assets with similar credit risk characteristics. the methodology and assumptions used for estimating both the amount and timing of future cash flows are reviewed regularly to reduce any differences between the estimated loss and actual loss experienced.
If the net present values of estimated cash flows had been higher or lower by 5% from management’s estimates for all past due loans and receivables, the Group’s allowance for impairment would have been lower or higher by US$937,800 correspondingly to profit or loss.
(c) Uncertain tax positions
the Group is subject to income taxes in numerous jurisdictions. In determining the income tax liabilities, management has estimated the amount of capital allowances, incentives and the deductibility of certain expenses (“uncertain tax positions”) at each tax jurisdiction. Where the final outcome of these matters is different from the amounts that were initially recorded, such as due to changes in tax rules or revised interpretations of existing tax laws and precedent such differences will impact the income tax provisions in the corresponding periods.

66
NOTES TO THE FINANCIAL STATEMENTSFor the financial year ended 31 December 2014
NOTES TO THE FINANCIAL STATEMENTS Building StrengthS Shaping the Future
3. CrItICaL aCCountInG eStIMateS, aSSuMptIonS anD juDGeMentS (ContInueD)
(d) Useful lives of plant and equipment
the cost of plant and equipment are depreciated on a straight-line basis over their useful lives, which management estimates to be of 20 to 25 years.
these estimates could change significantly as a result of technical innovations.
If the actual useful lives of these plant and equipment had been higher or lower by 5% from management estimates, the carrying amount of the plant and equipment would have been higher or lower by US$567,000 and US$627,000 correspondingly to profit or loss.
During the financial year ended 31 December 2014, the Group revised its estimates for the useful lives of certain assets within plant and machinery after conducting an operational review of their useful lives. as a result, there was a change in the expected useful lives of these assets to better reflect the economic benefits expected from their usage. the effect of this change in accounting estimates was a decrease of US$2,326,000 depreciation expense in current year and US$11,421,000 for next five years.
4. revenue
Group
2014 2013
uS$’000 US$’000
Sale of palm based products in bulk 2,348,721 2,240,542
Sale of consumer products including edible oils and fats, rice and dairy in consumer packs 1,090,098 953,191
3,438,819 3,193,733
5. CoSt oF SaLeS
Group
2014 2013
uS$’000 US$’000
Cost of inventories 3,124,120 2,924,114
Losses/(Gains) from derivative financial instruments 42,086 (7,513)
Labour costs and other overheads 40,033 35,754
3,206,239 2,952,355

67
NOTES TO THE FINANCIAL STATEMENTS
NOTES TO THE FINANCIAL STATEMENTSFor the financial year ended 31 December 2014
Mewah InternatIonal Inc. annual report 2014
6. other InCoMe
Group
2014 2013
uS$’000 US$’000
Interest income on bank deposits 719 591
Late interest charge on trade receivables 3,214 3,676
rental income 533 328
Commission income 4 -
other miscellaneous income 1,091 1,059
5,561 5,654
other miscellaneous income comprised mainly sales of by-products and waste.
7. other LoSSeS
Group
2014 2013
uS$’000 US$’000
Foreign exchange losses 20,952 11,907
property, plant and equipment written off 28 151
Gain on disposal of property, plant and equipment - net (142) (368)
Loss on liquidation of subsidiaries 92 -
20,930 11,690
8. FInanCe expenSeS
Group
2014 2013
uS$’000 US$’000
Interest expenses:
- Bank borrowings 12,294 13,360
- Finance lease liabilities 5 17
12,299 13,377
In 2014, borrowing costs of US$1,015,000 (2013: US$656,000) were capitalised at a rate of 5.23% (2013: 5.29%) per annum in property, plant and equipment.

68
NOTES TO THE FINANCIAL STATEMENTSFor the financial year ended 31 December 2014
NOTES TO THE FINANCIAL STATEMENTS Building StrengthS Shaping the Future
9. eMpLoYee CoMpenSatIon
Group
2014 2013
uS$’000 US$’000
Salaries 47,454 43,065
employer’s contributions to defined contribution plans 3,520 3,019
other staff benefits 1,372 1,347
52,346 47,431
10. proFIt BeFore tax
the following items were included in arriving at profit before tax:
Group
2014 2013
uS$’000 US$’000
Freight charges 89,501 81,834
transportation 14,240 12,900
Insurance 5,232 4,868
Utilities 12,427 9,853
rental on operating lease 1,311 1,132
employee compensation (note 9) 52,346 47,431
Depreciation of property, plant and equipment (note 18) 17,512 18,212
Bank charges 2,254 4,954
(reversal of)/allowance for impairment of trade receivables (note 31(b)(ii)) (2,158) 9,032
amortisation of leasehold prepayments (note 19) 1,305 1,270
Impairment losses on property, plant and equipment - 330
audit fees
- auditors of the Company 335 329
- other auditors* 164 186
non-audit fees
- auditors of the Company 45 32
- other auditors* 185 93
* Included the network of member firms of pricewaterhouseCoopers International Limited (pWCIL).
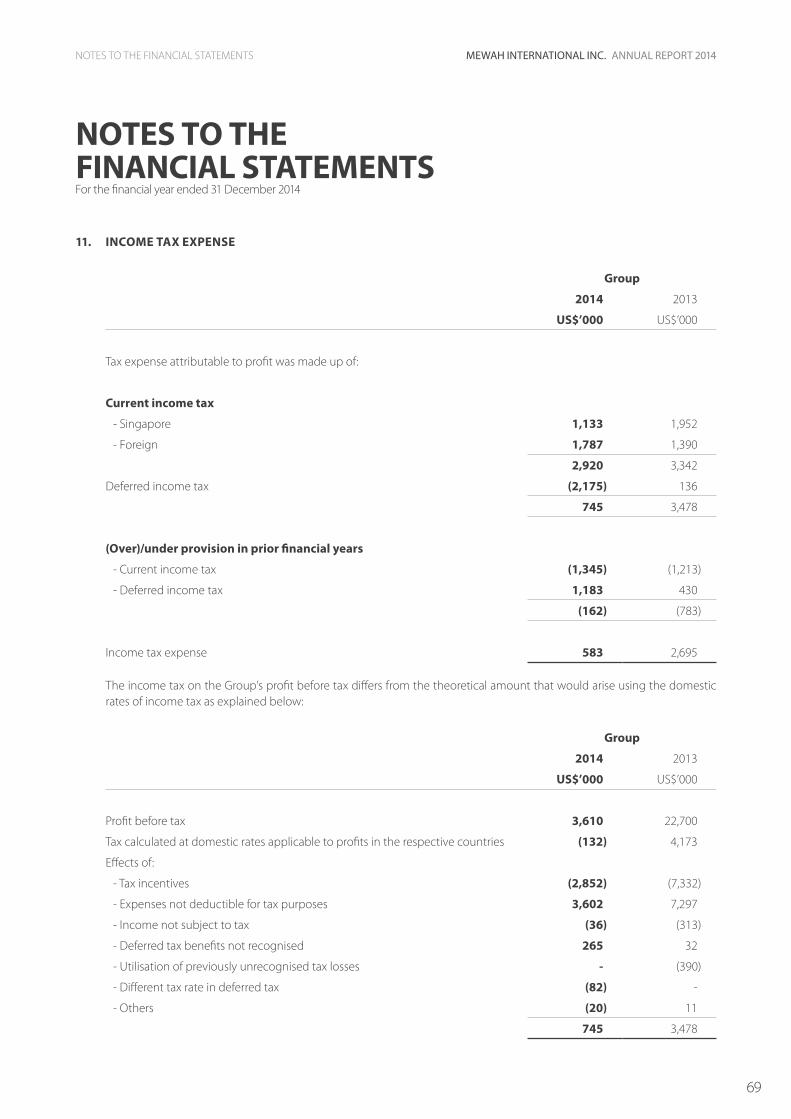
69
NOTES TO THE FINANCIAL STATEMENTS
NOTES TO THE FINANCIAL STATEMENTSFor the financial year ended 31 December 2014
Mewah InternatIonal Inc. annual report 2014
11. InCoMe tax expenSe
Group
2014 2013
uS$’000 US$’000
tax expense attributable to profit was made up of:
Current income tax
- Singapore 1,133 1,952
- Foreign 1,787 1,390
2,920 3,342
Deferred income tax (2,175) 136
745 3,478
(over)/under provision in prior financial years
- Current income tax (1,345) (1,213)
- Deferred income tax 1,183 430
(162) (783)
Income tax expense 583 2,695
the income tax on the Group’s profit before tax differs from the theoretical amount that would arise using the domestic rates of income tax as explained below:
Group
2014 2013
uS$’000 US$’000
profit before tax 3,610 22,700
tax calculated at domestic rates applicable to profits in the respective countries (132) 4,173
effects of:
- tax incentives (2,852) (7,332)
- expenses not deductible for tax purposes 3,602 7,297
- Income not subject to tax (36) (313)
- Deferred tax benefits not recognised 265 32
- Utilisation of previously unrecognised tax losses - (390)
- Different tax rate in deferred tax (82) -
- others (20) 11
745 3,478

70
NOTES TO THE FINANCIAL STATEMENTSFor the financial year ended 31 December 2014
NOTES TO THE FINANCIAL STATEMENTS Building StrengthS Shaping the Future
11. InCoMe tax expenSe (ContInueD)
Singapore and Malaysia, two of group’s main tax jurisdictions, had headline corporate tax rates of 17% and 25% respectively. the Group enjoys certain tax incentives such as concessionary tax rate on qualifying income under the Global trader programme of International enterprise Singapore and tax incentives under various schemes for qualifying capital investments in Malaysia.
12. earnInGS per Share
Basic earnings per share is calculated by dividing the net profit attributable to equity holders of the Company by the weighted average number of ordinary shares outstanding during the financial year.
Group
2014 2013
uS$’000 US$’000
net profit attributable to equity holders of the Company (US$’000) 2,695 20,931
Weighted average number of ordinary shares outstanding for basic earnings per share (’000) 1,505,741 1,507,061
Basic earnings per share (US cents per share) 0.18 1.39
(i) the earnings per share for the financial years ended 31 December 2014 was computed based on weighted average number of shares adjusted to take into account the share purchased and cancelled of 6,394,000 ordinary shares.
Diluted earnings per share was the same as the basic earnings per share for the financial years ended 31 December 2014 and 2013 as there were no potential dilutive ordinary shares outstanding.
13. InventorIeS
Group
2014 2013
uS$’000 US$’000
raw materials 96,790 89,679
Finished goods 190,602 150,574
Stores, spares and consumables 6,976 7,233
294,368 247,486
the cost of inventories recognised as an expense and included in “cost of sales” amounts to US$3,124,120,000 (2013: US$2,924,114,000).

71
NOTES TO THE FINANCIAL STATEMENTS
NOTES TO THE FINANCIAL STATEMENTSFor the financial year ended 31 December 2014
Mewah InternatIonal Inc. annual report 2014
14. traDe reCeIvaBLeS
Group
2014 2013
uS$’000 US$’000
trade receivables
- related parties 38,071 21,014
- non-related parties 270,972 293,025
309,043 314,039
Less: allowance for impairment of trade receivables
- non-related parties (note 31 b(ii)) (18,756) (21,337)
trade receivables – net 290,287 292,702
related parties are companies in which the directors/shareholders of the Company have significant influence or control.
15. other reCeIvaBLeS
Group Company
2014 2013 2014 2013
uS$’000 US$’000 uS$’000 US$’000
non-trade receivables 13,920 15,906 190,635 195,646
Deposits 4,387 5,036 - -
prepayments 9,772 6,743 8 24
Dividends receivable - - 15,000 -
28,079 27,685 205,643 195,670
Group
as at 31 December 2014, other receivables included US$5,150,000 (2013: US$3,885,000) paid to Bursa Malaysia Derivatives Clearing Bhd for commodity trading margin and advance payments of US$6,465,000 (2013: US$5,289,000) for the purchase of raw materials, US$4,171,000 (2013: US$4,230,000) subsidy receivable from Malaysian palm oil Board, and US$109,000 (2013: US$7,119,000) advance payments towards capital expenditure.
as at 31 December 2014, there was a loan of US$30,000 (2013: US$51,000) to a director of a subsidiary. the loan was interest free, unsecured and repayable on demand.
Company
non-trade receivables included US$187,664,000 (2013: US$195,646,000) short term loans to subsidiaries at interest rates of 1.3% to 5.3% (2013: 1.3% to 4.0%) per annum.
Dividends receivable related to dividends declared and unpaid by subsidiaries.

72
NOTES TO THE FINANCIAL STATEMENTSFor the financial year ended 31 December 2014
NOTES TO THE FINANCIAL STATEMENTS Building StrengthS Shaping the Future
16. DerIvatIve FInanCIaL InStruMentS
(a) Current portion
Contractnotional amount
GroupFair values
asset Liability
US$’000 US$’000 US$’000
2014
Currency forward contracts (note 31(e)) 742,109 4,102 (22,956)
Commodities forward contracts (note 31(e)) 988,698 38,285 (14,456)
Futures contracts on commodity exchange (note 31(e)) 337,741 6,438 (5,344)
total 48,825 (42,756)
2013
Currency forward contracts (note 31(e)) 569,406 5,735 (5,716)
Commodities forward contracts (note 31(e)) 937,181 17,535 (9,719)
Futures contracts on commodity exchange (note 31(e)) 625,806 8,007 (6,024)
total 31,277 (21,459)
(b) Non-current portion
Contractnotional amount
GroupFair values
asset Liability
US$’000 US$’000 US$’000
2014
Commodities forward contracts (note 31(e)) 10,449 490 -
Futures contracts on commodity exchange (note 31(e)) 28,195 178 -
total 668 -
2013
Futures contracts on commodity exchange (note 31(e)) 200,983 550 -
(i) Currency forward contracts are entered into by the Group in currencies other than their respective functional currencies to manage exposure to fluctuations in foreign currency exchange rates on their transactions.

73
NOTES TO THE FINANCIAL STATEMENTS
NOTES TO THE FINANCIAL STATEMENTSFor the financial year ended 31 December 2014
Mewah InternatIonal Inc. annual report 2014
16. DerIvatIve FInanCIaL InStruMentS (ContInueD)
(ii) the Group enters into commodities forward contracts and futures contracts to protect the Group from movements in market prices of crude palm oil and palm oil products by establishing the price at which the products will be sold or purchased.
17. CaSh anD CaSh equIvaLentS
Group Company
2014 2013 2014 2013
uS$’000 US$’000 uS$’000 US$’000
Cash at bank and on hand 41,721 36,251 56 75
Short-term bank deposits 19,104 26,894 - -
60,825 63,145 56 75
For the purposes of presenting the consolidated statement of cash flows, cash and cash equivalents comprise the following:
Group
2014 2013
uS$’000 US$’000
Cash and bank balances (as above) 60,825 63,145
Less: Bank overdrafts (note 23) (267) (302)
Less: restricted short-term bank deposits (2,206) (2,867)
Cash and cash equivalents per consolidated statement of cash flows 58,352 59,976
restricted short-term bank deposits were amounts placed with financial institution as security for banking facilities.

74
NOTES TO THE FINANCIAL STATEMENTSFor the financial year ended 31 December 2014
NOTES TO THE FINANCIAL STATEMENTS Building StrengthS Shaping the Future
18. propertY, pLant anD equIpMent
Freehold landand
buildings
Leaseholdland andbuildings
plant andequipment
Furniture,fixtures
and officeequipment
Motorvehicles
Capitalexpenditurein progress total
US$’000 US$’000 US$’000 US$’000 US$’000 US$’000 US$’000
Group
2014
Cost
Beginning of financial year 24,603 92,801 278,956 19,985 7,221 53,740 477,306
Currency translation differences (1,573) (5,347) (19,634) (612) (174) (886) (28,226)
additions 991 3,910 11,900 1,195 1,522 18,530 38,048
Disposals - (3) (804) (148) (645) - (1,600)
Write off - - (149) (5) - - (154)
reclassification 135 1,220 40,562 11 (15) (41,913) -
end of financial year 24,156 92,581 310,831 20,426 7,909 29,471 485,374
Accumulated depreciation
Beginning of financial year 226 13,823 99,263 11,999 4,498 - 129,809
Currency translation differences (51) (736) (6,268) (400) (109) - (7,564)
Depreciation charge 521 1,923 11,914 1,987 1,167 - 17,512
Disposals - - (757) (146) (607) - (1,510)
Write off - - (122) (4) - - (126)
reclassification - (278) 278 - - - -
end of financial year 696 14,732 104,308 13,436 4,949 - 138,121
Accumulated impairment losses
Beginning and end of financial year - - 17 247 66 - 330
Net book value
end of financial year 23,460 77,849 206,506 6,743 2,894 29,471 346,923

75
NOTES TO THE FINANCIAL STATEMENTS
NOTES TO THE FINANCIAL STATEMENTSFor the financial year ended 31 December 2014
Mewah InternatIonal Inc. annual report 2014
18. propertY, pLant anD equIpMent (ContInueD)
Freehold landand
buildings
Leaseholdland andbuildings
plant andequipment
Furniture,fixtures
and officeequipment
Motorvehicles
Capitalexpenditurein progress total
US$’000 US$’000 US$’000 US$’000 US$’000 US$’000 US$’000
Group
2013
Cost
Beginning of financial year 2,405 99,406 279,784 16,888 7,529 54,314 460,326
Currency translation differences (1,368) (6,703) (21,097) (697) (215) (4,027) (34,107)
additions 192 (99) 2,502 1,637 927 47,920 53,079
Disposals - - (58) (394) (1,020) - (1,472)
Write off - - (206) (281) - (33) (520)
reclassification 23,374 197 18,031 2,832 - (44,434) -
end of financial year 24,603 92,801 278,956 19,985 7,221 53,740 477,306
Accumulated depreciation
Beginning of financial year 109 12,819 93,123 11,247 4,367 - 121,665
Currency translation differences (21) (813) (6,978) (455) (128) - (8,395)
Depreciation charge 138 1,817 13,246 1,849 1,162 - 18,212
Disposals - - (39) (362) (903) - (1,304)
Write off - - (89) (280) - - (369)
end of financial year 226 13,823 99,263 11,999 4,498 - 129,809
Accumulated impairment losses
Impairment losses - - 17 247 66 - 330
end of financial year - - 17 247 66 - 330
Net book value
end of financial year 24,377 78,978 179,676 7,739 2,657 53,740 347,167

76
NOTES TO THE FINANCIAL STATEMENTSFor the financial year ended 31 December 2014
NOTES TO THE FINANCIAL STATEMENTS Building StrengthS Shaping the Future
18. propertY, pLant anD equIpMent (ContInueD)
(a) the carrying amount of motor vehicles held under finance leases was US$30,000 (2013: US$62,000) at the balance sheet date.
(b) Bank borrowings were secured on property, plant and equipment of the Group with carrying amounts of US$219,730,000 (2013: US$161,157,000).
(c) the previous revalued property, plant and equipment deemed at cost were as follows:
Group
2014 2013
uS$’000 US$’000
Leasehold land and building 10,163 10,391
plant and machinery 17,129 18,365
Furniture, fixture and office equipment 100 203
27,392 28,959
19. LeaSehoLD prepaYMentS
Group
2014 2013
uS$’000 US$’000
Cost
Beginning of financial year 20,716 18,767
addition 17,627 1,949
end of financial year 38,343 20,716
Accumulated amortisation
Beginning of financial year (2,257) (987)
amortisation (1,305) (1,270)
end of financial year (3,562) (2,257)
Net book value
end of financial year 34,781 18,459
Leasehold prepayments represented land use rights paid for industrial lands with leasehold period ranging from 16 to 50 years.

77
NOTES TO THE FINANCIAL STATEMENTS
NOTES TO THE FINANCIAL STATEMENTSFor the financial year ended 31 December 2014
Mewah InternatIonal Inc. annual report 2014
20. InveStMentS In aSSoCIateD CoMpanY anD SuBSIDIarIeS
(a) Investment in associated company
Group
2014 2013
uS$’000 US$’000
Equity investment at cost
Beginning of financial year 323 271
Share of profits 80 74
Currency translation differences (24) (22)
end of financial year 379 323
the summarised financial information of the associated company, not adjusted for the proportion ownership interest held by the Group, was as follows:
Group
2014 2013
uS$’000 US$’000
assets 1,414 1,136
Liabilities 642 477
Carrying value of associated company 772 659
Carrying value of group’s interest in associated company 379 323
revenue 4,067 3,189
net profit and total comprehensive income 163 152
Share of profit of associated company 80 74
Details of the associated company were included in note 37. the associated company was not material to the group in the opinion of the management.

78
NOTES TO THE FINANCIAL STATEMENTSFor the financial year ended 31 December 2014
NOTES TO THE FINANCIAL STATEMENTS Building StrengthS Shaping the Future
20. InveStMentS In aSSoCIateD CoMpanY anD SuBSIDIarIeS (ContInueD)
(b) Investments in subsidiaries
Company
2014 2013
uS$’000 US$’000
Equity investments at cost
Beginning of financial year 820 820
addition 29 -
end of financial year 849 820
Details of the subsidiaries were included in note 37.
addition represented restructuring of ngo Chew Hong Investment pte Ltd from an indirect subsidiary to a direct subsidiary.
21. traDe paYaBLeS
Group
2014 2013
uS$’000 US$’000
trade payables 1,349 1,954
- related parties 145,658 139,088
- non-related parties 147,007 141,042

79
NOTES TO THE FINANCIAL STATEMENTS
NOTES TO THE FINANCIAL STATEMENTSFor the financial year ended 31 December 2014
Mewah InternatIonal Inc. annual report 2014
22. other paYaBLeS
Group Company
2014 2013 2014 2013
uS$’000 US$’000 uS$’000 US$’000
non-trade payables
- related parties 24 18 - -
- associated company 73 8 - -
- non-related parties 19,148 17,627 - -
19,245 17,653 - -
accrual for operating expenses 23,773 21,936 142 148
43,018 39,589 142 148
Group
amounts due to associated company and related parties related mainly to forwarding services and rental of premises.
23. BorroWInGS
Group
2014 2013
uS$’000 US$’000
Current
Bank overdrafts (note 17) 267 302
Bank borrowings
- Bankers’ acceptance 121,978 118,014
- revolving credit 3,000 -
- trust receipts, bills payable and bills receivable 53,639 20,572
- term loans 49,760 39,634
Finance lease liabilities (note 23(c)) 21 40
228,665 178,562
Non-current
Bank borrowings
- term loans 102,560 86,726
Finance lease liabilities (note 23(c)) 30 55
102,590 86,781
total borrowings 331,255 265,343

80
NOTES TO THE FINANCIAL STATEMENTSFor the financial year ended 31 December 2014
NOTES TO THE FINANCIAL STATEMENTS Building StrengthS Shaping the Future
23. BorroWInGS (ContInueD)
(a) Securities granted
the borrowings of the Group were secured by: - Certain property, plant and equipment, inventories, trade receivables, cash and cash equivalents that were
financed by certain banks and financial institutions.- Corporate guarantees by the Company
Finance lease liabilities were secured over the leased motor vehicles as at 31 December 2014 with carrying value of US$30,000 (2013: US$62,000) as the legal title was retained by the lessor and will be transferred to the Group upon full settlement of the finance lease liabilities.
(b) Fair value of non-current borrowings
the fair value of borrowings approximated the carrying value of the borrowings at balance sheet date as they bear interest at rates which approximate the current incremental borrowing rate for similar types of lending and borrowing arrangements, which management expects to be available to the Group.
(c) Finance lease liabilities
the Group leases certain plant and equipment under finance leases.
Group
2014 2013
uS$’000 US$’000
Minimum lease payments due
- not later than one year 23 45
- Between one and two years 23 25
- Between two and five years 8 34
54 104
Less: Future finance charges (3) (9)
present value of finance lease liabilities 51 95

81
NOTES TO THE FINANCIAL STATEMENTS
NOTES TO THE FINANCIAL STATEMENTSFor the financial year ended 31 December 2014
Mewah InternatIonal Inc. annual report 2014
23. BorroWInGS (ContInueD)
(c) Finance lease liabilities (continued)
the present values of finance lease liabilities were analysed as follows:
Group
2014 2013
uS$’000 US$’000
not later than one year 22 40
Between one and two years 22 23
Between two and five years 7 32
51 95
24. DeFerreD InCoMe taxeS
Deferred income tax assets and liabilities are offset when there is a legally enforceable right to offset current income tax assets against current income tax liabilities and when the deferred income taxes relate to the same fiscal authority. the amounts, determined after appropriate offsetting, were shown on the balance sheet as follows:
Group Company
2014 2013 2014 2013
uS$’000 US$’000 uS$’000 US$’000
Deferred income tax assets
- expected to be recovered within one year 564 764 - -
- expected to be recovered after one year 10,853 10,098 - -
11,417 10,862 - -
Deferred income tax liabilities
- expected to be settled within one year (10,269) (10,443) - -
- expected to be settled after one year (10,978) (11,902) (366) (307)
(21,247) (22,345) (366) (307)
(9,830) (11,483) (366) (307)

82
NOTES TO THE FINANCIAL STATEMENTSFor the financial year ended 31 December 2014
NOTES TO THE FINANCIAL STATEMENTS Building StrengthS Shaping the Future
24. DeFerreD InCoMe taxeS (ContInueD)
Movement in deferred income tax account was as follows:
Group Company
2014 2013 2014 2013
uS$’000 US$’000 uS$’000 US$’000
Beginning of financial year (11,483) (11,807) (307) (375)
Currency translation differences 661 890 - -
tax charged/(credited) to - profit or loss 992 (566) (59) 68
end of financial year (9,830) (11,483) (366) (307)
the movement in deferred income tax assets and liabilities (prior to offsetting of balances within the same tax jurisdiction) was as follows:
Group
Deferred income tax liabilities
acceleratedtax
depreciation
revaluation of property, plant and
equipmentUnremitted
foreign income
Unrealised gains on
derivative financial
instruments total
US$’000 US$’000 US$’000 US$’000 US$’000
2014
Beginning of financial year (26,682) (3,291) (676) (5,532) (36,181)
Currency translation differences 1,552 375 - 276 2,203
Credited/(charged) to - profit or loss 438 (56) (123) 797 1,056
end of financial year (24,692) (2,972) (799) (4,459) (32,922)
2013
Beginning of financial year (28,337) (3,535) (375) 3,370 (28,877)
Currency translation differences 2,123 219 - 136 2,478
(Charged)/credited to - profit or loss (468) 25 (301) (9,038) (9,782)
end of financial year (26,682) (3,291) (676) (5,532) (36,181)

83
NOTES TO THE FINANCIAL STATEMENTS
NOTES TO THE FINANCIAL STATEMENTSFor the financial year ended 31 December 2014
Mewah InternatIonal Inc. annual report 2014
24. DeFerreD InCoMe taxeS (ContInueD)
Group (continued)
Deferred income tax assets
Unutilised tax losses
Unutilised reinvestment
allowance others total
US$’000 US$’000 US$’000 US$’000
2014
Beginning of financial year 1,413 21,993 1,292 24,698
Currency translation differences (93) (1,308) (141) (1,542)
Credited/(charged) to - profit or loss 26 (1,030) 940 (64)
end of financial year 1,346 19,655 2,091 23,092
2013
Beginning of financial year 675 12,458 3,937 17,070
Currency translation differences (9) (1,397) (182) (1,588)
Credited/(charged) to - profit or loss 747 10,932 (2,463) 9,216
end of financial year 1,413 21,993 1,292 24,698
Deferred income tax assets are recognised for tax losses and capital allowances carried forward to the extent that realisation of the related tax benefits through future taxable profits is probable. the Group has unrecognised tax losses of US$7,142,000 (2013: US$5,954,000) at the balance sheet date which can be carried forward and used to offset against future taxable income subject to meeting certain statutory requirements by those companies with unrecognised tax losses and capital allowances in their respective countries of incorporation. the tax losses have no expiry date.
Company
Deferred income tax liabilities
Unremitted foreign income
2014 2013
uS$’000 US$’000
Beginning of financial year (307) (375)
(Charged)/credited to - profit or loss (59) 68
end of financial year (366) (307)

84
NOTES TO THE FINANCIAL STATEMENTSFor the financial year ended 31 December 2014
NOTES TO THE FINANCIAL STATEMENTS Building StrengthS Shaping the Future
25. Share CapItaL anD Share preMIuM
no. of ordinary shares amount
authorised share
capital at par value of
US$0.001
Issued share
capital at par value of
US$0.001
authorised share
capital at par value of
US$0.001
Share capital at
par value ofUS$0.001
Share premium
‘000 ‘000 US$’000 US$’000 US$’000
Group and Company
2014
Beginning of financial year, ordinary shares at par value, US$0.001 30,000,000 1,507,061 30,000 1,507 185,416
Shares purchased and cancelled - (6,394) - (6) (5,404)
end of financial year, ordinary shares at par value, US$0.001 30,000,000 1,500,667 30,000 1,501 180,012
2013
Beginning and end of financial year, ordinary shares at par value, US$0.001 30,000,000 1,507,061 30,000 1,507 185,416
all issued ordinary shares were fully paid. Fully paid ordinary shares carry one vote per share and carry a right to dividends as and when declared by the Company.
26. other reServeS
Group
2014 2013
uS$’000 US$’000
(a) Composition:
Merger reserve (53,005) (50,706)
General reserve (2,608) (2,608)
asset revaluation reserve 10,058 10,058
Currency translation reserve 8,787 20,948
Capital redemption reserve 3,509 -
(33,259) (22,308)

85
NOTES TO THE FINANCIAL STATEMENTS
NOTES TO THE FINANCIAL STATEMENTSFor the financial year ended 31 December 2014
Mewah InternatIonal Inc. annual report 2014
26. other reServeS (ContInueD)
Company
2014 2013
uS$’000 US$’000
(a) Composition:
Capital redemption reserve 3,509 -
Merger reserve represented the difference between the cost of investment and nominal value of share capital of the merged subsidiary.
General reserve represented the difference between the carrying amounts of the non-controlling interest and the fair value of the consideration paid or received; and the gain on change in fair value of put option rights of non-controlling interests.
Group
2014 2013
note uS$’000 US$’000
(b) Movements
(i) Merger reserve
Beginning of financial year (50,706) (50,706)
acquisition of a subsidiary under common control 34 (2,299) -
end of financial year (53,005) (50,706)
(ii) General reserve
Beginning and end of financial year (2,608) (2,608)
(iii) Asset revaluation reserve
Beginning and end of financial year 10,058 10,058
(iv) Currency translation reserve
Beginning of financial year 20,948 35,667
net currency translation differences of foreign subsidiaries (11,664) (15,026)
non-controlling interests (497) 307
end of financial year 8,787 20,948

86
NOTES TO THE FINANCIAL STATEMENTSFor the financial year ended 31 December 2014
NOTES TO THE FINANCIAL STATEMENTS Building StrengthS Shaping the Future
26. other reServeS (ContInueD)
Group and Company
2014 2013
note uS$’000 US$’000
(b) Movements (continued)
(v) Capital redemption reserve
Beginning of financial year - -
Share purchased and cancelled 3,509 -
end of financial year 3,509 -
other reserves are non-distributable.
27. retaIneD proFItS
(a) retained profits of the Group are distributable, to the extent that it is in compliance with the local guidelines of the countries in which the subsidiaries operate and the restrictions imposed by the covenant underlying our borrowings.
(b) Movement in retained profits for the Company was as follows:
Company
2014 2013
uS$’000 US$’000
Beginning of financial year 9,025 14,913
Dividends (note 28) (8,741) (8,101)
total comprehensive income for the financial year 20,587 2,213
end of financial year 20,871 9,025

87
NOTES TO THE FINANCIAL STATEMENTS
NOTES TO THE FINANCIAL STATEMENTSFor the financial year ended 31 December 2014
Mewah InternatIonal Inc. annual report 2014
28. DIvIDenDS
Group and Company
2014 2013
uS$’000 US$’000
Declared and paid during the financial year:
Dividend on ordinary shares:
- Final exempt one-tier dividends of S$0.0073 for 2013 (2012: S$0.0055) per share 8,741 6,682
- Interim exempt dividends of S$nil (2013: S$0.0012) per share - 1,419
8,741 8,101
Proposed but not recognised as a liability as at 31 December:
Dividends on ordinary shares, subject to shareholders’ approval at the AGM:
Final exempt one-tier dividends of S$0.0170 (2013: S$0.0073) per share 19,279 8,673
29. ContInGent LIaBILItIeS
Group
In 2007, charges in Malaysia were brought against Mewah-oils Sdn Bhd (“MoSB”), a wholly-owned subsidiary, and a director of the Company alleging that in 2003, MoSB used falsified documents to discharge crude palm oil (“Cpo”) and for receiving allegedly stolen property belonging to Lushing traders pte Ltd (“Lushing”). MoSB had purchased and paid for Cpo from Summerwind trading pte Ltd (“Summerwind”) which Summerwind had purchased from Lushing. on 26 January 2012, the Sessions Court Judge in Klang dismissed all charges. on 27 January 2012, the prosecution appealed to the High Court of Malaysia against the judgement. on 3 april 2014, the court has struck off the plaintiff’s claims.
In 2010, civil claims were also made by Lushing against MoSB claiming US$2,650,000 and interest at 8.0% per annum from the alleged date of conversion of the Cpo, which is between october 2003 and november 2003, costs and any other relief that may be granted by the court. the full trial was completed and the parties have filed their written submission on 4 December 2014. the court has not filed any date for oral clarification or decision as of the date of these financial statements. Shafee & Co, representing MoSB has been of the view that the case is without merit.

88
NOTES TO THE FINANCIAL STATEMENTSFor the financial year ended 31 December 2014
NOTES TO THE FINANCIAL STATEMENTS Building StrengthS Shaping the Future
29. ContInGent LIaBILItIeS (ContInueD)
Company
the Company has issued corporate guarantees to banks for borrowings to certain subsidiaries. as at 31 December 2014, the borrowings under the guarantees amounted to US$329,585,000 (2013: US$259,981,000). the financial effects of FrS 39 relating to the financial guarantee contracts issued by the Company are not material to the financial statements of the Company and therefore are not recognised. the management does not expect any loss to arise from the guarantees.
30. CoMMItMentS
(a) Capital commitments
Capital expenditures contracted for at the balance sheet date but not recognised in the financial statements are as follows:
Group
2014 2013
uS$’000 US$’000
property, plant and equipment 13,670 40,070
(b) Operating lease commitments - where the Group is a lessee
the Group leases office premises and equipments from non-related parties under non-cancellable operating lease agreements. the leases have varying terms, escalation clauses and renewal rights.
the future minimum lease payables under non-cancellable operating leases contracted for at the balance sheet date but not recognised as liabilities, were as follows:
Group
2014 2013
uS$’000 US$’000
not later than one year 547 360
Between one and five years 1,788 1,308
Later than five years 5,678 3,499
8,013 5,167
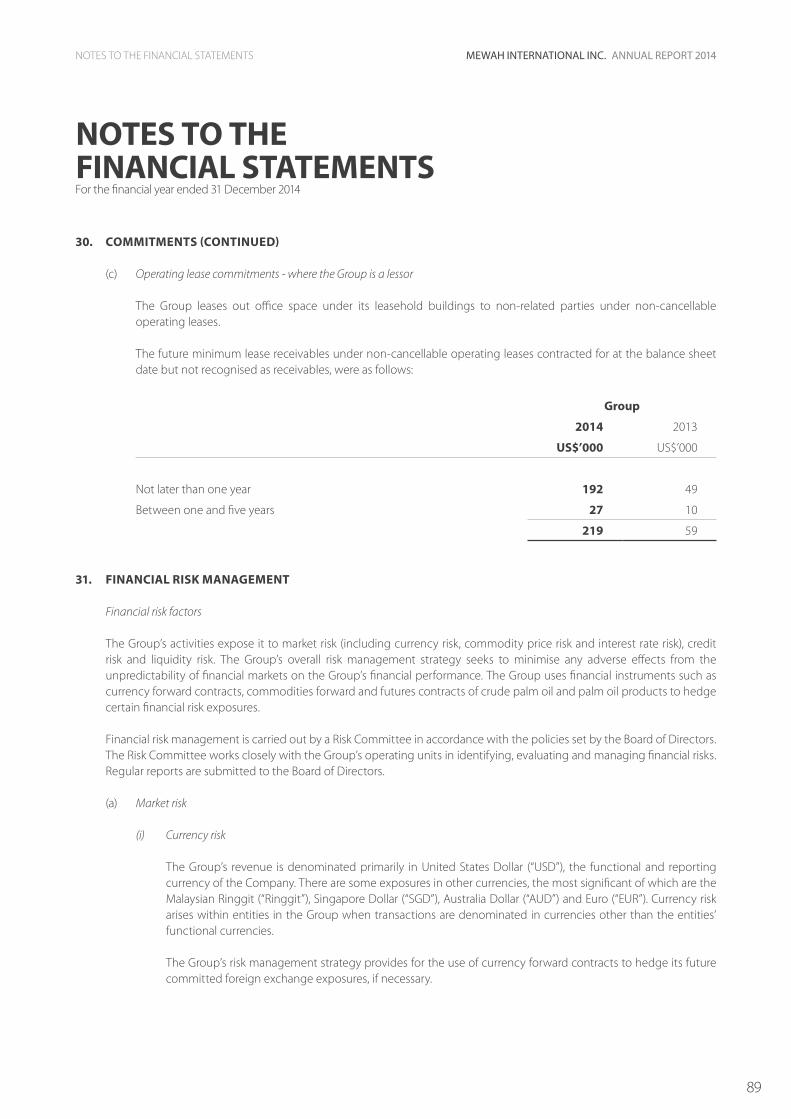
89
NOTES TO THE FINANCIAL STATEMENTS
NOTES TO THE FINANCIAL STATEMENTSFor the financial year ended 31 December 2014
Mewah InternatIonal Inc. annual report 2014
30. CoMMItMentS (ContInueD)
(c) Operating lease commitments - where the Group is a lessor
the Group leases out office space under its leasehold buildings to non-related parties under non-cancellable operating leases.
the future minimum lease receivables under non-cancellable operating leases contracted for at the balance sheet date but not recognised as receivables, were as follows:
Group
2014 2013
uS$’000 US$’000
not later than one year 192 49
Between one and five years 27 10
219 59
31. FInanCIaL rISK ManaGeMent
Financial risk factors
the Group’s activities expose it to market risk (including currency risk, commodity price risk and interest rate risk), credit risk and liquidity risk. the Group’s overall risk management strategy seeks to minimise any adverse effects from the unpredictability of financial markets on the Group’s financial performance. the Group uses financial instruments such as currency forward contracts, commodities forward and futures contracts of crude palm oil and palm oil products to hedge certain financial risk exposures.
Financial risk management is carried out by a risk Committee in accordance with the policies set by the Board of Directors. the risk Committee works closely with the Group’s operating units in identifying, evaluating and managing financial risks. regular reports are submitted to the Board of Directors.
(a) Market risk
(i) Currency risk
the Group’s revenue is denominated primarily in United States Dollar (“USD”), the functional and reporting currency of the Company. there are some exposures in other currencies, the most significant of which are the Malaysian ringgit (“ringgit”), Singapore Dollar (“SGD”), australia Dollar (“aUD”) and euro (“eUr”). Currency risk arises within entities in the Group when transactions are denominated in currencies other than the entities’ functional currencies.
the Group’s risk management strategy provides for the use of currency forward contracts to hedge its future committed foreign exchange exposures, if necessary.

90
NOTES TO THE FINANCIAL STATEMENTSFor the financial year ended 31 December 2014
NOTES TO THE FINANCIAL STATEMENTS Building StrengthS Shaping the Future
31. FInanCIaL rISK ManaGeMent (ContInueD)
(a) Market risk (continued)
(i) Currency risk (continued)
the Group’s currency exposure based on the information provided to key management was as follows:
USD ringgit eUro SGD aUD JpY others total
US$’000 US$’000 US$’000 US$’000 US$’000 US$’000 US$’000 US$’000
at 31 December 2014
Financial assets
Cash and cash equivalents 30,654 7,802 10,846 960 116 - 10,447 60,825
trade and other receivables 237,111 59,777 5,357 3,711 3,982 - (1,344) 308,594
Intercompany receivables 498,603 90,484 6,128 3 4,660 - 1,015 600,893
766,368 158,063 22,331 4,674 8,758 - 10,118 970,312
Financial liabilities
Borrowings (107,812) (221,253) (49) - (1,923) - (218) (331,255)
other financial liabilities (55,825) (111,631) (4,893) (12,406) (558) - (4,712) (190,025)
Intercompany payables (498,603) (90,484) (6,128) (3) (4,660) - (1,015) (600,893)
(662,240) (423,368) (11,070) (12,409) (7,141) - (5,945) (1,122,173)
net financial assets/ (liabilities) 104,128 (265,305) 11,261 (7,735) 1,617 - 4,173 (151,861)
add: Firm commitments and highly probable forecast transactions in foreign currencies 354,199 (268,622) 2,305 (7,142) (10) - (1) 80,729
Less: Currency forward contracts (349,045) 394,751 (24,548) 3,476 (9,657) (14,695) (282) -
Currency profile 109,282 (139,176) (10,982) (11,401) (8,050) (14,695) 3,890 (71,132)
Financial (assets)/liabilities denominated in the respective entities’ functional currencies (162,205) 138,577 389 28 3,077 - (668) (20,802)
Currency exposure of financial (liabilities) /assets net of those denominated in the respective entities’ functional currencies (52,923) (599) (10,593) (11,373) (4,973) (14,695) 3,222 (91,934)

91
NOTES TO THE FINANCIAL STATEMENTS
NOTES TO THE FINANCIAL STATEMENTSFor the financial year ended 31 December 2014
Mewah InternatIonal Inc. annual report 2014
31. FInanCIaL rISK ManaGeMent (ContInueD)
(a) Market risk (continued)
(i) Currency risk (continued)
the Group’s currency exposure based on the information provided to key management was as follows: (continued)
USD ringgit eUro SGD aUD others total
US$’000 US$’000 US$’000 US$’000 US$’000 US$’000 US$’000
at 31 December 2013
Financial assets
Cash and cash equivalents 46,197 12,654 1,044 1,309 333 1,608 63,145
trade and other receivables 224,757 48,829 26,061 3,721 4,329 5,947 313,644
Intercompany receivables 527,845 27,061 38,867 1 6,142 3,170 603,086
798,799 88,544 65,972 5,031 10,804 10,725 979,875
Financial liabilities
Borrowings (40,482) (222,242) - - (2,317) (302) (265,343)
other financial liabilities (34,425) (125,589) (3,546) (12,099) (738) (4,234) (180,631)
Intercompany payables (527,845) (27,061) (38,867) (1) (6,142) (3,170) (603,086)
(602,752) (374,892) (42,413) (12,100) (9,197) (7,706) (1,049,060)
net financial assets/ (liabilities) 196,047 (286,348) 23,559 (7,069) 1,607 3,019 (69,185)
add: Firm commitments and highly probable forecast transactions in foreign currencies (86,348) 105,548 48,784 (4,631) - - 63,353
Less: Currency forward contracts 121,939 2,698 (114,185) 4,883 (13,421) (1,914) -
Currency profile 231,638 (178,102) (41,842) (6,817) (11,814) 1,105 (5,832)
Financial (assets)/liabilities denominated in the respective entities’ functional currencies (298,156) 177,404 15,837 175 4,585 (1,868) (102,023)
Currency exposure of financial assets/(liabilities) net of those denominated in the respective entities’ functional currencies (66,518) (698) (26,005) (6,642) (7,229) (763) (107,855)

92
NOTES TO THE FINANCIAL STATEMENTSFor the financial year ended 31 December 2014
NOTES TO THE FINANCIAL STATEMENTS Building StrengthS Shaping the Future
31. FInanCIaL rISK ManaGeMent (ContInueD)
(a) Market risk (continued)
(i) Currency risk (continued)
the Company’s currency exposure based on the information provided to key management was as follows:
USD SGD aUD totalUS$’000 US$’000 US$’000 US$’000
at 31 December 2014Financial assetsCash and cash equivalents 19 37 - 56other receivables 203,917 - 1,718 205,635
203,936 37 1,718 205,691
Financial liabilitiesother financial liabilities - (142) - (142)
net financial assets/(liabilities)/Currency profile 203,936 (105) 1,718 205,549
Financial assets denominated in the Company’s functional currency (203,936) - - (203,936)
Currency exposure of financial assets/ (liabilities) net of those denominated in the Company’s functional currency - (105) 1,718 1,613
at 31 December 2013Financial assetsCash and cash equivalents 2 73 - 75other receivables 193,862 - 1,784 195,646
193,864 73 1,784 195,721
Financial liabilitiesother financial liabilities - (148) - (148)
net financial assets/(liabilities)/Currency profile 193,864 (75) 1,784 195,573
Financial assets denominated in the Company’s functional currency (193,864) - - (193,864)
Currency exposure of financial assets/ (liabilities) net of those denominated in the Company’s functional currency - (75) 1,784 1,709

93
NOTES TO THE FINANCIAL STATEMENTS
NOTES TO THE FINANCIAL STATEMENTSFor the financial year ended 31 December 2014
Mewah InternatIonal Inc. annual report 2014
31. FInanCIaL rISK ManaGeMent (ContInueD)
(a) Market risk (continued)
(i) Currency risk (continued)
If ringgit, euro, SGD, aUD and JpY change against USD by 5% (2013: ringgit, euro, SGD and aUD; 5%) respectively with all other variables including tax rate being held constant, the effects arising from the net financial asset/ liability position will be as follows:
profit after tax Increase/(decrease)
US$’000Strengthened
US$’000Weakened
Group2014
USD against ringgit 24 (24)USD against eUro 420 (420)USD against SGD 451 (451)USD against aUD 197 (197)USD against JpY 583 (583)
2013
USD against ringgit 29 (29)USD against eUro 1,100 (1,100)USD against SGD 281 (281)USD against aUD 306 (306)
If SGD and aUD change against USD by 5% respectively with all other variables including tax rate being held constant, the effects arising from the net financial asset/ liability position will be as follows:
profit after tax Increase/(decrease)
US$’000Strengthened
US$’000Weakened
Company2014
USD against SGD 4 (4)USD against aUD (71) 71
2013
USD against SGD 3 (3)USD against aUD (74) 74

94
NOTES TO THE FINANCIAL STATEMENTSFor the financial year ended 31 December 2014
NOTES TO THE FINANCIAL STATEMENTS Building StrengthS Shaping the Future
31. FInanCIaL rISK ManaGeMent (ContInueD)
(a) Market risk (continued)
(ii) Cash flows and fair value interest rate risks
Cash flows interest rate risk is the risk that the future cash flows of a financial instrument will fluctuate because of changes in market interest rates. Fair value interest rate risk is the risk that the fair value of a financial instrument will fluctuate due to changes in market interest rates. the Group’s exposure to interest rate risk arises primarily from their borrowings and deposits placed with creditworthy licensed banks and financial institutions.
the Group’s policy is to enter into variable interest rates borrowings as the market interest rates are typically priced into the sales transactions.
the Group’s borrowings are denominated mainly in ringgit and USD. as at 31 December 2014, profit after tax for the financial year would have been lower or higher by US$399,000 (2013: US$325,000) if market interest rates had been 50 basis points higher or lower with all other variables held constant.
(iii) Commodity price risk
the Group is exposed to fluctuations in the prices of agri-commodities it deals in, including crude palm oil and palm oil products prices. the Group minimises the risk arising from such fluctuations by entering into commodities forward contracts and futures contracts. the Group has not adopted hedge accounting.
In the course of entering into these contracts, the Group may be exposed to the inherent risk associated with trading activities conducted by its personnel. the Group has in place a risk management system to manage such risk exposure.
as at 31 December 2014, if the commodities futures and forward prices had increased or decreased by 5% from the quoted prices or management’s estimates and other variables held constant, the Group’s profit after tax would have been lower or higher by US$4,895,000 (2013: US$2,738,000) respectively, arising from the changes in fair value of the commodities forward and futures contracts.
(b) Credit risk
Credit risk refers to the risk that counterparty will default on its contractual obligations resulting in financial loss to the Group. the major classes of financial assets of the Group are trade and other receivables and bank deposits. For trade and other receivables, the Group adopts the policy of dealing only with customers of appropriate credit standing and history, and obtaining sufficient collateral or buying credit insurance where appropriate to mitigate credit risk. For other financial assets, the Group adopts the policy of dealing only with high credit quality counterparties.
the Group has a credit risk policy in place to manage credit risk. all new customers are subject to credit worthiness check; counterparties are ranked and assigned a credit limit appropriately. Such credit limit would be approved by a risk Committee. In addition, any increase in credit limit requires approval from the risk Committee. the risk Committee is mandated to monitor the payment ageing profile of the third party receivables, to review all the outstanding receivables regularly and to identify any potential uncollectible for doubtful debts provision and/or write-off.

95
NOTES TO THE FINANCIAL STATEMENTS
NOTES TO THE FINANCIAL STATEMENTSFor the financial year ended 31 December 2014
Mewah InternatIonal Inc. annual report 2014
31. FInanCIaL rISK ManaGeMent (ContInueD)
(b) Credit risk (continued)
as the Group and the Company do not hold any collateral, the maximum exposure to credit risk for each class of financial instruments is the carrying amount of that class of financial instruments presented on the balance sheet, except as follows:
Company
2014 2013
uS$’000 US$’000
Corporate guarantees provided to financial institutions on subsidiaries’ borrowings 329,585 259,981
the management is of the view that no loss is expected to arise from the guarantees.
the major trade receivables of the Group comprised of 2 debtors for 2014 (2013: 2 debtors) and represented 13% of trade receivables (2013: 11%). the Company did not have trade receivables in 2014 and 2013.
the credit risk for trade receivables based on the information provided to key management was as follows:
Group
2014 2013
uS$’000 US$’000
By geographical areas
- asia 73,030 92,953
Malaysia 32,466 41,355
Singapore 16,863 29,003
rest of asia 71,626 38,539
- africa
- Middle east 42,080 44,959
Iran 12,670 18,681
rest of Middle east 26,130 15,766
- europe 5,910 5,063
- pacific oceania 9,512 6,383
- america 290,287 292,702
(i) Financial assets that are neither past due nor impaired
Bank deposits that were neither past due nor impaired were mainly deposits with banks with high credit-ratings. trade receivables that were neither past due nor impaired were substantially companies with a good collection track record with the Group.

96
NOTES TO THE FINANCIAL STATEMENTSFor the financial year ended 31 December 2014
NOTES TO THE FINANCIAL STATEMENTS Building StrengthS Shaping the Future
31. FInanCIaL rISK ManaGeMent (ContInueD)
(b) Credit risk (continued)
(ii) Financial assets that are past due and/or impaired
there is no other class of financial assets that is past due and/or impaired except for trade receivables (non-related parties).
the age analysis of trade receivables (non-related parties) past due but not impaired was as follows:
Group
2014 2013
uS$’000 US$’000
past due < 3 months 57,381 53,014
past due 3 to 6 months 17,333 41,038
past due 6 to 12 months 8,447 16,858
past due over 1 year 13,173 4,400
96,334 115,310
the carrying amount of trade receivables (non-related parties) individually determined to be impaired and the movement in the related allowance for impairment were as follows:
Group
2014 2013
uS$’000 US$’000
Gross amount 18,756 21,337
Less: allowance for impairment (18,756) (21,337)
- -
Beginning of financial year 21,337 14,491
Currency translation differences (308) (1,147)
(Written back)/allowance made (note 10) (2,158) 9,032
allowance utilised (115) (1,039)
end of financial year 18,756 21,337
the impaired trade receivables (non-related parties) arise mainly from sales to customers which have suffered financial difficulties.

97
NOTES TO THE FINANCIAL STATEMENTS
NOTES TO THE FINANCIAL STATEMENTSFor the financial year ended 31 December 2014
Mewah InternatIonal Inc. annual report 2014
31. FInanCIaL rISK ManaGeMent (ContInueD)
(c) Liquidity risk
prudent liquidity risk management includes maintaining sufficient cash and maintaining flexibility in funding by keeping credit facilities available with different financial institutions. at the balance sheet date, assets held by the Group and the Company for managing liquidity risk included cash and short-term bank deposits as disclosed in note 17.
the table below analyses financial liabilities (including derivative liabilities) of the Group and the Company into relevant maturity groupings based on the remaining period from the balance sheet date to the contractual maturity date. the amounts disclosed in the table were the contractual undiscounted cash flows. Balances due within 12 months approximate their carrying balances as the impact of discounting was not significant.
Less than1 year
Between1 and 2
years
Between2 and 5
yearsover
5 years totalUS$’000 US$’000 US$’000 US$’000 US$’000
Groupat 31 December 2014trade and other payables (190,025) - - - (190,025)Borrowings (231,441) (43,668) (50,273) - (325,382)
(421,466) (43,668) (50,273) - (515,407)Gross-settled currency forward contracts
- receipts 584,751 - - - 584,751- payments (157,358) - - - (157,358)
427,393 - - - 427,393
Gross-settled futures contracts and forward sales and purchase contracts- receipts 696,383 37,255 - - 733,638 - payments (630,056) (1,389) - - (631,445)
66,327 35,866 - - 102,193
at 31 December 2013trade and other payables (180,631) - - - (180,631)Borrowings (181,153) (37,662) (52,859) (245) (271,919)
(361,784) (37,662) (52,859) (245) (452,550)Gross-settled currency forward contracts
- receipts 306,101 - - - 306,101- payments (263,305) - - - (263,305)
42,796 - - - 42,796
Gross-settled futures contracts and forward sales and purchase contracts- receipts 766,732 169,518 - - 936,250- payments (796,255) (31,465) - - (827,720)
(29,523) 138,053 - - 108,530

98
NOTES TO THE FINANCIAL STATEMENTSFor the financial year ended 31 December 2014
NOTES TO THE FINANCIAL STATEMENTS Building StrengthS Shaping the Future
31. FInanCIaL rISK ManaGeMent (ContInueD)
(c) Liquidity risk (continued)
Less than 1 yearUS$’000
Companyat 31 December 2014other payables (142)
at 31 December 2013other payables (148)
the table below analyses the maturity profile of the Company’s contingent liabilities and commitments. the maximum amount of the financial guarantee contracts were allocated to the earliest period in which the guarantee could be called.
Less than1 year
Between1 and 2
years
Between2 and 5
yearsover
5 years totalUS$’000 US$’000 US$’000 US$’000 US$’000
Companyat 31 December 2014Financial guarantee contracts (228,521) (48,230) (52,834) - (329,585)
Companyat 31 December 2013Financial guarantee contracts (172,509) (36,685) (50,553) (234) (259,981)
(d) Capital risk
the Group’s objectives when managing capital are to safeguard the Group’s ability to continue as a going concern and to maintain an optimal capital structure so as to maximise shareholder value. In order to maintain or achieve an optimal capital structure over business cycles, the Group may adjust the amount of dividend payment, obtain new borrowings or sell assets to reduce borrowings.
Management manages capital based on tangible net worth of the Group and a number of key ratios including gross debt-equity ratio and net debt-equity ratio. the Group is required by the banks to maintain a certain amount of minimum tangible net worth and gross debt-equity ratio. the gross debt-equity ratio is defined as total interest bearing debts (“gross debt”) to total equity. net debt-equity ratio is defined as total interest bearing debts less cash and cash equivalents (“net debt”) to total equity.
no changes were made in the objectives, policies or processes during the financial years ended 31 December 2014 and 31 December 2013.

99
NOTES TO THE FINANCIAL STATEMENTS
NOTES TO THE FINANCIAL STATEMENTSFor the financial year ended 31 December 2014
Mewah InternatIonal Inc. annual report 2014
31. FInanCIaL rISK ManaGeMent (ContInueD)
(d) Capital risk (continued)
Group2014 2013
uS$’000 US$’000
tangible net worth 535,572 556,825
Debt-equity ratioGross debt 331,255 265,343Less: Cash and cash equivalents (60,825) (63,145)net debt 270,430 202,198
total equity 535,572 556,825
Gross debt-equity ratio 0.62 0.48net debt-equity ratio 0.50 0.36
the Group and the Company were in compliance with all externally imposed capital requirements for the financial years ended 31 December 2014 and 2013.
(e) Fair value measurements
the following table presents assets and liabilities measured and carried at fair value and classified by level of the following fair value measurement hierarchy:
(i) quoted prices (unadjusted) in active markets for identical assets or liabilities (Level 1);
(ii) inputs other than quoted prices included within Level 1 that are observable for the asset or liability, either directly (i.e. as prices) or indirectly (i.e. derived from prices) (Level 2); and
(iii) inputs for the asset or liability that are not based on observable market data (unobservable inputs) (Level 3).
Level 1 Level 2 total US$’000 US$’000 US$’000
Group2014Financial assetsDerivative financial instruments (note 16)
- Currency forward contracts - 4,102 4,102- Commodities futures contracts 6,616 - 6,616- Commodities forward contracts - 38,775 38,775
as at 31 December 2014 6,616 42,877 49,493
Financial LiabilitiesDerivative financial instruments (note 16)
- Currency forward contracts - (22,956) (22,956)- Commodities futures contracts (5,344) - (5,344)- Commodities forward contracts - (14,456) (14,456)
as at 31 December 2014 (5,344) (37,412) (42,756)

100
NOTES TO THE FINANCIAL STATEMENTSFor the financial year ended 31 December 2014
NOTES TO THE FINANCIAL STATEMENTS Building StrengthS Shaping the Future
31. FInanCIaL rISK ManaGeMent (ContInueD)
(e) Fair value measurements (continued)
Level 1 Level 2 total US$’000 US$’000 US$’000
Group2013Financial assetsDerivative financial instruments (note 16)
- Currency forward contracts - 5,735 5,735- Commodities futures contracts 8,557 - 8,557- Commodities forward contracts - 17,535 17,535
as at 31 December 2013 8,557 23,270 31,827
Financial LiabilitiesDerivative financial instruments (note 16)
- Currency forward contracts - (5,716) (5,716)- Commodities futures contracts (6,024) - (6,024)- Commodities forward contracts - (9,719) (9,719)
as at 31 December 2013 (6,024) (15,435) (21,459)
there were no transfers between Levels 1 and 2 during the year. the fair value of financial instruments traded in active markets (such as exchange-traded and over-the-counter derivatives) is based on quoted market prices at the balance sheet date. the quoted market price used for financial assets held by the Group is the current bid price; the appropriate quoted market price for financial liabilities is the current asking price. the Group’s commodities futures contracts are traded in active markets and their fair values reflect quoted prices at the balance sheet date in active markets such as Bursa Malaysia. these instruments are included in Level 1.
the Group’s commodities forward contracts are not traded in an active market. their fair values are estimated by a valuation technique that makes reference to prices listed on Malaysian palm oil Board (MpoB) and considers market conditions, broker quotes and actual contracted prices entered at the balance sheet date. the fair values of currency forward contracts are determined using quoted forward exchange rates at the balance sheet date. these instruments are included in Level 2.
the carrying value less impairment provision of trade receivables and payables are assumed to approximate their fair value. the fair value of financial liabilities for disclosure purposes is estimated based on quoted market prices or dealer quotes for similar instruments by discounting the future contractual cash flows at the current market interest rate that is available to the Group for similar financial instruments. the fair value of current borrowings approximates their carrying amount.

101
NOTES TO THE FINANCIAL STATEMENTS
NOTES TO THE FINANCIAL STATEMENTSFor the financial year ended 31 December 2014
Mewah InternatIonal Inc. annual report 2014
31. FInanCIaL rISK ManaGeMent (ContInueD)
(f) Financial instruments by category
the carrying amount of the different categories of financial instruments was as disclosed on the face of the balance sheet and in note 16 to the financial statements, except for the following:
Loans and receivables
Group Company2014 2013 2014 2013
uS$’000 US$’000 uS$’000 US$’000
trade receivables 290,287 292,702 - -other receivables 18,307 20,942 205,635 195,646Cash and cash equivalents 60,825 63,145 56 75
369,419 376,789 205,691 195,721
Financial liabilities at amortised cost
Group Company2014 2013 2014 2013
uS$’000 US$’000 uS$’000 US$’000
trade payables (147,007) (141,042) - -other payables (43,018) (39,589) (142) (148)Borrowings (331,255) (265,343) - -
(521,280) (445,974) (142) (148)
(g) Offsetting financial assets and liabilities
Group
(i) Financial assets subject to offsetting
Description
(a)
Gross amounts of financial
assets
(b)Gross amount
of financial liabilities set off on
balance sheet
(c) = (a)-(b)net amounts of financial
assets presented on balance sheet
US$’000 US$’000 US$’000
2014
Commodities forward contracts 41,615 (2,840) 38,775
2013Commodities forward contracts 19,255 (1,720) 17,535
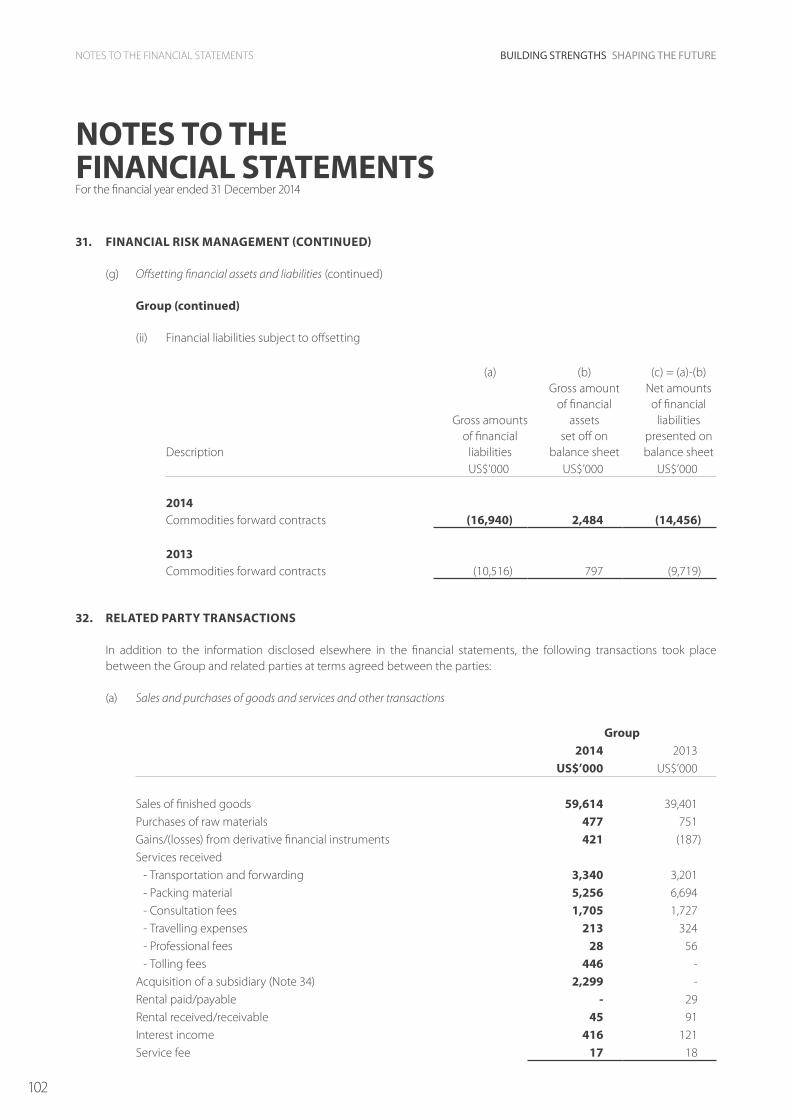
102
NOTES TO THE FINANCIAL STATEMENTSFor the financial year ended 31 December 2014
NOTES TO THE FINANCIAL STATEMENTS Building StrengthS Shaping the Future
31. FInanCIaL rISK ManaGeMent (ContInueD)
(g) Offsetting financial assets and liabilities (continued)
Group (continued)
(ii) Financial liabilities subject to offsetting
Description
(a)
Gross amounts of financial
liabilities
(b)Gross amount
of financial assets
set off onbalance sheet
(c) = (a)-(b)net amounts of financial
liabilities presented on balance sheet
US$’000 US$’000 US$’000
2014Commodities forward contracts (16,940) 2,484 (14,456)
2013Commodities forward contracts (10,516) 797 (9,719)
32. reLateD partY tranSaCtIonS
In addition to the information disclosed elsewhere in the financial statements, the following transactions took place between the Group and related parties at terms agreed between the parties:
(a) Sales and purchases of goods and services and other transactions
Group2014 2013
uS$’000 US$’000
Sales of finished goods 59,614 39,401purchases of raw materials 477 751Gains/(losses) from derivative financial instruments 421 (187)Services received
- transportation and forwarding 3,340 3,201- packing material 5,256 6,694- Consultation fees 1,705 1,727- travelling expenses 213 324- professional fees 28 56- tolling fees 446 -
acquisition of a subsidiary (note 34) 2,299 -rental paid/payable - 29rental received/receivable 45 91Interest income 416 121Service fee 17 18

103
NOTES TO THE FINANCIAL STATEMENTS
NOTES TO THE FINANCIAL STATEMENTSFor the financial year ended 31 December 2014
Mewah InternatIonal Inc. annual report 2014
32. reLateD partY tranSaCtIonS (ContInueD)
(a) Sales and purchases of goods and services and other transactions (continued)
related parties comprise mainly companies or individuals which are controlled or significantly influenced by the Group’s key management personnel and their close family members.
outstanding balances at 31 December 2014 and 2013 arising from the above transactions are set out in notes 14, 15, 21 and 22 respectively.
(b) Key management personnel compensation
Key management personnel compensation was as follows:
Group
2014 2013
uS$’000 US$’000
Wages, salaries and other short-term employee benefits 7,851 8,237
employer’s contribution to defined contribution plans 143 134
7,994 8,371
33. SeGMent InForMatIon
Management has determined the operating segments based on the reports reviewed by the executive Committee (“exco”) that are used to make strategic decisions, allocate resources, and assess performance. the exco comprises the Chief executive officer, the Chief Financial officer, and the department heads of each business within each segment.
the exco considers the business from two segments:
(i) the bulk segment which sources, manufactures and sells edible oils and specialty fats and oils in bulk for a variety of end uses; and
(ii) the consumer pack segment which manufactures and sells edible oils and bakery fats and rice to consumers in packaged form.
the Group measures and tracks the profitability in terms of operating margin and earnings before interest, tax, depreciation and amortisation (“eBItDa”).
operating margin is calculated as revenue, less cost of sales (excluding depreciation), selling and distribution expenses and foreign exchange gains/(losses). operating margin relating to inter-segment sales are reported under the segment where the final sales to third parties are made.
eBItDa is calculated as operating margin add other income, less administrative expenses (excluding depreciation and amortisation) and other operating expenses.

104
NOTES TO THE FINANCIAL STATEMENTSFor the financial year ended 31 December 2014
NOTES TO THE FINANCIAL STATEMENTS Building StrengthS Shaping the Future
33. SeGMent InForMatIon (ContInueD)
the segment information provided to the exco for the reportable segments for the financial year ended 31 December 2014 was as follows:
Bulk Consumer pack totalUS$’000 US$’000 US$’000
GroupSalestotal segment sales 2,769,012 1,138,875 3,907,887 Inter-segment sales (420,291) (48,777) (469,068)Sales to external parties 2,348,721 1,090,098 3,438,819
operating margin 41,578 52,993 94,571other income 1,090 538 1,628Interest income 2,866 1,067 3,933admin expenses, excluding depreciation and amortisation (33,707) (31,800) (65,507)other gains (4) 117 113eBItDa/Segment results 11,823 22,915 34,738
unallocated Depreciation (17,512)amortisation (1,305)Finance expense (12,299)Income tax expense (583)Loss on liquidation of subsidiaries (92)Share of profit of an associate 80profit after tax 3,027
total segment assets 868,653 236,103 1,104,756
unallocatedCurrent income tax recoverable 6,876Investment in associated company 379Deferred income tax assets 11,417total assets 1,123,428
total assets include:additions to:
- property, plant and equipment 18,683 19,365 38,048- leasehold prepayments 54 17,573 17,627
total segment liabilities (439,937) (124,099) (564,036)
unallocatedCurrent income tax liabilities (2,573)Deferred income tax liabilities (21,247)total liabilities (587,856)

105
NOTES TO THE FINANCIAL STATEMENTS
NOTES TO THE FINANCIAL STATEMENTSFor the financial year ended 31 December 2014
Mewah InternatIonal Inc. annual report 2014
33. SeGMent InForMatIon (ContInueD)
the segment information provided to the exco for the reportable segments for the financial year ended 31 December 2013 was as follows:
Bulk Consumer pack totalUS$’000 US$’000 US$’000
GroupSalestotal segment sales 2,602,474 983,486 3,585,960Inter-segment sales (361,932) (30,295) (392,227)Sales to external parties 2,240,542 953,191 3,193,733
operating margin 73,718 41,745 115,463other income 778 609 1,387Interest income 3,316 951 4,267admin expenses, excluding depreciation and amortisation (33,834) (32,015) (65,849)other gains 102 115 217eBItDa/Segment results 44,080 11,405 55,485
unallocated Depreciation (18,212)amortisation (1,270)Finance expense (13,377)Income tax expense (2,695)Share of profit of an associate 74profit after tax 20,005
total segment assets 778,194 250,277 1,028,471
unallocatedCurrent income tax recoverable 9,779Investment in associated company 323Deferred income tax assets 10,862total assets 1,049,435
total assets include:additions to:
- property, plant and equipment 28,571 24,508 53,079- leasehold prepayments 1,949 - 1,949
total segment liabilities (371,498) (95,935) (467,433)
unallocatedCurrent income tax liabilities (2,832)Deferred income tax liabilities (22,345)total liabilities (492,610)
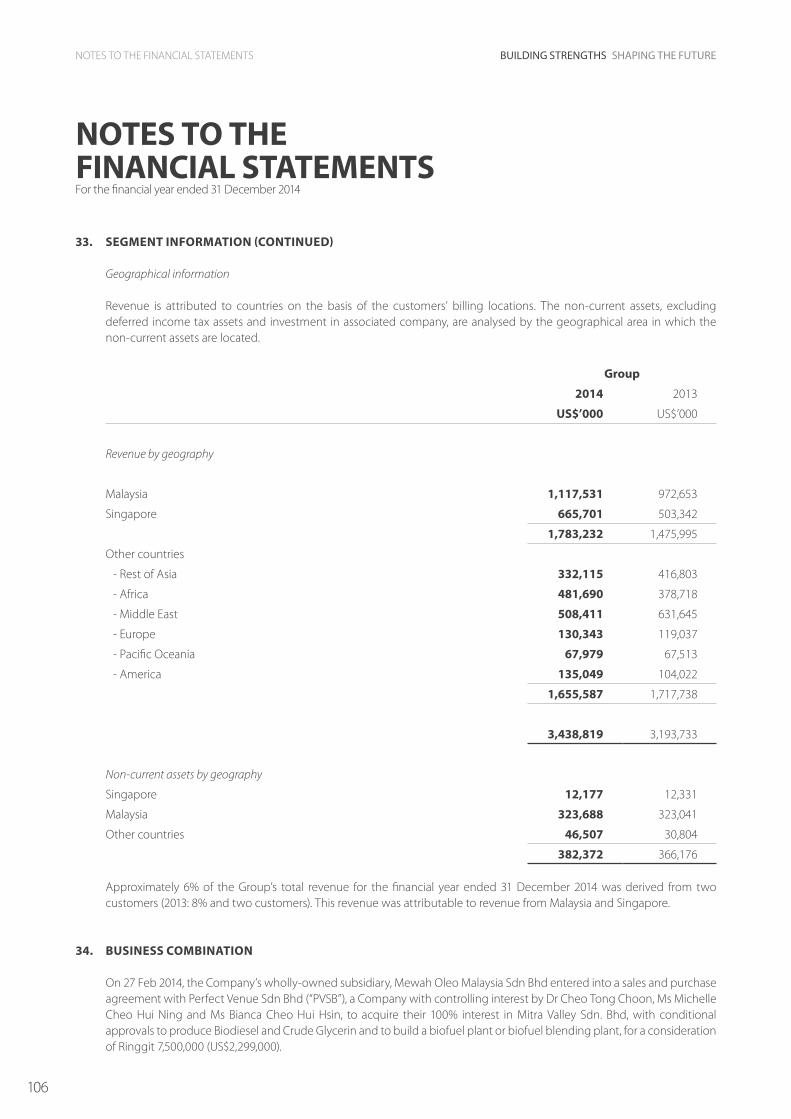
106
NOTES TO THE FINANCIAL STATEMENTSFor the financial year ended 31 December 2014
NOTES TO THE FINANCIAL STATEMENTS Building StrengthS Shaping the Future
33. SeGMent InForMatIon (ContInueD)
Geographical information
revenue is attributed to countries on the basis of the customers’ billing locations. the non-current assets, excluding deferred income tax assets and investment in associated company, are analysed by the geographical area in which the non-current assets are located.
Group
2014 2013
uS$’000 US$’000
Revenue by geography
Malaysia 1,117,531 972,653
Singapore 665,701 503,342
1,783,232 1,475,995
other countries
- rest of asia 332,115 416,803
- africa 481,690 378,718
- Middle east 508,411 631,645
- europe 130,343 119,037
- pacific oceania 67,979 67,513
- america 135,049 104,022
1,655,587 1,717,738
3,438,819 3,193,733
Non-current assets by geography
Singapore 12,177 12,331
Malaysia 323,688 323,041
other countries 46,507 30,804
382,372 366,176
approximately 6% of the Group’s total revenue for the financial year ended 31 December 2014 was derived from two customers (2013: 8% and two customers). this revenue was attributable to revenue from Malaysia and Singapore.
34. BuSIneSS CoMBInatIon
on 27 Feb 2014, the Company’s wholly-owned subsidiary, Mewah oleo Malaysia Sdn Bhd entered into a sales and purchase agreement with perfect venue Sdn Bhd (“pvSB”), a Company with controlling interest by Dr Cheo tong Choon, Ms Michelle Cheo Hui ning and Ms Bianca Cheo Hui Hsin, to acquire their 100% interest in Mitra valley Sdn. Bhd, with conditional approvals to produce Biodiesel and Crude Glycerin and to build a biofuel plant or biofuel blending plant, for a consideration of ringgit 7,500,000 (US$2,299,000).

107
NOTES TO THE FINANCIAL STATEMENTS
NOTES TO THE FINANCIAL STATEMENTSFor the financial year ended 31 December 2014
Mewah InternatIonal Inc. annual report 2014
34. BuSIneSS CoMBInatIon (ContInueD)
this acquisition was accounted for using the pooling-of-interest method, as disclosed in note 2.3(a)(ii) to the financial statements. the impact of this transaction to the financial statements of the Group was insignificant, except that the difference between the purchase consideration and net assets acquired have been recognised directly in the merger reserve.
35. neW or revISeD aCCountInG StanDarDS anD InterpretatIonS
Below are the mandatory standards, amendments and interpretations to existing standards that have been published, and are relevant for the Group’s accounting periods beginning on or after 1 January 2015 or later periods and which the Group has not early adopted:
• FRS 108 Operating Segments (effective for annual periods beginning on or after 1 July 2014)
the standard is amended to require disclosure of the judgements made by management in aggregating operating segments. this includes a description of the segments which have been aggregated and the economic indicators which have been assessed in determining that the aggregated segments share similar economic characteristics.
the standard is further amended to require a reconciliation of segment assets to the entity’s assets when segment assets are reported.
this amendment will not result in any changes to the Group’s accounting policies but will require more disclosures in the financial statements.
• FRS 16 Property, Plant and Equipment (effective for annual periods beginning on or after 1 July 2014)
the standard is amended to clarify how the gross carrying amount and the accumulated depreciation are treated where an entity uses the revaluation model. the carrying amount of the asset is restated to the revalued amount. the split between gross carrying amount and accumulated depreciation is treated in one of the following ways:
• eitherthegrosscarryingamountisrestatedinamannerconsistentwiththerevaluationofthecarryingamount,and the accumulated depreciation is adjusted to equal the difference between the gross carrying amount and the carrying amount after taking into account accumulated impairment losses; or
• theaccumulateddepreciationiseliminatedagainstthegrosscarryingamountoftheasset.
this amendment is not expected to have any significant impact on the financial statements of the Group.
• FRS 24 Related Party Disclosures (effective for annual periods beginning on or after 1 July 2014)
the standard is amended to include, as a related party, an entity that provides key management personnel services to the reporting entity or to the parent of the reporting entity (‘the management entity’).
the reporting entity is not required to disclose the compensation paid by the management entity to the management entity’s employees or directors, but it is required to disclose the amounts charged to the reporting entity by the management entity for services provided.
this amendment will not result in any changes to the Group’s accounting policies but will require more disclosures in the financial statements.
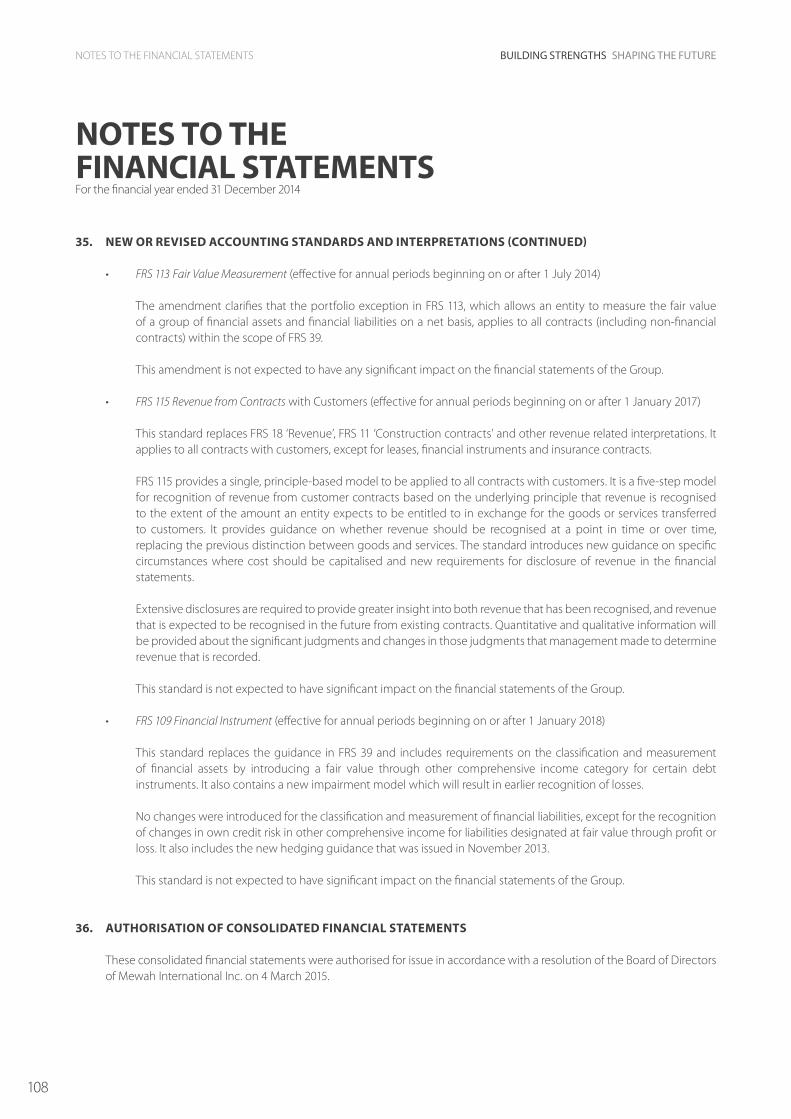
108
NOTES TO THE FINANCIAL STATEMENTSFor the financial year ended 31 December 2014
NOTES TO THE FINANCIAL STATEMENTS Building StrengthS Shaping the Future
35. neW or revISeD aCCountInG StanDarDS anD InterpretatIonS (ContInueD)
• FRS 113 Fair Value Measurement (effective for annual periods beginning on or after 1 July 2014)
the amendment clarifies that the portfolio exception in FrS 113, which allows an entity to measure the fair value of a group of financial assets and financial liabilities on a net basis, applies to all contracts (including non-financial contracts) within the scope of FrS 39.
this amendment is not expected to have any significant impact on the financial statements of the Group.
• FRS 115 Revenue from Contracts with Customers (effective for annual periods beginning on or after 1 January 2017)
this standard replaces FrS 18 ‘revenue’, FrS 11 ‘Construction contracts’ and other revenue related interpretations. It applies to all contracts with customers, except for leases, financial instruments and insurance contracts.
FrS 115 provides a single, principle-based model to be applied to all contracts with customers. It is a five-step model for recognition of revenue from customer contracts based on the underlying principle that revenue is recognised to the extent of the amount an entity expects to be entitled to in exchange for the goods or services transferred to customers. It provides guidance on whether revenue should be recognised at a point in time or over time, replacing the previous distinction between goods and services. the standard introduces new guidance on specific circumstances where cost should be capitalised and new requirements for disclosure of revenue in the financial statements.
extensive disclosures are required to provide greater insight into both revenue that has been recognised, and revenue that is expected to be recognised in the future from existing contracts. Quantitative and qualitative information will be provided about the significant judgments and changes in those judgments that management made to determine revenue that is recorded.
this standard is not expected to have significant impact on the financial statements of the Group.
• FRS 109 Financial Instrument (effective for annual periods beginning on or after 1 January 2018)
this standard replaces the guidance in FrS 39 and includes requirements on the classification and measurement of financial assets by introducing a fair value through other comprehensive income category for certain debt instruments. It also contains a new impairment model which will result in earlier recognition of losses.
no changes were introduced for the classification and measurement of financial liabilities, except for the recognition of changes in own credit risk in other comprehensive income for liabilities designated at fair value through profit or loss. It also includes the new hedging guidance that was issued in november 2013.
this standard is not expected to have significant impact on the financial statements of the Group.
36. authorISatIon oF ConSoLIDateD FInanCIaL StateMentS
these consolidated financial statements were authorised for issue in accordance with a resolution of the Board of Directors of Mewah International Inc. on 4 March 2015.

109
NOTES TO THE FINANCIAL STATEMENTS
NOTES TO THE FINANCIAL STATEMENTSFor the financial year ended 31 December 2014
Mewah InternatIonal Inc. annual report 2014
37. LIStInG oF CoMpanIeS In the Group
name of companiesCountry of
incorporationprincipal activities
principal country of operation equity holding
2014%
2013%
Directly held by the Company
one Marthoma (CI) Inc. (k) Cayman Islands
Investment holding Cayman Islands
100 100
Subsidiaries of one Marthorma (CI) Inc.
Mewah oleo Malaysia Sdn Bhd (b) Malaysia Investment holding Malaysia 100 100
padat Gaya Sdn Bhd (c) Malaysia Investment holding Malaysia 100 100
MoI International (australia) pty Ltd (d) australia trading australia 83.4 83.4
agri Kurnia Sdn Bhd (b) Malaysia Investment holding Malaysia 100 100
Subsidiaries of Mewah oleo Malaysia Sdn Bhd
Mewah-oils Sdn Bhd (b) Malaysia Manufacturing and selling of palm oil products
Malaysia 100 100
ngo Chew Hong oils & Fats (M) Sdn Bhd (b) Malaysia refining and selling of palm oil products
Malaysia 100 100
Moi Foods Malaysia Sdn Bhd (b) Malaysia Manufacturing and selling of downstream
palm oil products
Malaysia 100 100
Container Fabricator (M) Sdn Bhd (b) Malaysia Manufacturing of plastic containers
Malaysia 100 100
Mewaholeo Marketing Sdn Bhd (b) Malaysia Selling of palm oil and palm oil related products
Malaysia 100 100
Batam Heights Sdn Bhd (b) Malaysia Dormant Malaysia 100 100
G & U Districenters (M) Sdn Bhd (b) Malaysia Dormant Malaysia 100 100
Bremfield Sdn Bhd (b) Malaysia Manufacturing and selling of palm oil products
Malaysia 100 100
Mitra valley Sdn Bhd (b),(p) Malaysia Dormant Malaysia 100 -

110
NOTES TO THE FINANCIAL STATEMENTSFor the financial year ended 31 December 2014
NOTES TO THE FINANCIAL STATEMENTS Building StrengthS Shaping the Future
name of companiesCountry of
incorporationprincipal activities
principal country of operation equity holding
2014%
2013%
associated company held by Mewah oleo Malaysia Sdn Bhd
prelude Gateway Sdn Bhd (b) Malaysia Freight forwarding, transportation,
warehousing and logistical services
Malaysia 49 49
Directly held by the Company
ngo Chew Hong Corporation pte Ltd (a) Singapore Investment holding Singapore 100 100
ngo Chew Hong Investment pte Ltd (a) Singapore Dormant Singapore 100 -
Subsidiaries of ngo Chew Hong Corporation pte Ltd
Mewah oils & Fats pte Ltd (a) Singapore trading of edible oils and providing commodity
brokerage service
Singapore 100 100
ngo Chew Hong edible oil pte Ltd (a) Singapore packaging and trading of edible oil
Singapore 100 100
MoI International (Singapore) pte Ltd (a) Singapore trading of edible oil products
Singapore 100 100
Mewah Brands (S) pte Ltd (a) Singapore to own brands used by related parties and group
corporations
Singapore 100 100
Moi Foods romania S.r.L. (k) romania trading romania 100 100
ngo Chew Hong Industries pte Ltd (a) Singapore Investment holding Singapore 100 100
ngo Chew Hong Investment pte Ltd (a) Singapore Dormant Singapore - 100
Mewah Commodities pte Ltd (a) Singapore Investment holding Singapore 100 100
37. LIStInG oF CoMpanIeS In the Group (ContInueD)

111
NOTES TO THE FINANCIAL STATEMENTS
NOTES TO THE FINANCIAL STATEMENTSFor the financial year ended 31 December 2014
Mewah InternatIonal Inc. annual report 2014
name of companiesCountry of
incorporationprincipal activities
principal country of operation equity holding
2014%
2013%
Subsidiaries of ngo Chew Hong Corporation pte Ltd (continued)
Krispi oil and Food products Marketing, Import, export trading Company (turkey) (k)
(50% equity held by Mewah Commodities pte Ltd and 50% equity held by ngo Chew Hong Corporation pte Ltd)
turkey trading turkey 100 100
MoI Foods Ivory Coast Limited (j),(t) Ivory Coast Import, export, distribution of rice &
other products
Ivory Coast 100 -
ngo Chew Hong edible oil Limited (s) (90% equity held by ngo Chew Hong Corporation pte Ltd and 10% equity held by Mewah Commodities pte Ltd)
nigeria Dormant nigeria 100 -
MoI Foods nigeria Limited (r)
(90% equity held by ngo Chew Hong Corporation pte Ltd and 10% equity held by Mewah Commodities pte Ltd)
nigeria Distribution nigeria 100 -
MoI Senegal SUarL (k) Senegal Dormant Senegal 100 -
Subsidiaries of Mewah Commodities pte Ltd
Krispi oil russia LLC (k) russia trading russia 100 100
Krispi oils poland Sp. z o.o (k)
(90% equity held by Mewah Commodities pte Ltd and 10% equity held by ngo Chew Hong Corporation pte Ltd)
poland trading poland 100 100
Moi Foods Belgium n.v. (k)
(90% equity held by Mewah Commodities pte Ltd and 10% equity held by ngo Chew Hong Corporation pte Ltd)
Belgium Investment holding Belgium 100 100
37. LIStInG oF CoMpanIeS In the Group (ContInueD)

112
NOTES TO THE FINANCIAL STATEMENTSFor the financial year ended 31 December 2014
NOTES TO THE FINANCIAL STATEMENTS Building StrengthS Shaping the Future
name of companiesCountry of
incorporationprincipal activities
principal country of operation equity holding
2014%
2013%
Subsidiaries of Moi Foods Belgium n.v.
Molly Foods bvba (o) Belgium trading and investment holding
Belgium 70 70
ngo Chew Hong edible oil Limited (s) (90% equity held by Moi Foods Belgium n.v. and 10% equity held by Mewah Commodities pte Ltd)
nigeria Dormant nigeria - 100
MoI Foods nigeria Limited (r)
(90% equity held by Moi Foods Belgium n.v. and 10% equity held by Mewah Commodities pte Ltd)
nigeria Distribution nigeria - 100
MoI Senegal SUarL (k) Senegal Dormant Senegal - 100
Subsidiary of Molly Foods bvba
Bloom Land enterprises Limited (o) Hong Kong providing commodity brokerage service
Hong Kong 70 70
Subsidiary of Bloom Land enterprises Limited
BeCe S.à.r.l. (o) togo trading togo 70 70
Subsidiaries of padat Gaya Sdn Bhd
Mewaholeo Industries Sdn Bhd (c) Malaysia refining and selling of palm oil products
Malaysia 100 100
Mewah Datu Sdn Bhd (c) Malaysia refining and selling of palm oil products
Malaysia 100 100
Kayumanis Warisan Sdn Bhd (b) Malaysia Dormant Malaysia 100 100
ratusan aman Kapital Sdn Bhd (b) Malaysia Dormant Malaysia 100 100
Subsidiaries of agri Kurnia Sdn Bhd
Mewah Dairies Sdn Bhd (b) Malaysia Manufacturing and selling of dairy-based products
Malaysia 100 100
37. LIStInG oF CoMpanIeS In the Group (ContInueD)
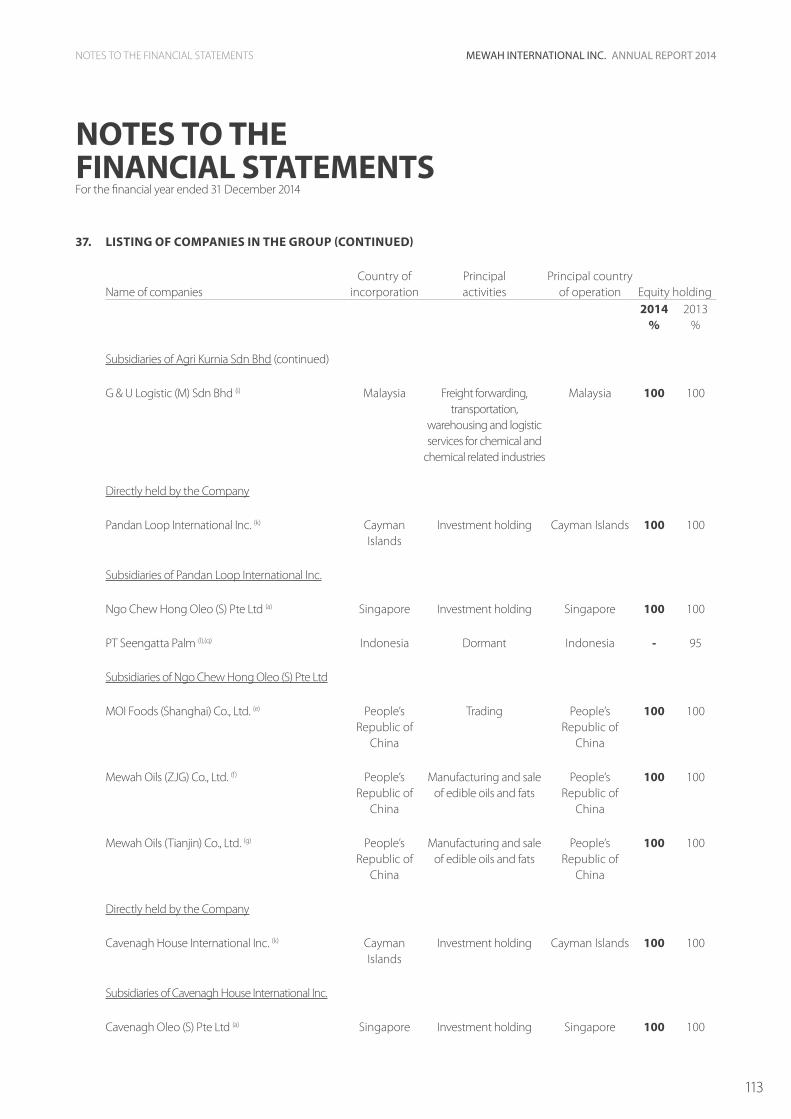
113
NOTES TO THE FINANCIAL STATEMENTS
NOTES TO THE FINANCIAL STATEMENTSFor the financial year ended 31 December 2014
Mewah InternatIonal Inc. annual report 2014
name of companiesCountry of
incorporationprincipal activities
principal country of operation equity holding
2014%
2013%
Subsidiaries of agri Kurnia Sdn Bhd (continued)
G & U Logistic (M) Sdn Bhd (i) Malaysia Freight forwarding, transportation,
warehousing and logistic services for chemical and
chemical related industries
Malaysia 100 100
Directly held by the Company
pandan Loop International Inc. (k) Cayman Islands
Investment holding Cayman Islands 100 100
Subsidiaries of pandan Loop International Inc.
ngo Chew Hong oleo (S) pte Ltd (a) Singapore Investment holding Singapore 100 100
pt Seengatta palm (l),(q) Indonesia Dormant Indonesia - 95
Subsidiaries of ngo Chew Hong oleo (S) pte Ltd
MoI Foods (Shanghai) Co., Ltd. (e) people’s republic of
China
trading people’s republic of
China
100 100
Mewah oils (ZJG) Co., Ltd. (f) people’s republic of
China
Manufacturing and sale of edible oils and fats
people’s republic of
China
100 100
Mewah oils (tianjin) Co., Ltd. (g) people’s republic of
China
Manufacturing and sale of edible oils and fats
people’s republic of
China
100 100
Directly held by the Company
Cavenagh House International Inc. (k) Cayman Islands
Investment holding Cayman Islands 100 100
Subsidiaries of Cavenagh House International Inc.
Cavenagh oleo (S) pte Ltd (a) Singapore Investment holding Singapore 100 100
37. LIStInG oF CoMpanIeS In the Group (ContInueD)

114
NOTES TO THE FINANCIAL STATEMENTSFor the financial year ended 31 December 2014
NOTES TO THE FINANCIAL STATEMENTS Building StrengthS Shaping the Future
name of companiesCountry of
incorporationprincipal activities
principal country of operation equity holding
2014%
2013%
Subsidiaries of Cavenagh oleo (S) pte Ltd
pt agro Murni (l) Indonesia Dormant Indonesia 95 95
pt timuran agro (l) Indonesia Dormant Indonesia 95 95
pt agro Indah (l)
(95% equity held by Cavenagh oleo (S) pte Ltd and 5% equity held by Cavenagh House International Inc.)
Indonesia Dormant Indonesia 100 100
pt Utara agro (l) Indonesia Dormant Indonesia 95 95
pt agro perkasa (l) Indonesia Dormant Indonesia 95 95
pt agro Harapan (l),(q)
(95% equity held by Cavenagh oleo (S) pte Ltd and 5% equity held by Cavenagh House International Inc.)
Indonesia Dormant Indonesia - 100
pt Mas Sejahtera (l),(q)
(95% equity held by Cavenagh oleo (S) pte Ltd and 5% equity held by Cavenagh House International Inc.)
Indonesia Dormant Indonesia - 100
pt Makmur Bestari (l),(q) Indonesia Dormant Indonesia - 95
pt Mas Bestari (l)
(95% equity held by Cavenagh oleo (S) pte Ltd and 5% equity held by Cavenagh House International Inc.)
Indonesia Dormant Indonesia 100 100
pt Fajar Bestari (l),(q)
(95% equity held by Cavenagh oleo (S) pte Ltd and 5% equity held by Cavenagh House International Inc.)
Indonesia Dormant Indonesia - 100
pt Sawit Bestari (l),(q) Indonesia Dormant Indonesia - 95
pt Mas Mewah (l)
(95% equity held by Cavenagh oleo (S) pte Ltd and 5% equity held by Cavenagh House International Inc.)
Indonesia Dormant Indonesia 100 100
37. LIStInG oF CoMpanIeS In the Group (ContInueD)

115
NOTES TO THE FINANCIAL STATEMENTS
NOTES TO THE FINANCIAL STATEMENTSFor the financial year ended 31 December 2014
Mewah InternatIonal Inc. annual report 2014
name of companiesCountry of
incorporationprincipal activities
principal country of operation equity holding
2014%
2013%
Subsidiaries of Cavenagh oleo (S) pte Ltd (continued)
pt Harapan Bestari (l)
(95% equity held by Cavenagh oleo (S) pte Ltd and 5% equity held by Cavenagh House International Inc.)
Indonesia Dormant Indonesia 100 100
pt agro Baiduri (l),(q) Indonesia Dormant Indonesia - 95
pt Usaha Bestari (l),(q) Indonesia Dormant Indonesia - 95
pt Usaha Lestari (l),(q) Indonesia Dormant Indonesia - 95
pt nilam Surya Harapan (l),(q) Indonesia Dormant Indonesia - 95
pt Usaha Surya (l)
(95% equity held by Cavenagh oleo (S) pte Ltd and 5% equity held by Cavenagh House International Inc.)
Indonesia Dormant Indonesia 100 100
pt nilam Surya perkasa (l),(q) Indonesia Dormant Indonesia - 95
pt nilam Surya Jaya (l) Indonesia Dormant Indonesia 100 95
pt nilam Harapan Gemilang (l),(q) (90% equity held by Cavenagh oleo (S) pte Ltd and 10% equity held by Cavenagh House International Inc.)
Indonesia Dormant Indonesia - 100
pt nilam Lestari (l),(q) (90% equity held by Cavenagh oleo (S) pte Ltd and 10% equity held by Cavenagh House International Inc.)
Indonesia Dormant Indonesia - 100
pt Gagasan perdana (l),(q)
(99% equity held by Cavenagh oleo (S) pte Ltd and 1% equity held by Mewah (HK) Ltd.)
Indonesia Dormant Indonesia - 100
37. LIStInG oF CoMpanIeS In the Group (ContInueD)

116
NOTES TO THE FINANCIAL STATEMENTSFor the financial year ended 31 December 2014
NOTES TO THE FINANCIAL STATEMENTS Building StrengthS Shaping the Future
37. LIStInG oF CoMpanIeS In the Group (ContInueD)
name of companiesCountry of
incorporationprincipal activities
principal country of operation equity holding
2014%
2013%
Directly held by the Company
Hua Guan Inc. (k) British virgin Islands
Investment holding British virgin Islands
100 100
Subsidiary of Hua Guan Inc.
Hua Guan oleo (S) pte Ltd (a) Singapore Investment holding Singapore 100 100
Subsidiaries of Hua Guan oleo (S) pte Ltd
Mewah oils India pvt Ltd (h)
(90% equity held by Hua Guan oleo (S) pte Ltd and 10% equity held by Hua Guan Inc.)
India trading India 100 100
MoI Commodities India pvt Ltd (n)
(90% equity held by Hua Guan oleo (S) pte Ltd and 10% equity held by Hua Guan Inc.)
India trading India 100 100
Mewah oils FZe (k) United arab emirates
Dormant United arab emirates
100 100
Directly held by the Company
Moi International Inc. (k) Mauritius Dormant Mauritius 100 100
Semenyih Inc. (k) CaymanIslands
Dormant CaymanIslands
100 100
Mewah (HK) Limited (m) Hong Kong Investment holding Hong Kong 100 100

117
NOTES TO THE FINANCIAL STATEMENTS
NOTES TO THE FINANCIAL STATEMENTSFor the financial year ended 31 December 2014
Mewah InternatIonal Inc. annual report 2014
37. LIStInG oF CoMpanIeS In the Group (ContInueD)
(a) Audited by PricewaterhouseCoopers LLP, Singapore (b) Audited by PricewaterhouseCoopers, Kuala Lumpur, Malaysia (c) Audited by PricewaterhouseCoopers, Johor Bahru, Malaysia(d) Audited by BDO Kendalls (QLD) Pty Ltd, Australia(e) Audited by Shanghai Shen Zhou Da Tong Certified Public Accountants Company Limited, People’s Republic of China(f) Audited by Suzhou Qinye Union Certified Public Accountants, People’s Republic of China(g) Audited by Tianjin Beiyang CPAs Co., Ltd., People’s Republic of China(h) Audited by Mehul D Chheda & Co, India(i) Audited by HALS & Associates, Malaysia(j) Incorporated during the financial year(k) Not required to be audited under the laws of the country of incorporation(l) Exempted from audit under the laws of the country of incorporation(m) Audited by Tony Kam & Co., Hong Kong(n) Audited by Kumar Vijay Gupta & Co., India(o) In the process of liquidation(p) Acquired under common control during the financial year(q) Liquidated during the financial year(r) Audited by AB Bello & Co, Port Harcourt, Nigeria(s) Audited by Hamzat Subrair & Co, Lagos, Nigeria(t) In the process of appointing auditor
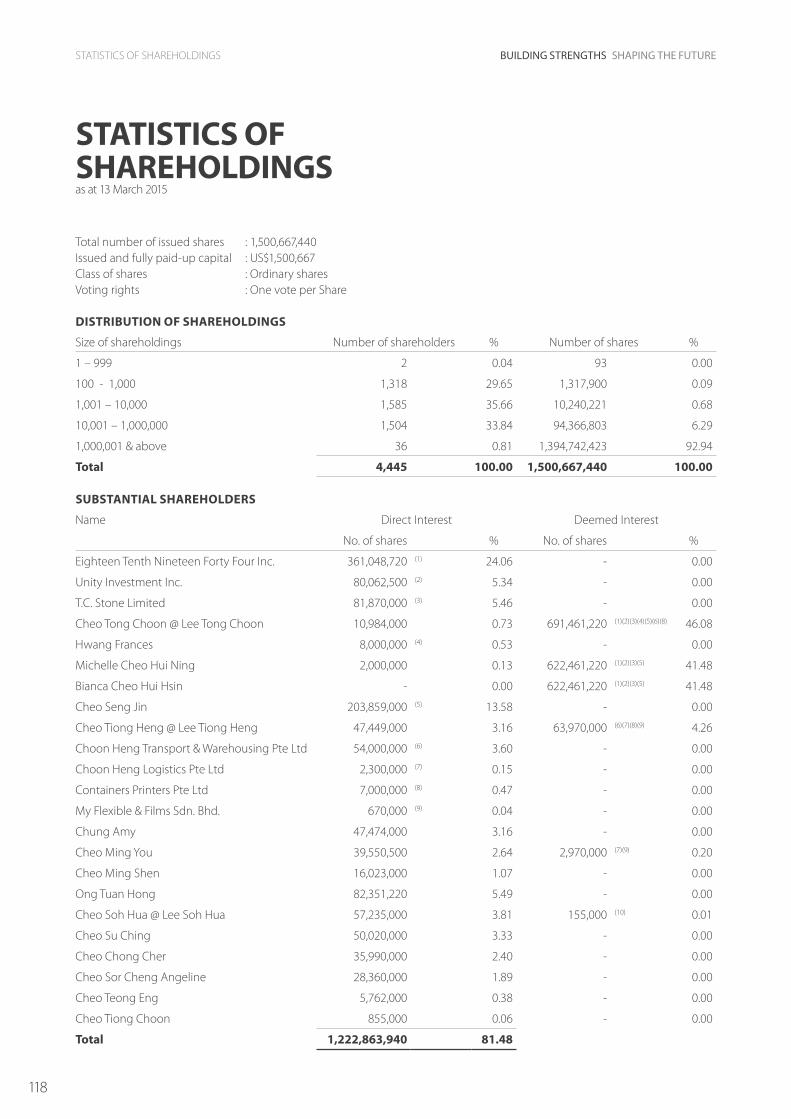
118
Building StrengthS Shaping the FutureStatIStICS oF SHareHoLDInGS
StatIStICS oFSharehoLDInGSas at 13 March 2015
total number of issued shares : 1,500,667,440Issued and fully paid-up capital : US$1,500,667Class of shares : ordinary sharesvoting rights : one vote per Share
DIStrIButIon oF SharehoLDInGS
Size of shareholdings number of shareholders % number of shares %
1 – 999 2 0.04 93 0.00
100 - 1,000 1,318 29.65 1,317,900 0.09
1,001 – 10,000 1,585 35.66 10,240,221 0.68
10,001 – 1,000,000 1,504 33.84 94,366,803 6.29
1,000,001 & above 36 0.81 1,394,742,423 92.94
total 4,445 100.00 1,500,667,440 100.00
SuBStantIaL SharehoLDerS
name Direct Interest Deemed Interest
no. of shares % no. of shares %
eighteen tenth nineteen Forty Four Inc. 361,048,720 (1) 24.06 - 0.00
Unity Investment Inc. 80,062,500 (2) 5.34 - 0.00
t.C. Stone Limited 81,870,000 (3) 5.46 - 0.00
Cheo tong Choon @ Lee tong Choon 10,984,000 0.73 691,461,220 (1)(2)(3)(4)(5)(6)(8) 46.08
Hwang Frances 8,000,000 (4) 0.53 - 0.00
Michelle Cheo Hui ning 2,000,000 0.13 622,461,220 (1)(2)(3)(5) 41.48
Bianca Cheo Hui Hsin - 0.00 622,461,220 (1)(2)(3)(5) 41.48
Cheo Seng Jin 203,859,000 (5) 13.58 - 0.00
Cheo tiong Heng @ Lee tiong Heng 47,449,000 3.16 63,970,000 (6)(7)(8)(9) 4.26
Choon Heng transport & Warehousing pte Ltd 54,000,000 (6) 3.60 - 0.00
Choon Heng Logistics pte Ltd 2,300,000 (7) 0.15 - 0.00
Containers printers pte Ltd 7,000,000 (8) 0.47 - 0.00
My Flexible & Films Sdn. Bhd. 670,000 (9) 0.04 - 0.00
Chung amy 47,474,000 3.16 - 0.00
Cheo Ming You 39,550,500 2.64 2,970,000 (7)(9) 0.20
Cheo Ming Shen 16,023,000 1.07 - 0.00
ong tuan Hong 82,351,220 5.49 - 0.00
Cheo Soh Hua @ Lee Soh Hua 57,235,000 3.81 155,000 (10) 0.01
Cheo Su Ching 50,020,000 3.33 - 0.00
Cheo Chong Cher 35,990,000 2.40 - 0.00
Cheo Sor Cheng angeline 28,360,000 1.89 - 0.00
Cheo teong eng 5,762,000 0.38 - 0.00
Cheo tiong Choon 855,000 0.06 - 0.00
total 1,222,863,940 81.48

119
Mewah InternatIonal Inc. annual report 2014StatIStICS oF SHareHoLDInGS
StatIStICS oFSharehoLDInGSas at 13 March 2015
(1) the shareholders of eighteen tenth nineteen Forty Four Inc. include Dr t.C. pierre (Cayman Islands) Inc. (86.2%) which is wholly owned by SG Hambros trust Company (Channel Islands) Limited as trustee of the peter Strong Spring MD trust for its beneficiaries, including Michelle Cheo Hui ning and Bianca Cheo Hui Hsin. Cheo tong Choon @ Lee tong Choon is the Settlor of the trust.
(2) the shareholders of Unity Investment Inc. include Dr t.C. pierre (Cayman Islands) Inc. (52.0%) which is wholly owned by SG Hambros trust Company (Channel Islands) Limited as trustee of the peter Strong Spring MD trust for its beneficiaries, including Michelle Cheo Hui ning and Bianca Cheo Hui Hsin. Cheo tong Choon @ Lee tong Choon is the Settlor of the trust.
(3) the shareholders of t.C. Stone Limited. is wholly owned by J.J. Mibisa Holdings (BvI) Inc. which in turn is wholly owned by SG Hambros trust Company (Channel Islands) Limited as trustee of the peter Strong Spring MD trust for its beneficiaries, including Michelle Cheo Hui ning and Bianca Cheo Hui Hsin. Cheo tong Choon @ Lee tong Choon is the Settlor of the trust.
(4) Hwang Frances is the wife of Cheo tong Choon @ Lee tong Choon.
(5) Cheo Seng Jin has assigned voting right of 99,480,000 shares to SG Hambros trust Company (Channel Islands) Limited as trustee of the peter Strong Spring MD trust for its beneficiaries, including Michelle Cheo Hui ning and Bianca Cheo Hui Hsin. Cheo tong Choon @ Lee tong Choon is the Settlor of the trust.
(6) Choon Heng transport & Warehousing pte Ltd is wholly owned by Cheo Holdings pte. Ltd. the shareholders of Cheo Holdings pte. Ltd. include Cheo tiong Heng @ Lee tiong Heng (69%) and J.J. Mibiansa Holdings pte Ltd (25%) which is wholly-owned by Cheo tong Choon @ Lee tong Choon.
(7) Choon Heng Logistics pte Ltd is held by Cheo tiong Heng @ Lee tiong Heng (25%) and Cheo Ming You (Shi Ming You) (75%).
(8) Containers printers pte Ltd is wholly owned by Cheo Holdings pte Ltd. the shareholders of Cheo Holdings pte. Ltd. include Cheo tiong Heng @ Lee tiong Heng (69%) and J.J. Mibiansa Holdings pte Ltd (25%) which is wholly-owned by Cheo tong Choon @ Lee tong Choon.
(9) My Flexible & Films Sdn Bhd is held by Cheo tiong Heng @ Lee tiong Heng (50%) and Cheo Ming You (Shi Ming You) (50%).
(10) Shares are held by Cheo Soh Hua @ Lee Soh Hua’s husband.

120
Building StrengthS Shaping the FutureStatIStICS oF SHareHoLDInGS
StatIStICS oFSharehoLDInGSas at 13 March 2015
tWentY LarGeSt SharehoLDerS aS at 13 MarCh 2015
name number of shares %
raffles nominees (pte) Limited 294,662,123 19.64
UoB Kay Hian private Limited 261,660,258 17.44
Bnp paribas nominees Singapore pte Ltd 160,672,000 10.71
DBS nominees (private) Limited 122,046,400 8.13
United overseas Bank nominees (private) Limited 101,510,300 6.76
DB nominees (Singapore) pte Ltd 90,340,670 6.02
Choon Heng transport & Warehousing pte Ltd 54,000,000 3.60
HSBC (Singapore) nominees pte Ltd 41,829,080 2.79
Chung amy 39,772,000 2.65
Cheo Ming You (Shi Ming You) 39,550,500 2.64
Cheo tiong Heng @ Lee tiong Heng 37,449,000 2.50
phillip Securities pte Ltd 21,425,100 1.43
Citibank nominees Singapore pte Ltd 21,390,192 1.43
tsao Chin Mey Jimmy 15,000,000 1.00
Cheo Ming Shen @tong Ming Shen 12,000,000 0.80
Cheo tong Choon @ Lee tong Choon 10,984,000 0.73
Hwang Frances 8,000,000 0.53
providence HGF3 Limited 7,932,000 0.53
Goi Seng Hui 7,666,000 0.51
Containers printers pte Ltd 7,000,000 0.47
total 1,354,889,623 90.31
SharehoLDInG heLD BY the puBLIC
Based on the information available to the Company as at 13 March 2015, approximately 18.5% of the issued shares of the Company are held by the public. accordingly, the Company has complied with the rules 1207 and 723 of the Listing Manual of the Singapore exchange Securities trading Limited.

121
Mewah InternatIonal Inc. annual report 2014notICe oF annUaL GeneraL MeetInG
notICe oFannuaL GeneraL MeetInG
notICe IS HereBY GIven that the annual General Meeting of MeWaH InternatIonaL InC. (“Company”) will be held at the Chevrons, violet room, Level 3, 48 Boon Lay Way, Singapore 609961 on tuesday, 28 april 2015 at 10.30 a.m. for the following purposes:
aS orDInarY BuSIneSS
1. to receive and adopt the Directors’ report and the audited accounts of the Company and its subsidiaries for the financial year ended 31 December 2014 together with the auditors’ report thereon. (resolution 1)
2. to declare a Final Dividend of S$0.017 per ordinary share for the financial year ended 31 December 2014. (resolution 2)
3. to note the retirement of Mr Lim How teck, a Director retiring pursuant to article 86(1) of the Company’s articles of association, who will not be seeking re-election. [See explanatory note (i)] (resolution 3)
4. to note the retirement of Mr Giam Chin toon, a Director retiring pursuant to Section 153(6) of the Companies act, Cap. 50, who will not be seeking re-election. [See explanatory note (ii)] (resolution 4)
5. to re-appoint Dr Cheo tong Choon @ Lee tong Choon as a Director of the Company pursuant to Section 153(6) of the Companies act, Cap. 50, to hold office from the conclusion of this annual General Meeting until the next annual General Meeting. (resolution 5)
6. to re-appoint tan Sri Dato’ Ir Muhammad radzi Bin Haji Mansor as a Director of the Company pursuant to Section 153(6) of the Companies act, Cap. 50, to hold office from the conclusion of this annual General Meeting until the next annual General Meeting. [See explanatory note (iii)] (resolution 6)
7. to re-appoint tan Sri Datuk Dr ong Soon Hock as a Director of the Company pursuant to Section 153(6) of the Companies act, Cap. 50, to hold office from the conclusion of this annual General Meeting until the next annual General Meeting. [See explanatory note (iv)] (resolution 7)
8. to approve the appointment of Mr robert Loke tan Cheng pursuant to article 85(1) of the Company’s articles of association as an Independent Director with effect from the conclusion of annual General Meeting of the Company on 28 april 2015. [See explanatory note (v)] (resolution 8)
9. to approve the appointment of Mr Foo Say Mui Bill pursuant to article 85(1) of the Company’s articles of association as an Independent Director with effect from the conclusion of annual General Meeting of the Company on 28 april 2015. [See explanatory note (vi)] (resolution 9)
10. to approve the payment of Directors’ Fees of S$254,666 (2014: S$240,000) for the financial year ending 31 December 2015 to be paid at the end of each quarter during the financial year. (resolution 10)
11. to re-appoint Messrs pricewaterhouseCoopers LLp as the Company’s auditors and to authorise the Directors to fix their remuneration. (resolution 11)
12. to transact any other ordinary business which may properly be transacted at an annual General Meeting.
aS SpeCIaL BuSIneSS
to consider and, if thought fit, to pass the following resolutions as ordinary resolutions, with or without modifications:
13. “that pursuant to rule 806 of the listing rules of the Singapore exchange Securities trading Limited (“SGX-St”), authority be and is hereby given to the Directors of the Company to:

122
Building StrengthS Shaping the FuturenotICe oF annUaL GeneraL MeetInG
notICe oFannuaL GeneraL MeetInG
(1) (i) issue shares in the capital of the Company (the “Shares”) (whether by way of rights, bonus or otherwise); and/or
(ii) make or grant offers, agreements or options that may or would require Shares to be issued, including but not limited to the creation and issue of (as well as adjustments to) warrants, debentures or other instruments convertible into Shares (collectively, the “Instruments”),
(2) (notwithstanding that the authority conferred by paragraph 1 of this resolution may have ceased to be in force) issue Shares in pursuance of any Instrument made or granted by the Directors while this resolution was in force,
at any time and from time to time upon such terms and conditions, whether for cash or otherwise, and for such purposes and to such persons as the Directors may think fit for the benefit of the Company, provided that:
a. the aggregate number of Shares to be issued pursuant to this resolution (including shares to be issued in pursuance of Instruments made or granted pursuant to this resolution) does not exceed fifty per cent. (50%) of the total number of issued Shares excluding treasury shares of the Company (as calculated in accordance with sub-paragraph b. below), of which the aggregate number of Shares to be offered other than on a pro-rata basis to shareholders of the Company (including Shares to be issued in pursuance of Instruments made or granted pursuant to this resolution) does not exceed twenty per cent. (20%) of the total number of issued Shares excluding treasury shares of the Company (as calculated in accordance with sub-paragraph b. below);
b. for the purpose of determining the aggregate number of Shares that may be issued under sub-paragraph a. above, the percentage of the total number of issued Shares excluding treasury shares shall be calculated based on the total number of issued Shares excluding treasury shares of the Company at the time of the passing of this resolution, after adjusting for:
(i) new Shares arising from the conversion or exercise of any convertible securities;
(ii) new Shares arising from exercise of share options or vesting of share awards outstanding or subsisting at the time of the passing of this resolution, provided the options or awards were granted in compliance with part vIII of Chapter 8 of the Listing Manual of the SGX-St; and
(iii) any subsequent bonus issue, consolidation or subdivision of Shares;
c. in exercising the authority conferred by this resolution, the Company shall comply with the provisions of the Listing Manual of the SGX-St for the time being in force (unless such compliance has been waived by the SGX-St) and the memorandum of association and Bye-laws for the time being of the Company; and
d. unless revoked or varied by the Company in general meeting, the authority conferred by this resolution shall continue in force until the conclusion of the next annual general meeting of the Company or the date by which the next annual general meeting of the Company is required to be held, whichever is the earlier, except that the Directors shall be authorised to allot and issue Shares pursuant to any Instrument made or granted by the Directors while this resolution was in force notwithstanding that such authority has ceased to be in force at the time of issue of such Shares.” [See explanatory note (vii)]. (resolution 12)
14. “that for the purposes of Chapter 9 of the Listing Manual (“Chapter 9”) of the SGX-St:
(1) approval be and is hereby given for the Company, its subsidiaries and associated companies that are considered to be “entities at risk” under Chapter 9, or any of them, to enter into any of the transactions falling within the types of interested person transactions described in the appendix to the annual report for the financial year 2014 (the “appendix”) with any party who is of the class of interested persons described in the appendix, provided that such transactions are made on normal commercial terms and in accordance with the review procedures for such interested person transactions (the “Mandate”);

123
Mewah InternatIonal Inc. annual report 2014notICe oF annUaL GeneraL MeetInG
notICe oFannuaL GeneraL MeetInG
(2) the approval given in paragraph (1) above shall, unless revoked or varied by the Company in general meeting, continue in force until the conclusion of the next annual General Meeting of the Company; and
(3) the Directors of the Company be and are hereby authorised to complete and do all such acts and things (including executing all such documents as may be required) as they may consider expedient or necessary or in the interests of the Company to give effect to the Mandate and/or this resolution.” [See explanatory note (viii)]. (resolution 13)
By order of the Board
abdul Jabbar Bin Karam DinCompany Secretary
Singapore, 10 april 2015
NOTICE OF BOOKS CLOSURE AND DATE OF PAYMENT OF FINAL DIVIDENDS
notICe IS HereBY GIven that the Share transfer Books and register of Members of Mewah International Inc. (the “Company”) will be closed from 5.00 pm on 5 May 2015 for the purpose of determining members’ entitlements to the final dividends.
Duly completed registrable transfers (in respect of shares not registered in the name of the Central Depository (pte) Ltd) together with all relevant documents of title thereto received not later than 5.00 pm on 5 May 2015 by the Company’s Singapore Share transfer agent, Boardroom Corporate & advisory Services pte. Ltd, 50 raffles place, #32-01 Singapore Land tower, Singapore 048623 will be registered in accordance with the Bye-Laws of the Company to determine members’ entitlements to such dividends.
the proposed dividends, if approved at the annual General Meeting to be held on 28 april 2015, will be paid on 12 May 2015.
explanatory notes:
(i) Upon his retirement, Mr Lim How teck will be relinquished as Chairman of the audit Committee and Members of the remuneration and nominating Committee.
(ii) Upon his retirement, Mr Giam Chin toon will be relinquished as the Lead Independent Director, Chairman of the remuneration and nominating Committee and Member of the audit Committee.
(iii) tan Sri Dato’ Ir Muhammad radzi Bin Haji Mansor, upon re-election as a Director of the Company, will remain as a member of the audit Committee, remuneration Committee and nominating Committee. tan Sri Dato’ Ir Muhammad radzi Bin Haji Mansor is an Independent Director.
(iv) tan Sri Datuk Dr ong Soon Hock, upon re-election as a Director of the Company, will remain as a member of the nominating Committee. tan Sri Datuk Dr ong Soon Hock is an Independent Director.
(v) Mr robert Loke tan Cheng, upon appointment as a Director of the Company will be the Chairman of the remuneration and nominating Committee and Member of the audit Committee. Mr robert Loke tan Cheng will be the Lead Independent Director.
(vi) Mr Foo Say Mui Bill, upon appointment as a Director of the Company will be the Chairman of the audit Committee and Members of the remuneration and nominating Committee. Mr Foo Say Mui Bill will be an Independent Director.

124
Building StrengthS Shaping the FuturenotICe oF annUaL GeneraL MeetInG
notICe oFannuaL GeneraL MeetInG
(vii) the ordinary resolution 12 proposed in item 13. above, if passed, is to empower the Directors to issue shares in the capital of the Company and/or instruments (as defined above). the aggregate number of shares to be issued pursuant to resolution 12 (including shares to be issued in pursuance of instruments made or granted) shall not exceed fifty per cent. (50%) of the total number of issued shares excluding treasury shares of the Company, with a sub-limit of twenty per cent. (20%) for shares issued other than on a pro-rata basis (including shares to be issued in pursuance of instruments made or granted pursuant to this resolution) to shareholders with registered addresses in Singapore. For the purpose of determining the aggregate number of shares that may be issued, the percentage of the total number of issued shares excluding treasury shares of the Company will be calculated based on the total number of issued shares excluding treasury shares of the Company at the time of the passing of resolution 12, after adjusting for (i) new shares arising from the conversion or exercise of any convertible securities; (ii) new shares arising from exercise of share options or vesting of share awards outstanding or subsisting at the time of the passing of resolution 12, provided the options or awards were granted in compliance with part vIII of Chapter 8 of the Listing Manual of the SGX-St; and (iii) any subsequent bonus issue, consolidation or subdivision of shares.
(viii) the ordinary resolution 13 proposed in item 14. above, if passed, is to empower the Directors of the Company to continue to enter into interested person transactions, on the Group’s normal commercial terms and in accordance with the guidelines and procedures of the Company for interested person transactions as described in the appendix to Shareholders dated 10 april 2015. this authority will continue in force until the next annual General Meeting.
notes:
1. If a shareholder being a Depositor whose name appears in the Depository register (as defined in Section 130a of the Companies act, Cap. 50 of Singapore) wishes to attend and vote at the annual General Meeting, then he/she should complete the proxy Form and deposit the duly completed proxy Form at the office of the Singapore Share transfer agent, Boardroom Corporate & advisory Services pte. Ltd., at 50 raffles place, Singapore Land tower, #32-01 Singapore 048623, at least 48 hours before the time of the annual General Meeting.
2. If a Depositor wishes to appoint a proxy(ies), then the proxy Form must be deposited at the office of the Singapore Share transfer agent, Boardroom Corporate & advisory Services pte. Ltd., at 50 raffles place, Singapore Land tower, #32-01 Singapore 048623, at least 48 hours before the time of the annual General Meeting.
personal data privacy:
By submitting an instrument appointing a proxy(ies) and/or representative(s) to attend, speak and vote at the annual General Meeting and/or any adjournment thereof, a member of the Company (i) consents to the collection, use and disclosure of the member’s personal data by the Company (or its agents) for the purpose of the processing and administration by the Company (or its agents) of proxies and representatives appointed for the annual General Meeting (including any adjournment thereof) and the preparation and compilation of the attendance lists, minutes and other documents relating to the annual General Meeting (including any adjournment thereof), and in order for the Company (or its agents) to comply with any applicable laws, listing rules, regulations and/or guidelines (collectively, the “purposes”), (ii) warrants that where the member discloses the personal data of the member’s proxy(ies) and/or representative(s) to the Company (or its agents), the member has obtained the prior consent of such proxy(ies) and/or representative(s) for the collection, use and disclosure by the Company (or its agents) of the personal data of such proxy(ies) and/or representative(s) for the purposes, and (iii) agrees that the member will indemnify the Company in respect of any penalties, liabilities, claims, demands, losses and damages as a result of the member’s breach of warranty.

corPorateInforMatIon
DIrectorSDr Cheo Tong Choon @ Lee Tong Choon(Chairman and Executive Director)Ms Michelle Cheo Hui Ning (Executive Director andChief Executive Officer)Ms Bianca Cheo Hui Hsin (Executive Director)Ms Leong Choi Foong (Executive Director)Ms Wong Lai Wan (Executive Director)Mr Giam Chin Toon (Lead Independent Director)Tan Sri Dato’ Ir. Muhammad Radzi Bin Haji Mansor(Independent Director)Mr Lim How Teck (Independent Director)Tan Sri Datuk Dr Ong Soon Hock(Independent Director)
auDIt coMMItteeMr Lim How Teck (Chairman)Tan Sri Dato’ Ir. Muhammad Radzi Bin Haji MansorMr Giam Chin Toon
noMInatIng coMMItteeMr Giam Chin Toon (Chairman)Tan Sri Datuk Dr Ong Soon HockTan Sri Dato’ Ir. Muhammad Radzi Bin Haji MansorMr Lim How TeckDr Cheo Tong Choon @ Lee Tong Choon
reMuneratIon coMMItteeMr Giam Chin Toon (Chairman)Tan Sri Dato’ Ir. Muhammad Radzi Bin Haji MansorMr Lim How Teck
executIve offIcerSDr Cheo Tong Choon @ Lee Tong ChoonMs Michelle Cheo Hui NingMs Bianca Cheo Hui HsinMr Rajesh ChopraMr Shyam KumbhatMs Wong Lai WanMs Leong Choi FoongMs Agnes Lim Siew Choo
coMPany SecretaryMr Abdul Jabbar Bin Karam Din, LLB
coMPany regIStratIon nuMBerCR-166055
regIStereD offIceHarbour Place, 2nd Floor103 South Church StreetP.O. Box 472George TownGrand Cayman, KY1-1106Cayman Islands
PrIncIPal Place of BuSIneSS5 International Business Park#05-00 Mewah BuildingSingapore 609914
cayMan ISlanDS Share regIStrarTravers Thorp Alberga(formerly known as Thorp Alberga)1205A The Centrium60 Wyndham StreetCentral, Hong Kong
SIngaPore Share tranSfer agentBoardroom Corporate & Advisory Services Pte. Ltd.50 Raffles Place #32-01Singapore Land TowerSingapore 048623
auDItorSPricewaterhouseCoopers LLP8 Cross Street#17-00 PWC BuildingSingapore 048424Partner-in-charge: Ms Rebekah KhanDate of Appointment: 23 February 2010
PrIncIPal BankerS Alliance Bank Malaysia BerhadAmBank GroupArab Bank Corporation (B.S.C)Bangkok Bank BerhadBank of China (Malaysia) BerhadBNP Paribas, Singapore BranchCTBC Bank Co., Ltd., SingaporeCIMB Bank Berhad, Singapore BranchDBS Bank LtdDeutsche Bank (Malaysia) BerhadExport-Import Bank of Malaysia BerhadICICI Bank Limited, Singapore BranchOversea-Chinese Banking Corporation LimitedRHB Bank BerhadSociété Générale, Singapore BranchThe Bank of Nova Scotia Berhadunited Overseas Bank Limited

mEWah inTErnaTional inC.5 International Business Park,#05-00 Mewah BuildingSingapore 609914Tel : (65) 6829 5200Fax : (65) 6829 5160
Email: [email protected]