episode 4: production of 60, 000 mtpa of oleochemical methyl ester from rbd palm kernel oil
TRANSCRIPT
SAJJAD KHUDHUR ABBASChemical Engineering , Al-Muthanna University, IraqOil & Gas Safety and Health Professional – OSHACADEMYTrainer of Trainers (TOT) - Canadian Center of Human Development
Episode 4 : PRODUCTION OF 60, 000 MTPA OF OLEOCHEMICAL METHYL
ESTER FROM RBD PALM KERNEL OIL

WAN ADEEBAH WAN MAHMOOD
SITI IRHITH BUSHRAH NOOR MAHADI
SAJJAD KHUDHUR ABBAS
AIMAN MOHAMMED BELAL SIDAN
PRESENTED BY:
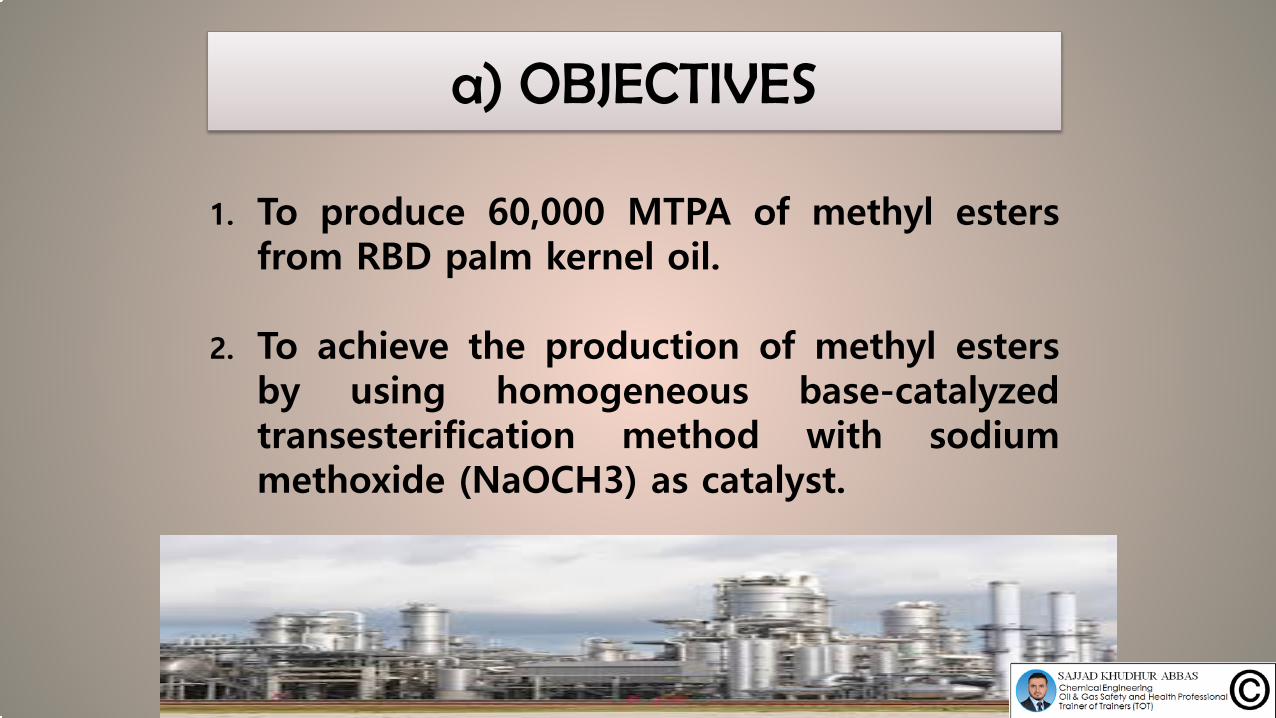
1. To produce 60,000 MTPA of methyl estersfrom RBD palm kernel oil.
2. To achieve the production of methyl estersby using homogeneous base-catalyzedtransesterification method with sodiummethoxide (NaOCH3) as catalyst.
a) OBJECTIVES
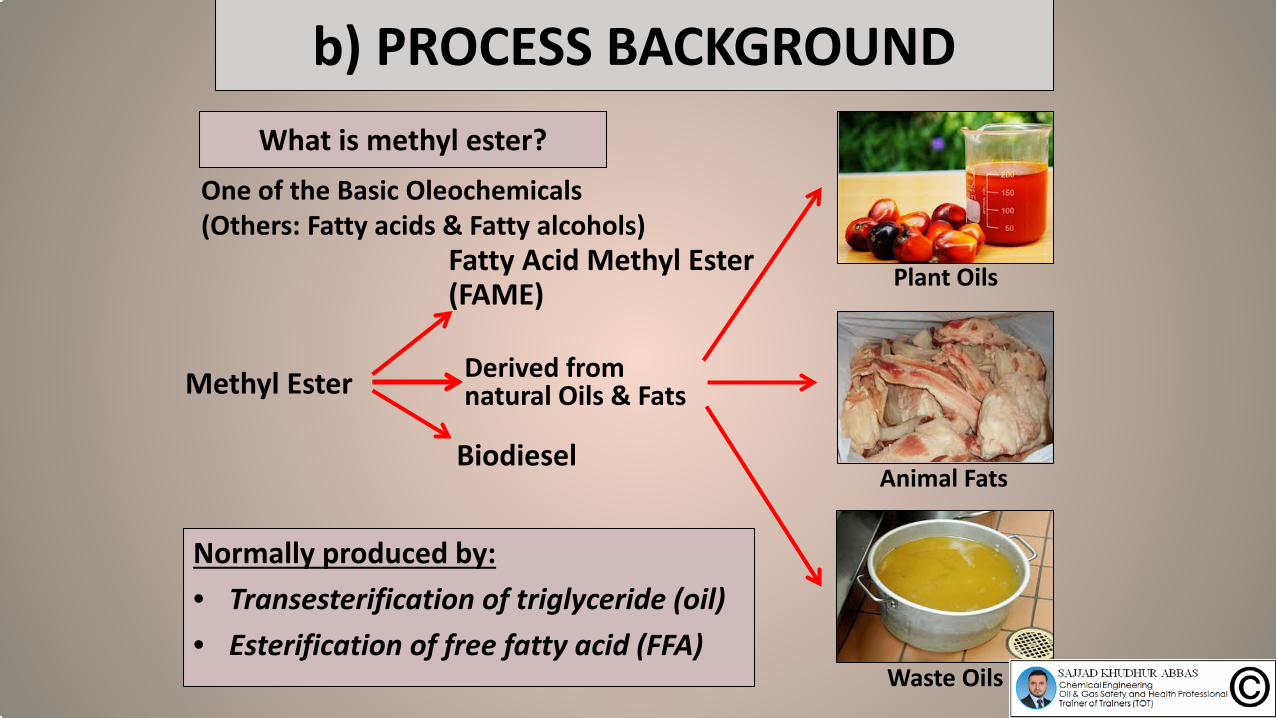
What is methyl ester?
Methyl Ester
4
Fatty Acid Methyl Ester (FAME)
Biodiesel
One of the Basic Oleochemicals(Others: Fatty acids & Fatty alcohols)
Derived from natural Oils & Fats
Plant Oils
Animal Fats
Waste Oils
Normally produced by:• Transesterification of triglyceride (oil)• Esterification of free fatty acid (FFA)
b) PROCESS BACKGROUND
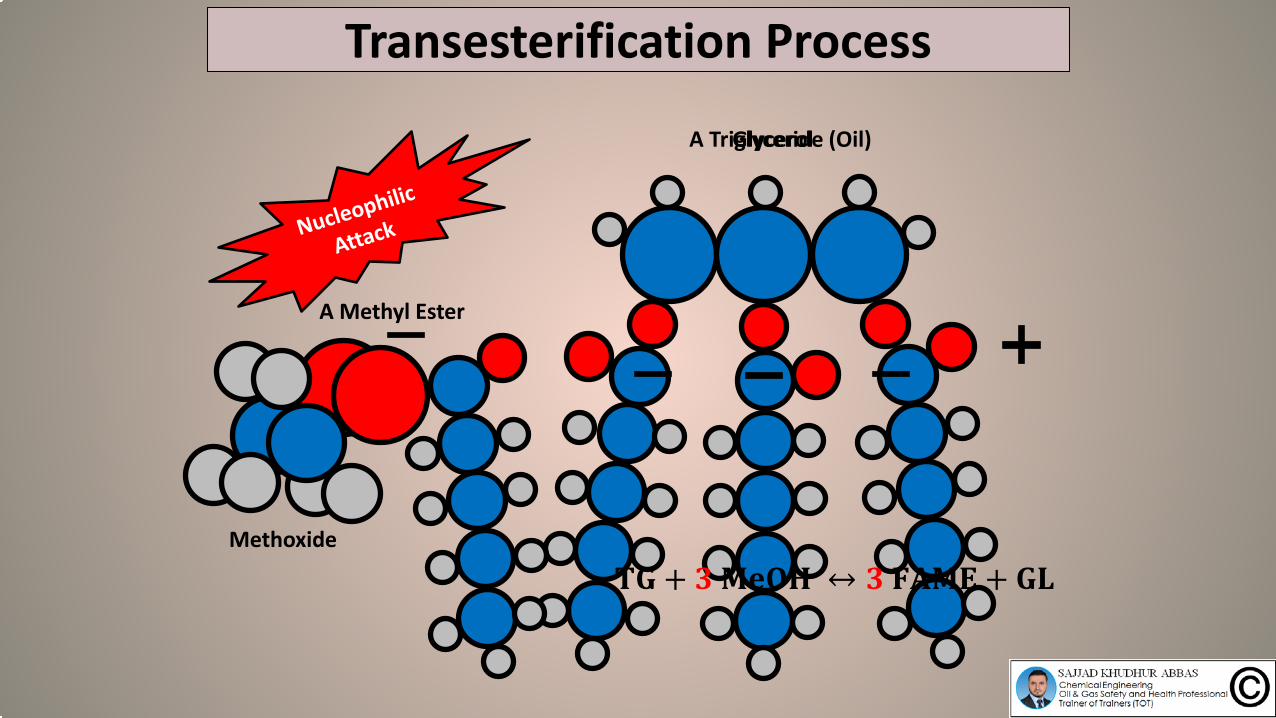
Transesterification Process
5
Methoxide
A Triglyceride (Oil)Glycerol
A Methyl Ester
𝐓𝐓𝐓𝐓 + 𝟑𝟑 𝐌𝐌𝐌𝐌𝐌𝐌𝐌𝐌 ↔ 𝟑𝟑 𝐅𝐅𝐅𝐅𝐌𝐌𝐅𝐅 + 𝐓𝐓𝐆𝐆
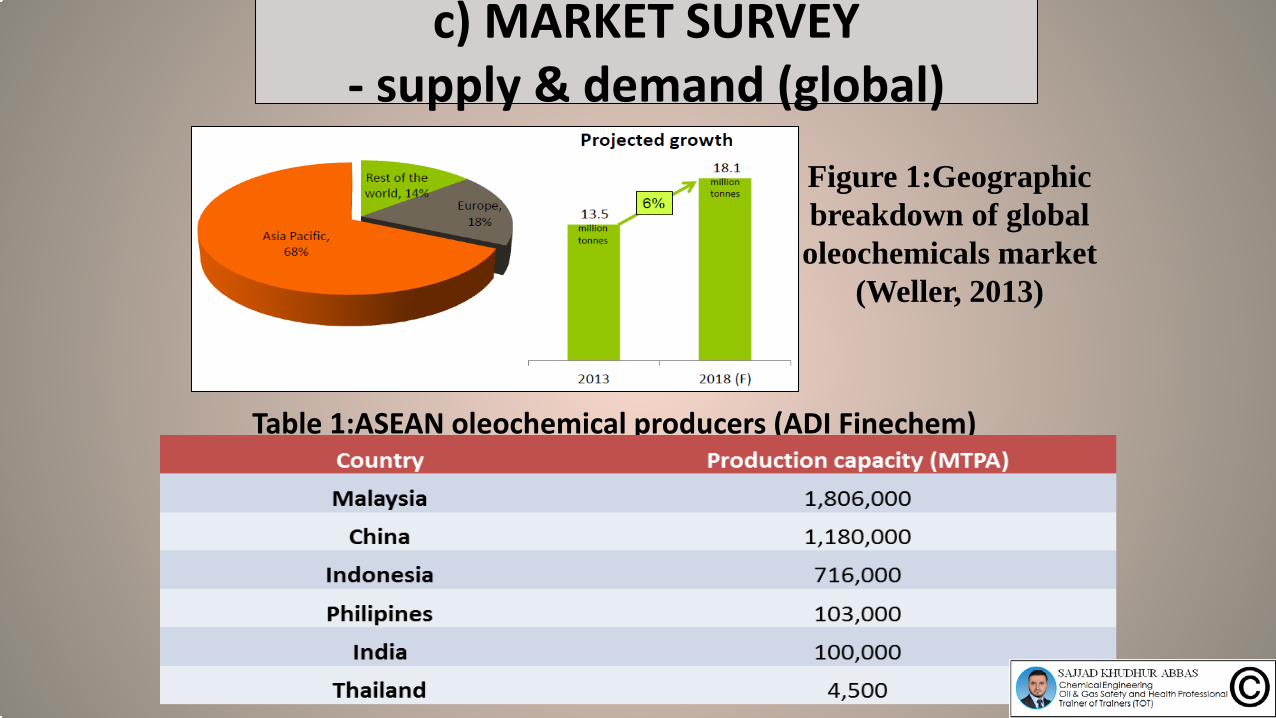
Figure 1:Geographic breakdown of global oleochemicals market
(Weller, 2013)
Table 1:ASEAN oleochemical producers (ADI Finechem) 2013)
c) MARKET SURVEY- supply & demand (global)
Novelty of Proposed Design
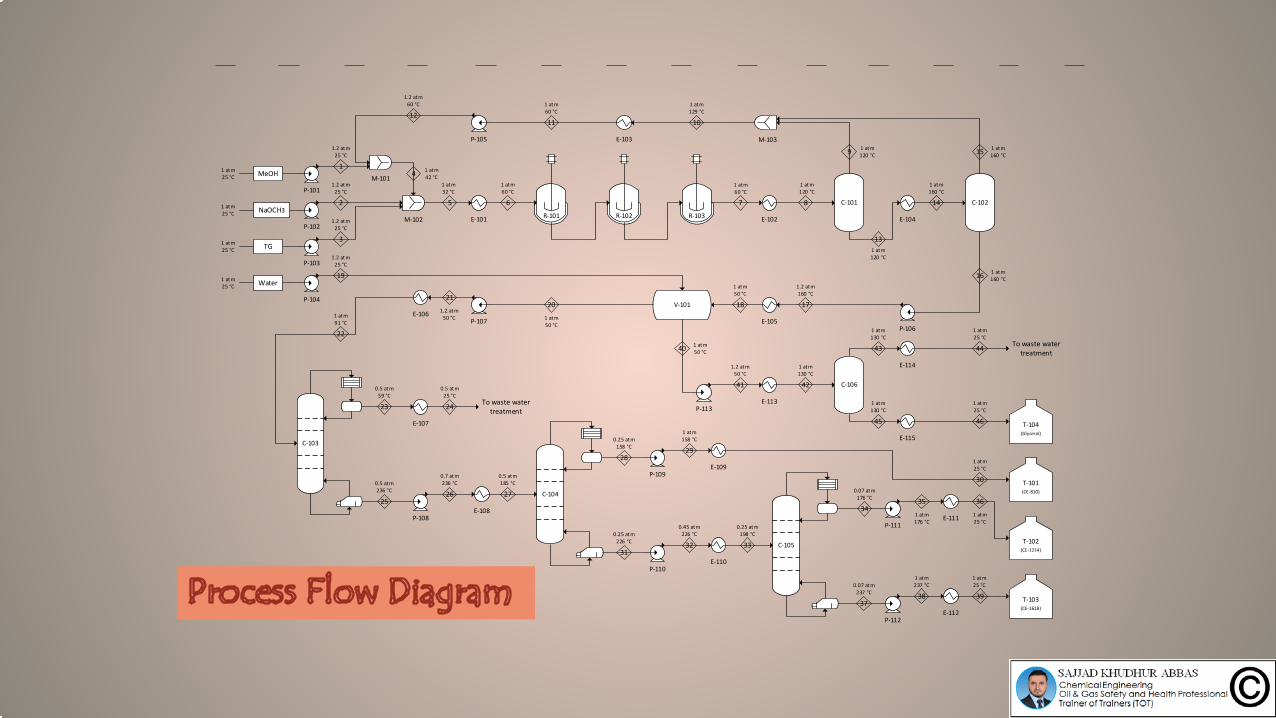
D) PROCESS FLOW DIAGRAM
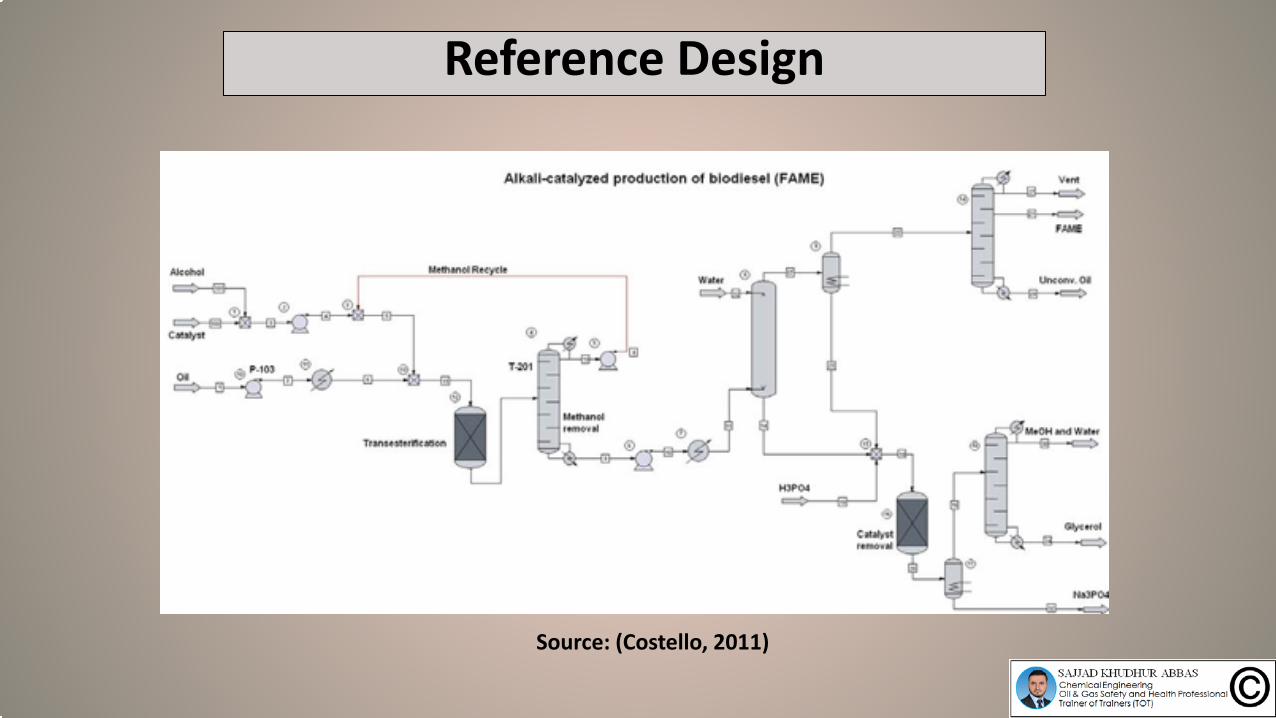
Reference Design
Source: (Costello, 2011)
P-101
P-102
P-103
P-104
M-101
E-101 E-102
E-103
E-104
E-105E-106
E-112
E-107
E-110
E-111
C-101
R-101
E-114
E-113
E-115
C-105
P-112
P-109
P-110
P-113
P-111
P-107
P-105
C-104
C-103
T-101(CE-810)
MeOH
NaOCH3
TG
Water
T-102(CE-1214)
T-103(CE-1618)
M-102 R-102 R-103
C-102
C-106
M-103
V-101
P-106
E-109
E-108P-108
T-104(Glycerol)
To waste water treatment
To waste water treatment
1 atm25 °C
1 atm25 °C
1 atm25 °C
1 atm25 °C
1.2 atm25 °C
1.2 atm25 °C
1.2 atm25 °C
1.2 atm25 °C
1 atm42 °C
1 atm32 °C
1 atm60 °C
1 atm120 °C
1 atm60 °C
1 atm120 °C
1 atm160 °C
1 atm160 °C
1 atm120 °C
1 atm160 °C
1 atm129 °C
1 atm60 °C
1.2 atm60 °C
1.2 atm160 °C
1 atm50 °C
1 atm50 °C
1.2 atm50 °C
1 atm130 °C
1 atm130 °C
1 atm130 °C
1 atm25 °C
1 atm25 °C
1 atm25 °C
1 atm25 °C
1 atm176 °C
0.07 atm176 °C
1 atm158 °C0.25 atm
158 °C
0.25 atm226 °C
0.45 atm226 °C
0.25 atm198 °C
0.07 atm237 °C
1 atm237 °C
1 atm25 °C
0.5 atm185 °C
0.7 atm236 °C0.5 atm
236 °C
0.5 atm25 °C
0.5 atm59 °C
1 atm91 °C
1.2 atm50 °C 1 atm
50 °C
R-1011st
Transesterification CSTR
R-1022nd
Transesterification CSTR
R-1033rd
Transesterification CSTR
C-1011st MeOH Evaporator
C-1022nd MeOH Evaporator
V-101ME Washing
Decanter
C-103ME Purification
Column
C-104CE-810 Vacuum
Column
C-105CE-1214 and
CE-1618 Splitter
C-106GL Purification
Column
T-101CE-810
Storage Tank
T-102CE-1214
Storage Tank
T-103CE-1618
Storage Tank
T-104GL Storage
Tank
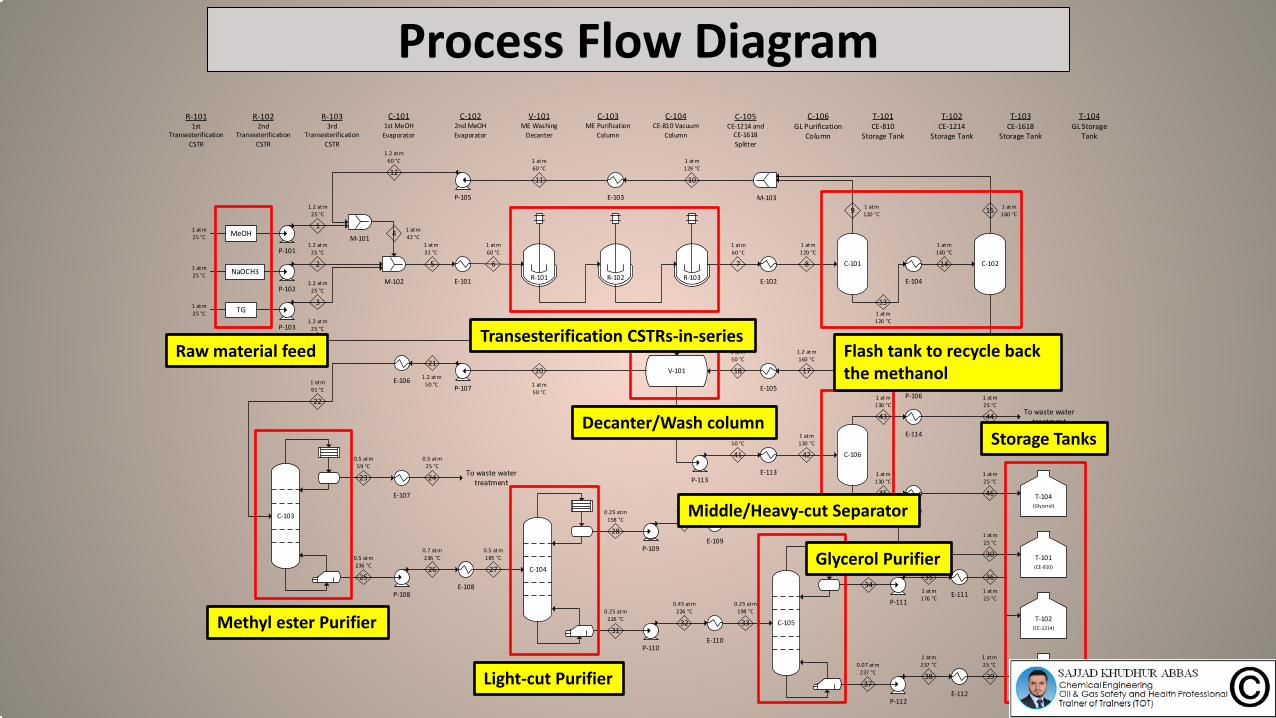
Process Flow Diagram
9
Raw material feed
Middle/Heavy-cut Separator
Transesterification CSTRs-in-series
Glycerol Purifier
Methyl ester Purifier
Storage Tanks
Light-cut Purifier
Flash tank to recycle back the methanol
Decanter/Wash column
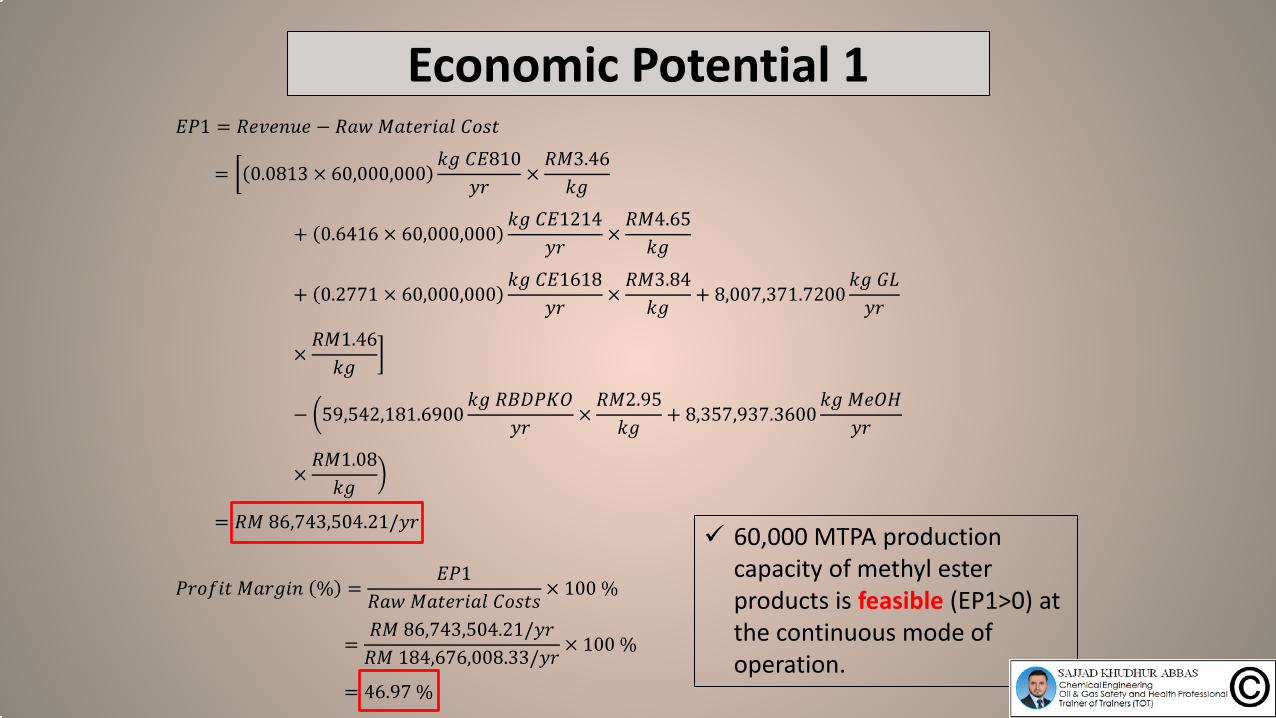
Economic Potential 1𝐸𝐸𝐸𝐸1 = 𝑅𝑅𝑅𝑅𝑅𝑅𝑅𝑅𝑅𝑅𝑅𝑅𝑅𝑅 − 𝑅𝑅𝑅𝑅𝑅𝑅 𝑀𝑀𝑅𝑅𝑀𝑀𝑅𝑅𝑀𝑀𝑀𝑀𝑅𝑅𝑀𝑀 𝐶𝐶𝐶𝐶𝐶𝐶𝑀𝑀
= �(0.0813 × 60,000,000)𝑘𝑘𝑘𝑘 𝐶𝐶𝐸𝐸810
𝑦𝑦𝑀𝑀×𝑅𝑅𝑀𝑀3.46𝑘𝑘𝑘𝑘
+ (0.6416 × 60,000,000)𝑘𝑘𝑘𝑘 𝐶𝐶𝐸𝐸1214
𝑦𝑦𝑀𝑀×𝑅𝑅𝑀𝑀4.65𝑘𝑘𝑘𝑘
+ (0.2771 × 60,000,000)𝑘𝑘𝑘𝑘 𝐶𝐶𝐸𝐸1618
𝑦𝑦𝑀𝑀×𝑅𝑅𝑀𝑀3.84𝑘𝑘𝑘𝑘
+ 8,007,371.7200𝑘𝑘𝑘𝑘 𝐺𝐺𝐺𝐺𝑦𝑦𝑀𝑀
×𝑅𝑅𝑀𝑀1.46𝑘𝑘𝑘𝑘
�
− �59,542,181.6900𝑘𝑘𝑘𝑘 𝑅𝑅𝑅𝑅𝑅𝑅𝐸𝐸𝑅𝑅𝑅𝑅
𝑦𝑦𝑀𝑀×𝑅𝑅𝑀𝑀2.95𝑘𝑘𝑘𝑘
+ 8,357,937.3600𝑘𝑘𝑘𝑘 𝑀𝑀𝑅𝑅𝑅𝑅𝑀𝑀
𝑦𝑦𝑀𝑀
×𝑅𝑅𝑀𝑀1.08𝑘𝑘𝑘𝑘
�
= 𝑅𝑅𝑀𝑀 86,743,504.21/𝑦𝑦𝑀𝑀
𝐸𝐸𝑀𝑀𝐶𝐶𝑃𝑃𝑀𝑀𝑀𝑀 𝑀𝑀𝑅𝑅𝑀𝑀𝑘𝑘𝑀𝑀𝑅𝑅 (%) =𝐸𝐸𝐸𝐸1
𝑅𝑅𝑅𝑅𝑅𝑅 𝑀𝑀𝑅𝑅𝑀𝑀𝑅𝑅𝑀𝑀𝑀𝑀𝑅𝑅𝑀𝑀 𝐶𝐶𝐶𝐶𝐶𝐶𝑀𝑀𝐶𝐶× 100 %
=𝑅𝑅𝑀𝑀 86,743,504.21/𝑦𝑦𝑀𝑀𝑅𝑅𝑀𝑀 184,676,008.33/𝑦𝑦𝑀𝑀
× 100 %
= 46.97 %
60,000 MTPA production capacity of methyl ester products is feasible (EP1>0) at the continuous mode of operation.
10
E) Process Selection
POSSIBLE PROCESSES FOR ME SYNTHESIS
• Micro-emulsion
• Pyrolysis (thermal cracking)
• Transesterification
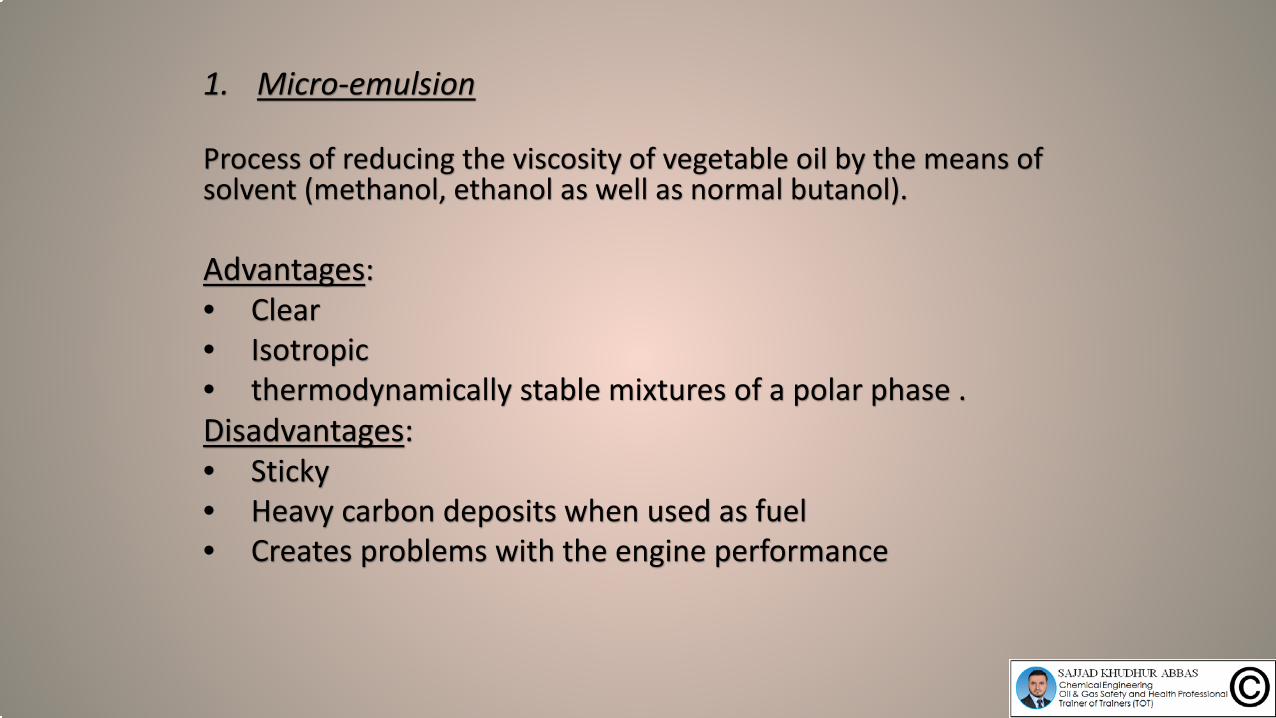
1. Micro-emulsion
Process of reducing the viscosity of vegetable oil by the means of solvent (methanol, ethanol as well as normal butanol).
Advantages:• Clear• Isotropic• thermodynamically stable mixtures of a polar phase .Disadvantages:• Sticky• Heavy carbon deposits when used as fuel • Creates problems with the engine performance
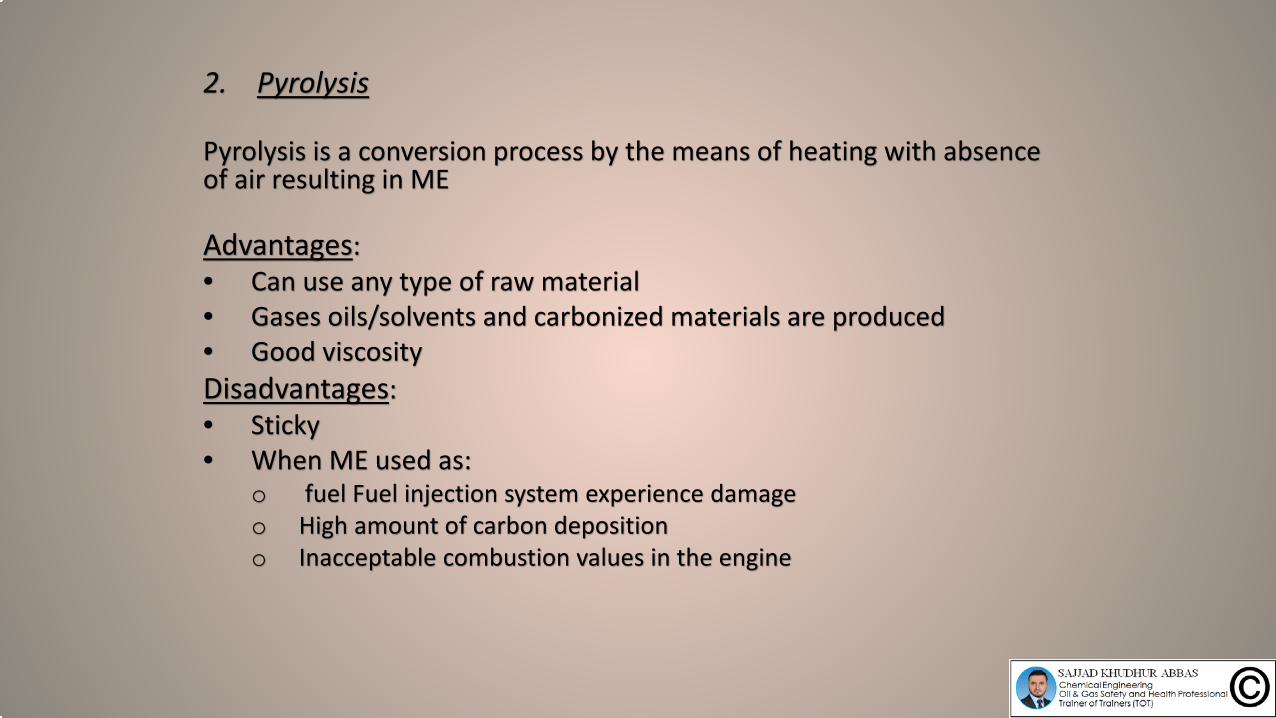
2. Pyrolysis
Pyrolysis is a conversion process by the means of heating with absence of air resulting in ME
Advantages:• Can use any type of raw material • Gases oils/solvents and carbonized materials are produced• Good viscosity Disadvantages:• Sticky • When ME used as:
o fuel Fuel injection system experience damage o High amount of carbon deposition o Inacceptable combustion values in the engine
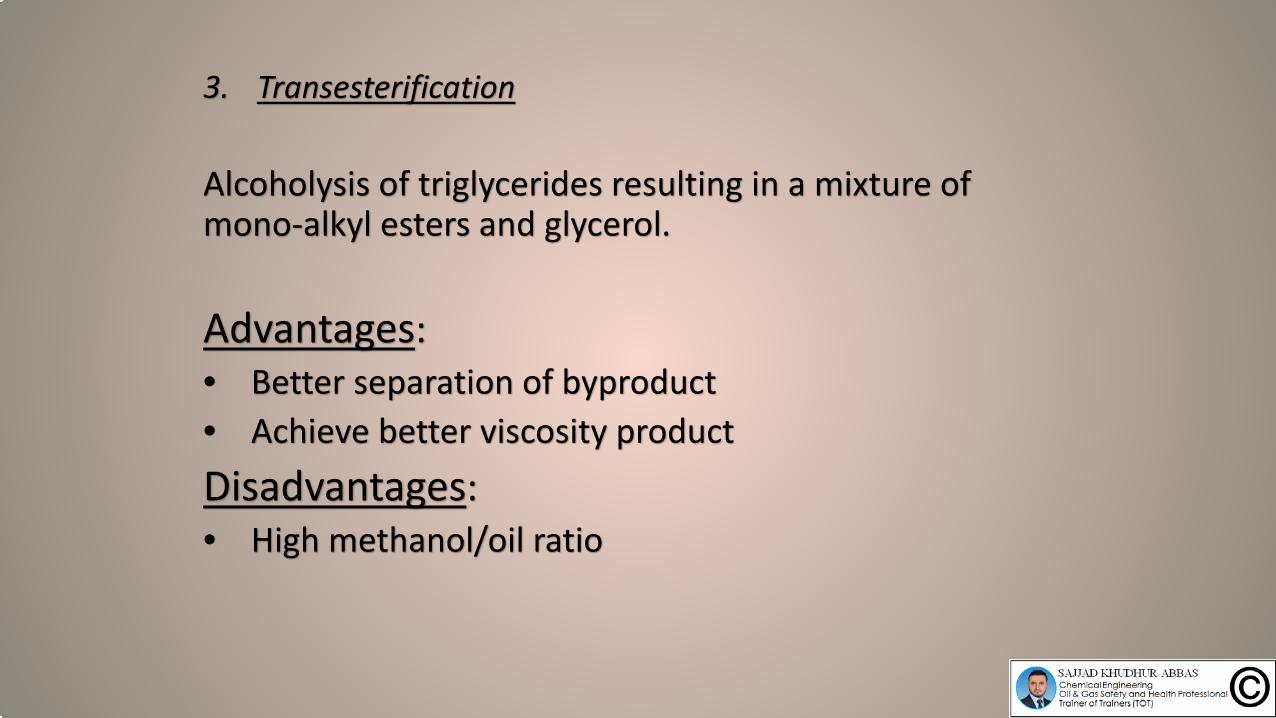
3. Transesterification
Alcoholysis of triglycerides resulting in a mixture of mono-alkyl esters and glycerol.
Advantages:• Better separation of byproduct• Achieve better viscosity product Disadvantages:• High methanol/oil ratio
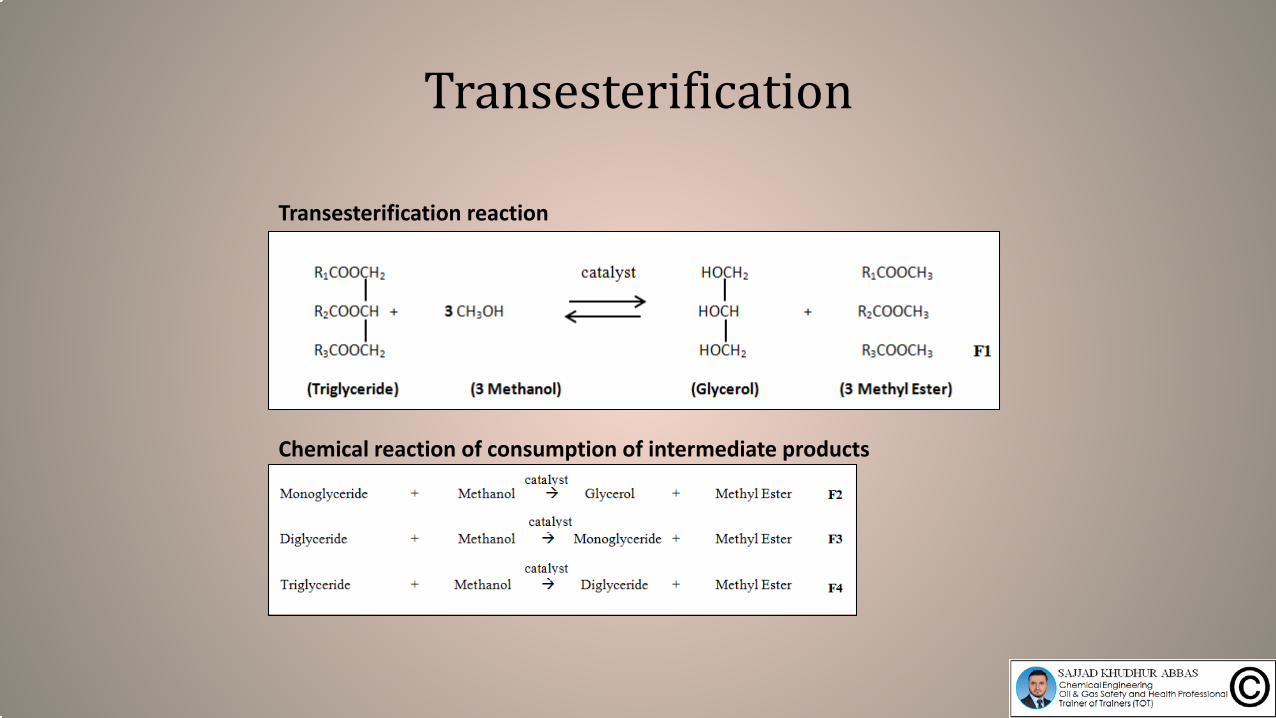
Transesterification
Transesterification reaction
Chemical reaction of consumption of intermediate products
Transesterification Catalysis
• Base catalyst
• Acid catalyst
• Enzyme catalyst
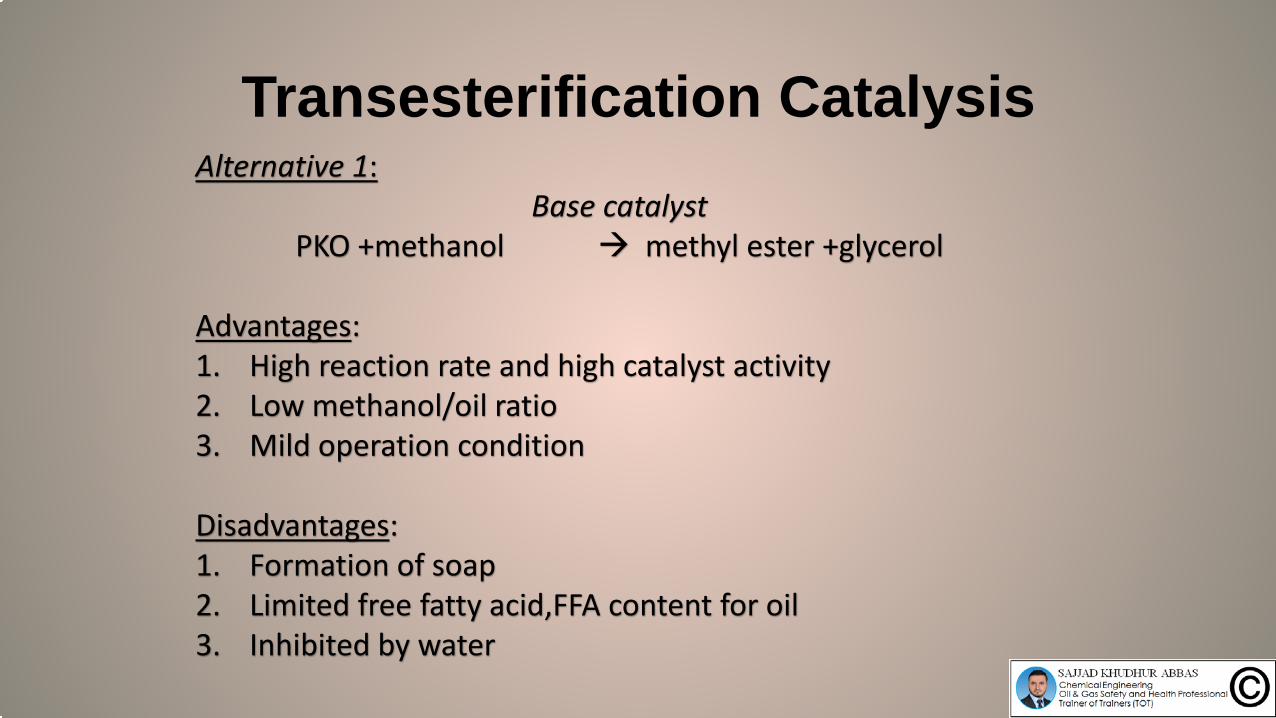
Transesterification Catalysis Alternative 1:
Base catalystPKO +methanol methyl ester +glycerol
Advantages:1. High reaction rate and high catalyst activity2. Low methanol/oil ratio3. Mild operation condition
Disadvantages:1. Formation of soap2. Limited free fatty acid,FFA content for oil3. Inhibited by water
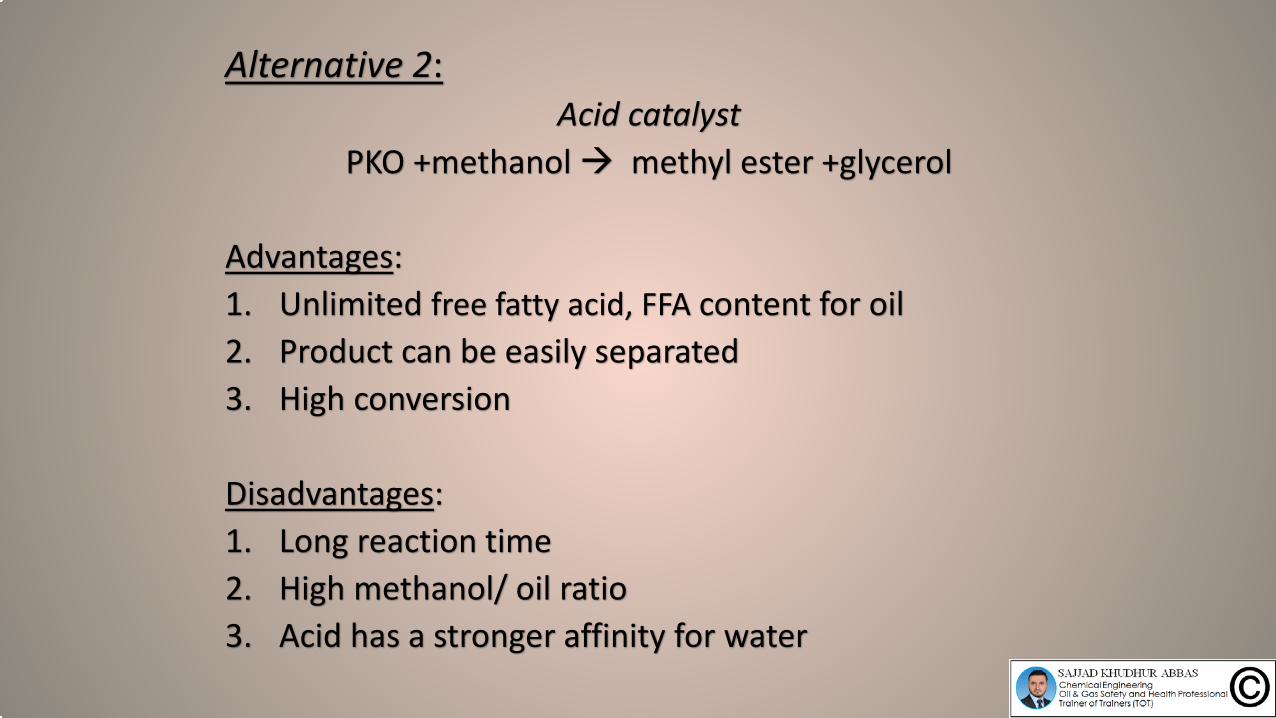
Alternative 2:Acid catalyst
PKO +methanol methyl ester +glycerol
Advantages:1. Unlimited free fatty acid, FFA content for oil2. Product can be easily separated3. High conversion
Disadvantages:1. Long reaction time2. High methanol/ oil ratio3. Acid has a stronger affinity for water
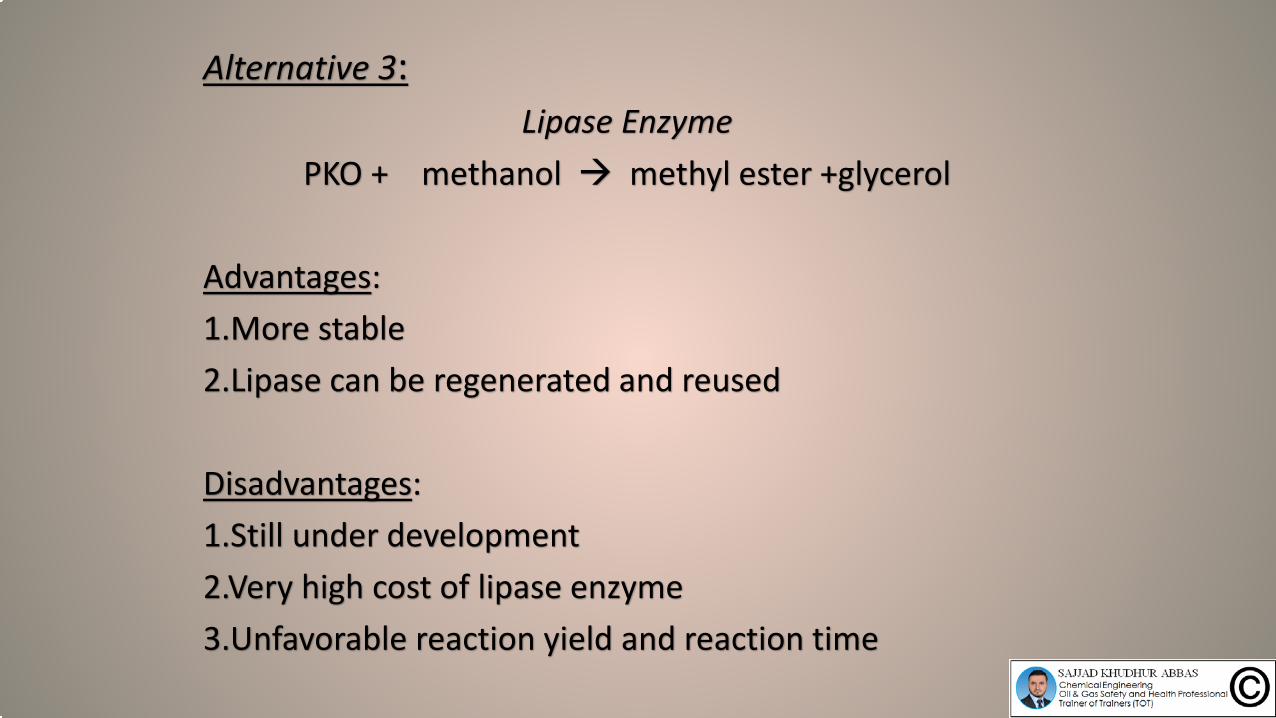
Alternative 3:Lipase Enzyme
PKO + methanol methyl ester +glycerol
Advantages:1.More stable2.Lipase can be regenerated and reused
Disadvantages:1.Still under development2.Very high cost of lipase enzyme3.Unfavorable reaction yield and reaction time
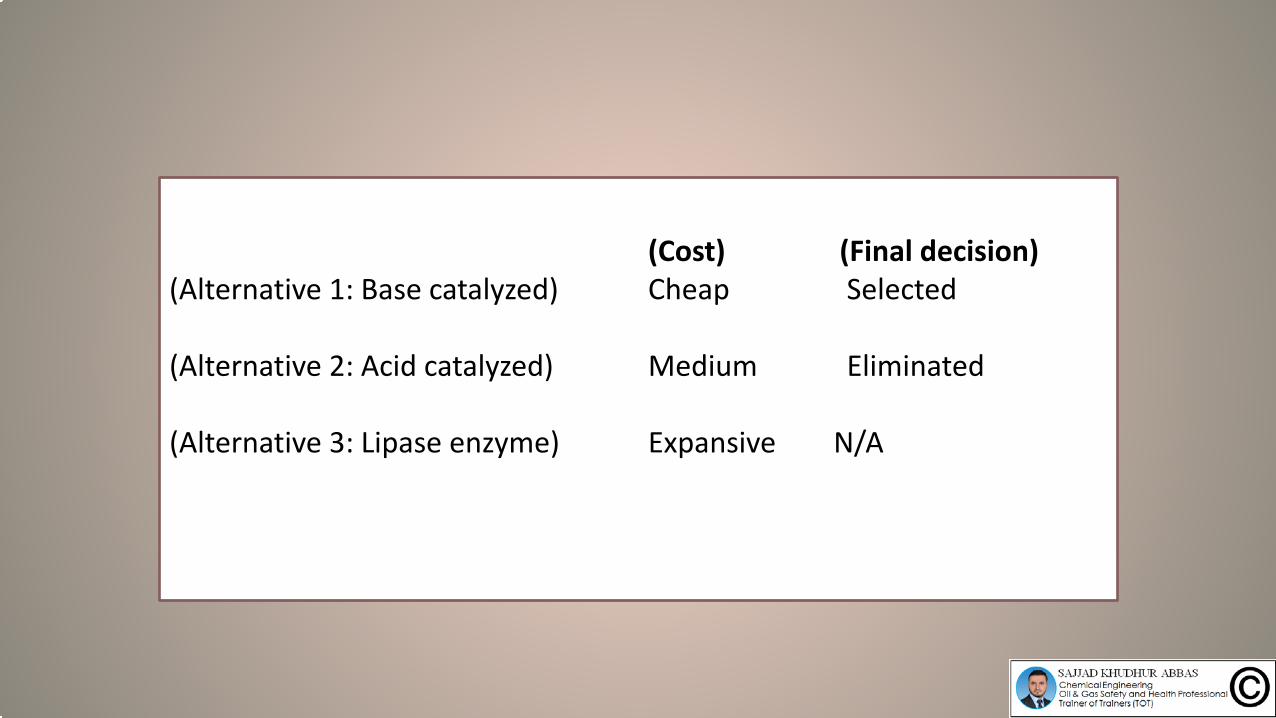
(Cost) (Final decision)(Alternative 1: Base catalyzed) Cheap Selected
(Alternative 2: Acid catalyzed) Medium Eliminated
(Alternative 3: Lipase enzyme) Expansive N/A
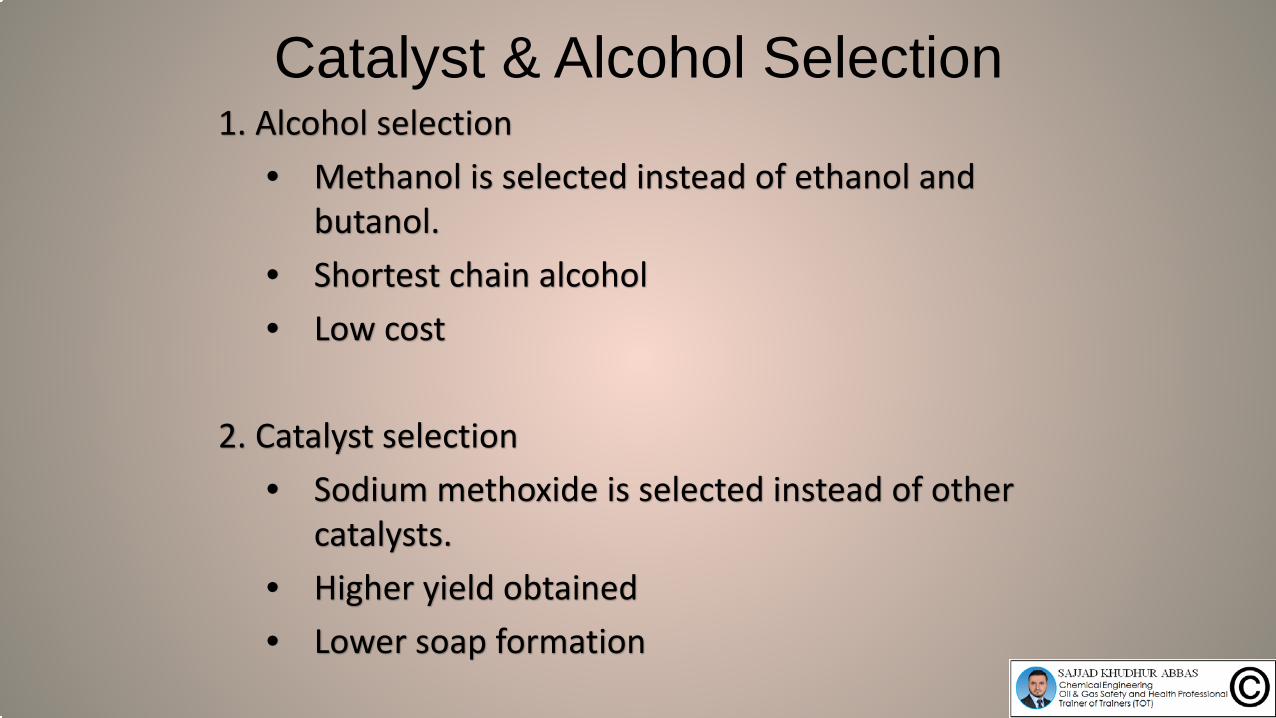
Catalyst & Alcohol Selection1. Alcohol selection
• Methanol is selected instead of ethanol and butanol.
• Shortest chain alcohol • Low cost
2. Catalyst selection• Sodium methoxide is selected instead of other
catalysts. • Higher yield obtained• Lower soap formation
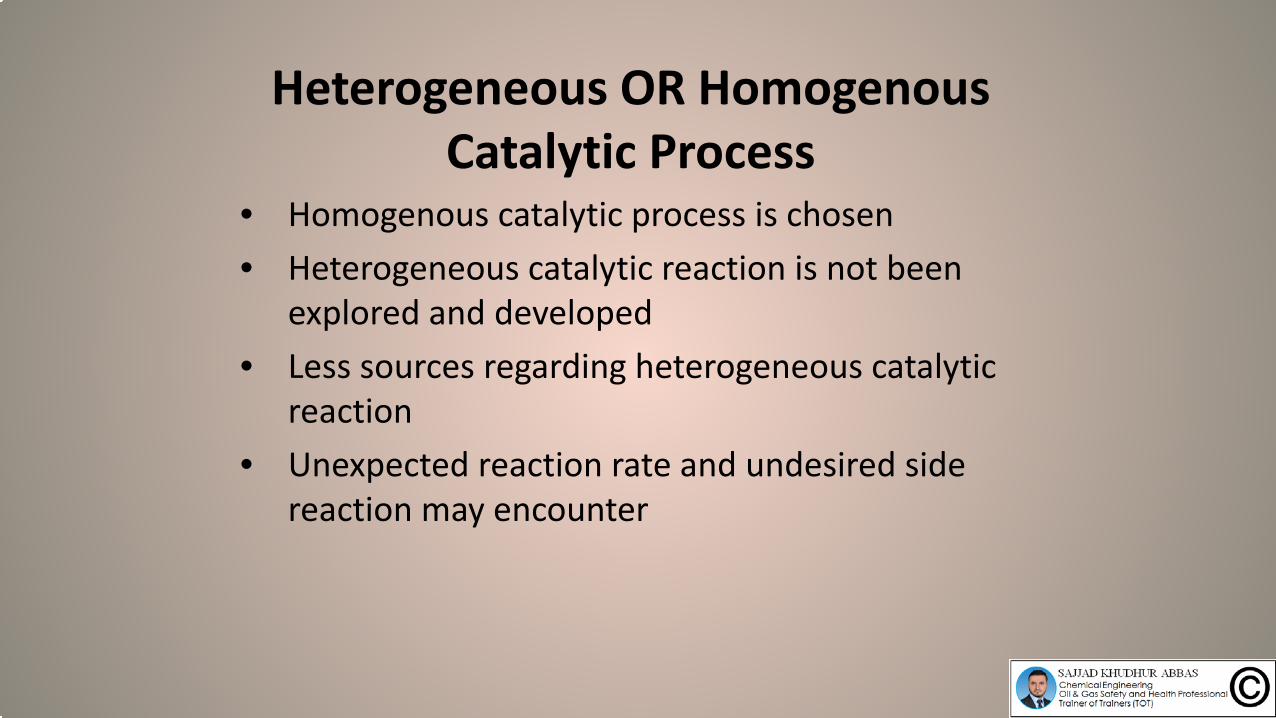
Heterogeneous OR Homogenous Catalytic Process
• Homogenous catalytic process is chosen• Heterogeneous catalytic reaction is not been
explored and developed • Less sources regarding heterogeneous catalytic
reaction • Unexpected reaction rate and undesired side
reaction may encounter
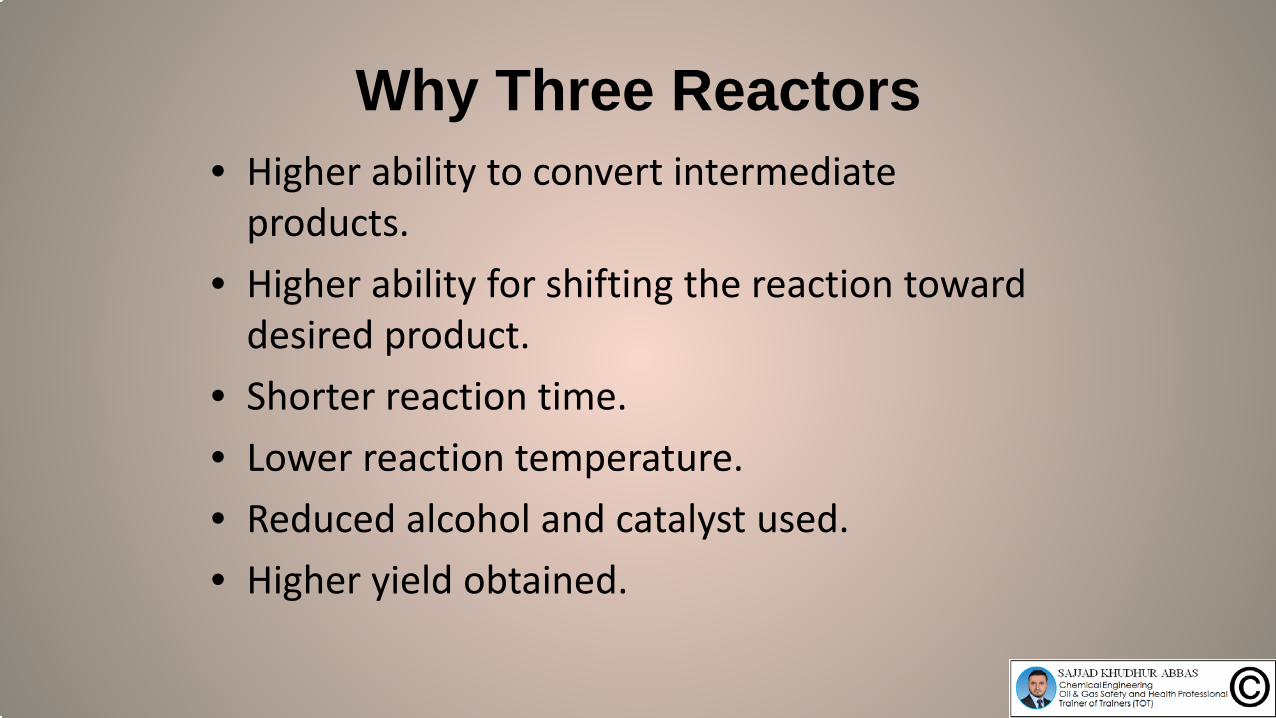
• Higher ability to convert intermediate products.
• Higher ability for shifting the reaction toward desired product.
• Shorter reaction time.• Lower reaction temperature.• Reduced alcohol and catalyst used.• Higher yield obtained.
Why Three Reactors
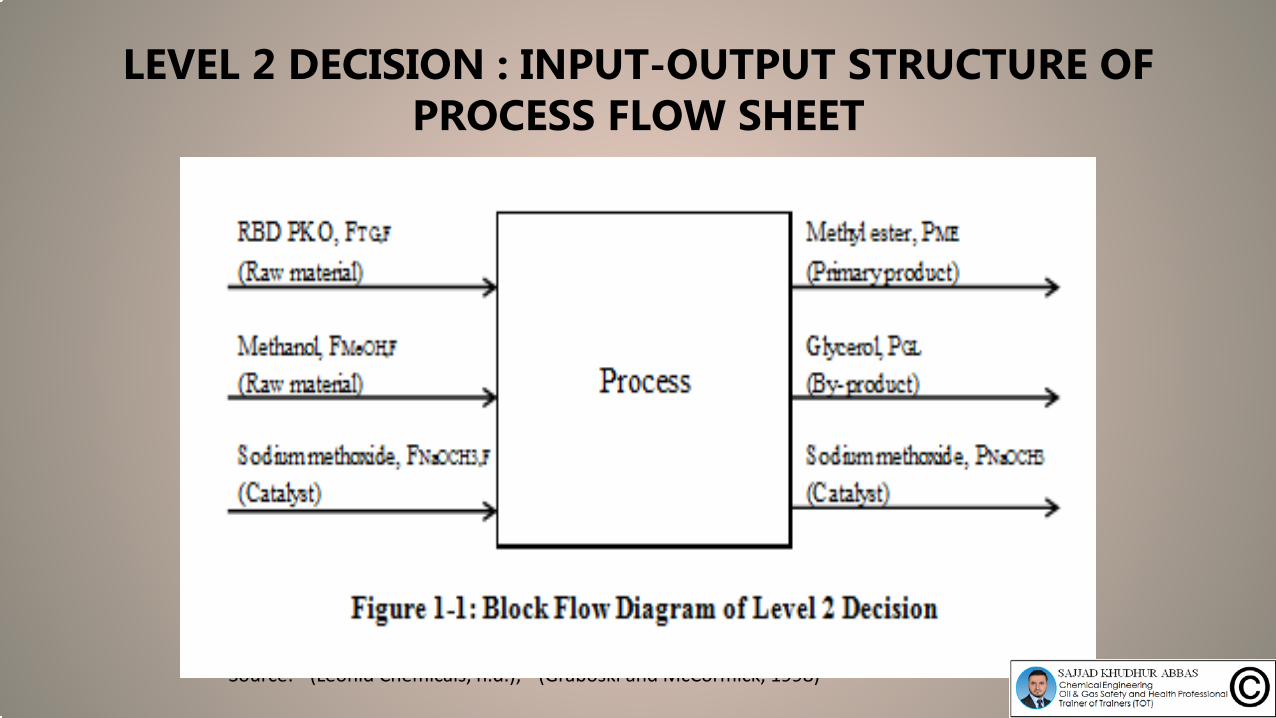
LEVEL 2 DECISION : INPUT-OUTPUT STRUCTURE OF PROCESS FLOW SHEET
Species Boiling Point (oC) Destination Code
RBD Palm Kernel OilNot pertinent (Very
high)Recycle (if X < 95%)
Methanol 64.7 RecycleSodium Methoxide (30wt% in methanol)
a 93.0 Waste
Methyl Ester
CE-810C8:0 b 193.0
Primary product
C10:0 b 224.0
CE-1214C12:0 b 262.0C14:0 b 295.0
CE-1618
C16:0 b 338.0C18:0 b 352.0C18:1 b 349.0C18:2 b 366.0
Glycerol 290.0 By-product
Table 1-1: Destination code for transesterification process
Source: a (Leonid Chemicals, n.d.); b (Graboski and McCormick, 1998)
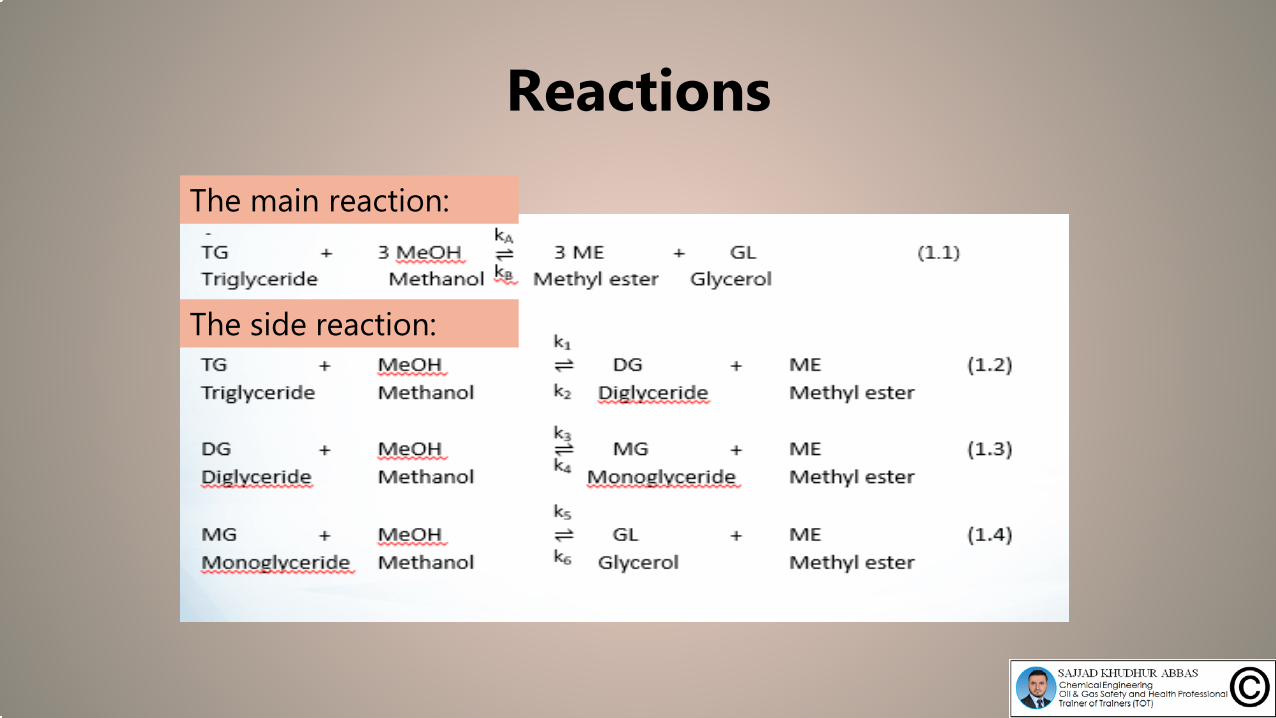
Reactions
The main reaction:
The side reaction:
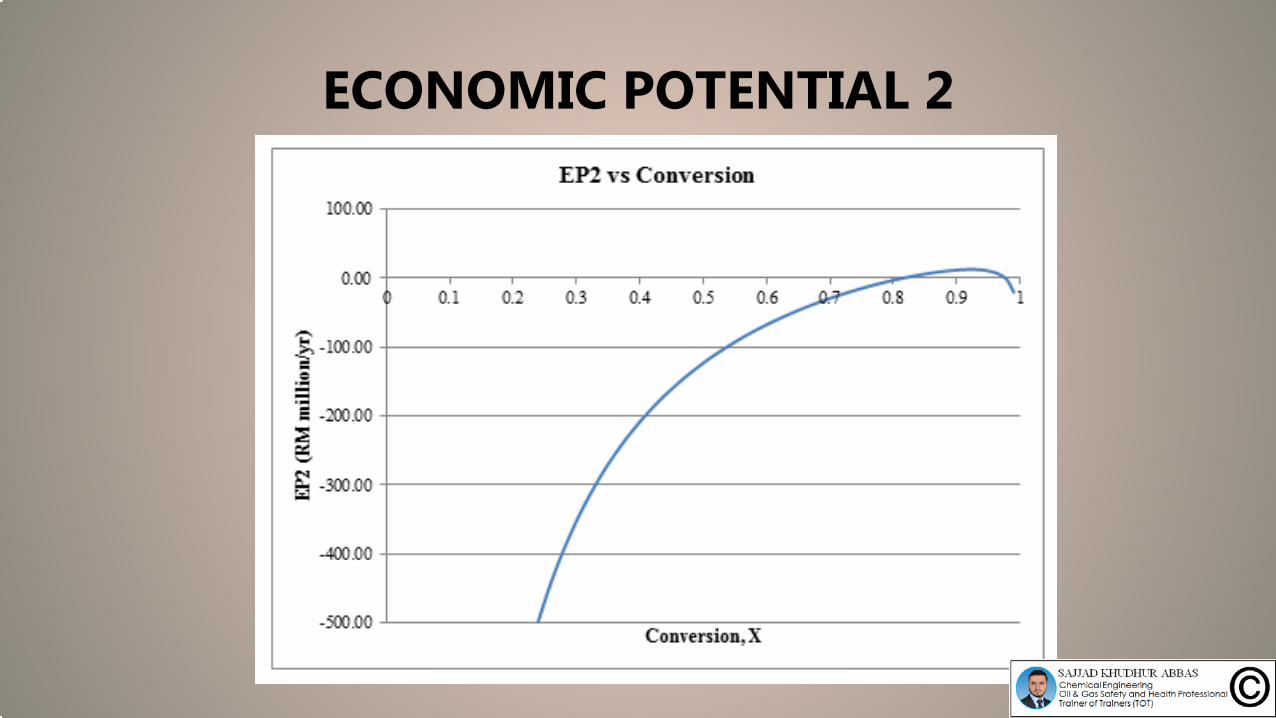
ECONOMIC POTENTIAL 2𝐸𝐸𝐸𝐸2 �
𝑅𝑅𝑀𝑀𝑦𝑦𝑀𝑀
� = 𝑀𝑀𝑅𝑅𝑀𝑀ℎ𝑦𝑦𝑀𝑀 𝐸𝐸𝐶𝐶𝑀𝑀𝑅𝑅𝑀𝑀 𝑅𝑅𝑅𝑅𝑀𝑀𝑅𝑅𝑅𝑅 + 𝐺𝐺𝑀𝑀𝑦𝑦𝑐𝑐𝑅𝑅𝑀𝑀𝐶𝐶𝑀𝑀 𝑅𝑅𝑅𝑅𝑀𝑀𝑅𝑅𝑅𝑅 − 𝑅𝑅𝑅𝑅𝑅𝑅 𝐸𝐸𝑅𝑅𝑅𝑅 𝐶𝐶𝐶𝐶𝐶𝐶𝑀𝑀 − 𝑀𝑀𝑅𝑅𝑀𝑀ℎ𝑅𝑅𝑅𝑅𝐶𝐶𝑀𝑀 𝐶𝐶𝐶𝐶𝐶𝐶𝑀𝑀
= �(0.0813 × 60,000,000)𝑘𝑘𝑘𝑘 𝐶𝐶𝐸𝐸810
𝑦𝑦𝑀𝑀×𝑅𝑅𝑀𝑀3.46𝑘𝑘𝑘𝑘
+ (0.6416 × 60,000,000)𝑘𝑘𝑘𝑘 𝐶𝐶𝐸𝐸1214
𝑦𝑦𝑀𝑀×𝑅𝑅𝑀𝑀4.65𝑘𝑘𝑘𝑘
+ (0.2771 × 60,000,000)𝑘𝑘𝑘𝑘 𝐶𝐶𝐸𝐸1618
𝑦𝑦𝑀𝑀×𝑅𝑅𝑀𝑀3.84𝑘𝑘𝑘𝑘
+ 8,007,371.7200𝑘𝑘𝑘𝑘 𝐺𝐺𝐺𝐺𝑦𝑦𝑀𝑀
×𝑅𝑅𝑀𝑀1.46𝑘𝑘𝑘𝑘
� − �̇�𝑚𝑇𝑇𝐺𝐺 ,𝐹𝐹 ×𝑅𝑅𝑀𝑀2.95𝑘𝑘𝑘𝑘
− �̇�𝑚𝑀𝑀𝑅𝑅𝑅𝑅𝑀𝑀 ,𝐹𝐹 ×𝑅𝑅𝑀𝑀1.08𝑘𝑘𝑘𝑘
where
�̇�𝑚𝑇𝑇𝐺𝐺 ,𝐹𝐹𝑘𝑘𝑘𝑘 𝑅𝑅𝑅𝑅𝑅𝑅𝐸𝐸𝑅𝑅𝑅𝑅
𝑦𝑦𝑀𝑀= 𝐹𝐹𝑇𝑇𝐺𝐺 ,𝐹𝐹
𝑘𝑘𝑘𝑘𝑚𝑚𝐶𝐶𝑀𝑀 𝑅𝑅𝑅𝑅𝑅𝑅𝐸𝐸𝑅𝑅𝑅𝑅𝑦𝑦𝑀𝑀
×684.8022 𝑘𝑘𝑘𝑘
𝑘𝑘𝑘𝑘𝑚𝑚𝐶𝐶𝑀𝑀
=𝐸𝐸𝑀𝑀𝐸𝐸𝑌𝑌
𝑘𝑘𝑘𝑘𝑚𝑚𝐶𝐶𝑀𝑀 𝑅𝑅𝑅𝑅𝑅𝑅𝐸𝐸𝑅𝑅𝑅𝑅𝑦𝑦𝑀𝑀
×684.8022 𝑘𝑘𝑘𝑘
𝑘𝑘𝑘𝑘𝑚𝑚𝐶𝐶𝑀𝑀
�̇�𝑚𝑀𝑀𝑅𝑅𝑅𝑅𝑀𝑀 ,𝐹𝐹𝑘𝑘𝑘𝑘 𝑀𝑀𝑅𝑅𝑅𝑅𝑀𝑀
𝑦𝑦𝑀𝑀= 𝐹𝐹𝑀𝑀𝑅𝑅𝑅𝑅𝑀𝑀 ,𝐹𝐹
𝑘𝑘𝑘𝑘𝑚𝑚𝐶𝐶𝑀𝑀 𝑀𝑀𝑅𝑅𝑅𝑅𝑀𝑀𝑦𝑦𝑀𝑀
×32.0419 𝑘𝑘𝑘𝑘𝑘𝑘𝑘𝑘𝑚𝑚𝐶𝐶𝑀𝑀
=3𝐸𝐸𝑀𝑀𝐸𝐸𝑌𝑌
𝑘𝑘𝑘𝑘𝑚𝑚𝐶𝐶𝑀𝑀 𝑀𝑀𝑅𝑅𝑅𝑅𝑀𝑀𝑦𝑦𝑀𝑀
×32.0419 𝑘𝑘𝑘𝑘𝑘𝑘𝑘𝑘𝑚𝑚𝐶𝐶𝑀𝑀
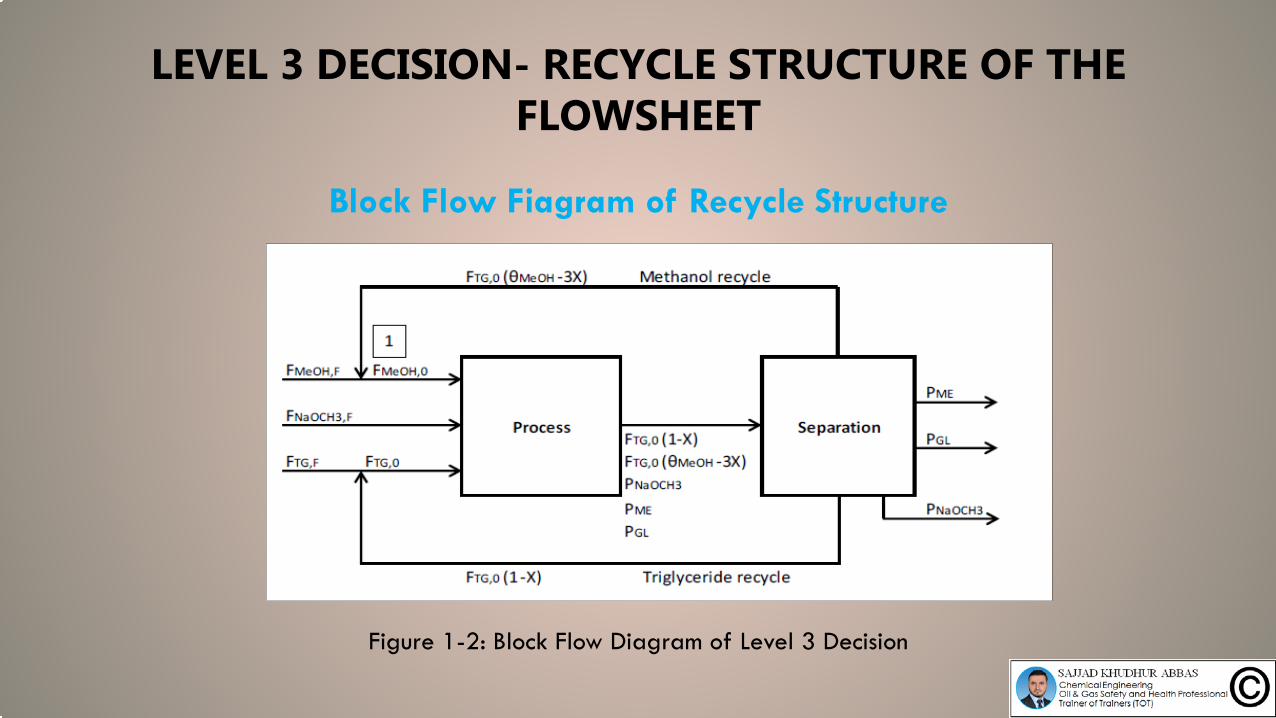
LEVEL 3 DECISION- RECYCLE STRUCTURE OF THE FLOWSHEET
Block Flow Fiagram of Recycle Structure
Figure 1-2: Block Flow Diagram of Level 3 Decision

ReactorKinetic data Values
k 0.013 𝑚𝑚𝑀𝑀𝑅𝑅−1 or 0.780 ℎ𝑀𝑀−1Activation energy, Ea 254.5 cal/mol or 1064.81 J/molTemperature 60°CPressure 1 atmMeOH:TG molar ratio 6:1NaOCH3 by weight of TG 1 wt%
Table 1-4: Kinetic data (Rashid et al., 2014)
Species, 𝑀𝑀 Inlet,𝐹𝐹𝑖𝑖,0 𝑀𝑀𝑀𝑀𝑖𝑖 Density 𝜌𝜌𝑖𝑖 (60°C) 𝑅𝑅𝑖𝑖 Source for densitykgmol/hr kg/kgmol kg/m3 m3/hrTG 10.8685 684.8022 891.2 8.3514 (Timms, 1985)
MeOH 59.7911 32.0419 755.5 2.5358 (Thermal-Fluids Central, 2010)
NaOCH3 30% solution
6.7976 54.0240 935.0 0.3928 See Appendix A.1.1 (BASF, 2007)
Total 77.46 𝒗𝒗𝟎𝟎 = 11.2800
Table 1-5: Feed information
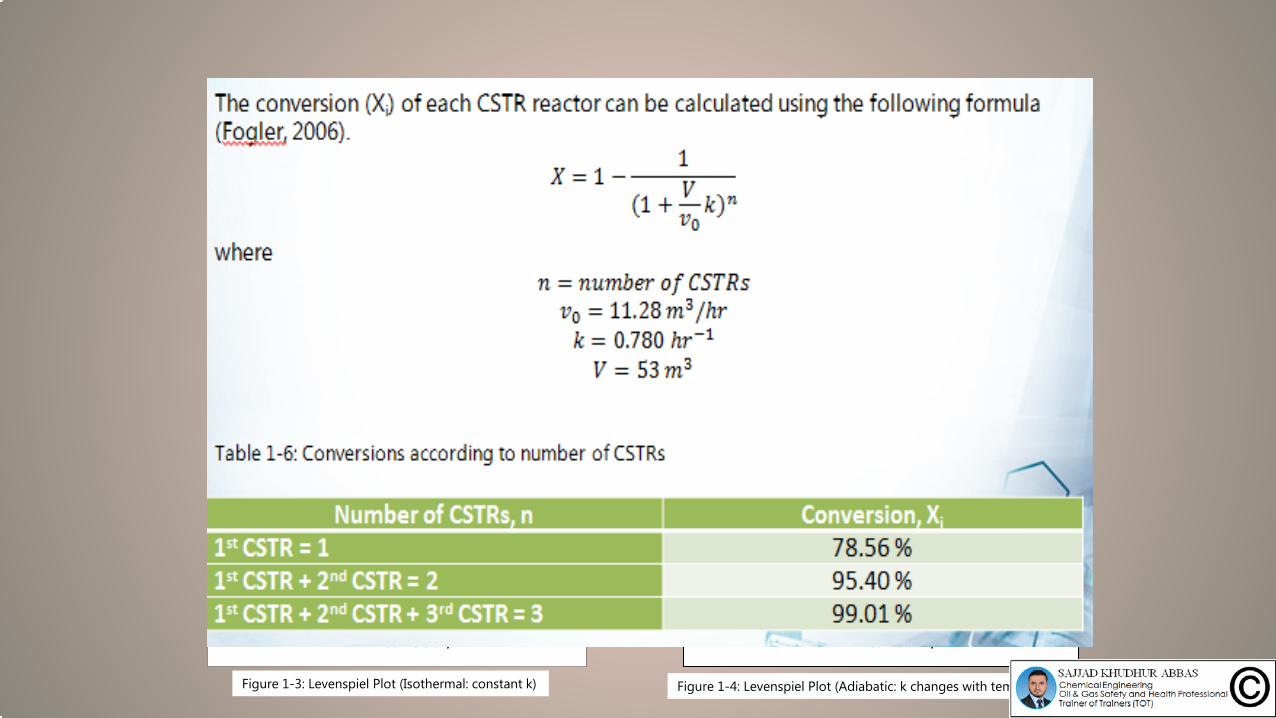
For isothermal reaction, 𝐹𝐹𝑇𝑇𝑇𝑇,0
−𝑀𝑀𝑇𝑇𝑇𝑇=
𝑅𝑅0𝑘𝑘 1 − 𝑋𝑋
where𝑅𝑅0 = 11.28 𝑚𝑚3/ℎ𝑀𝑀
𝑘𝑘 60°C = 0.780 ℎ𝑀𝑀−1
For adiabatic reaction, 𝐹𝐹𝑇𝑇𝑇𝑇,0
−𝑀𝑀𝑇𝑇𝑇𝑇=
𝑅𝑅0𝑘𝑘 1 − 𝑋𝑋
where𝑘𝑘 ℎ𝑀𝑀−1
= 0.780 exp1064.81
8.3141
333.15−
1𝑇𝑇
𝑇𝑇(𝑅𝑅𝑅𝑅𝑀𝑀𝑅𝑅𝑀𝑀𝑅𝑅) = −6.3376𝑋𝑋 + 333.16
0
200
400
600
800
1000
1200
1400
1600
0.0 0.2 0.4 0.6 0.8 1.0
FTG
,0/(
-rTG
) (m
3)
Conversion, X
Levenspiel Plot (Isothermal)
Figure 1-3: Levenspiel Plot (Isothermal: constant k)
0
200
400
600
800
1000
1200
1400
1600
0.0 0.2 0.4 0.6 0.8 1.0
FTG
,0/(
-rTG
) (m
3)
Conversion, X
Levenspiel Plot (Adiabatic)
Figure 1-4: Levenspiel Plot (Adiabatic: k changes with temperature)
31
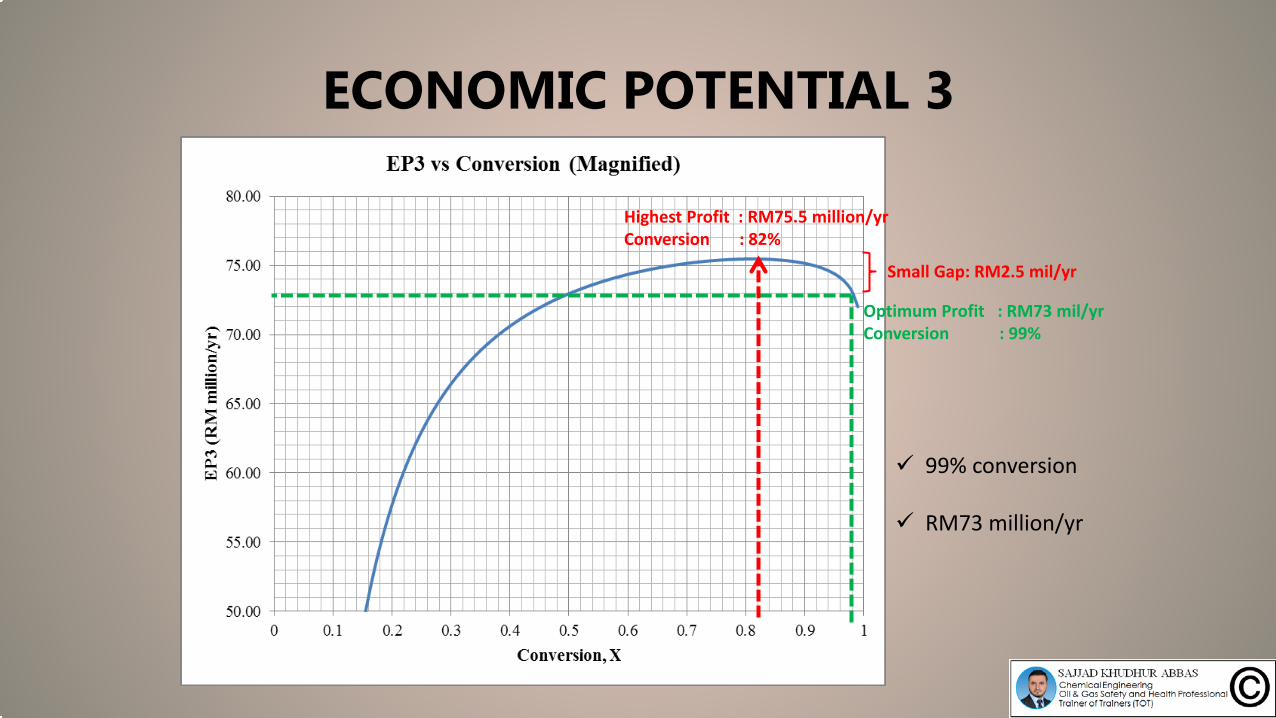
99% conversion
RM73 million/yr
Highest Profit : RM75.5 million/yrConversion : 82%
Optimum Profit : RM73 mil/yrConversion : 99%
Small Gap: RM2.5 mil/yr
ECONOMIC POTENTIAL 3
P-101
P-102
P-103
P-104
M-101
E-101 E-102
E-103
E-104
E-105E-106
E-112
E-107
E-110
E-111
C-101
R-101
E-114
E-113
E-115
C-105
P-112
P-109
P-110
P-113
P-111
P-107
P-105
C-104
C-103
T-101(CE-810)
MeOH
NaOCH3
TG
Water
T-102(CE-1214)
T-103(CE-1618)
M-102 R-102 R-103
C-102
C-106
M-103
V-101
P-106
E-109
E-108P-108
T-104(Glycerol)
To waste water treatment
To waste water treatment
1 atm25 °C
1 atm25 °C
1 atm25 °C
1 atm25 °C
1.2 atm25 °C
1.2 atm25 °C
1.2 atm25 °C
1.2 atm25 °C
1 atm42 °C
1 atm32 °C
1 atm60 °C
1 atm120 °C
1 atm60 °C
1 atm120 °C
1 atm160 °C
1 atm160 °C
1 atm120 °C
1 atm160 °C
1 atm129 °C
1 atm60 °C
1.2 atm60 °C
1.2 atm160 °C
1 atm50 °C
1 atm50 °C
1.2 atm50 °C
1 atm130 °C
1 atm130 °C
1 atm130 °C
1 atm25 °C
1 atm25 °C
1 atm25 °C
1 atm25 °C
1 atm176 °C
0.07 atm176 °C
1 atm158 °C0.25 atm
158 °C
0.25 atm226 °C
0.45 atm226 °C
0.25 atm198 °C
0.07 atm237 °C
1 atm237 °C
1 atm25 °C
0.5 atm185 °C
0.7 atm236 °C0.5 atm
236 °C
0.5 atm25 °C
0.5 atm59 °C
1 atm91 °C
1.2 atm50 °C 1 atm
50 °C
M-101
M-102E-101
R-100 E-102
C-101 C-102
M-103E-103
E-104
V-101 E-105E-106
C-103
E-108
C-104
E-110
C-105
C-106
E-113
P-105
P-101
P-102
P-103
P-104
P-106P-107
P-108
E-107
P-110
E-109
P-113
E-114
E-115
E-111
E-112
P-112
P-111
P-109
2
4
3
5 6
7
MEOH
8
9 15
1011
13
14
1822
16
20
23
2527
28
3133
34
37
40
42
43
45
12
1
NAOCH3
TG
WATER
1721
24
26
32
30
41
44
46
36
39
19
35
38
29
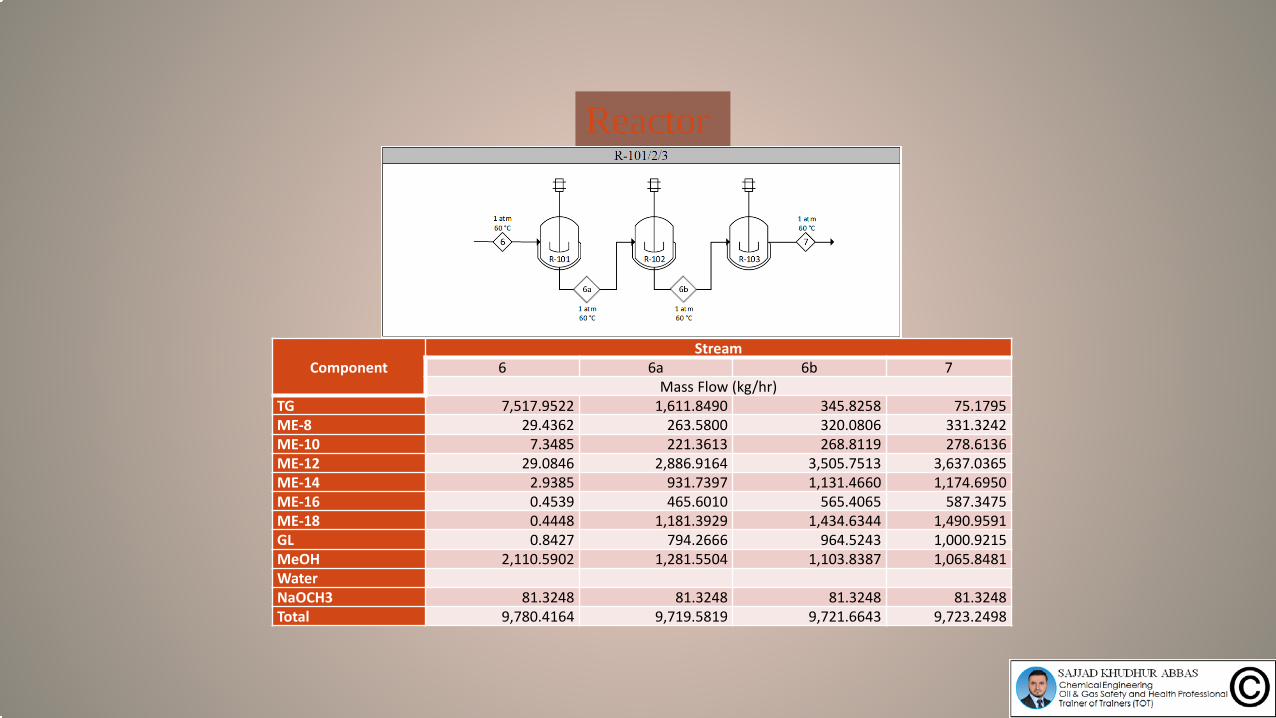
Reactor
ComponentStream
6 6a 6b 7Mass Flow (kg/hr)
TG 7,517.9522 1,611.8490 345.8258 75.1795ME-8 29.4362 263.5800 320.0806 331.3242ME-10 7.3485 221.3613 268.8119 278.6136ME-12 29.0846 2,886.9164 3,505.7513 3,637.0365ME-14 2.9385 931.7397 1,131.4660 1,174.6950ME-16 0.4539 465.6010 565.4065 587.3475ME-18 0.4448 1,181.3929 1,434.6344 1,490.9591GL 0.8427 794.2666 964.5243 1,000.9215MeOH 2,110.5902 1,281.5504 1,103.8387 1,065.8481WaterNaOCH3 81.3248 81.3248 81.3248 81.3248Total 9,780.4164 9,719.5819 9,721.6643 9,723.2498
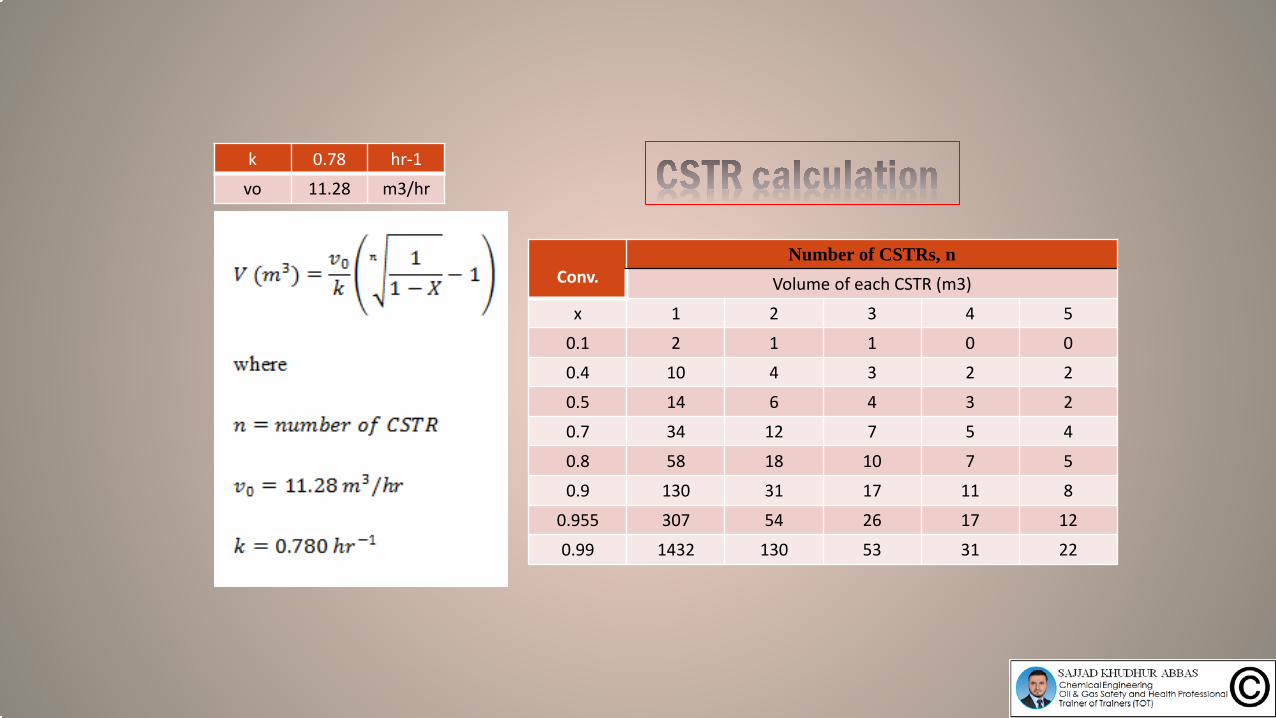
k 0.78 hr-1
vo 11.28 m3/hr
Conv.Number of CSTRs, n
Volume of each CSTR (m3)
x 1 2 3 4 5
0.1 2 1 1 0 0
0.4 10 4 3 2 2
0.5 14 6 4 3 2
0.7 34 12 7 5 4
0.8 58 18 10 7 5
0.9 130 31 17 11 8
0.955 307 54 26 17 12
0.99 1432 130 53 31 22
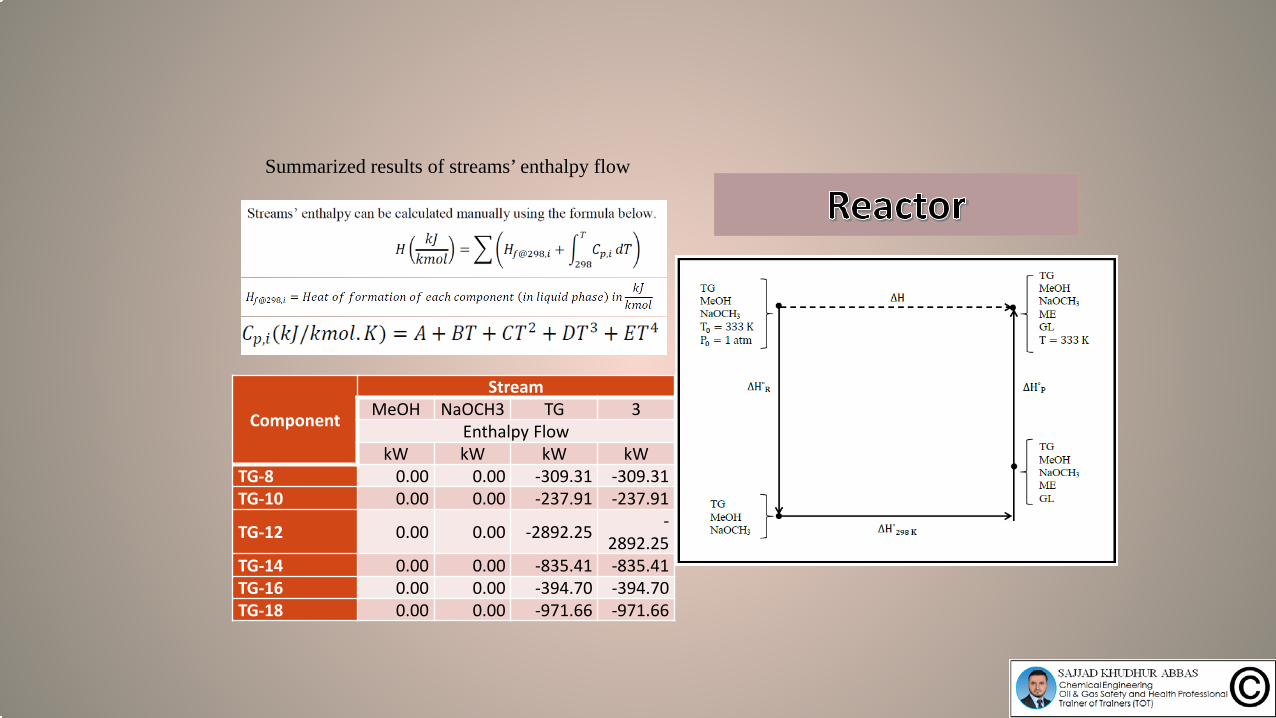
Component
StreamMeOH NaOCH3 TG 3
Enthalpy FlowkW kW kW kW
TG-8 0.00 0.00 -309.31 -309.31TG-10 0.00 0.00 -237.91 -237.91
TG-12 0.00 0.00 -2892.25 -2892.25
TG-14 0.00 0.00 -835.41 -835.41TG-16 0.00 0.00 -394.70 -394.70TG-18 0.00 0.00 -971.66 -971.66
Summarized results of streams’ enthalpy flow
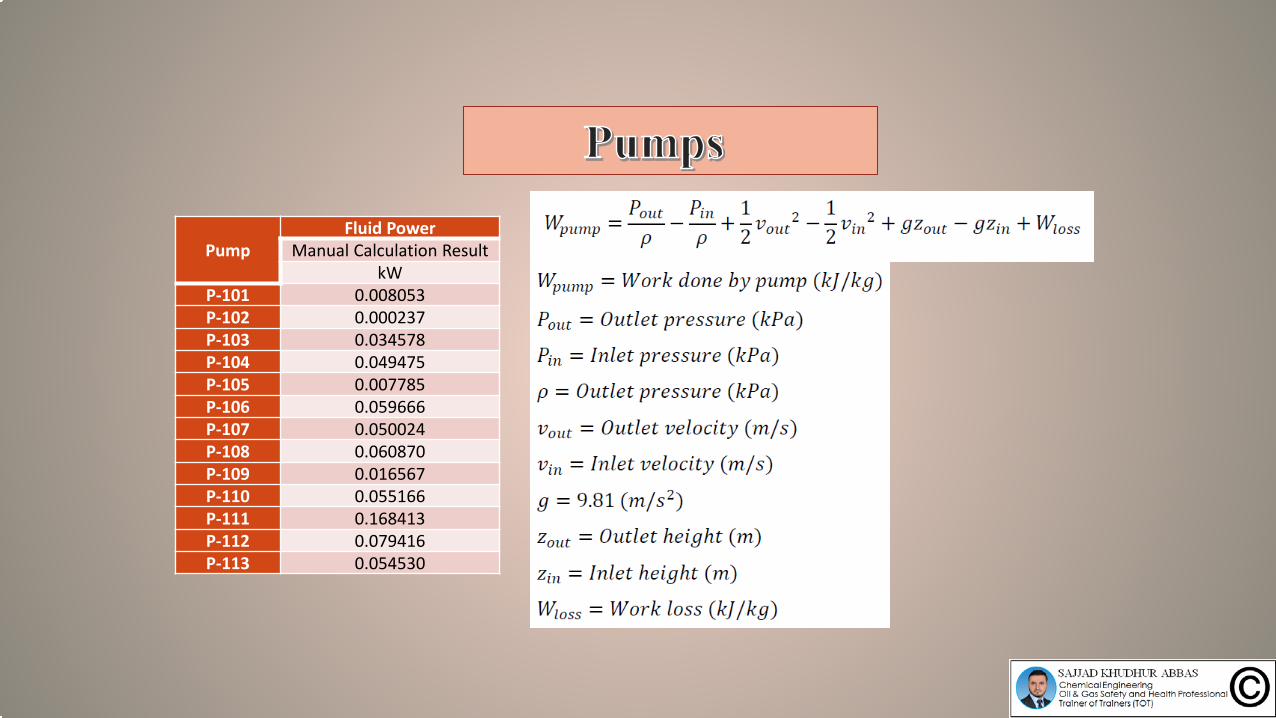
PumpFluid Power
Manual Calculation ResultkW
P-101 0.008053P-102 0.000237P-103 0.034578P-104 0.049475P-105 0.007785P-106 0.059666P-107 0.050024P-108 0.060870P-109 0.016567P-110 0.055166P-111 0.168413P-112 0.079416P-113 0.054530
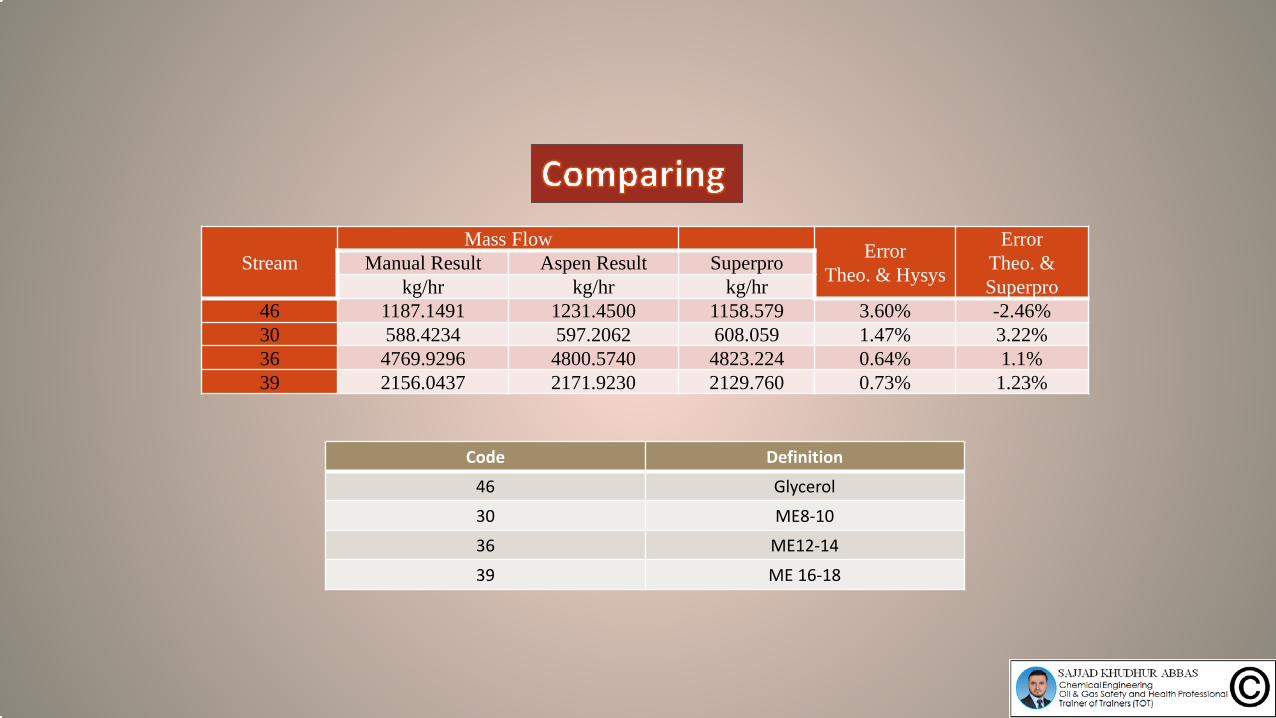
StreamMass Flow Error
Theo. & Hysys
ErrorTheo. & Superpro
Manual Result Aspen Result Superprokg/hr kg/hr kg/hr
46 1187.1491 1231.4500 1158.579 3.60% -2.46%30 588.4234 597.2062 608.059 1.47% 3.22%36 4769.9296 4800.5740 4823.224 0.64% 1.1%39 2156.0437 2171.9230 2129.760 0.73% 1.23%
Code Definition
46 Glycerol
30 ME8-10
36 ME12-14
39 ME 16-18
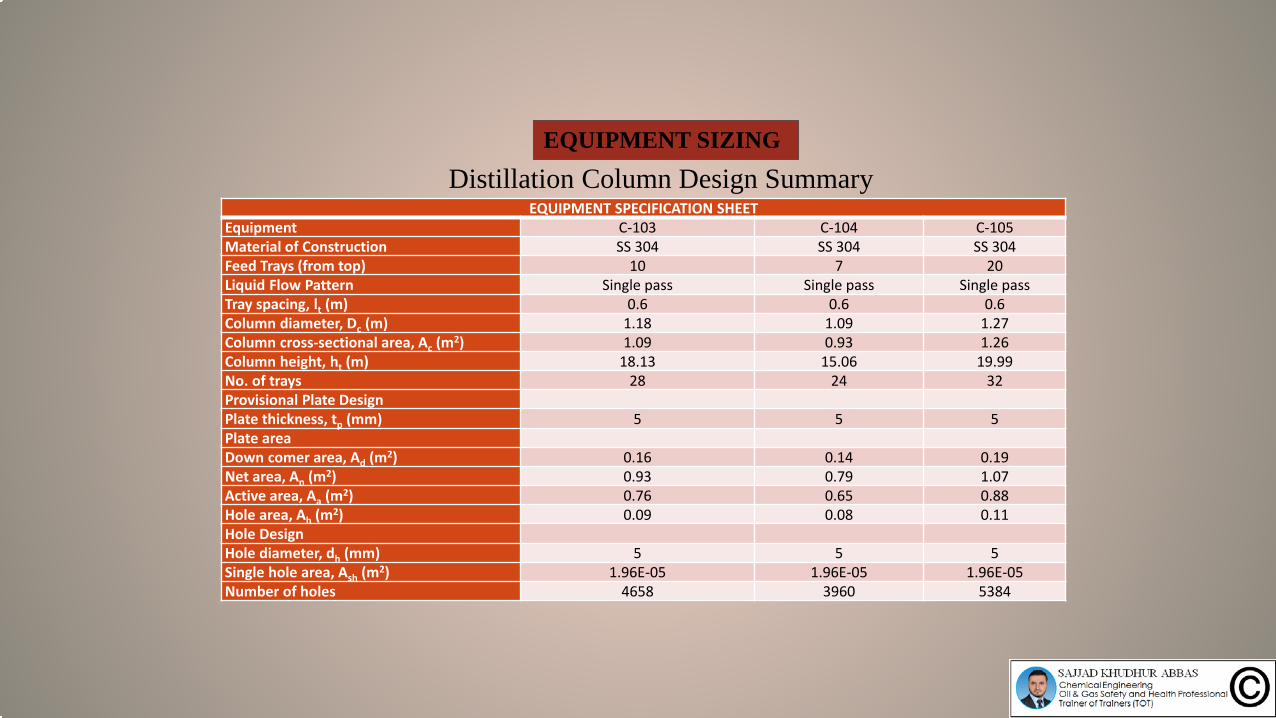
EQUIPMENT SIZING
Distillation Column Design Summary EQUIPMENT SPECIFICATION SHEET
Equipment C-103 C-104 C-105Material of Construction SS 304 SS 304 SS 304Feed Trays (from top) 10 7 20Liquid Flow Pattern Single pass Single pass Single passTray spacing, lt (m) 0.6 0.6 0.6Column diameter, Dc (m) 1.18 1.09 1.27Column cross-sectional area, Ac (m2) 1.09 0.93 1.26Column height, ht (m) 18.13 15.06 19.99No. of trays 28 24 32Provisional Plate DesignPlate thickness, tp (mm) 5 5 5Plate areaDown comer area, Ad (m2) 0.16 0.14 0.19Net area, An (m2) 0.93 0.79 1.07Active area, Aa (m2) 0.76 0.65 0.88Hole area, Ah (m2) 0.09 0.08 0.11Hole DesignHole diameter, dh (mm) 5 5 5Single hole area, Ash (m2) 1.96E-05 1.96E-05 1.96E-05Number of holes 4658 3960 5384
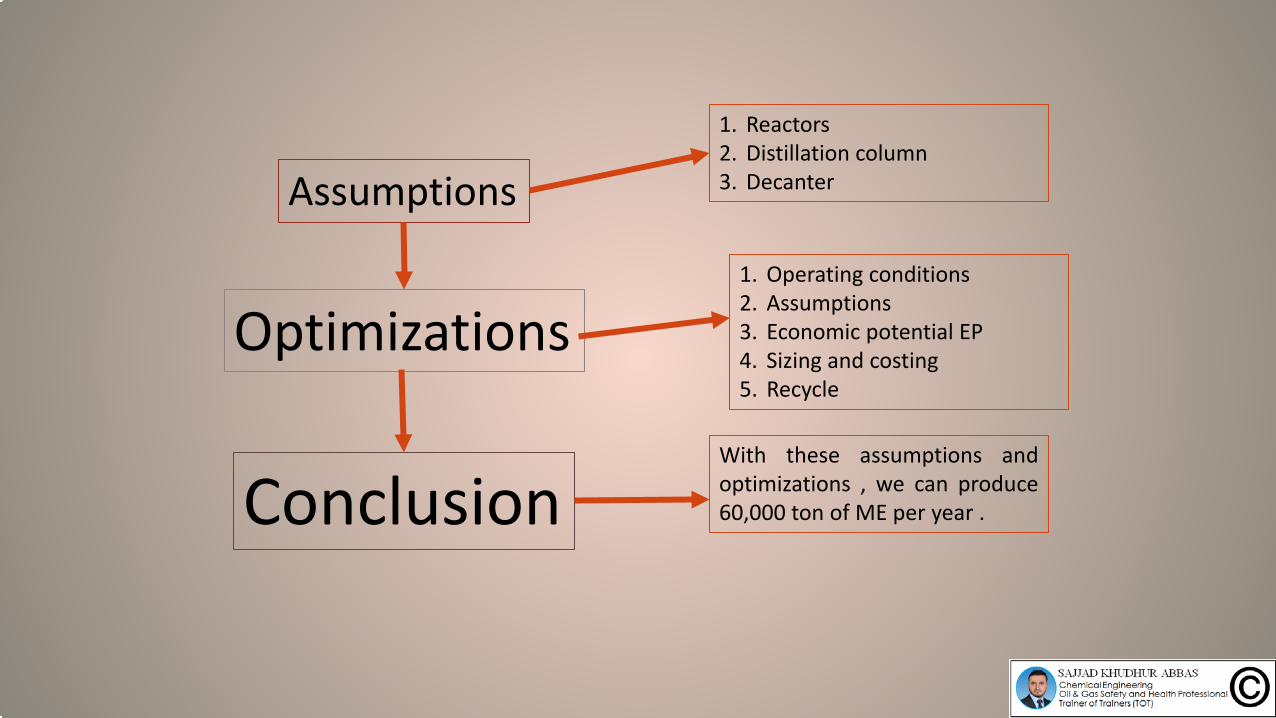
Assumptions
Optimizations
Conclusion
1. Reactors2. Distillation column3. Decanter
1. Operating conditions2. Assumptions3. Economic potential EP4. Sizing and costing5. Recycle
With these assumptions andoptimizations , we can produce60,000 ton of ME per year .

Thanks for Watching Please follow me / SAJJAD KHUDHUR ABBAS