building financial projections - mit opencourseware...nuts and bolts 1/23/14 50-50-50 consulting...
TRANSCRIPT
Building Financial Projections50-50-50
Consulting
January 23, 2014 Nuts
AndCharlie Tillett
Bolts SM ‘91 1/23/14
1
Agenda50-50-50
Consulting Business Plan Financials
Nuts • What VCs (and $100K Judges) Want
And• What is a Business Model
Bolts • Building YOUR Financial Projections 1/23/14
• Sharing the Pie
2
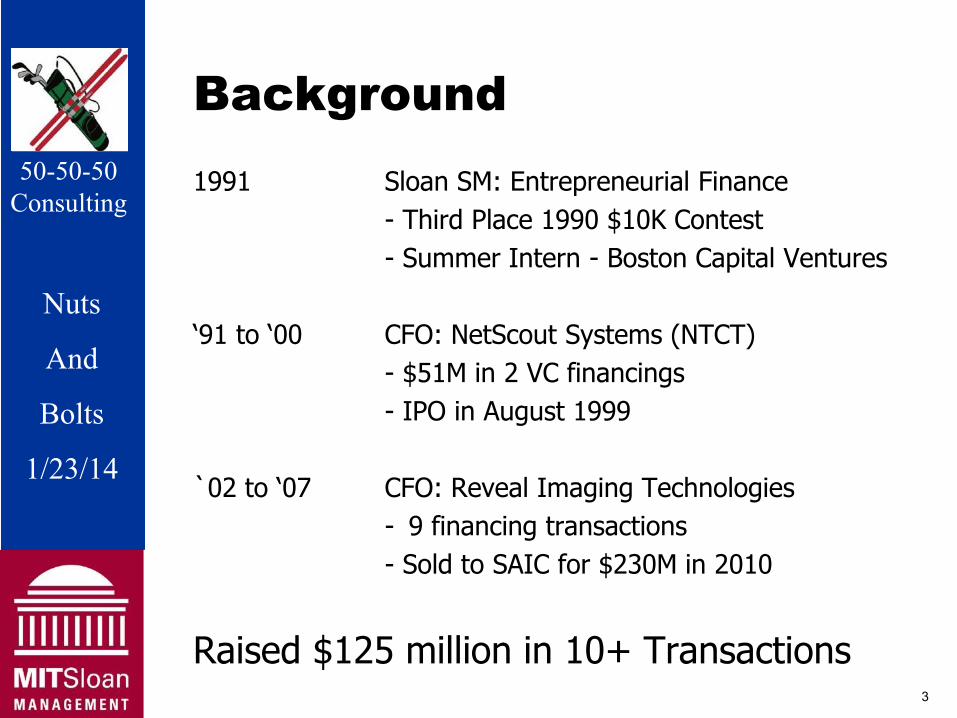
Background 50-50-50 1991 Sloan SM: Entrepreneurial Finance
Consulting - Third Place 1990 $10K Contest - Summer Intern - Boston Capital Ventures
Nuts ‘91 to ‘00 CFO: NetScout Systems (NTCT)
And - $51M in 2 VC financings Bolts - IPO in August 1999
1/23/14 `02 to ‘07 CFO: Reveal Imaging Technologies
- 9 financing transactions - Sold to SAIC for $230M in 2010
Raised $125 million in 10+ Transactions 3
Nuts
And
Bolts
1/23/14
50-50-50 Consulting
I’m too busy to do Financials!
50-50-50 • It is going to be wrong Consulting
• VC’s don’t believe them anyway
Nuts • I have IMPORTANT things to do And Product
Bolts Technology Customers 1/23/14 Team etc.
4
Nuts
And
Bolts
1/23/14
50-50-50 Consulting
Here’s Why! 50-50-50
Consulting • Financials are the Scoreboard • Understand Your Business
Nuts Assumptions And Drivers Bolts Milestones
1/23/14 Exposures/Risks
Failure to plan is planning to fail 5
Nuts
And
Bolts
1/23/14
50-50-50 Consulting
The Startup CEO Role
50-50-50 • Job #1 Consulting
Maintain oxygen supply!
Nuts • You’re not an accountant but need to And
understand Bolts
Average Selling Price (ASP) 1/23/14
Gross margins Cost of R&D Sales & Marketing strategy & expense Start-up and/or Capital Expenses
6

Nuts
And
Bolts
1/23/14
50-50-50 Consulting
Are Financial Projections Important? Reveal Imaging Timeline - $42.5M raised
50-50-50 • Q4 ‘02 Founded Consulting
• Q1 ’03 Angel Round $1M • Q3 ’03 VC: Series A-1 $5M
Nuts • Q2 ’04 Bank: Equipment Line $500k
And • Q3 ’04 VC: Bridge Loan $1M
• Q1 ’05 VC: Series A-2 $5M Bolts • Q2 ’05 Venture Debt $4M 1/23/14 • Q3 ’05 VC: Series B $5M
• Q2 ’06 Bank: A/R Line of Credit $6M • Q3 ’06 Private Equity: Debt $15M
Financial Plan provided the roadmap to DETERMINE cash needs and the VEHICLE to obtain that cash.
7
Nuts
And
Bolts
1/23/14
50-50-50 Consulting
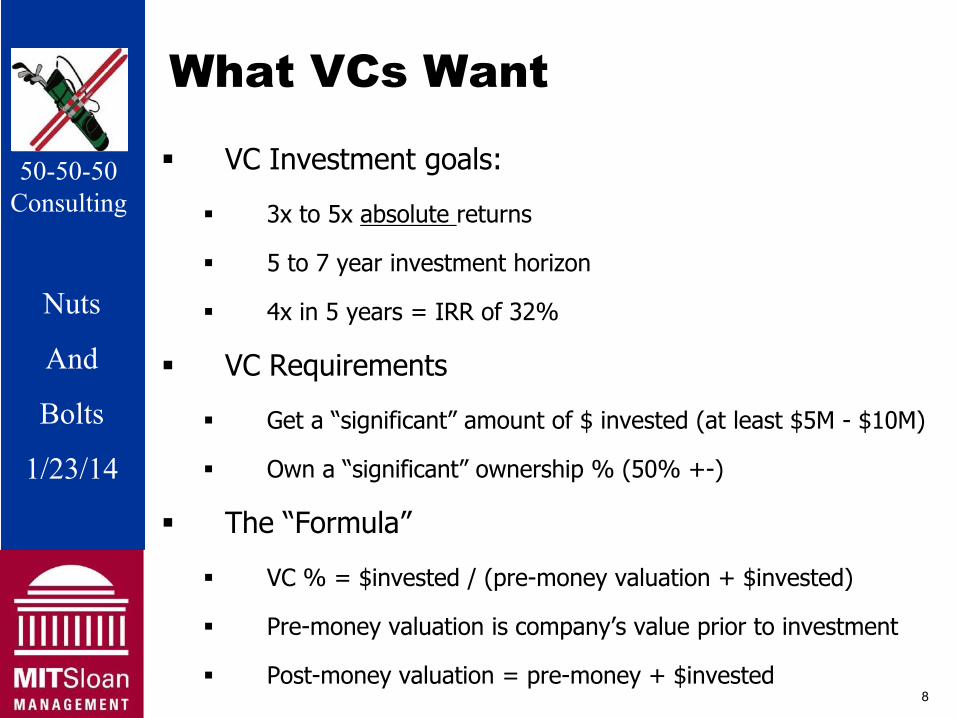
What VCs Want
VC Investment goals: 50-50-50 Consulting 3x to 5x absolute returns
5 to 7 year investment horizon
Nuts 4x in 5 years = IRR of 32%
And VC Requirements
Bolts Get a “significant” amount of $ invested (at least $5M - $10M)
1/23/14 Own a “significant” ownership % (50% +-)
The “Formula”
VC % = $invested / (pre-money valuation + $invested)
Pre-money valuation is company’s value prior to investment
Post-money valuation = pre-money + $invested 8
Nuts
And
Bolts
1/23/14
50-50-50 Consulting
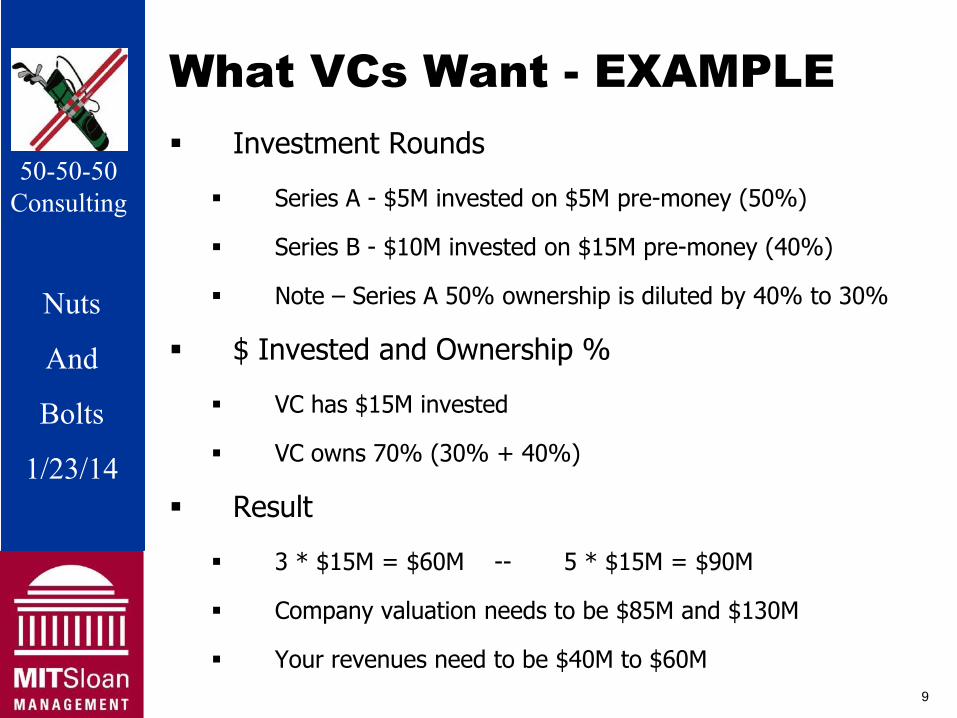
What VCs Want - EXAMPLE Investment Rounds
50-50-50 Consulting Series A - $5M invested on $5M pre-money (50%)
Series B - $10M invested on $15M pre-money (40%)
Nuts Note – Series A 50% ownership is diluted by 40% to 30%
And $ Invested and Ownership %
Bolts VC has $15M invested
VC owns 70% (30% + 40%) 1/23/14 Result
3 * $15M = $60M -- 5 * $15M = $90M
Company valuation needs to be $85M and $130M
Your revenues need to be $40M to $60M 9
Nuts
And
Bolts
1/23/14
50-50-50 Consulting
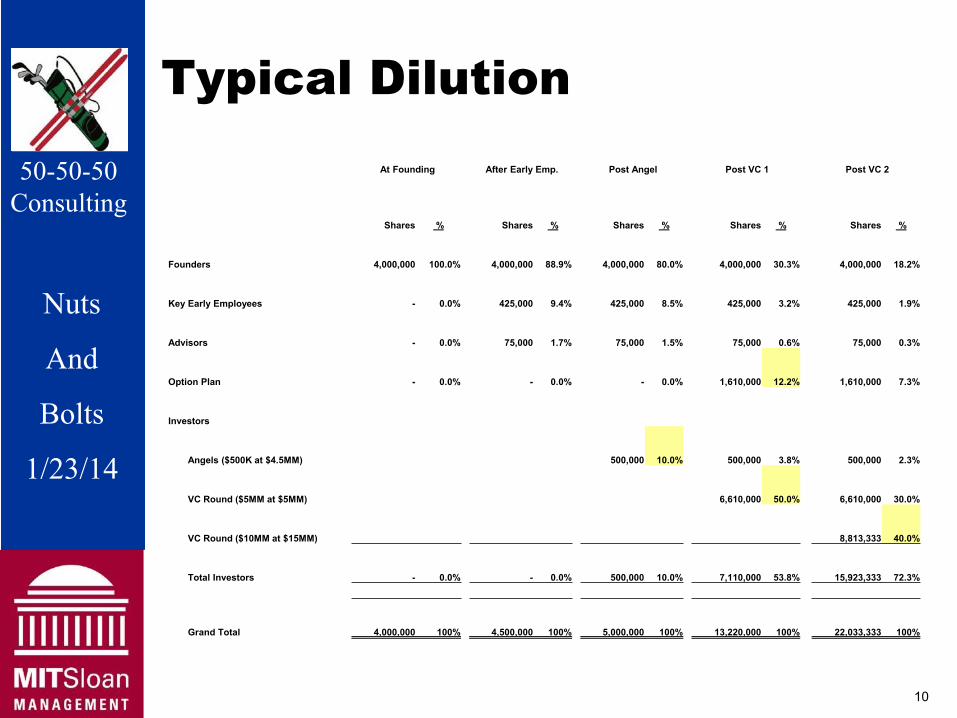
Typical Dilution At Founding After Early Emp. Post Angel Post VC 1 Post VC 2
Shares % Shares % Shares % Shares % Shares %
Founders 4,000,000 100.0% 4,000,000 88.9% 4,000,000 80.0% 4,000,000 30.3% 4,000,000 18.2%
Key Early Employees - 0.0% 425,000 9.4% 425,000 8.5% 425,000 3.2% 425,000 1.9%
Advisors - 0.0% 75,000 1.7% 75,000 1.5% 75,000 0.6% 75,000 0.3%
Option Plan - 0.0% - 0.0% - 0.0% 1,610,000 12.2% 1,610,000 7.3%
Investors
Angels ($500K at $4.5MM) 500,000 10.0% 500,000 3.8% 500,000 2.3%
VC Round ($5MM at $5MM) 6,610,000 50.0% 6,610,000 30.0%
VC Round ($10MM at $15MM) 8,813,333 40.0%
Total Investors - 0.0% - 0.0% 500,000 10.0% 7,110,000 53.8% 15,923,333 72.3%
Grand Total 4,000,000 100% 4,500,000 100% 5,000,000 100% 13,220,000 100% 22,033,333 100%
50-50-50 Consulting
Nuts
And
Bolts
1/23/14
10
Nuts
And
Bolts
1/23/14
50-50-50 Consulting
What is “The Business Model” 50-50-50
Consulting An Income Statement in % terms
Once the business reaches “critical mass”Nuts
o Unit volume Ando Geography
Bolts o Transactions or Customers
1/23/14
Documents how KEY ASSUMPTIONS fit together to create a business that MAKES MONEY
11
Nuts
And
Bolts
1/23/14
50-50-50 Consulting
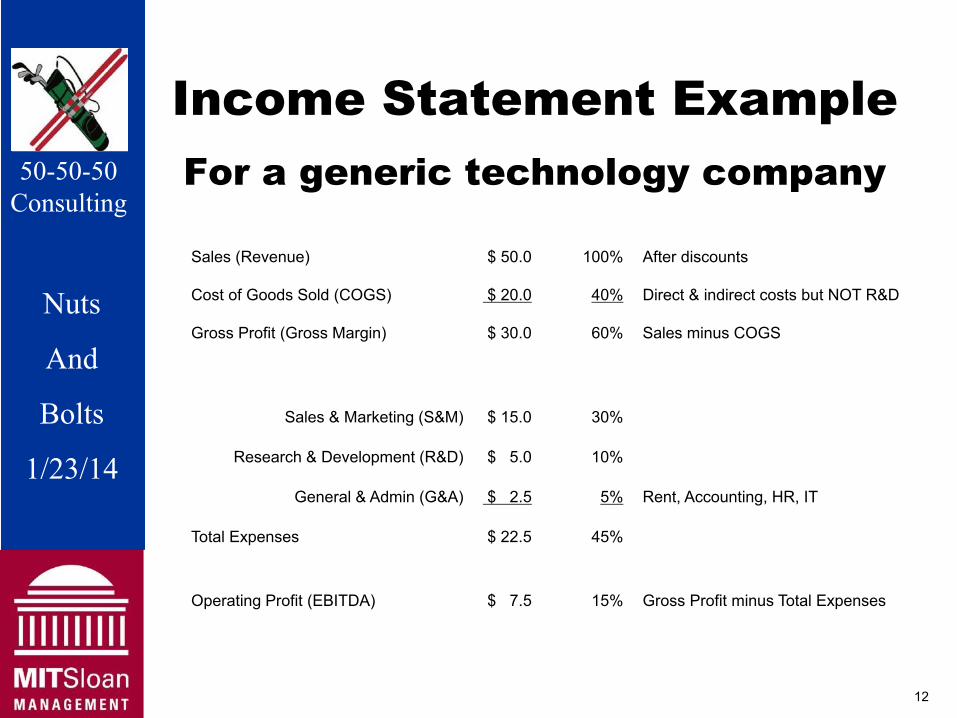
Income Statement Example For a generic technology company
Sales (Revenue) $ 50.0 100% After discounts
Cost of Goods Sold (COGS) $ 20.0 40% Direct & indirect costs but NOT R&D
Gross Profit (Gross Margin) $ 30.0 60% Sales minus COGS
Sales & Marketing (S&M) $ 15.0 30%
Research & Development (R&D) $ 5.0 10%
General & Admin (G&A) $ 2.5 5% Rent, Accounting, HR, IT
Total Expenses $ 22.5 45%
50-50-50 Consulting
Nuts
And
Bolts
1/23/14
Operating Profit (EBITDA) $ 7.5 15% Gross Profit minus Total Expenses
12
Nuts
And
Bolts
1/23/14
50-50-50 Consulting
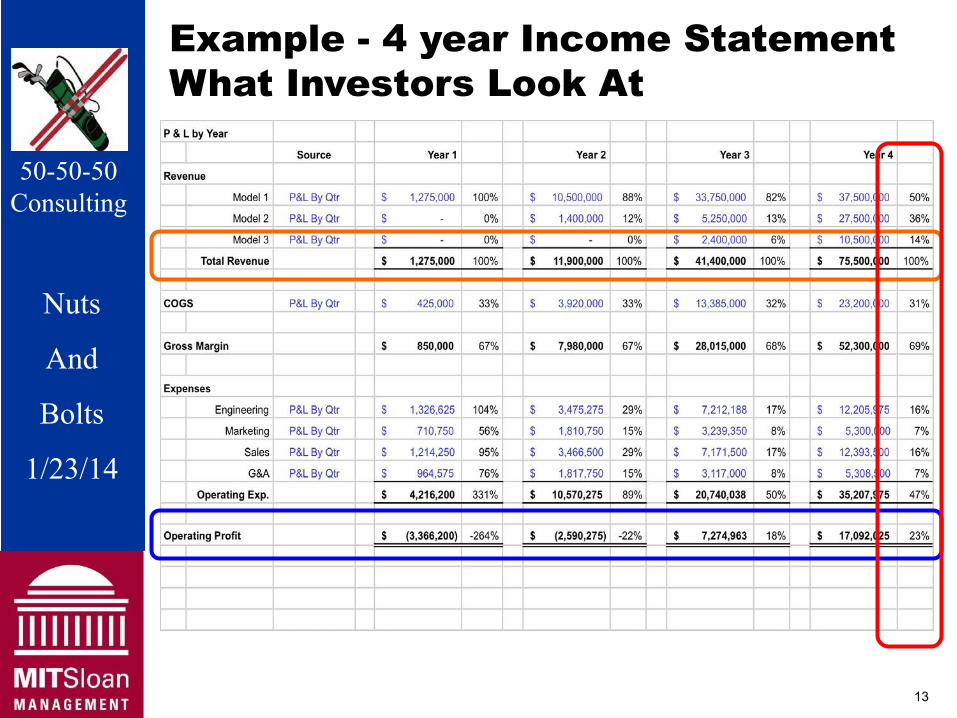
Example - 4 year Income Statement What Investors Look At
50-50-50 Consulting
Nuts
And
Bolts
1/23/14
13
Nuts
And
Bolts
1/23/14
50-50-50 Consulting
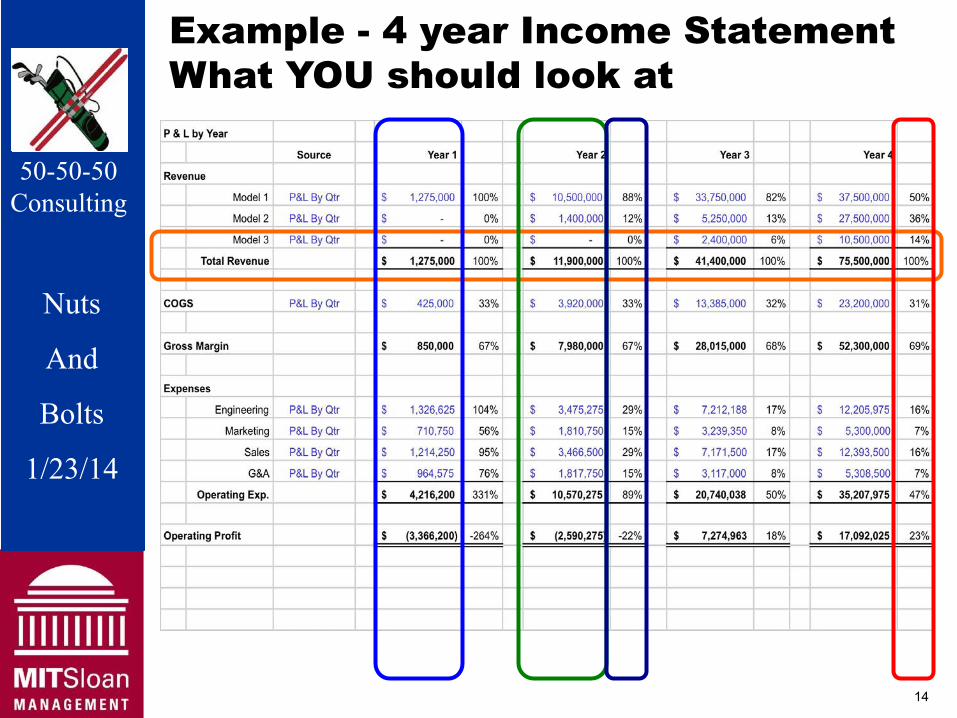
Example - 4 year Income Statement What YOU should look at
50-50-50 Consulting
Nuts
And
Bolts
1/23/14
14
Nuts
And
Bolts
1/23/14
50-50-50 Consulting
The Business Model 50-50-50
Consulting • Provides the super-structure for the Financial Plan
Nuts • Blueprint of how your business will MAKE MONEY
And• Documented by an Income Statement
Bolts
1/23/14
15
Nuts
And
Bolts
1/23/14
50-50-50 Consulting
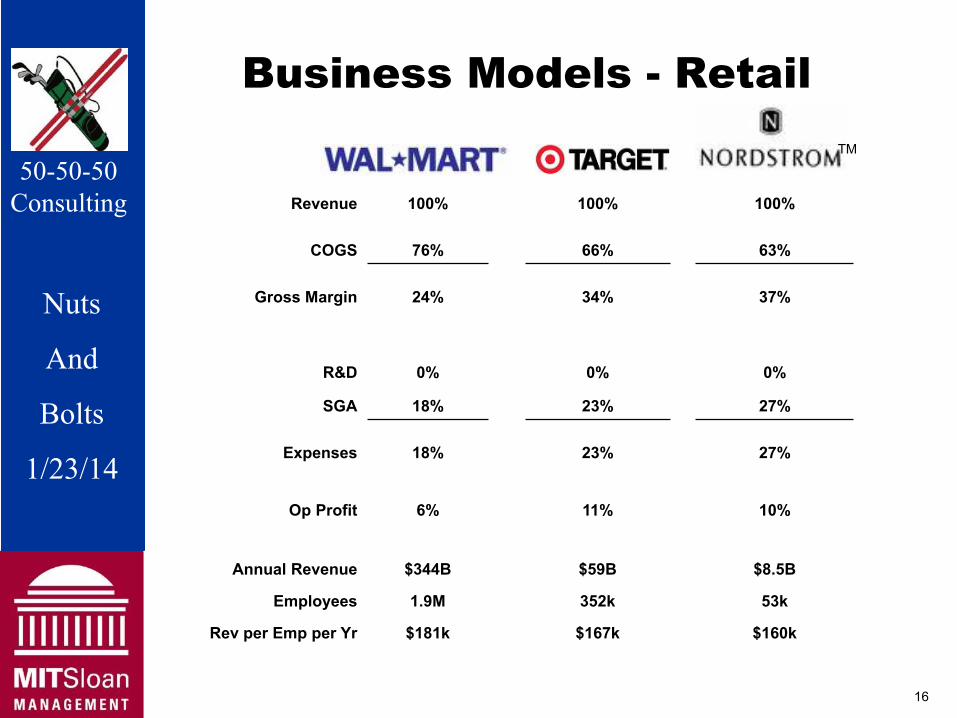
Business Models - RetailWal Mart Target Nordstrom TM
50-50-50 Consulting Revenue 100% 100% 100%
COGS 76% 66% 63%
Nuts Gross Margin 24% 34% 37%
And R&D 0% 0% 0%
Bolts SGA 18% 23% 27%
1/23/14 Expenses 18% 23% 27%
Op Profit 6% 11% 10%
Annual Revenue $344B $59B $8.5B
Employees 1.9M 352k 53k
Rev per Emp per Yr $181k $167k $160k
16
Nuts
And
Bolts
1/23/14
50-50-50 Consulting
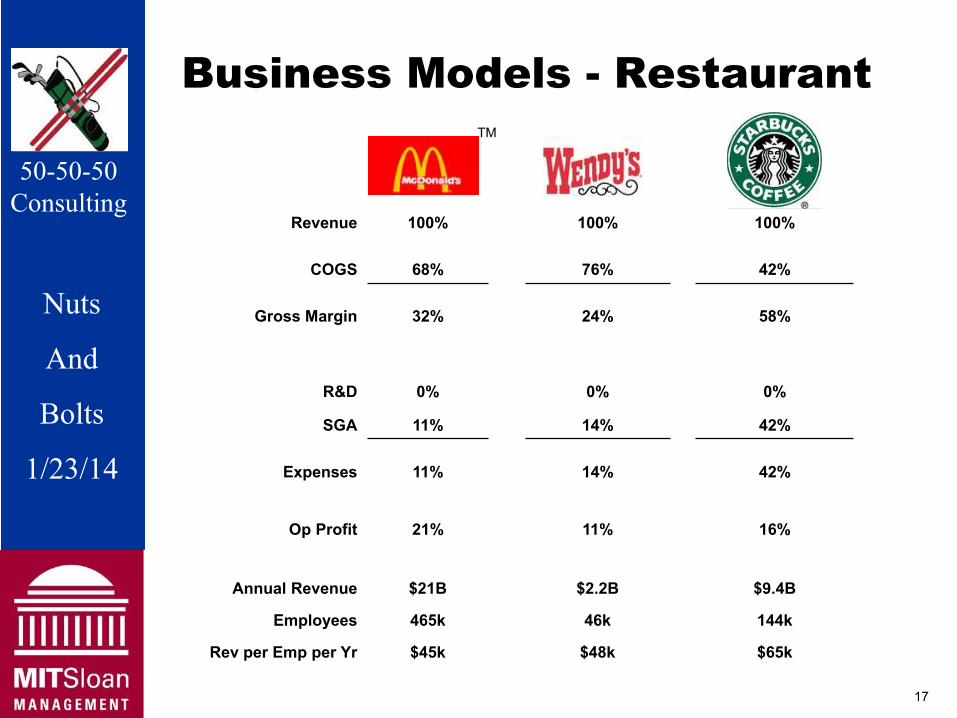
Business Models - Restaurant
McDonalds Wendy’s Starbucks
TM
50-50-50 Consulting
Revenue 100% 100% 100%
COGS 68% 76% 42%
Nuts Gross Margin 32% 24% 58%
AndR&D 0% 0% 0%
Bolts SGA 11% 14% 42%
1/23/14 Expenses 11% 14% 42%
Op Profit 21% 11% 16%
Annual Revenue $21B $2.2B $9.4B
Employees 465k 46k 144k
Rev per Emp per Yr $45k $48k $65k
17
Nuts
And
Bolts
1/23/14
50-50-50 Consulting
Dell MedTronic
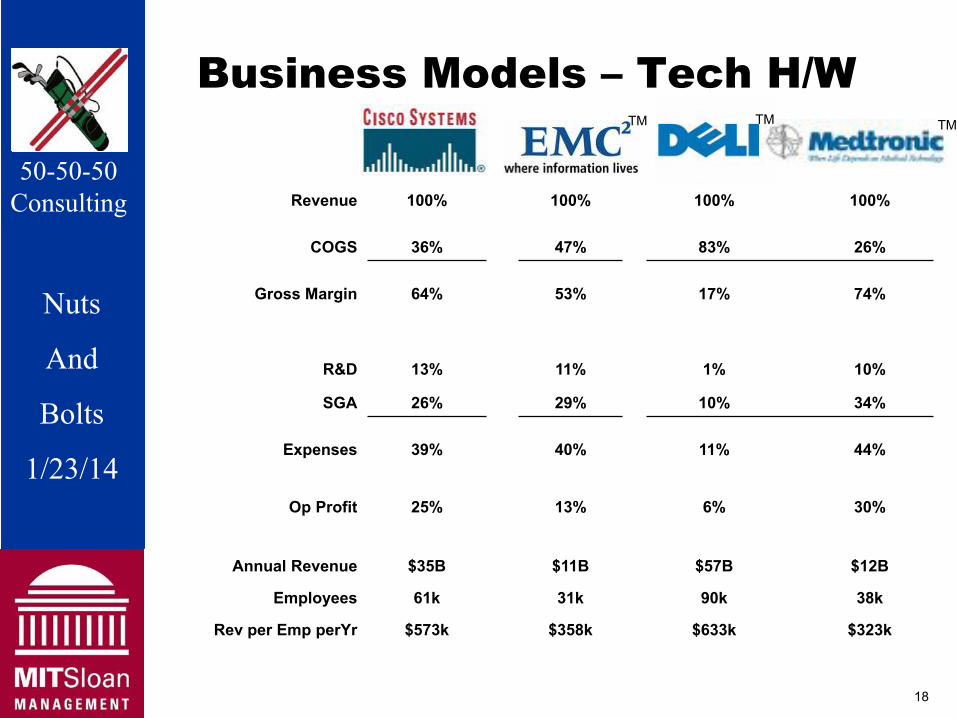
Business Models – Tech H/W Cisco EMC
TM TM TM
50-50-50 Consulting Revenue 100% 100% 100% 100%
COGS 36% 47% 83% 26%
Nuts Gross Margin 64% 53% 17% 74%
And R&D 13% 11% 1% 10%
Bolts SGA 26% 29% 10% 34%
1/23/14 Expenses 39% 40% 11% 44%
Op Profit 25% 13% 6% 30%
Annual Revenue $35B $11B $57B $12B
Employees 61k 31k 90k 38k
Rev per Emp perYr $573k $358k $633k $323k
18
Nuts
And
Bolts
1/23/14
50-50-50 Consulting
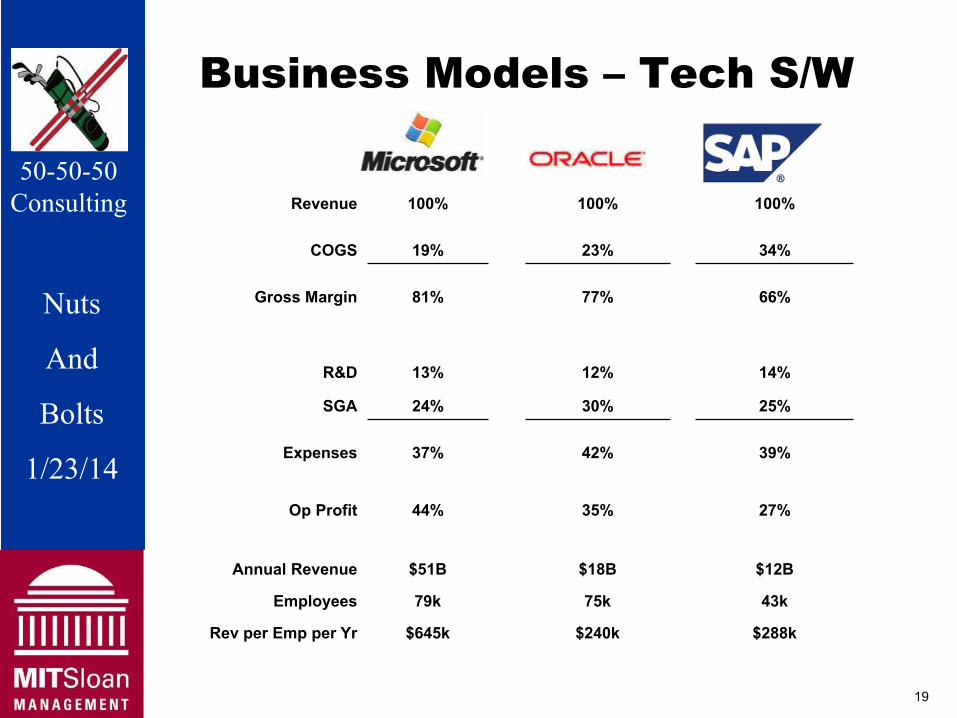
Business Models – Tech S/WMicrosoft Oracle SAP
50-50-50 Consulting Revenue 100% 100% 100%
COGS 19% 23% 34%
Nuts Gross Margin 81% 77% 66%
And R&D 13% 12% 14%
Bolts SGA 24% 30% 25%
1/23/14 Expenses 37% 42% 39%
Op Profit 44% 35% 27%
Annual Revenue $51B $18B $12B
Employees 79k 75k 43k
Rev per Emp per Yr $645k $240k $288k
19
Nuts
And
Bolts
1/23/14
50-50-50 Consulting
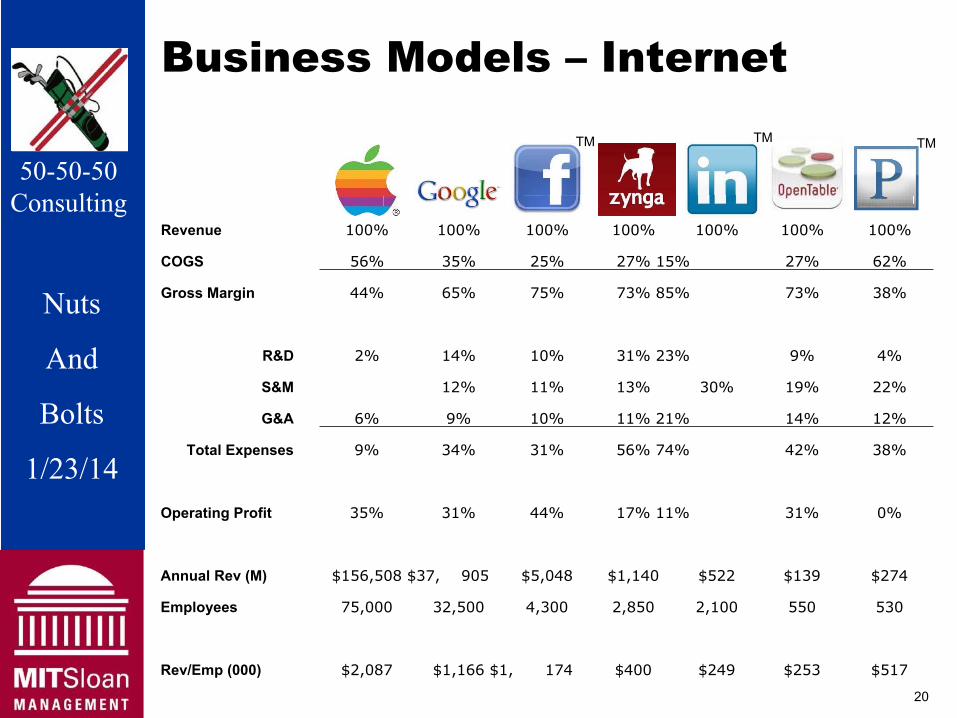
Business Models – Internet
LinkedIn Open Table Open Table LinkedIn Apple Apple Facebook Zynga Facebook Zynga Facebook Zynga Pandora Pandora Google Google
TM TM TM
50-50-50 Consulting
Revenue 100% 100% 100% 100% 100% 100% 100%
COGS 56% 35% 25% 27% 15% 27% 62%
Nuts Gross Margin 44% 65% 75% 73% 85% 73% 38%
And R&D 2% 14% 10% 31% 23% 9% 4%
S&M 12% 11% 13% 30% 19% 22%
Bolts G&A 6% 9% 10% 11% 21% 14% 12%
1/23/14 Total Expenses 9% 34% 31% 56% 74% 42% 38%
Operating Profit 35% 31% 44% 17% 11% 31% 0%
Annual Rev (M) $156,508 $37, 905 $5,048 $1,140 $522 $139 $274
Employees 75,000 32,500 4,300 2,850 2,100 550 530
Rev/Emp (000) $2,087 $1,166 $1, 174 $400 $249 $253 $517
20
Nuts
And
Bolts
1/23/14
50-50-50 Consulting
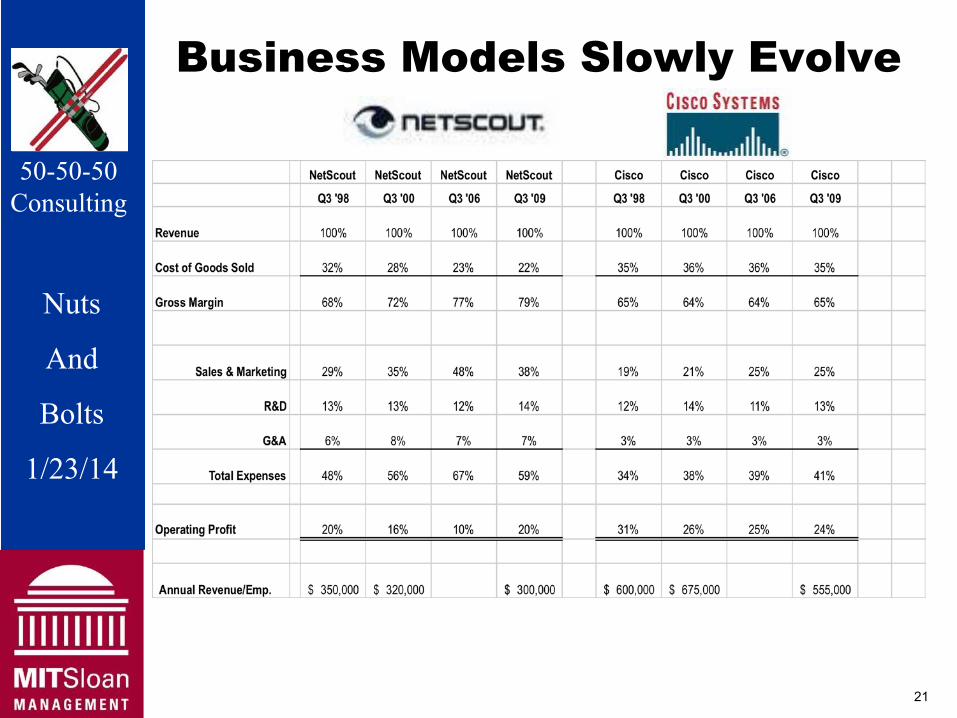
Business Models Slowly Evolve
50-50-50 Consulting
Nuts
And
Bolts
1/23/14
21
Nuts
And
Bolts
1/23/14
50-50-50 Consulting
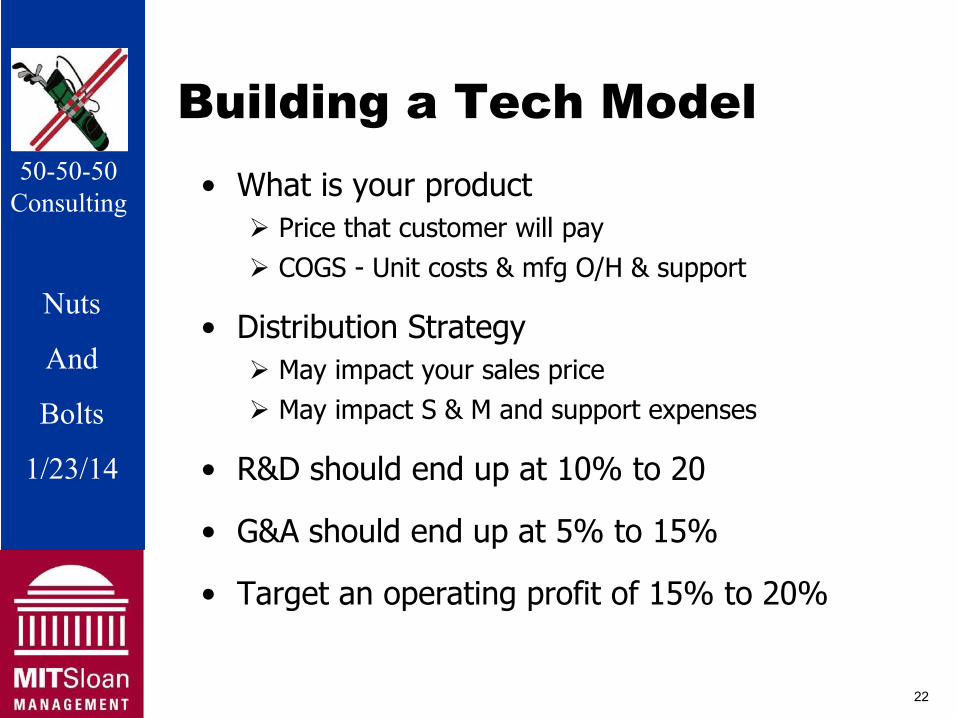
Building a Tech Model 50-50-50 • What is your product Consulting
Price that customer will pay COGS - Unit costs & mfg O/H & support
Nuts • Distribution Strategy
And May impact your sales price
Bolts May impact S & M and support expenses
1/23/14 • R&D should end up at 10% to 20
• G&A should end up at 5% to 15%
• Target an operating profit of 15% to 20%
22
Nuts
And
Bolts
1/23/14
50-50-50 Consulting
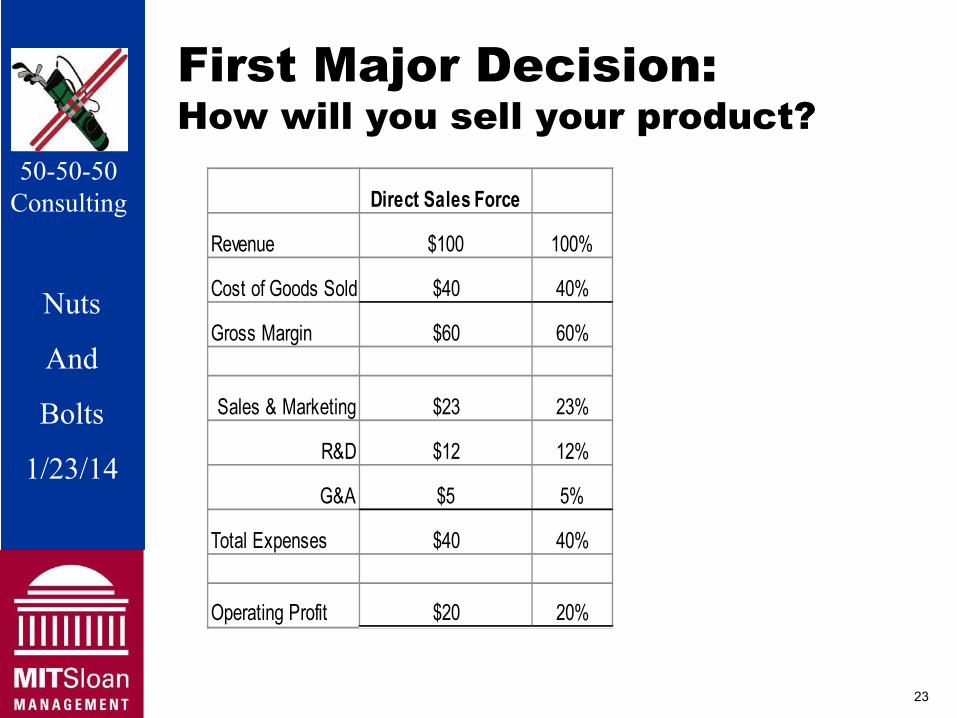
First Major Decision: How will you sell your product?
50-50-50 Consulting Direct Sales Force
Revenue $100 100%
Nuts Cost of Goods Sold $40 40%
Gross Margin $60 60%And
Bolts Sales & Marketing $23 23%
R&D $12 12%1/23/14 G&A $5 5%
Total Expenses $40 40%
Operating Profit $20 20%
23
Nuts
And
Bolts
1/23/14
50-50-50 Consulting
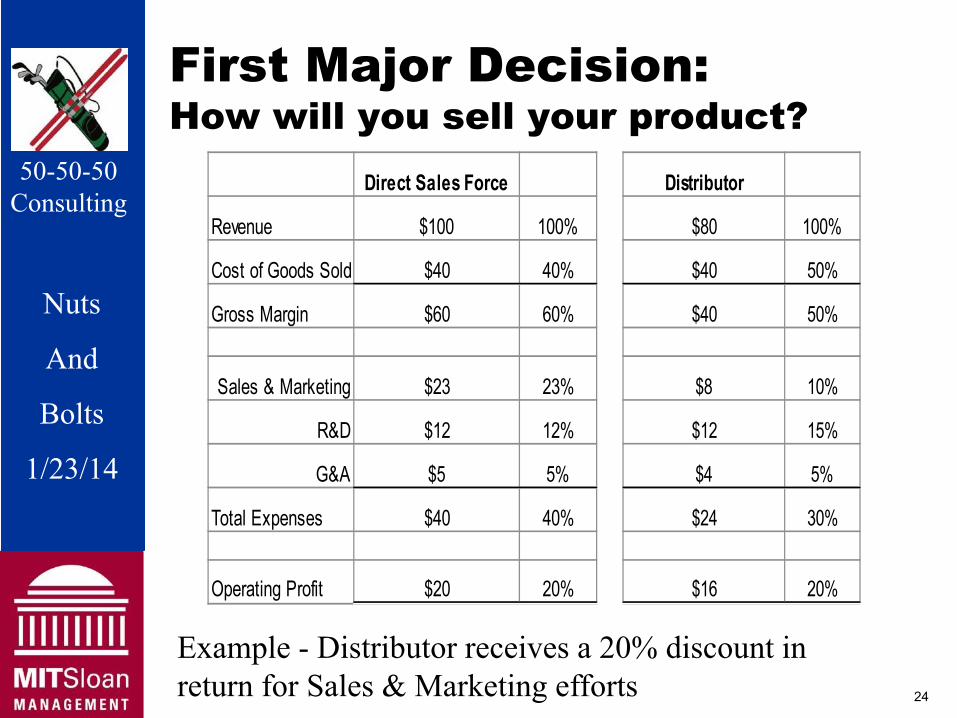
First Major Decision: How will you sell your product?
50-50-50 Direct Sales Force Distributor Consulting
Revenue $100 100% $80 100%
Cost of Goods Sold $40 40% $40 50%Nuts Gross Margin $60 60% $40 50%
AndSales & Marketing $23 23% $8 10%
Bolts R&D $12 12% $12 15%
1/23/14 G&A $5 5% $4 5%
Total Expenses $40 40% $24 30%
Operating Profit $20 20% $16 20%
Example - Distributor receives a 20% discount in return for Sales & Marketing efforts 24
Nuts
And
Bolts
1/23/14
50-50-50 Consulting
Building YOUR Model 50-50-50
Consulting • Do NOT use Business Planning Software
• Build Sales Projections from the bottom up Nuts
And• Do NOT project best-case/worst-case
Bolts
1/23/14
25
Nuts
And
Bolts
1/23/14
50-50-50 Consulting
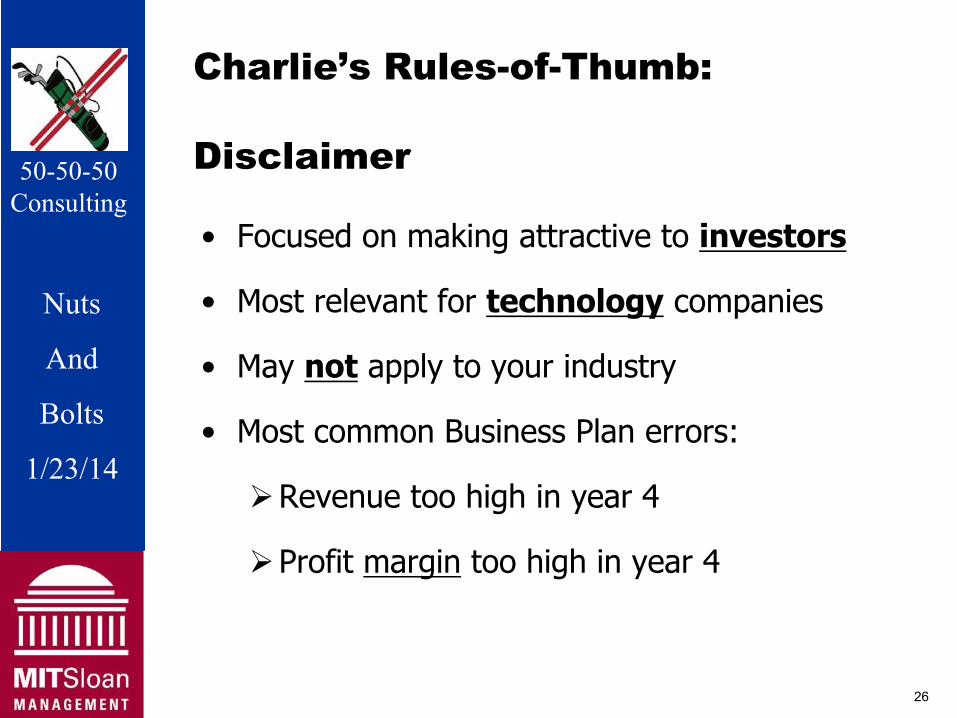
Charlie’s Rules-of-Thumb:
50-50-50 Disclaimer Consulting
• Focused on making attractive to investors
Nuts • Most relevant for technology companies
And • May not apply to your industry Bolts • Most common Business Plan errors:
1/23/14 Revenue too high in year 4
Profit margin too high in year 4
26
Nuts
And
Bolts
1/23/14
50-50-50 Consulting
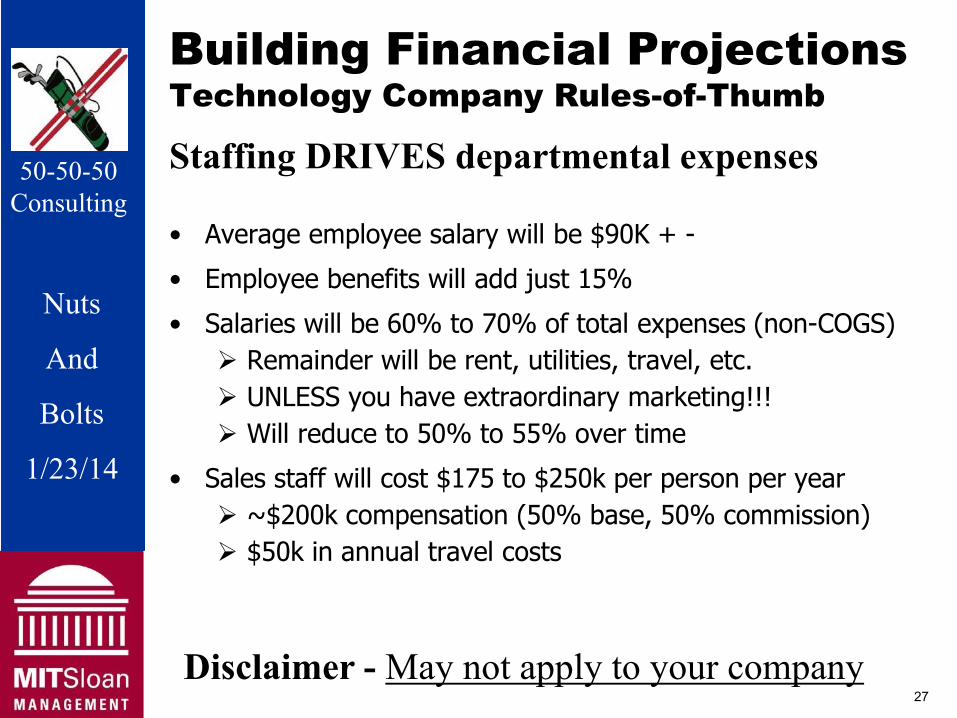
Building Financial Projections Technology Company Rules-of-Thumb
50-50-50 Staffing DRIVES departmental expenses Consulting
• Average employee salary will be $90K + -
• Employee benefits will add just 15% Nuts
• Salaries will be 60% to 70% of total expenses (non-COGS) And Remainder will be rent, utilities, travel, etc.
UNLESS you have extraordinary marketing!!! Bolts Will reduce to 50% to 55% over time
1/23/14 • Sales staff will cost $175 to $250k per person per year ~$200k compensation (50% base, 50% commission) $50k in annual travel costs
Disclaimer - May not apply to your company 27
Nuts
And
Bolts
1/23/14
50-50-50 Consulting
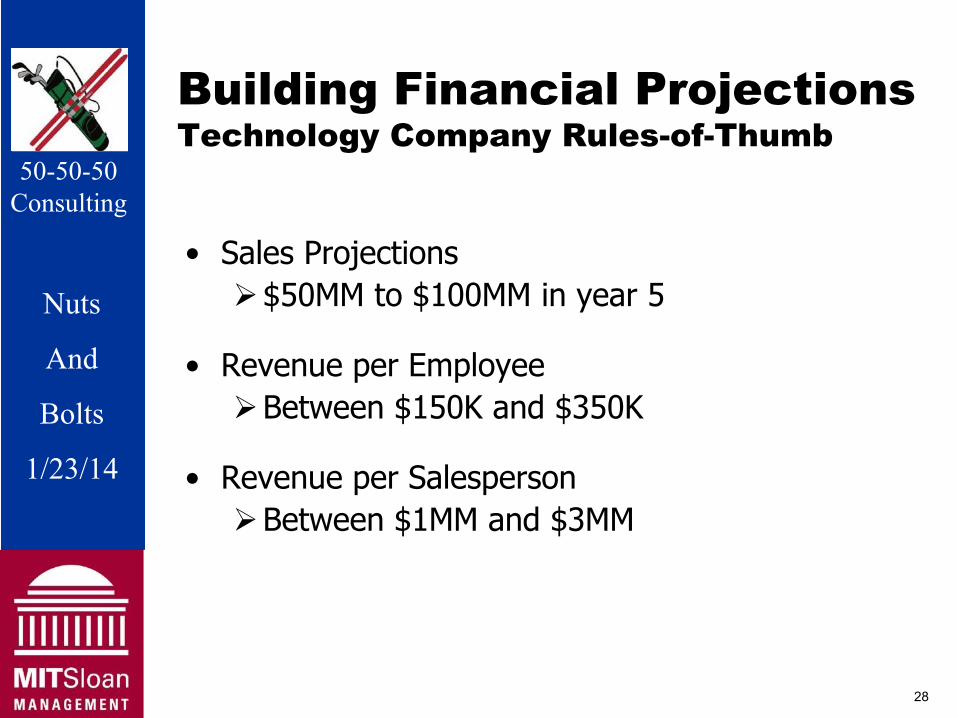
Building Financial Projections Technology Company Rules-of-Thumb
50-50-50 Consulting
• Sales Projections Nuts $50MM to $100MM in year 5
And • Revenue per Employee Bolts Between $150K and $350K
1/23/14 • Revenue per Salesperson Between $1MM and $3MM
28
Nuts
And
Bolts
1/23/14
50-50-50 Consulting
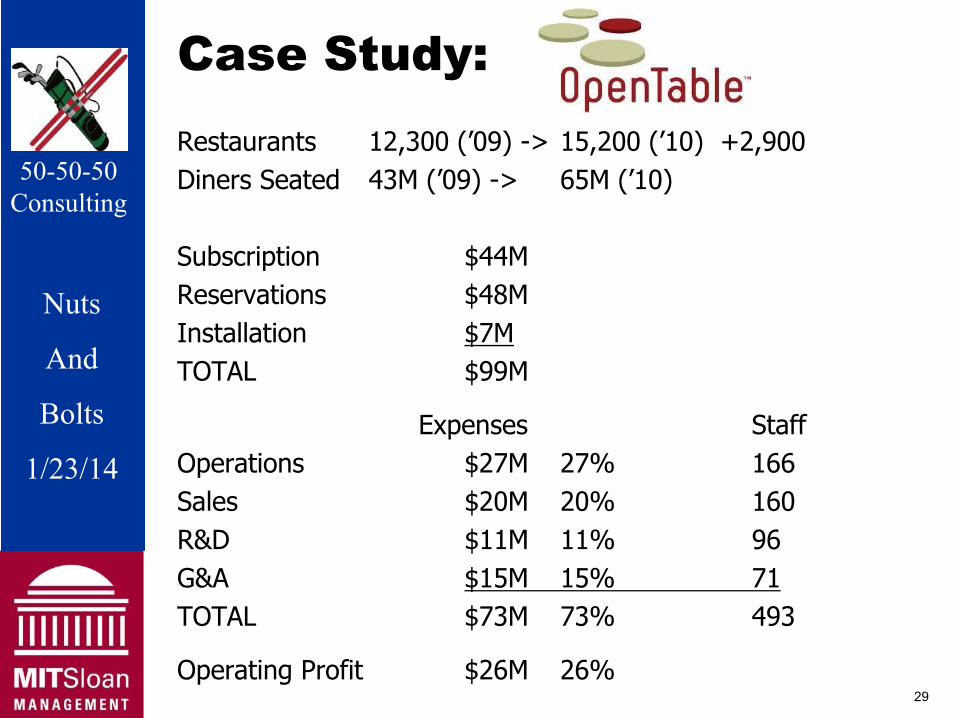
Case Study: Restaurants 12,300 (’09) -> 15,200 (’10) +2,900
50-50-50 Diners Seated 43M (’09) -> 65M (’10) Consulting
Subscription $44M
Nuts Reservations $48M Installation $7M
And TOTAL $99M
Bolts Expenses Staff
1/23/14 Operations $27M 27% 166 Sales $20M 20% 160 R&D $11M 11% 96 G&A $15M 15% 71 TOTAL $73M 73% 493
Operating Profit $26M 26% 29
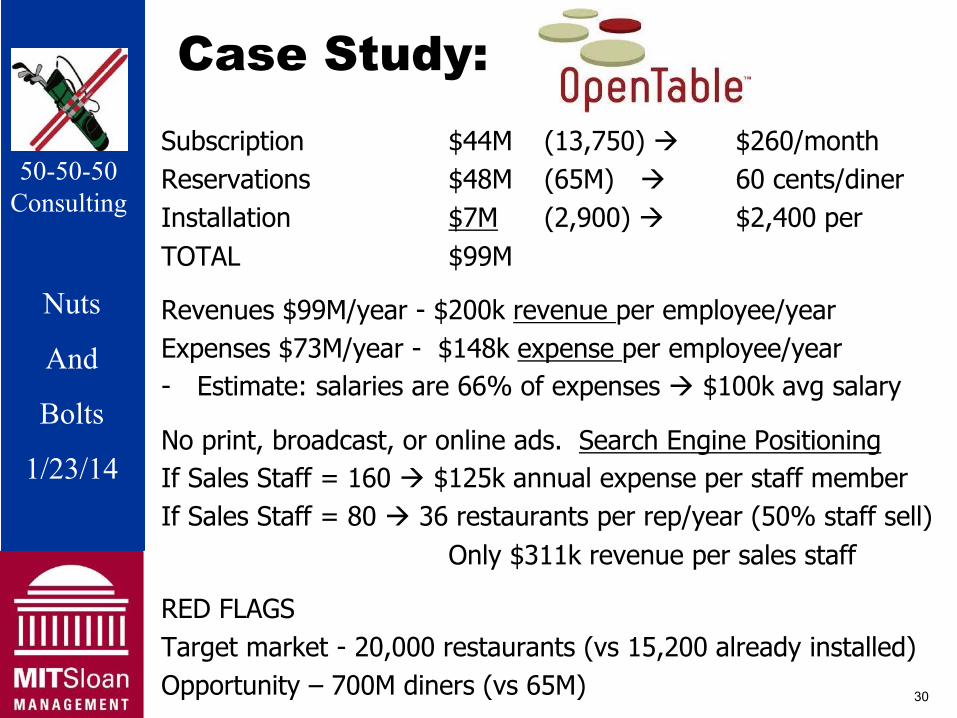
Case Study: Subscription $44M (13,750) $260/month
50-50-50 Reservations $48M (65M) 60 cents/diner Consulting Installation $7M (2,900) $2,400 per
TOTAL $99M
Nuts Revenues $99M/year - $200k revenue per employee/year
And Expenses $73M/year - $148k expense per employee/year - Estimate: salaries are 66% of expenses $100k avg salary
Bolts No print, broadcast, or online ads. Search Engine Positioning
1/23/14 If Sales Staff = 160 $125k annual expense per staff member If Sales Staff = 80 36 restaurants per rep/year (50% staff sell)
Only $311k revenue per sales staff
RED FLAGS Target market - 20,000 restaurants (vs 15,200 already installed) Opportunity – 700M diners (vs 65M) 30
Nuts
And
Bolts
1/23/14
50-50-50 Consulting
Case Study:
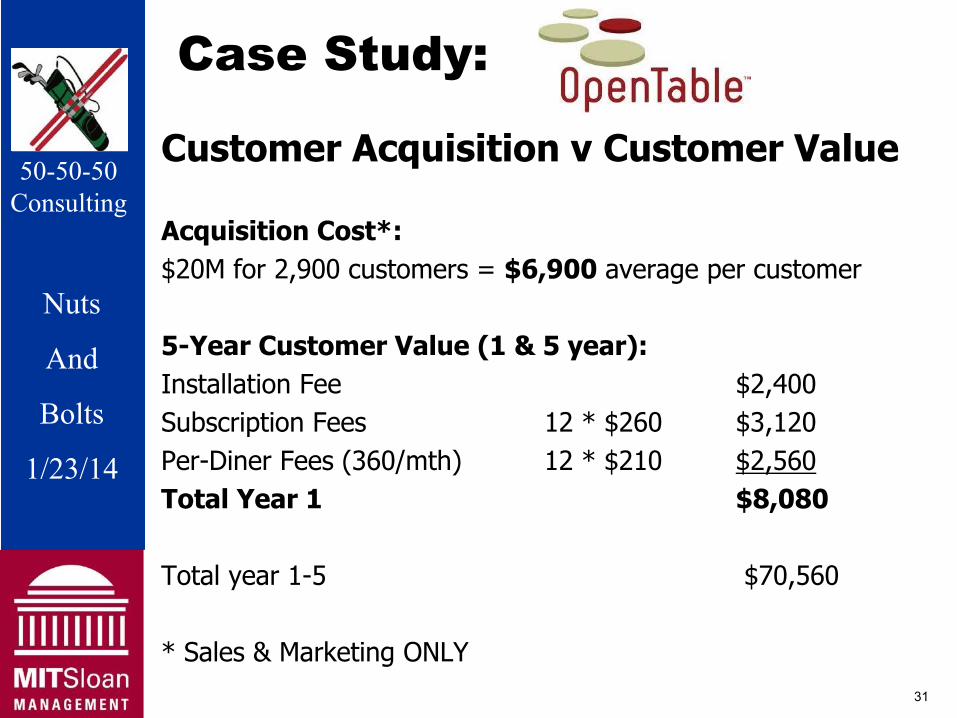
Customer Acquisition v Customer Value 50-50-50
Consulting Acquisition Cost*: $20M for 2,900 customers = $6,900 average per customer
Nuts 5-Year Customer Value (1 & 5 year): AndInstallation Fee $2,400
Bolts Subscription Fees 12 * $260 $3,120
1/23/14 Per-Diner Fees (360/mth) 12 * $210 $2,560 Total Year 1 $8,080
Total year 1-5 $70,560
* Sales & Marketing ONLY 31
Nuts
And
Bolts
1/23/14
50-50-50 Consulting
Case Study:
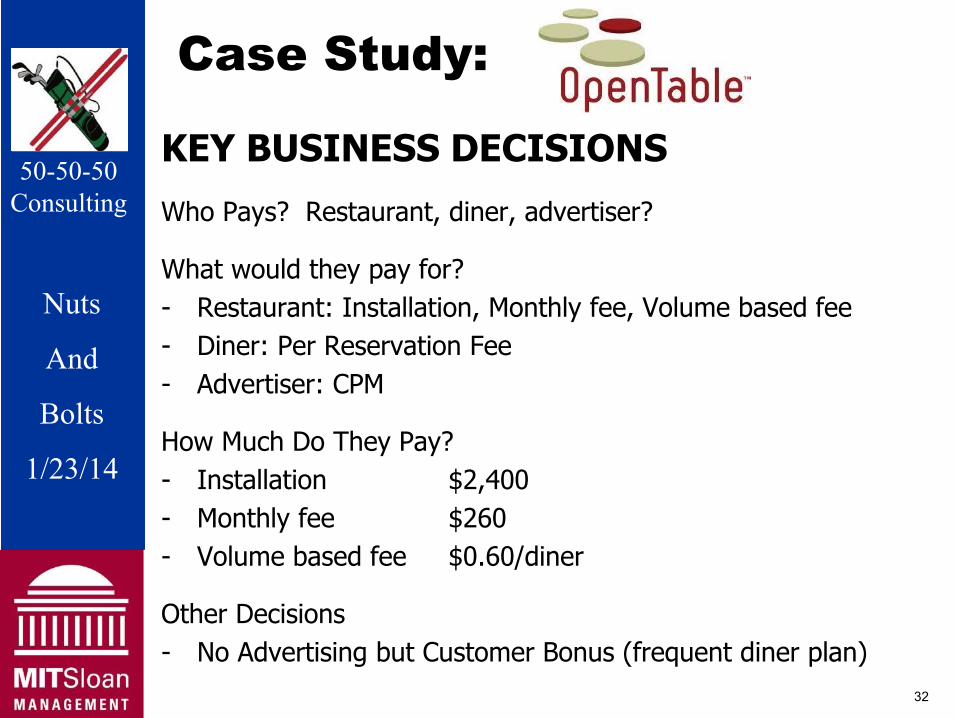
KEY BUSINESS DECISIONS 50-50-50
Consulting Who Pays? Restaurant, diner, advertiser?
What would they pay for? Nuts - Restaurant: Installation, Monthly fee, Volume based fee
- Diner: Per Reservation FeeAnd - Advertiser: CPM
Bolts How Much Do They Pay?
1/23/14 - Installation $2,400 - Monthly fee $260 - Volume based fee $0.60/diner
Other Decisions - No Advertising but Customer Bonus (frequent diner plan)
32
Nuts
And
Bolts
1/23/14
50-50-50 Consulting
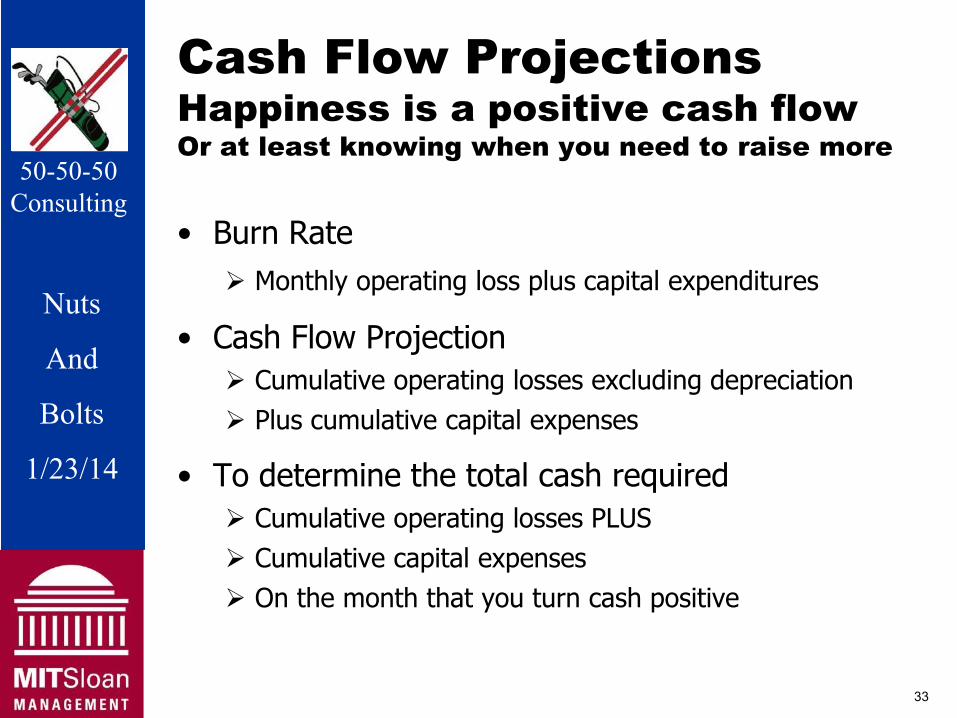
Cash Flow Projections Happiness is a positive cash flow Or at least knowing when you need to raise more
50-50-50 Consulting
• Burn Rate Monthly operating loss plus capital expenditures
Nuts • Cash Flow Projection
And Cumulative operating losses excluding depreciation
Bolts Plus cumulative capital expenses
1/23/14 • To determine the total cash required Cumulative operating losses PLUS Cumulative capital expenses On the month that you turn cash positive
33
Nuts
And
Bolts
1/23/14
50-50-50 Consulting
How Much to Pay Yourself
50-50-50 Consulting • VCs don’t want their entrepreneurs to starve
BUT Nuts
They want them to be hungry And
Bolts
1/23/14
34

Nuts
And
Bolts
1/23/14
50-50-50 Consulting
End Result 4 year Profit and Loss Statement
P & L by Year
Source Year 1 Year 2 Year 3 Year 4
Revenue
Product Revenue P&L By Qtr $1,700,000 95% $12,180,000 93% $34,810,000 92% $60,200,000 90%
Support Revenue P&L By Qtr $87,656 5% $910,649 7% $3,037,887 8% $6,431,460 10%
Total Revenue $1,787,656 100% $13,090,649 100% $37,847,887 100% $66,631,460 100%
COGS
Product COGS P&L By Qtr $598,063 33% $3,009,288 23% $9,366,100 25% $16,216,400 24%
Support COGS P&L By Qtr $326,975 18% $754,040 6% $1,355,383 4% $2,294,416 3%
Total COGS $925,038 52% $3,763,327 29% $10,721,483 28% $18,510,816 28%
Gross Margin $862,619 48% $9,327,322 71% $27,126,404 72% $48,120,644 72%
Expenses
Engineering P&L By Qtr $1,746,688 98% $3,824,863 29% $6,685,350 18% $11,415,663 17%
Marketing P&L By Qtr $811,375 45% $2,076,000 16% $3,448,350 9% $5,268,750 8%
Sales P&L By Qtr $1,316,500 74% $3,370,650 26% $6,016,050 16% $10,001,750 15%
G&A P&L By Qtr $1,091,625 61% $2,161,100 17% $3,593,250 9% $5,138,250 8%
Operating Exp. $4,966,188 278% $11,432,613 87% $19,743,000 52% $31,824,413 48%
Operating Profit $(4,103,569) -230% $(2,105,291) -16% $7,383,404 20% $16,296,232
50-50-50 Consulting
Nuts
And
Bolts
1/23/14
24%
Red – Input Magenta – TO another spreadsheet Black – Calculated Blue – FROM another spreadsheet 35

Nuts
And
Bolts
1/23/14
50-50-50 Consulting
Profit and Loss Statement Quarterly
P & L by Quarter Source Q1 Q2 Q3 Q4 Q1 Q2Year 1 Year 1 Year 1 Year 1 Year 2 Year 2
Revenue
Product Revenue Sales Plan $- $200,000 $500,000 $1,000,000 $1,740,000 $2,610,000
Support Revenue Sales Plan $- $7,500 $24,375 $55,781 $107,086 $178,189
Total Revenue $- $207,500 $524,375 $1,055,781 $1,847,086 $2,788,189
COGS Product COGS COGS $84,000 $114,000 $146,500 $253,563 $492,575 $698,538
Support COGS COGS $75,900 $77,900 $82,400 $90,775 $153,161 $174,252
Total COGS $159,900 $191,900 $228,900 $344,338 $645,736 $872,790
Gross Margin $(84,000) $93,500 $377,875 $802,219 $1,354,511 $2,089,652
Expenses Engineering Expenses $230,000 $426,938 $497,813 $591,938 $731,363 $914,250
Marketing Expenses $132,813 $157,813 $213,875 $306,875 $367,163 $496,388
Sales Expenses $160,563 $240,250 $411,000 $504,688 $623,450 $809,925
G&A Expenses $213,013 $243,538 $313,238 $321,838 $505,863 $516,088
Operating Exp. $736,388 $1,068,538 $1,435,925 $1,725,338 $2,227,838 $2,736,650
Operating Profit $(820,388) $(975,038) $(1,058,050) $(923,119) $(873,327) $(646,998)
50-50-50 Consulting
Nuts
And
Bolts
1/23/14
Red – Input Magenta – TO another spreadsheet Black – Calculated Blue – FROM another spreadsheet 36
Nuts
And
Bolts
1/23/14
50-50-50 Consulting
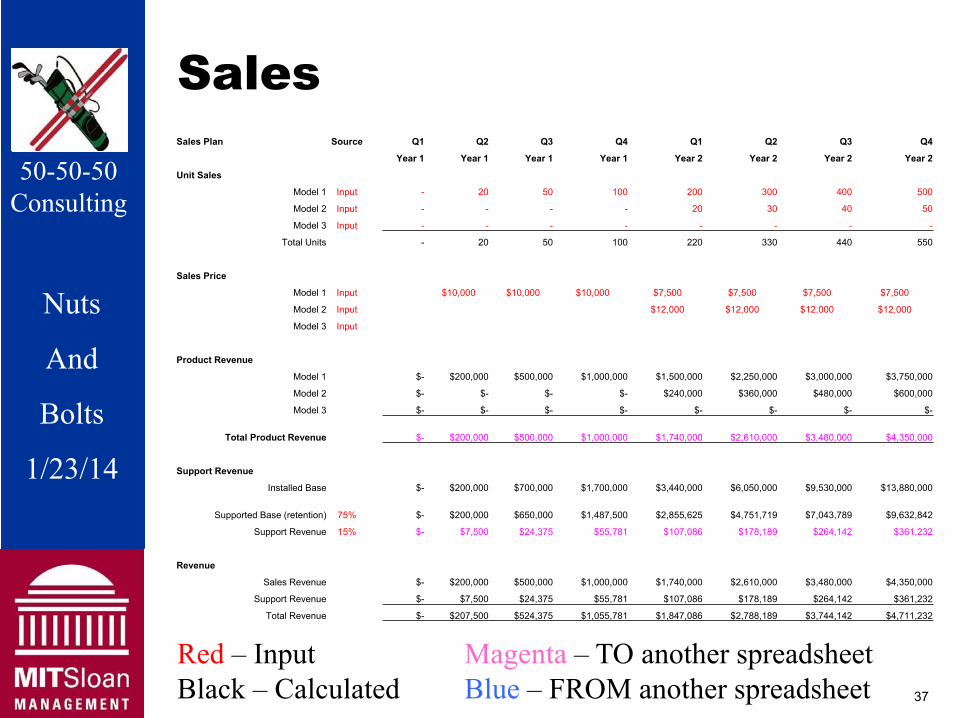
Sales Sales Plan Source Q1 Q2 Q3 Q4 Q1 Q2 Q3 Q4
Year 1 Year 1 Year 1 Year 1 Year 2 Year 2 Year 2 Year 2
Unit Sales
Model 1 Input - 20 50 100 200 300 400 500
Model 2 Input - - - - 20 30 40 50
Model 3 Input - - - - - - - -
Total Units - 20 50 100 220 330 440 550
Sales Price
Model 1 Input $10,000 $10,000 $10,000 $7,500 $7,500 $7,500 $7,500
Model 2 Input $12,000 $12,000 $12,000 $12,000
Model 3 Input
Product Revenue
Model 1 $- $200,000 $500,000 $1,000,000 $1,500,000 $2,250,000 $3,000,000 $3,750,000
Model 2 $- $- $- $- $240,000 $360,000 $480,000 $600,000
Model 3 $- $- $- $- $- $- $- $-
Total Product Revenue $- $200,000 $500,000 $1,000,000 $1,740,000 $2,610,000 $3,480,000 $4,350,000
Support Revenue
Installed Base $- $200,000 $700,000 $1,700,000 $3,440,000 $6,050,000 $9,530,000 $13,880,000
Supported Base (retention) 75% $- $200,000 $650,000 $1,487,500 $2,855,625 $4,751,719 $7,043,789 $9,632,842
Support Revenue 15% $- $7,500 $24,375 $55,781 $107,086 $178,189 $264,142 $361,232
Revenue
Sales Revenue $- $200,000 $500,000 $1,000,000 $1,740,000 $2,610,000 $3,480,000 $4,350,000
Support Revenue $- $7,500 $24,375 $55,781 $107,086 $178,189 $264,142 $361,232
Total Revenue $- $207,500 $524,375 $1,055,781 $1,847,086 $2,788,189 $3,744,142 $4,711,232
50-50-50 Consulting
Nuts
And
Bolts
1/23/14
Red – Input Magenta – TO another spreadsheet Black – Calculated Blue – FROM another spreadsheet 37
Nuts
And
Bolts
1/23/14
50-50-50 Consulting
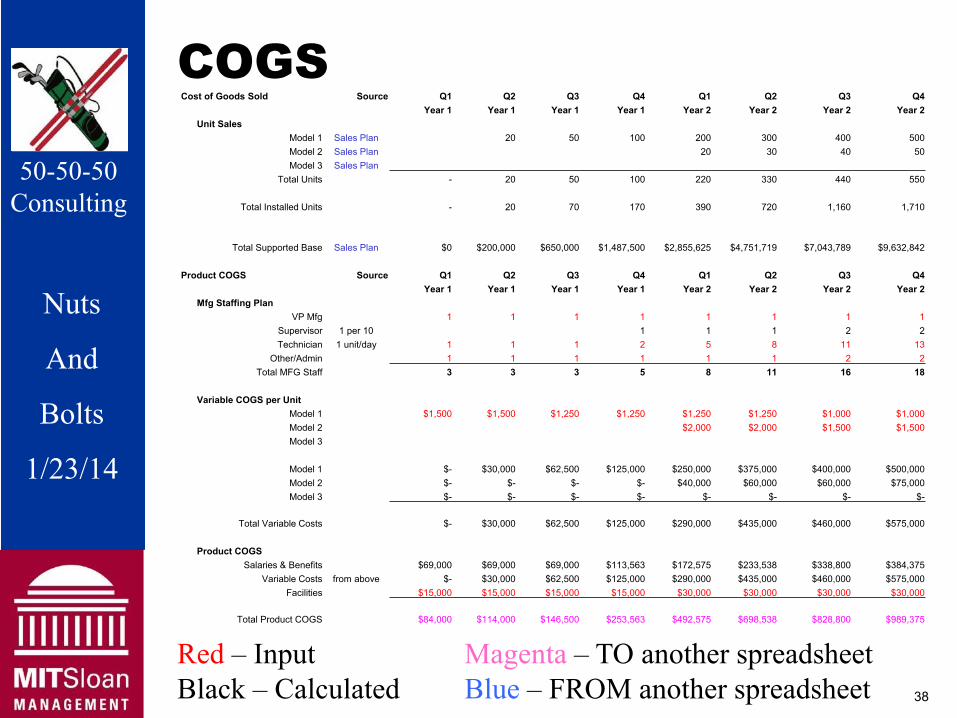
COGSCost of Goods Sold Source Q1 Q2 Q3 Q4 Q1 Q2 Q3 Q4
Year 1 Year 1 Year 1 Year 1 Year 2 Year 2 Year 2 Year 2 Unit Sales
Model 1 Sales Plan 20 50 100 200 300 400 500 Model 2 Sales Plan 20 30 40 50 Model 3 Sales Plan
Total Units - 20 50 100 220 330 440 550
Total Installed Units - 20 70 170 390 720 1,160 1,710
Total Supported Base Sales Plan $0 $200,000 $650,000 $1,487,500 $2,855,625 $4,751,719 $7,043,789 $9,632,842
Product COGS Source Q1 Q2 Q3 Q4 Q1 Q2 Q3 Q4Year 1 Year 1 Year 1 Year 1 Year 2 Year 2 Year 2 Year 2
Mfg Staffing Plan VP Mfg 1 1 1 1 1 1 1 1
Supervisor 1 per 10 1 1 1 2 2Technician 1 unit/day 1 1 1 2 5 8 11 13
Other/Admin 1 1 1 1 1 1 2 2Total MFG Staff 3 3 3 5 8 11 16 18
Variable COGS per Unit Model 1 $1,500 $1,500 $1,250 $1,250 $1,250 $1,250 $1,000 $1,000 Model 2 $2,000 $2,000 $1,500 $1,500 Model 3
Model 1 $- $30,000 $62,500 $125,000 $250,000 $375,000 $400,000 $500,000 Model 2 $- $- $- $- $40,000 $60,000 $60,000 $75,000 Model 3 $- $- $- $- $- $- $- $-
Total Variable Costs $- $30,000 $62,500 $125,000 $290,000 $435,000 $460,000 $575,000
Product COGS Salaries & Benefits $69,000 $69,000 $69,000 $113,563 $172,575 $233,538 $338,800 $384,375
Variable Costs from above $- $30,000 $62,500 $125,000 $290,000 $435,000 $460,000 $575,000 Facilities $15,000 $15,000 $15,000 $15,000 $30,000 $30,000 $30,000 $30,000
Total Product COGS $84,000 $114,000 $146,500 $253,563 $492,575 $698,538 $828,800 $989,375
50-50-50 Consulting
Nuts
And
Bolts
1/23/14
Red – Input Magenta – TO another spreadsheet Black – Calculated Blue – FROM another spreadsheet 38
Nuts
And
Bolts
1/23/14
50-50-50 Consulting
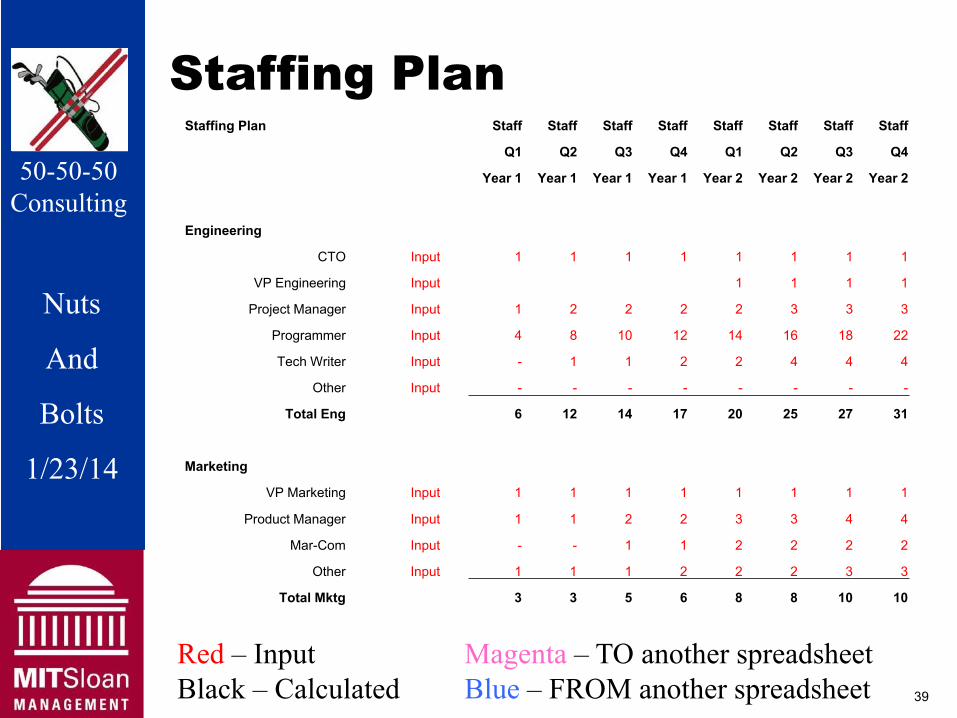
Staffing Plan Staffing Plan Staff Staff Staff Staff Staff Staff Staff Staff
Q1 Q2 Q3 Q4 Q1 Q2 Q3 Q4
Year 1 Year 1 Year 1 Year 1 Year 2 Year 2 Year 2 Year 2 50-50-50 Consulting
Engineering
CTO Input 1 1 1 1 1 1 1 1
Nuts VP Engineering Input 1 1 1 1
Project Manager Input 1 2 2 2 2 3 3 3
Programmer Input 4 8 10 12 14 16 18 22
And Tech Writer Input - 1 1 2 2 4 4 4
Other Input - - - - - - - -
Bolts Total Eng 6 12 14 17 20 25 27 31
1/23/14 Marketing
VP Marketing Input 1 1 1 1 1 1 1 1
Product Manager Input 1 1 2 2 3 3 4 4
Mar-Com Input - - 1 1 2 2 2 2
Other Input 1 1 1 2 2 2 3 3
Total Mktg 3 3 5 6 8 8 10 10
Red – Input Magenta – TO another spreadsheet Black – Calculated Blue – FROM another spreadsheet 39
Nuts
And
Bolts
1/23/14
50-50-50 Consulting
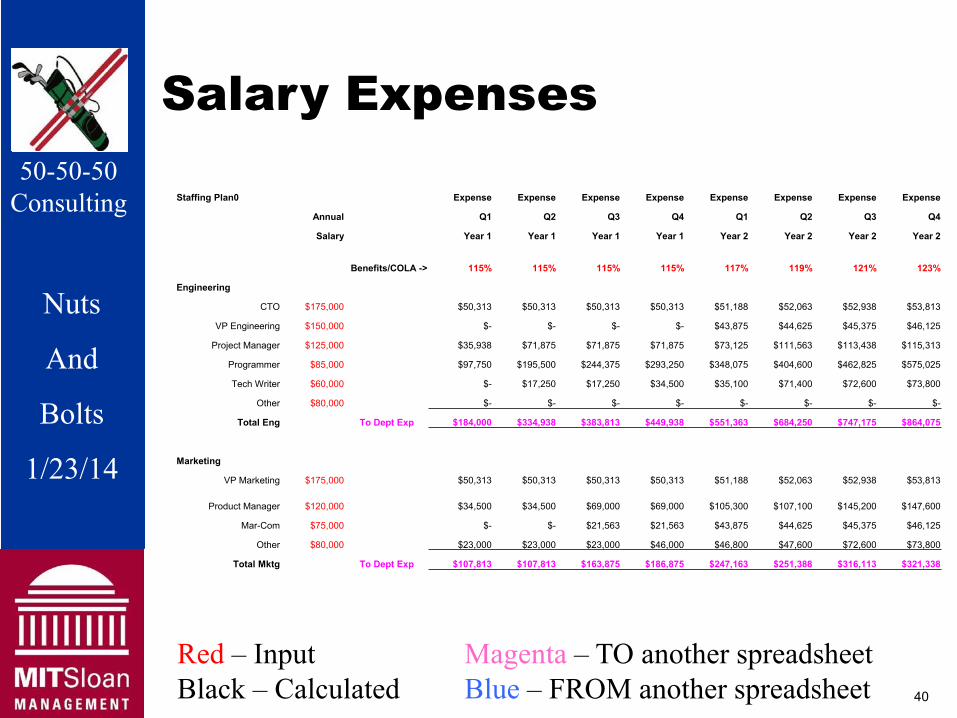
Salary Expenses 50-50-50
Consulting Staffing Plan0 Expense Expense Expense Expense Expense Expense Expense Expense
Annual Q1 Q2 Q3 Q4 Q1 Q2 Q3 Q4
Salary Year 1 Year 1 Year 1 Year 1 Year 2 Year 2 Year 2 Year 2
Benefits/COLA -> 115% 115% 115% 115% 117% 119% 121% 123%
Nuts Engineering
CTO $175,000 $50,313 $50,313 $50,313 $50,313 $51,188 $52,063 $52,938 $53,813
VP Engineering $150,000 $- $- $- $- $43,875 $44,625 $45,375 $46,125
And Project Manager $125,000 $35,938 $71,875 $71,875 $71,875 $73,125 $111,563 $113,438 $115,313
Programmer $85,000 $97,750 $195,500 $244,375 $293,250 $348,075 $404,600 $462,825 $575,025
Tech Writer $60,000 $- $17,250 $17,250 $34,500 $35,100 $71,400 $72,600 $73,800
Bolts Other $80,000 $- $- $- $- $- $- $- $-
Total Eng To Dept Exp $184,000 $334,938 $383,813 $449,938 $551,363 $684,250 $747,175 $864,075
1/23/14 Marketing
VP Marketing $175,000 $50,313 $50,313 $50,313 $50,313 $51,188 $52,063 $52,938 $53,813
Product Manager $120,000 $34,500 $34,500 $69,000 $69,000 $105,300 $107,100 $145,200 $147,600
Mar-Com $75,000 $- $- $21,563 $21,563 $43,875 $44,625 $45,375 $46,125
Other $80,000 $23,000 $23,000 $23,000 $46,000 $46,800 $47,600 $72,600 $73,800
Total Mktg To Dept Exp $107,813 $107,813 $163,875 $186,875 $247,163 $251,388 $316,113 $321,338
Red – Input Magenta – TO another spreadsheet Black – Calculated Blue – FROM another spreadsheet 40
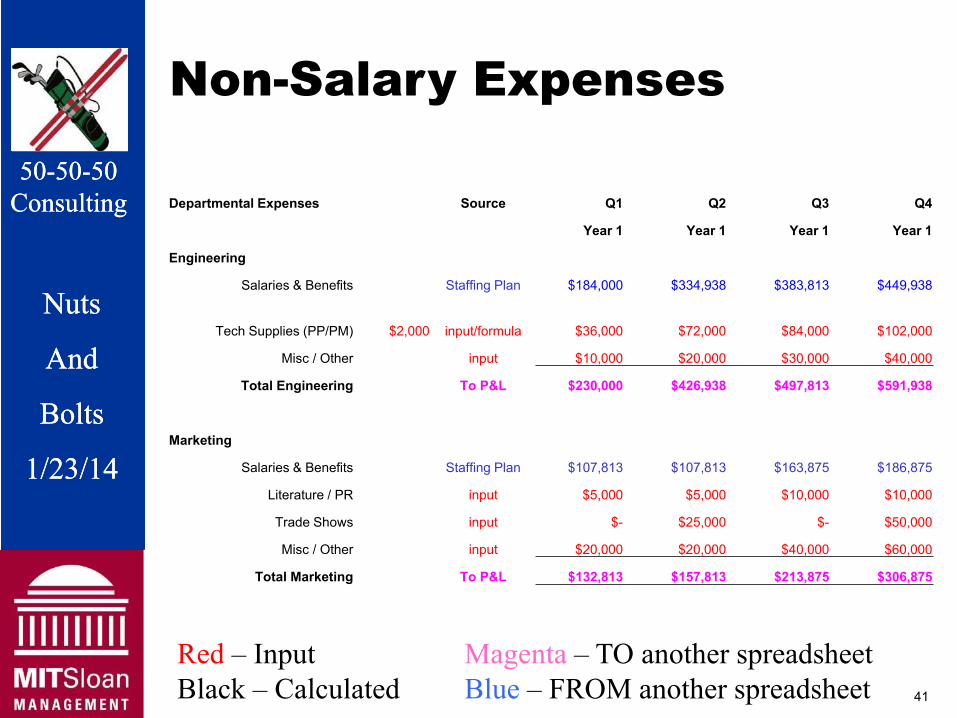
Non-Salary Expenses
5050--5050--5050 CConsultonsultiingng Departmental Expenses Source Q1 Q2 Q3 Q4
Year 1 Year 1 Year 1 Year 1
Engineering
NutNuts s Salaries & Benefits Staffing Plan $184,000 $334,938 $383,813 $449,938
Tech Supplies (PP/PM) $2,000 input/formula $36,000 $72,000 $84,000 $102,000
AndAnd Misc / Other input $10,000 $20,000 $30,000 $40,000
Total Engineering To P&L $230,000 $426,938 $497,813 $591,938
BoBolts lts Marketing
1/1/23/23/14 14 Salaries & Benefits Staffing Plan $107,813 $107,813 $163,875 $186,875
Literature / PR input $5,000 $5,000 $10,000 $10,000
Trade Shows input $- $25,000 $- $50,000
Misc / Other input $20,000 $20,000 $40,000 $60,000
Total Marketing To P&L $132,813 $157,813 $213,875 $306,875
Red – Input Magenta – TO another spreadsheet Black – Calculated Blue – FROM another spreadsheet 41
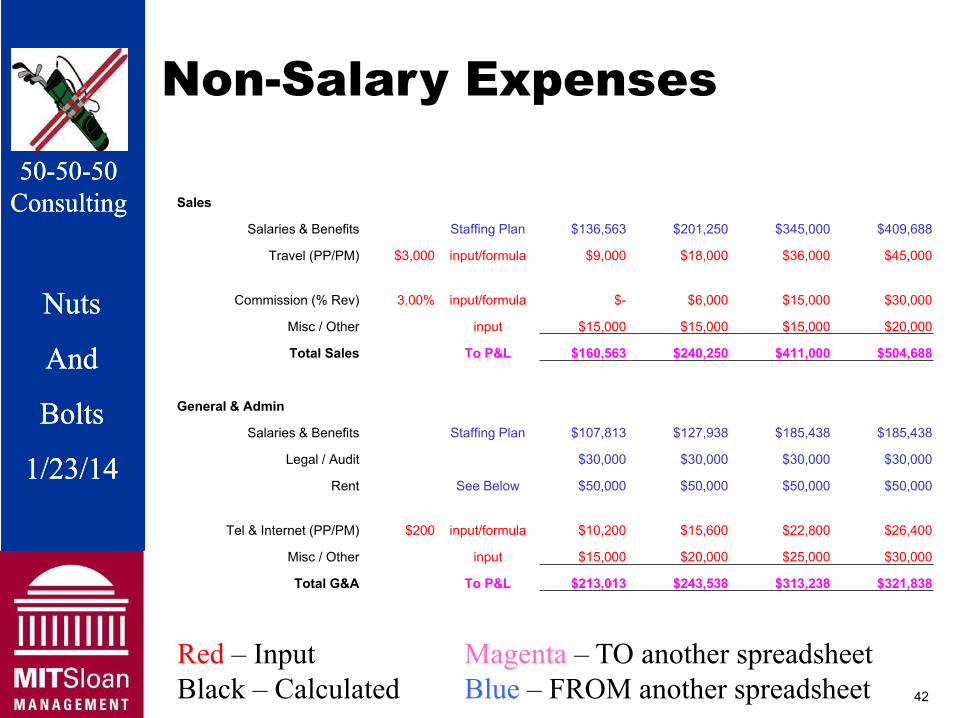
Non-Salary Expenses
5050--5050--5050 CConsultonsultiingng Sales
Salaries & Benefits Staffing Plan $136,563 $201,250 $345,000 $409,688
Travel (PP/PM) $3,000 input/formula $9,000 $18,000 $36,000 $45,000
NutNuts s Commission (% Rev) 3.00% input/formula $- $6,000 $15,000 $30,000
Misc / Other input $15,000 $15,000 $15,000 $20,000
AndAnd Total Sales To P&L $160,563 $240,250 $411,000 $504,688
BoBolts lts General & Admin
Salaries & Benefits Staffing Plan $107,813 $127,938 $185,438 $185,438
1/1/23/23/14 14 Legal / Audit $30,000 $30,000 $30,000 $30,000
Rent See Below $50,000 $50,000 $50,000 $50,000
Tel & Internet (PP/PM) $200 input/formula $10,200 $15,600 $22,800 $26,400
Misc / Other input $15,000 $20,000 $25,000 $30,000
Total G&A To P&L $213,013 $243,538 $313,238 $321,838
Red – Input Magenta – TO another spreadsheet Black – Calculated Blue – FROM another spreadsheet 42
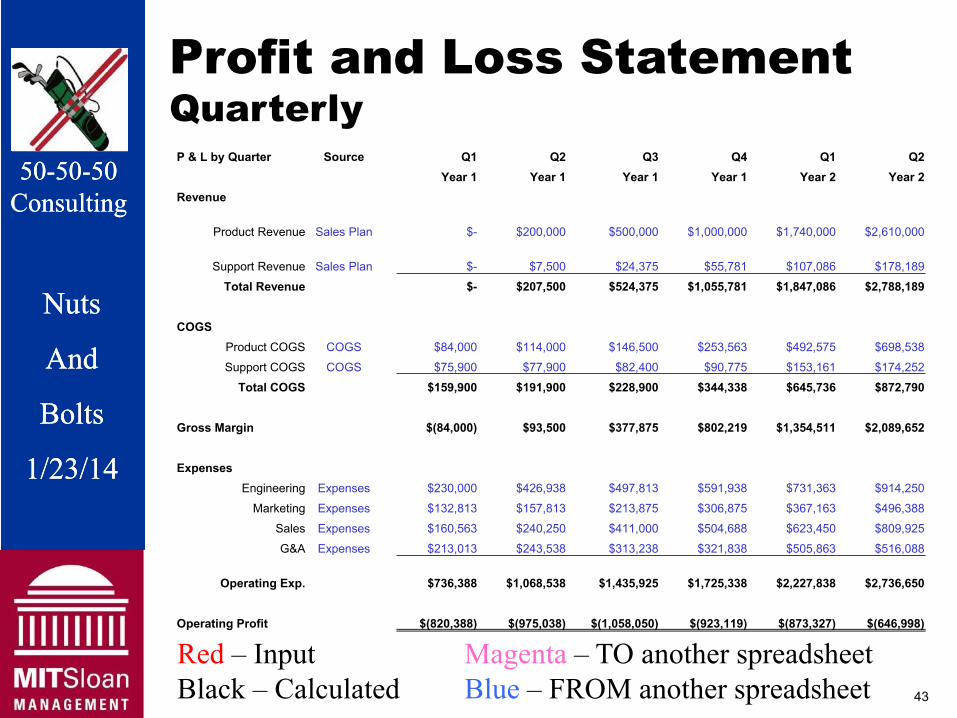
Profit and Loss Statement Quarterly
5050--5050--5050 P & L by Quarter Source Q1 Q2 Q3 Q4 Q1 Q2
Year 1 Year 1 Year 1 Year 1 Year 2 Year 2
CConsultonsultiingng Revenue
Product Revenue Sales Plan $- $200,000 $500,000 $1,000,000 $1,740,000 $2,610,000
Support Revenue Sales Plan $- $7,500 $24,375 $55,781 $107,086 $178,189
NutNuts s Total Revenue $- $207,500 $524,375 $1,055,781 $1,847,086 $2,788,189
COGS
AndAnd Product COGS COGS $84,000 $114,000 $146,500 $253,563 $492,575 $698,538
Support COGS COGS $75,900 $77,900 $82,400 $90,775 $153,161 $174,252
Total COGS $159,900 $191,900 $228,900 $344,338 $645,736 $872,790
BoBolts lts Gross Margin $(84,000) $93,500 $377,875 $802,219 $1,354,511 $2,089,652
1/1/23/23/14 14 Expenses Engineering Expenses $230,000 $426,938 $497,813 $591,938 $731,363 $914,250
Marketing Expenses $132,813 $157,813 $213,875 $306,875 $367,163 $496,388
Sales Expenses $160,563 $240,250 $411,000 $504,688 $623,450 $809,925
G&A Expenses $213,013 $243,538 $313,238 $321,838 $505,863 $516,088
Operating Exp. $736,388 $1,068,538 $1,435,925 $1,725,338 $2,227,838 $2,736,650
Operating Profit $(820,388) $(975,038) $(1,058,050) $(923,119) $(873,327) $(646,998)
Red – Input Magenta – TO another spreadsheet Black – Calculated Blue – FROM another spreadsheet 43

CAPEX & Cash Flow Cash Flow Source Q1 Q2 Q3 Q4 Q1
50-50-50 Year 1 Year 1 Year 1 Year 1 Year 2
Beginning Cash $- $4,019,713 $2,607,275 $923,950 $11,090,650
Consulting Investment Input $5,000,000 $- $- $12,000,000
Total Revenue From P&L Quarterly * $- $- $207,500 $524,375 $1,055,781
Nuts * delay 1 quarter
COGS Expenses From P&L Quarterly $(159,900) $(191,900) $(228,900) $(344,338) $(645,736)
Departmental Expenses From P&L Quarterly $(736,388) $(1,068,538) $(1,435,925) $(1,725,338) $(2,227,838)
And Capital Expense From P&L CAPEX $(84,000) $(152,000) $(226,000) $(288,000) $(312,000)
Change in Cash $4,019,713 $(1,412,438) $(1,683,325) $10,166,700 $(2,129,793)
Bolts Ending Balance $4,019,713 $2,607,275 $923,950 $11,090,650 $8,960,858
1/23/14 Capital Expenses Q1 Q2 Q3 Q4 Q1
Year 1 Year 1 Year 1 Year 1 Year 1
Employee Workstations (PP) $2,000 $34,000 $52,000 $76,000 $88,000 $112,000
Prototype Expenses Input $50,000 $100,000 $150,000 $200,000 $200,000
$84,000 $152,000 $226,000 $288,000 $312,000
Cumulative CAPEX $84,000 $236,000 $462,000 $750,000 $1,062,000
Red – Input Magenta – TO another spreadsheet Black – Calculated Blue – FROM another spreadsheet 44
Nuts
And
Bolts
1/23/14
50-50-50 Consulting
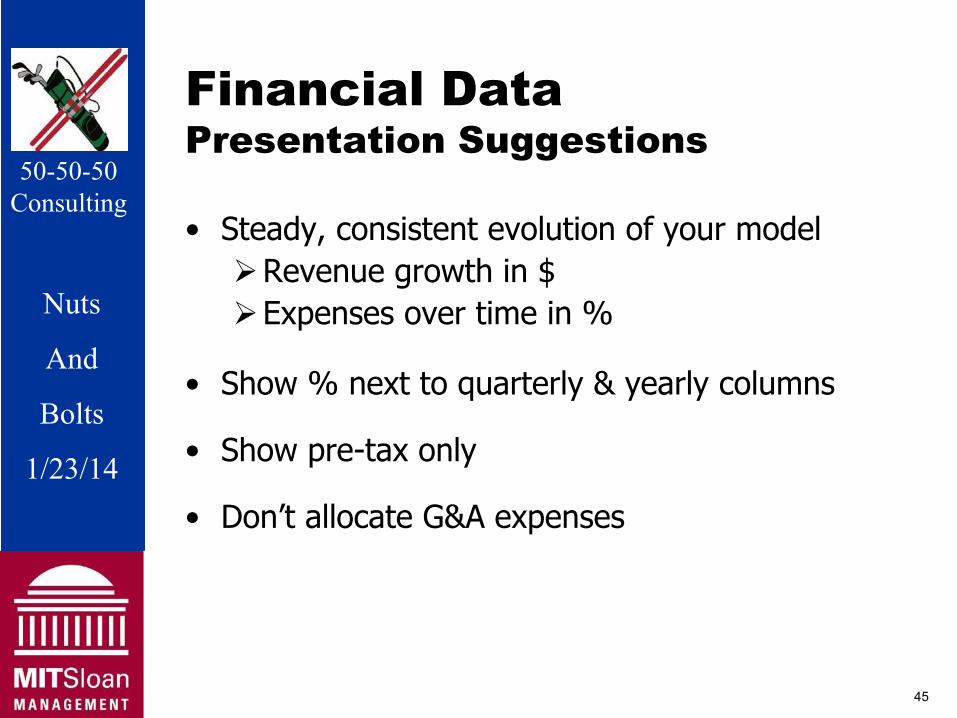
Financial Data Presentation Suggestions
50-50-50 Consulting
• Steady, consistent evolution of your model Revenue growth in $
Nuts Expenses over time in % And
• Show % next to quarterly & yearly columns Bolts
• Show pre-tax only 1/23/14 • Don’t allocate G&A expenses
45
Nuts
And
Bolts
1/23/14
50-50-50 Consulting
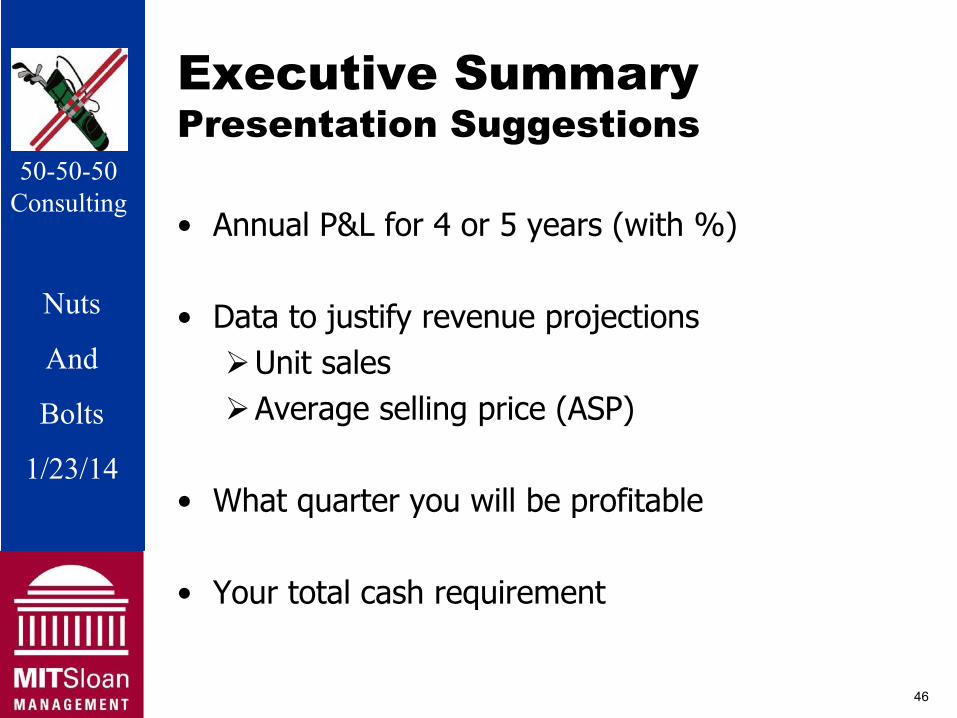
Executive Summary Presentation Suggestions
50-50-50 Consulting
• Annual P&L for 4 or 5 years (with %)
Nuts • Data to justify revenue projections And Unit sales Bolts Average selling price (ASP)
1/23/14 • What quarter you will be profitable
• Your total cash requirement
46
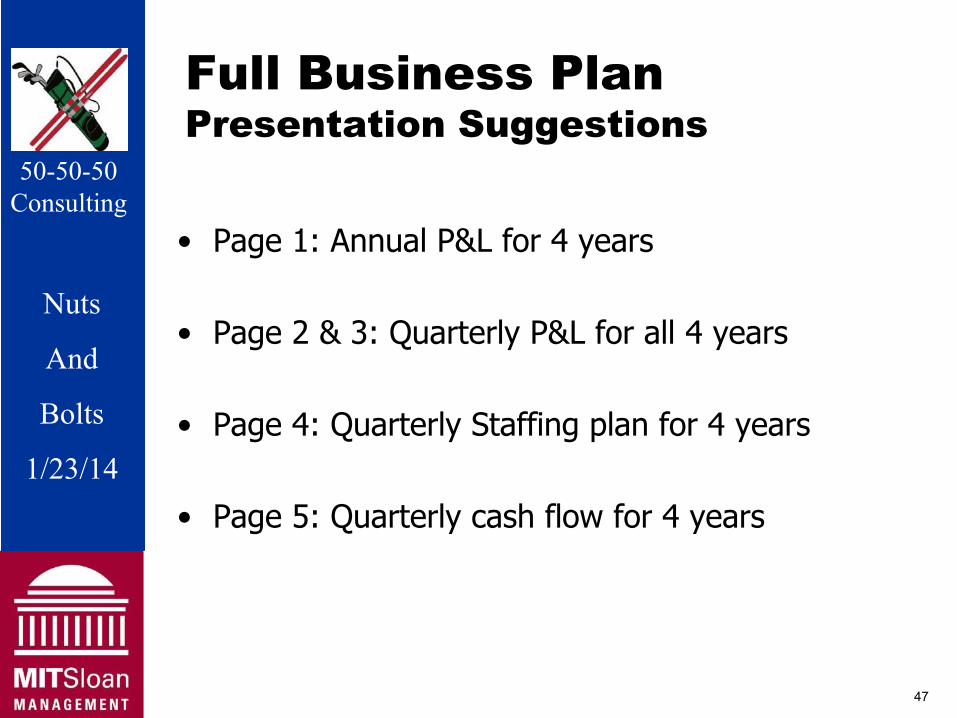
Full Business Plan Presentation Suggestions
50-50-50 Consulting
• Page 1: Annual P&L for 4 years
Nuts • Page 2 & 3: Quarterly P&L for all 4 years
And
Bolts • Page 4: Quarterly Staffing plan for 4 years 1/23/14
• Page 5: Quarterly cash flow for 4 years
47
Sharing the Pie 50-50-50 Thoughts on Equity Distribution
Consulting
Nuts
And
Bolts
1/23/14
48
Nuts
And
Bolts
1/23/14
50-50-50 Consulting
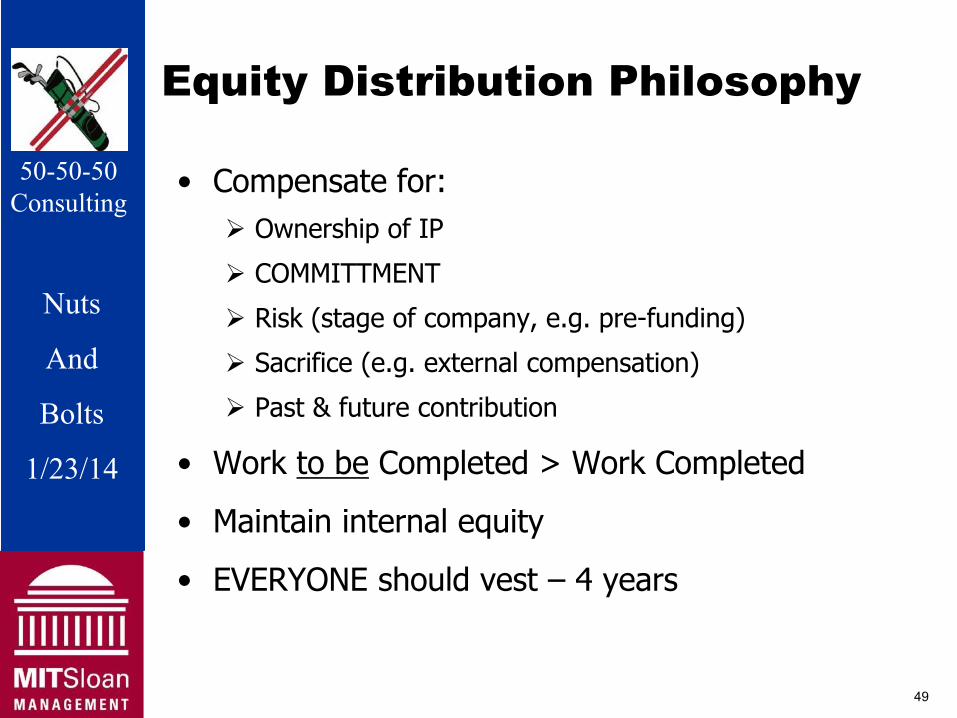
Equity Distribution Philosophy
50-50-50 • Compensate for: Consulting
Ownership of IP
COMMITTMENT Nuts Risk (stage of company, e.g. pre-funding) And Sacrifice (e.g. external compensation)
Bolts Past & future contribution
1/23/14 • Work to be Completed > Work Completed
• Maintain internal equity
• EVERYONE should vest – 4 years
49

Nuts
And
Bolts
1/23/14
50-50-50 Consulting
Employee Specifics 50-50-50
Consulting Ownership % after 2 rounds of financing
CEO 5%Nuts VP 1% to 2 ½ % AndSr Manager .25% (1/4 of 1%) Bolts Sr Ind Contributor .1% (1/10 of 1%)
1/23/14
• Founding management might get 2x to 3x • Founding employees might get 5x to 10x
YOU CAN ALWAYS GRANT MORE LATER
50

Equity Distribution Example 5050--5050--5050 After Early
Initial Employees Post Angel Post VC 1 Post VC 2
CConsultonsultiingng Name Title # Shares % Shares % Shares % Shares % Shares %
Founders
Jack CEO 2,000,000 50.0% 2,000,000 44.4% 2,000,000 40.0% 2,000,000 15.1% 2,000,000 9.1%
Susan CTO 1,000,000 25.0% 1,000,000 22.2% 1,000,000 20.0% 1,000,000 7.6% 1,000,000 4.5%
Anil VP Sales 1,000,000 25.0% 1,000,000 22.2% 1,000,000 20.0% 1,000,000 7.6% 1,000,000 4.5%
Total 4,000,000 100.0% 4,000,000 88.9% 4,000,000 80.0% 4,000,000 30.3% 4,000,000 18.2%
NutNuts s Key Early Employees
Jack VP R&D 250,000 5.6% 250,000 5.0% 250,000 1.9% 250,000 1.1%
Julie Manager 1 100,000 2.2% 100,000 2.0% 100,000 0.8% 100,000 0.5%
AndAndSam Manager 2 75,000 1.7% 75,000 1.5% 75,000 0.6% 75,000 0.3%
Total - 0.0% 425,000 9.4% 425,000 8.5% 425,000 3.2% 425,000 1.9%
Advisors Per Person # PP
BoBolts lts Board Members 25,000 3 75,000 1.7% 75,000 1.5% 75,000 0.6% 75,000 0.3% 0.11%
Total - 0.0% 75,000 1.7% 75,000 1.5% 75,000 0.6% 75,000 0.3%
1/1/23/23/14 14 Option Plan Per Person # PP
Manager 50,000 10 500,000 3.8% 500,000 2.3% 0.23%
Sr. Eng 25,000 20 500,000 3.8% 500,000 2.3% 0.11%
Jr. Eng 15,000 40 600,000 4.5% 600,000 2.7% 0.07%
Admin 1,000 10 10,000 0.1% 10,000 0.0%
Total 80 - 0.0% - 0.0% - 0.0% 1,610,000 12.2% 1,610,000 7.3%
Investors
Angels ($500K at $4.5MM) 500,000 10.0% 500,000 3.8% 500,000 2.3%
VC Round ($5MM at $5MM) 6,610,000 50.0% 6,610,000 30.0%
VC Round ($10MM at $15MM) 8,813,333 40.0%
Total - 0.0% - 0.0% 500,000 10.0% 7,110,000 53.8% 15,923,333 72.3%
Grand Total 4,000,000 100% 4,500,000 100% 5,000,000 100% 13,220,000 100% 22,033,333 100%
51
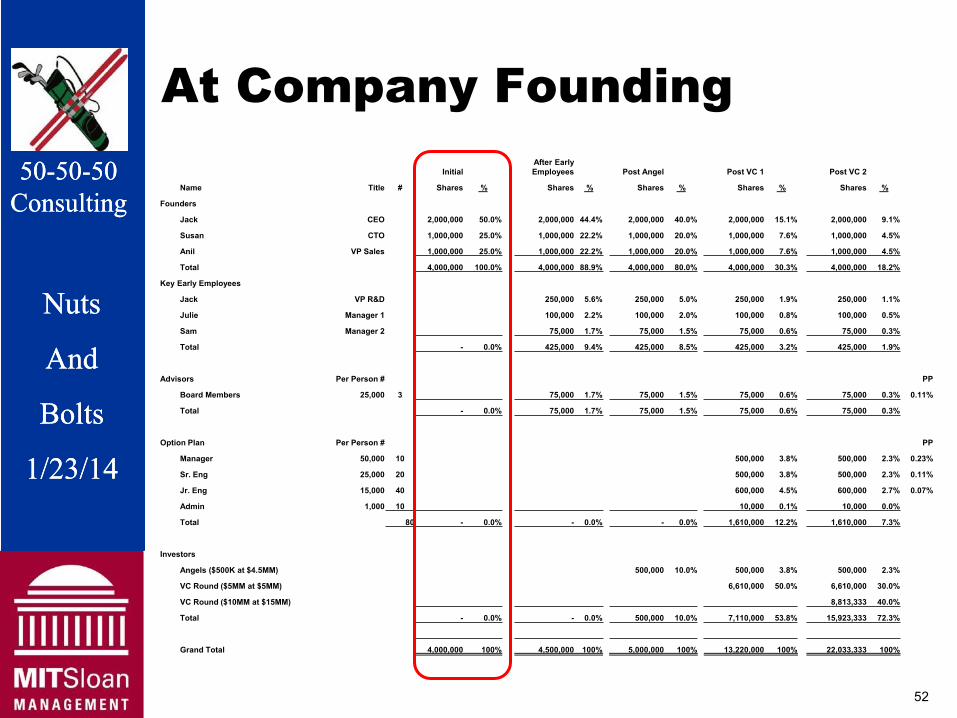
At Company Founding 5050--5050--5050 After Early
Initial Employees Post Angel Post VC 1 Post VC 2
CConsultonsultiingng Name Title # Shares % Shares % Shares % Shares % Shares %
Founders
Jack CEO 2,000,000 50.0% 2,000,000 44.4% 2,000,000 40.0% 2,000,000 15.1% 2,000,000 9.1%
Susan CTO 1,000,000 25.0% 1,000,000 22.2% 1,000,000 20.0% 1,000,000 7.6% 1,000,000 4.5%
Anil VP Sales 1,000,000 25.0% 1,000,000 22.2% 1,000,000 20.0% 1,000,000 7.6% 1,000,000 4.5%
Total 4,000,000 100.0% 4,000,000 88.9% 4,000,000 80.0% 4,000,000 30.3% 4,000,000 18.2%
NutNuts s Key Early Employees
Jack VP R&D 250,000 5.6% 250,000 5.0% 250,000 1.9% 250,000 1.1%
Julie Manager 1 100,000 2.2% 100,000 2.0% 100,000 0.8% 100,000 0.5%
Sam Manager 2 75,000 1.7% 75,000 1.5% 75,000 0.6% 75,000 0.3%
AndAnd Total - 0.0% 425,000 9.4% 425,000 8.5% 425,000 3.2% 425,000 1.9%
Advisors Per Person # PP
BoBolts lts Board Members 25,000 3 75,000 1.7% 75,000 1.5% 75,000 0.6% 75,000 0.3% 0.11%
Total - 0.0% 75,000 1.7% 75,000 1.5% 75,000 0.6% 75,000 0.3%
Option Plan Per Person # PP
1/1/23/23/14 14 Manager 50,000 10 500,000 3.8% 500,000 2.3% 0.23%
Sr. Eng 25,000 20 500,000 3.8% 500,000 2.3% 0.11%
Jr. Eng 15,000 40 600,000 4.5% 600,000 2.7% 0.07%
Admin 1,000 10 10,000 0.1% 10,000 0.0%
Total 80 - 0.0% - 0.0% - 0.0% 1,610,000 12.2% 1,610,000 7.3%
Investors
Angels ($500K at $4.5MM) 500,000 10.0% 500,000 3.8% 500,000 2.3%
VC Round ($5MM at $5MM) 6,610,000 50.0% 6,610,000 30.0%
VC Round ($10MM at $15MM) 8,813,333 40.0%
Total - 0.0% - 0.0% 500,000 10.0% 7,110,000 53.8% 15,923,333 72.3%
Grand Total 4,000,000 100% 4,500,000 100% 5,000,000 100% 13,220,000 100% 22,033,333 100%
52
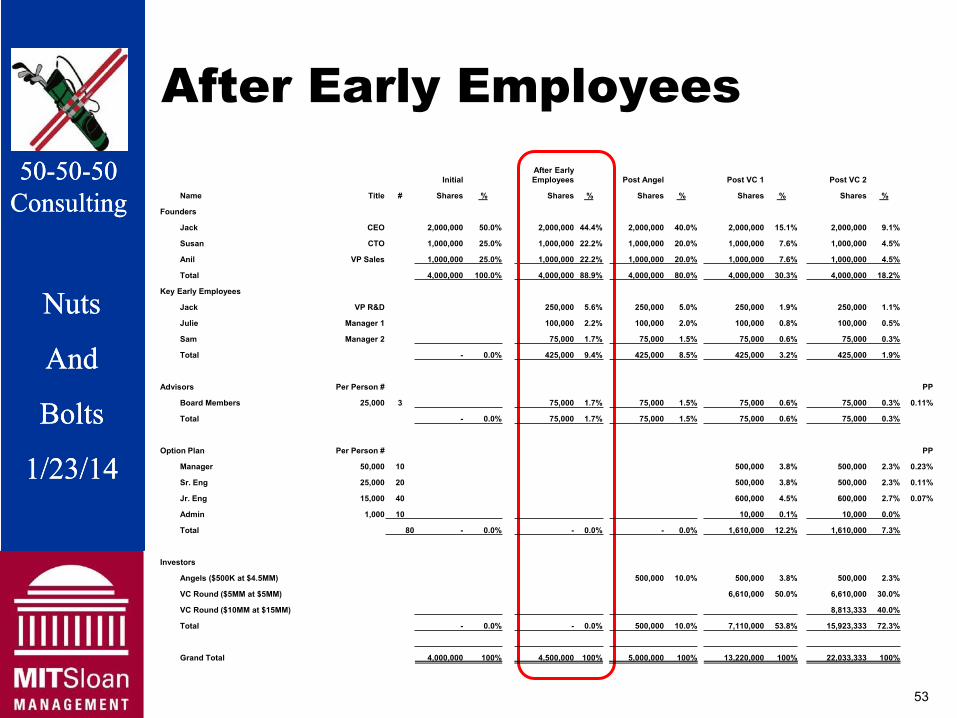
After Early Employees 5050--5050--5050 After Early
Initial Employees Post Angel Post VC 1 Post VC 2
CConsultonsultiingng Name Title # Shares % Shares % Shares % Shares % Shares %
Founders
Jack CEO 2,000,000 50.0% 2,000,000 44.4% 2,000,000 40.0% 2,000,000 15.1% 2,000,000 9.1%
Susan CTO 1,000,000 25.0% 1,000,000 22.2% 1,000,000 20.0% 1,000,000 7.6% 1,000,000 4.5%
Anil VP Sales 1,000,000 25.0% 1,000,000 22.2% 1,000,000 20.0% 1,000,000 7.6% 1,000,000 4.5%
Total 4,000,000 100.0% 4,000,000 88.9% 4,000,000 80.0% 4,000,000 30.3% 4,000,000 18.2%
NutNuts s Key Early Employees
Jack VP R&D 250,000 5.6% 250,000 5.0% 250,000 1.9% 250,000 1.1%
Julie Manager 1 100,000 2.2% 100,000 2.0% 100,000 0.8% 100,000 0.5%
AndAndSam Manager 2 75,000 1.7% 75,000 1.5% 75,000 0.6% 75,000 0.3%
Total - 0.0% 425,000 9.4% 425,000 8.5% 425,000 3.2% 425,000 1.9%
Advisors Per Person # PP
BoBolts lts Board Members 25,000 3 75,000 1.7% 75,000 1.5% 75,000 0.6% 75,000 0.3% 0.11%
Total - 0.0% 75,000 1.7% 75,000 1.5% 75,000 0.6% 75,000 0.3%
1/1/23/23/14 14 Option Plan Per Person # PP
Manager 50,000 10 500,000 3.8% 500,000 2.3% 0.23%
Sr. Eng 25,000 20 500,000 3.8% 500,000 2.3% 0.11%
Jr. Eng 15,000 40 600,000 4.5% 600,000 2.7% 0.07%
Admin 1,000 10 10,000 0.1% 10,000 0.0%
Total 80 - 0.0% - 0.0% - 0.0% 1,610,000 12.2% 1,610,000 7.3%
Investors
Angels ($500K at $4.5MM) 500,000 10.0% 500,000 3.8% 500,000 2.3%
VC Round ($5MM at $5MM) 6,610,000 50.0% 6,610,000 30.0%
VC Round ($10MM at $15MM) 8,813,333 40.0%
Total - 0.0% - 0.0% 500,000 10.0% 7,110,000 53.8% 15,923,333 72.3%
Grand Total 4,000,000 100% 4,500,000 100% 5,000,000 100% 13,220,000 100% 22,033,333 100%
53
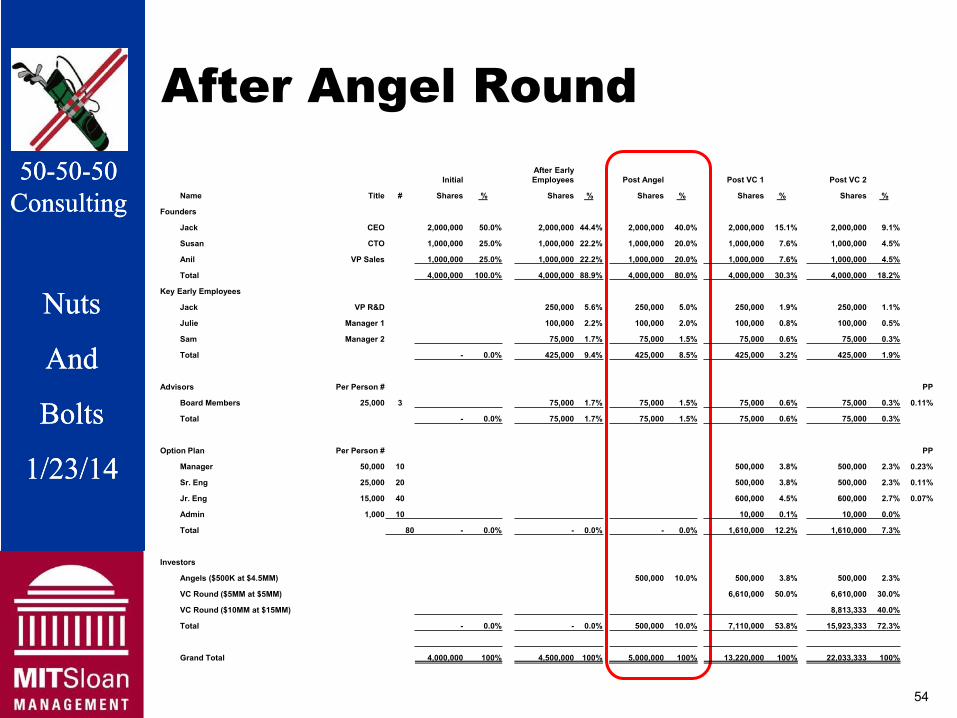
After Angel Round 5050--5050--5050 After Early
Initial Employees Post Angel Post VC 1 Post VC 2
CConsultonsultiingng Name Title # Shares % Shares % Shares % Shares % Shares %
Founders
Jack CEO 2,000,000 50.0% 2,000,000 44.4% 2,000,000 40.0% 2,000,000 15.1% 2,000,000 9.1%
Susan CTO 1,000,000 25.0% 1,000,000 22.2% 1,000,000 20.0% 1,000,000 7.6% 1,000,000 4.5%
Anil VP Sales 1,000,000 25.0% 1,000,000 22.2% 1,000,000 20.0% 1,000,000 7.6% 1,000,000 4.5%
Total 4,000,000 100.0% 4,000,000 88.9% 4,000,000 80.0% 4,000,000 30.3% 4,000,000 18.2%
NutNuts s Key Early Employees
Jack VP R&D 250,000 5.6% 250,000 5.0% 250,000 1.9% 250,000 1.1%
Julie Manager 1 100,000 2.2% 100,000 2.0% 100,000 0.8% 100,000 0.5%
AndAndSam Manager 2 75,000 1.7% 75,000 1.5% 75,000 0.6% 75,000 0.3%
Total - 0.0% 425,000 9.4% 425,000 8.5% 425,000 3.2% 425,000 1.9%
Advisors Per Person # PP
BoBolts lts Board Members 25,000 3 75,000 1.7% 75,000 1.5% 75,000 0.6% 75,000 0.3% 0.11%
Total - 0.0% 75,000 1.7% 75,000 1.5% 75,000 0.6% 75,000 0.3%
1/1/23/23/14 14 Option Plan Per Person # PP
Manager 50,000 10 500,000 3.8% 500,000 2.3% 0.23%
Sr. Eng 25,000 20 500,000 3.8% 500,000 2.3% 0.11%
Jr. Eng 15,000 40 600,000 4.5% 600,000 2.7% 0.07%
Admin 1,000 10 10,000 0.1% 10,000 0.0%
Total 80 - 0.0% - 0.0% - 0.0% 1,610,000 12.2% 1,610,000 7.3%
Investors
Angels ($500K at $4.5MM) 500,000 10.0% 500,000 3.8% 500,000 2.3%
VC Round ($5MM at $5MM) 6,610,000 50.0% 6,610,000 30.0%
VC Round ($10MM at $15MM) 8,813,333 40.0%
Total - 0.0% - 0.0% 500,000 10.0% 7,110,000 53.8% 15,923,333 72.3%
Grand Total 4,000,000 100% 4,500,000 100% 5,000,000 100% 13,220,000 100% 22,033,333 100%
54
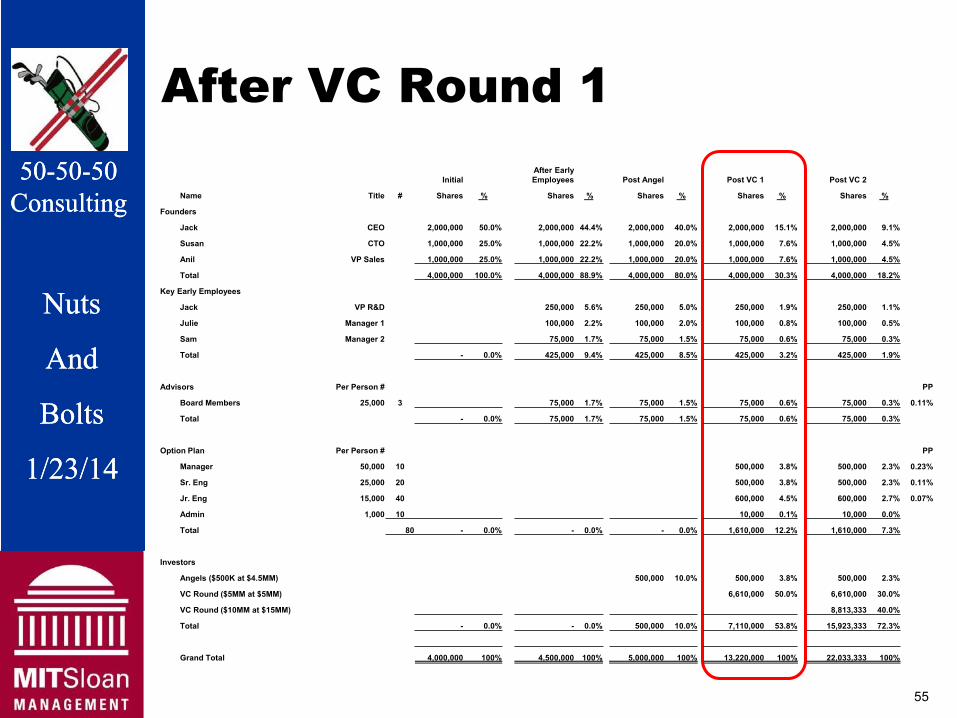
After VC Round 1 5050--5050--5050 After Early
Initial Employees Post Angel Post VC 1 Post VC 2
CConsultonsultiingng Name Title # Shares % Shares % Shares % Shares % Shares %
Founders
Jack CEO 2,000,000 50.0% 2,000,000 44.4% 2,000,000 40.0% 2,000,000 15.1% 2,000,000 9.1%
Susan CTO 1,000,000 25.0% 1,000,000 22.2% 1,000,000 20.0% 1,000,000 7.6% 1,000,000 4.5%
Anil VP Sales 1,000,000 25.0% 1,000,000 22.2% 1,000,000 20.0% 1,000,000 7.6% 1,000,000 4.5%
Total 4,000,000 100.0% 4,000,000 88.9% 4,000,000 80.0% 4,000,000 30.3% 4,000,000 18.2%
NutNuts s Key Early Employees
Jack VP R&D 250,000 5.6% 250,000 5.0% 250,000 1.9% 250,000 1.1%
Julie Manager 1 100,000 2.2% 100,000 2.0% 100,000 0.8% 100,000 0.5%
AndAndSam Manager 2 75,000 1.7% 75,000 1.5% 75,000 0.6% 75,000 0.3%
Total - 0.0% 425,000 9.4% 425,000 8.5% 425,000 3.2% 425,000 1.9%
Advisors Per Person # PP
BoBolts lts Board Members 25,000 3 75,000 1.7% 75,000 1.5% 75,000 0.6% 75,000 0.3% 0.11%
Total - 0.0% 75,000 1.7% 75,000 1.5% 75,000 0.6% 75,000 0.3%
1/1/23/23/14 14 Option Plan Per Person # PP
Manager 50,000 10 500,000 3.8% 500,000 2.3% 0.23%
Sr. Eng 25,000 20 500,000 3.8% 500,000 2.3% 0.11%
Jr. Eng 15,000 40 600,000 4.5% 600,000 2.7% 0.07%
Admin 1,000 10 10,000 0.1% 10,000 0.0%
Total 80 - 0.0% - 0.0% - 0.0% 1,610,000 12.2% 1,610,000 7.3%
Investors
Angels ($500K at $4.5MM) 500,000 10.0% 500,000 3.8% 500,000 2.3%
VC Round ($5MM at $5MM) 6,610,000 50.0% 6,610,000 30.0%
VC Round ($10MM at $15MM) 8,813,333 40.0%
Total - 0.0% - 0.0% 500,000 10.0% 7,110,000 53.8% 15,923,333 72.3%
Grand Total 4,000,000 100% 4,500,000 100% 5,000,000 100% 13,220,000 100% 22,033,333 100%
55

After VC Round 2 5050--5050--5050 After Early
Initial Employees Post Angel Post VC 1 Post VC 2
CConsultonsultiingng Name Title # Shares % Shares % Shares % Shares % Shares %
Founders
Jack CEO 2,000,000 50.0% 2,000,000 44.4% 2,000,000 40.0% 2,000,000 15.1% 2,000,000 9.1%
Susan CTO 1,000,000 25.0% 1,000,000 22.2% 1,000,000 20.0% 1,000,000 7.6% 1,000,000 4.5%
Anil VP Sales 1,000,000 25.0% 1,000,000 22.2% 1,000,000 20.0% 1,000,000 7.6% 1,000,000 4.5%
Total 4,000,000 100.0% 4,000,000 88.9% 4,000,000 80.0% 4,000,000 30.3% 4,000,000 18.2%
NutNuts s Key Early Employees
Jack VP R&D 250,000 5.6% 250,000 5.0% 250,000 1.9% 250,000 1.1%
Julie Manager 1 100,000 2.2% 100,000 2.0% 100,000 0.8% 100,000 0.5%
AndAndSam Manager 2 75,000 1.7% 75,000 1.5% 75,000 0.6% 75,000 0.3%
Total - 0.0% 425,000 9.4% 425,000 8.5% 425,000 3.2% 425,000 1.9%
Advisors Per Person #
BoBolts lts
1/1/23/23/14 14
56
MIT OpenCourseWarehttp://ocw.mit.edu
15.S21 Nuts and Bolts of Business PlansJanuary IAP 2014
For information about citing these materials or our Terms of Use, visit: http://ocw.mit.edu/terms.