building a holistic capital management framework · building a holistic capital . management...
TRANSCRIPT
Building a Holistic Capital Management Framework Embedding the strategic use of capital into banks’ internal cultures will help them gain competitive advantage.
Executive Summary
The 2008 financial crisis induced banks to
rethink their capital planning approach and
identify new ways to extract shareholder value
in an increasingly risk-averse environment.
A lower risk appetite and increased regulatory
capital requirements have imposed new con-
straints forcing banks to optimize capital alloca-
tions, which in turn have required some difficult
business decisions.
We believe capital management is not a one-
dimensional problem. Developing a holistic capital
management framework is a new imperative for
banks.
In this white paper, we examine key develop-
ments and highlight the challenges facing banks
that are looking to develop a holistic capital
management framework. We analyze the impact
of regulations on capital planning decisions. We
also lay out the capital management value chain,
and highlight the need for a strategic transfor-
mation of existing processes and systems.
Where Does Capital Generate Value? A Strategy & Performance Management Perspective
Performance management allows businesses to decide which product or business lines to direct its resources to, so as to maximize profitability. ROE1 is a common way to measure the performance of a bank. However, ROE does not incorporate the risk element that the equity is exposed to, and hence it can be misleading. Risk-adjusted perfor-mance management is a method to allocate risks across the business on a consistent basis in terms of their contribution to capital requirements.
Given the constraints of capital availability and the cost considerations, banks must assess whether promoting certain business lines that generate high returns is indeed generating value for the business if the investment has to be financed at a greater cost and by meeting more stringent regulatory requirements.
To maximize shareholder wealth, banks undertake capital allocation – a process of planning, allocating and managing capital for a variety of products to
cognizant 20-20 insights | march 2017
• Cognizant 20-20 Insights
cognizant 20-20 insights 2
ensure that the return on investment outstrips the costs. To achieve success, banks must be able to appropriately balance growth, risk and return to remain in line with the interests of investors.
Clearly, capital management should be increas-ingly embedded in evaluating decision-making, costs, performance and incentives per group, business and product. Performing such an analysis would require identifying and continu-ously monitoring a set of metrics that use the same set of enterprise data and are consistent and comparable across business groups, lines and products. However, metrics are often unique to each business line or product, which makes com-parisons difficult. The solution is a standardized performance management framework.
How Much Capital? An Economic Perspective When considering a performance management framework that captures the risk underlying assets, one way of measuring that risk is by understanding economic capital requirements. The capital possessed by a firm protects it against insolvency in case the difference in value between its assets and its liabilities decreases. Economic capital (ECap) represents an estimate of the worst possible decline in the institution’s capital
at a specified confidence level, within a chosen time horizon. Hence, it can be used to gauge the amount of risk a bank is exposed to and can be seen as capital that a bank needs to hold on its balance sheet to support those risks and stay solvent. Since ECap incorporates not just a bank’s capital position but also the underlying risk, it is a very useful tool for capital management.
Banks have had to increasingly focus on two areas:
• Which risk-driven business area/project should we channel our capital to?
• Across business areas, is the capital sufficient to absorb the risk of insolvency?
ECap can support this dual agenda as it can be used to develop risk-driven profitability measures to compare businesses but also produce a single
When considering a performance management framework that captures the risk underlying assets, one way of measuring that risk is by understanding economic capital requirements.
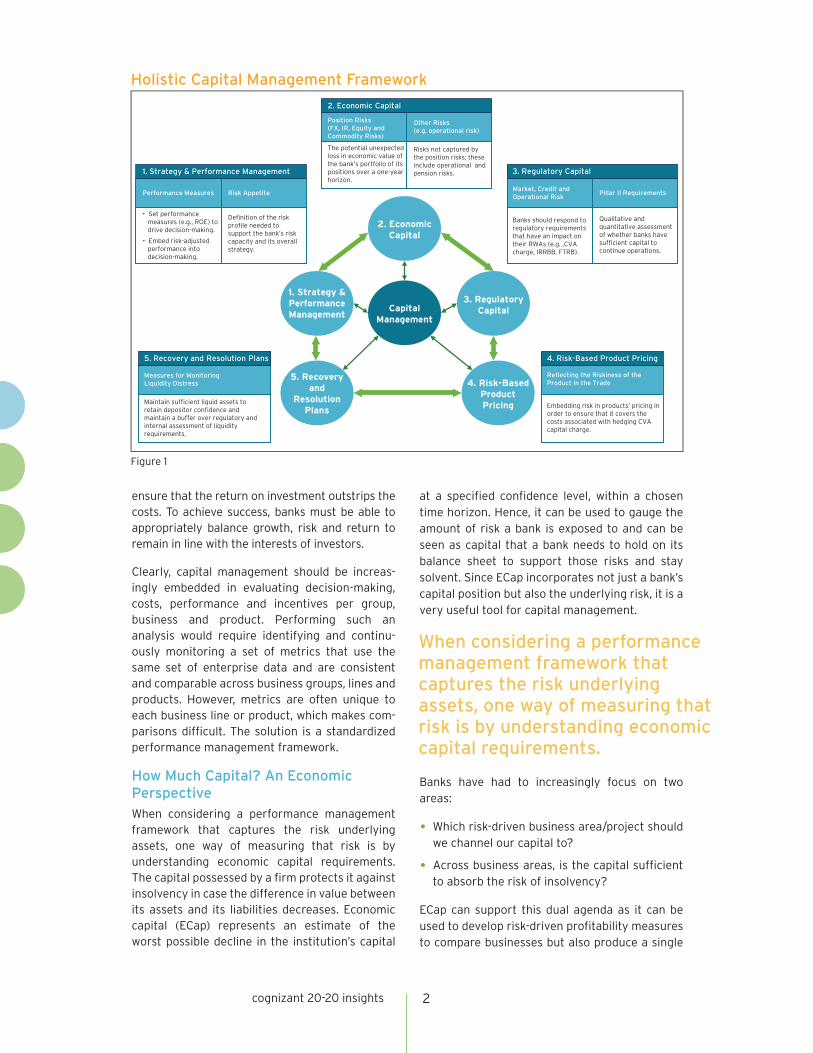
Holistic Capital Management Framework
Figure 1
2. Economic Capital
Pillar II Requirements
3. Regulatory Capital
Risk AppetitePerformance Measures
1. Strategy & Performance Management
5. Recovery and Resolution Plans 4. Risk-Based Product Pricing
Position Risks(FX, IR, Equity and Commodity Risks)
Other Risks (e.g. operational risk)
Market, Credit and Operational Risk
Reflecting the Riskiness of theProduct in the Trade
Measures for MonitoringLiquidity Distress
• Set performance measures (e.g., ROE) to drive decision-making.
• Embed risk-adjusted performance into decision-making.
Definition of the risk profile needed to support the bank’s risk capacity and its overall strategy.
The potential unexpected loss in economic value of the bank’s portfolio of its positions over a one-year horizon.
Risks not captured by the position risks; these include operational and pension risks.
Banks should respond to regulatory requirements that have an impact on their RWAs (e.g. ,CVA charge, IRRBB, FTRB).
Qualitative and quantitative assessment of whether banks have sufficient capital to continue operations.
Embedding risk in products’ pricing in order to ensure that it covers the costs associated with hedging CVA capital charge.
Maintain sufficient liquid assets to retain depositor confidence and maintain a buffer over regulatory and internal assessment of liquidity requirements.
Capital Management
1. Strategy & Performance Management
2. Economic Capital
3. Regulatory Capital
4. Risk-Based Product Pricing
5. Recovery and
Resolution Plans
cognizant 20-20 insights 3
aggregate figure for all risk types, products and business units.
The risk adjusted return on (economic) capital (RAROC) is the normative, risk-based leverage measure that allows comparison between different business areas and also enables banks to determine whether high return assets and
investments are contributing toward higher economic capital. It addresses the shortcomings of regulatory capital, which is usually calculated at the company level and doesn’t allow compara-tive analytics to be performed across business areas. Executives can use RAROC to make better decisions on complex problems. It can be used ex post to decide which investments are generating target profits or ex ante to set transaction prices or determine which business lines deserve more resource injections that could include capital. A similar performance measure related to ECap is
economic value added (EVA).2 EVA is positive if the absolute return on an asset is greater than the risk-weighted cost of capital needed to fund it. Hence EVA identifies which projects, products or business lines create value for shareholders.
An increased focus on risk management and the regulatory spotlight on banks’ internal risk management practices have prompted a revival in ECap model adoption. It also has an important role under Basel’s Pillar II as it represents a bank’s view of the amount of capital required to support its business activities.
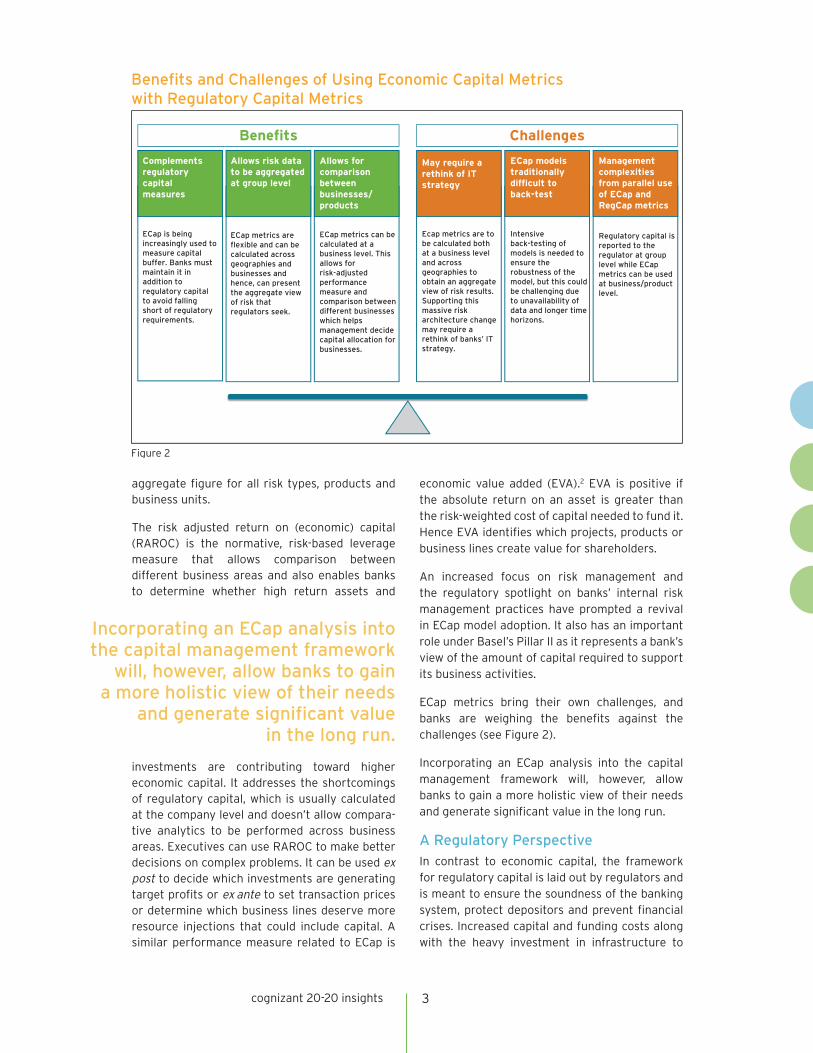
ECap metrics bring their own challenges, and banks are weighing the benefits against the challenges (see Figure 2).
Incorporating an ECap analysis into the capital management framework will, however, allow banks to gain a more holistic view of their needs and generate significant value in the long run.
A Regulatory Perspective
In contrast to economic capital, the framework for regulatory capital is laid out by regulators and is meant to ensure the soundness of the banking system, protect depositors and prevent financial crises. Increased capital and funding costs along with the heavy investment in infrastructure to
Incorporating an ECap analysis into the capital management framework
will, however, allow banks to gain a more holistic view of their needs
and generate significant value in the long run.
Benefits and Challenges of Using Economic Capital Metricswith Regulatory Capital Metrics
Figure 2
2. Economic Capital
Benefits Challenges
Complements regulatory capital measures
Allows risk data to be aggregated at group level
Allows for comparison between businesses/products
May require a rethink of IT strategy
ECap models traditionally difficult to back-test
Management complexities from parallel use of ECap and RegCap metrics
ECap is being increasingly used to measure capital buffer. Banks must maintain it in addition to regulatory capital to avoid falling short of regulatory requirements.
ECap metrics are flexible and can be calculated across geographies and businesses and hence, can present the aggregate view of risk that regulators seek.
ECap metrics can be calculated at a business level. This allows for risk-adjusted performance measure and comparison between different businesses which helps management decide capital allocation for businesses.
Ecap metrics are to be calculated both at a business level and across geographies to obtain an aggregate view of risk results. Supporting this massive risk architecture change may require a rethink of banks’ IT strategy.
Intensive back-testing of models is needed to ensure the robustness of the model, but this could be challenging due to unavailability of data and longer time horizons.
Regulatory capital is reported to the regulator at group level while ECap metrics can be used at business/product level.
cognizant 20-20 insights 4
deal with regulatory changes have put a strain on profitability and brought capital management to the forefront.
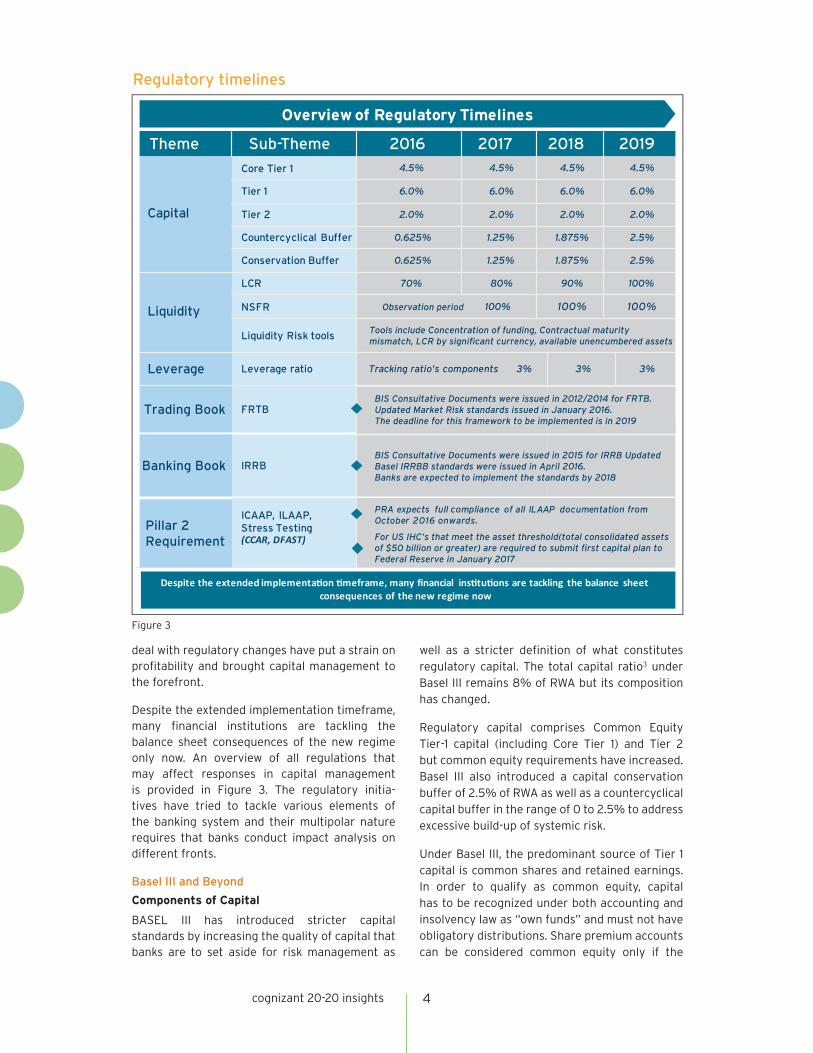
Despite the extended implementation timeframe, many financial institutions are tackling the balance sheet consequences of the new regime only now. An overview of all regulations that may affect responses in capital management is provided in Figure 3. The regulatory initia-tives have tried to tackle various elements of the banking system and their multipolar nature requires that banks conduct impact analysis on different fronts.
Basel III and Beyond
Components of Capital
BASEL III has introduced stricter capital standards by increasing the quality of capital that banks are to set aside for risk management as
well as a stricter definition of what constitutes regulatory capital. The total capital ratio3 under Basel III remains 8% of RWA but its composition has changed.
Regulatory capital comprises Common Equity Tier-1 capital (including Core Tier 1) and Tier 2 but common equity requirements have increased. Basel III also introduced a capital conservation buffer of 2.5% of RWA as well as a countercyclical capital buffer in the range of 0 to 2.5% to address excessive build-up of systemic risk.
Under Basel III, the predominant source of Tier 1 capital is common shares and retained earnings. In order to qualify as common equity, capital has to be recognized under both accounting and insolvency law as “own funds” and must not have obligatory distributions. Share premium accounts can be considered common equity only if the
Regulatory timelines
Figure 3
2. Economic Capital
Overview of Regulatory Timelines
Capital
Core Tier 1 4.5% 4.5% 4.5% 4.5%
Tier 1 6.0% 6.0% 6.0% 6.0%
Tier 2 2.0% 2.0% 2.0% 2.0%
Countercyclical Buffer 0.625% 1.25% 1.875% 2.5%
Conservation Buffer 0.625% 1.25% 1.875% 2.5%
Liquidity
LCR 70% 80% 90% 100%
NSFR 100% 100% 100%
Liquidity Risk tools
Leverage
Trading Book
Leverage ratio Tracking ratio’s components 3% 3% 3%
FRTB
IRRB
ICAAP, ILAAP,Stress Testing
PRA expects full compliance of all ILAAP documentation fromOctober 2016 onwards.
Theme Sub-Theme 2016 2017 2018 2019
Tools include Concentration of funding, Contractual maturity mismatch, LCR by significant currency, available unencumbered assets
Observation period
BIS Consultative Documents were issued in 2012/2014 for FRTB. Updated Market Risk standards issued in January 2016.The deadline for this framework to be implemented is in 2019
BIS Consultative Documents were issued in 2015 for IRRB UpdatedBasel IRRBB standards were issued in April 2016.Banks are expected to implement the standards by 2018
For US IHC’s that meet the asset threshold(total consolidated assetsof $50 billion or greater) are required to submit first capital plan toFederal Reserve in January 2017
Banking Book
Pillar 2Requirement
cognizant 20-20 insights 5
shares that gave rise to the premia were eligible as common equity. As for instruments other than common equity to be included in Tier 1, specific criteria have been introduced to ensure these are loss absorbent on a going-concern basis. In particular, this means that dated and innovative Tier-1 instruments will be phased out. Regulatory adjustments set out in Basel do not apply in fair value changes of additional Tier 1 and Tier 2 capital instruments that are recognized on the balance sheet. Guidance from each competent authority is available on what is considered an incentive to redeem for additional Tier 1 capital (e.g., a call option combined with an increase in the credit spread of the instrument if the call is not exercised or a call option to convert the instrument into shares if the call is not exercised).
Deductions from capital (e.g., for goodwill and intangibles, minority interests, deferred tax assets, defined benefit pension fund assets, shortfall of provisions to expected losses for IRB institutions) and prudential filters have been harmonized on a global basis and are applied almost entirely to common equity. Regulations require that banks deduct investments in capital instruments of other institutions from the class of component of capital for which the capital would qualify if issued by the bank itself.
Basel III has simplified and reduced Tier 2 capital by eliminating Upper Tier 2 from the capital structure. Tier 2 capital ensures loss absorption in case of liquidation (going-concern) since banks must hold further debt securities that can convert to equity in times of stress.
Tougher capital requirements will primarily impact areas such as sales and trading, securiti-zations, securities lending and OTC derivatives. Institutions may choose to exit capital-intensive areas of business (OTCs, commodities) where levels of return on higher capital levels dilute shareholder value.
Higher capital costs have forced banks to reconsider their business models unless they are able to manage both elements of the capital ratio.
Thus, comprehensive capital management that incorporates capital planning, calculation and strategic optimization has become inevitable for all banks. Banks will need to measure and monitor the quality of capital defined under the regulatory initiatives, and this may require an analysis of data and system requirements to support the review.
Counterparty Credit Risk (CCR)
During the 2008 crisis, two-thirds of the losses generated from counterparty risk was due to credit spread and market variables movements. So the CCR charge under Basel II, which was not originally designed to consider market movements of the exposure, has now been redesigned by the Basel Committee to adopt a further capital charge, the CVA charge, to cover for credit spread volatilities and market volatility of the CCR. The CVA charge materially increases the capital requirements for OTC derivatives activities and has attracted considerable attention from banks and regulators alike.
Standard and advanced CVA are the two common methods used by banks to calculate the CVA capital charge. The standardized approach allows less flexibility in incorporating market implied data. It should theoretically result in a higher capital charge compared to the advanced approach due to regulatory implied alignment between risk weights and external ratings and other more conservative VaR calibra-tions. However, the standardized approach also removes complexities associated with market risk VaR methodologies/IMM approval and testing. The standardized CVA risk capital charge methodology requires the development of a number of heuristic approaches to estimate the exposure at default, the discounted notional of single name and index CDS hedges, the effective maturity of the transaction with the counterparty and the maturity of the hedges for index CDS.
Calculation of the advanced CVA RWA is a market risk computation and may be used by institutions that have regulatory approval to use the internal model method (IMM) for CCR and specific VaR model approval for market risk capital. If the VaR models use a sensitivity-based approach, the credit spread values in the 1st and 2nd order sensitivities are the current levels as of valuation dates for both the stressed and unstressed VaR capital component of the advanced CVA. Hence, no additional period of stress may be required for credit spread parameters in determining future
Tougher capital requirements will primarily impact areas such as
sales and trading, securitizations, securities lending and OTC
derivatives.
cognizant 20-20 insights 6
counterparty EE profiles. Calculation of effective EPE profiles and EAD are common on both methods and may not have been subject to any adjustments arising from credit protection that the bank intends to include as an eligible hedge in the CVA risk capital charge. However, the use of other types of credit risk mitigation such as collateral or netting set that reduce the effective EPE and EAD amounts in the CCR framework can be maintained when feeding the risk capital charge. Also, the VaR model for eligible CDS and CDS swaptions should capture their nonlinear risk. Banks will need to assess which model is best suited and evaluate if legacy systems are capable of supporting those models.
Market Risk
Interest Rate Risk in the Banking Book (IRRBB)
The post-crisis period witnessed record low interest rates to boost the economy. Policy makers are now concerned about the impact when interest rates rise. Hence banks are being urged to consider keeping more capital aside to deal with increases in interest rates. Based on a set of qualitative principles largely backed by stress testing and internal audits, banks are required to manage rate fluctuations. The Basel Committee was considering bringing interest rate risk in banking book (IRRBB) under Pillar 1 but it published new standards for IRRBB in April 2016 and concluded that IRRBB will remain (will be captured) in Pillar 2. Banks are expected to implement an enhanced Pillar 2 approach to identify, measure, monitor and report IRRBB. This involves adequate procedures, policies, systems and controls. Banks are also required to assess and measure IRRBB and the impact of interest rate shocks on economic value (NPVs of future cash flows and interest income) of assets, off-balance sheet items and liabilities and on earn-ing-based measures (change to future gains or losses) of the banks.
Fundamental Review of the Trading Book (FRTB)
An analysis of FRTB reveals that it:
• Proposes standardized criteria for defining the boundary between the trading and banking books.
• Places restrictions on changing this classifica-tion to provide better alignment in the quanti-fication of capital across the industry as well as reducing arbitrage between banking and trading books.
• Argues for a move from VAR to ES for market risk calculation to capitalize for loss events in the tail of the P&L distribution.
• Provides validation criteria that banks must use to approve the soundness of internal models, and where found inappropriate, banks will be forced to use standardized models.
• The Basel Committee also proposes a revised, more risk-sensitive standardized market approach that includes calculation of the risk sensitivities based method (delta and gamma), the default risk charge and the residual risk add-on.
Compliance with FRTB would require extensive interaction between multiple desks – trading, market risk, analytics, regulatory reporting, technology, finance, project management and business analysts. This is both time-consuming and expensive. Banks will have to invest heavily in data management, business process reengi-neering and technology. However, some argue that FRTB provides an opportunity for banks to enhance their system capabilities and replace their legacy IT infrastructure.
Liquidity Risk
The liquidity measures mandated by Basel III aim to reduce reliance on unstable sources of funding, highlight the importance of managing funding costs and encourage banks to review the com-position of assets and liabilities on their balance sheets. Liquidity coverage ratio (LCR)4 and net stable funding ratio (NSFR)5 will likely drive banks away from sourcing shorter-term funding and toward longer-term funding arrangements. This will also increase the competition for retail deposits, affect funding costs and margins, and result in lower RWAs.
LCR reduces complexity but interpretive guidance is necessary for all banks to follow a consistent implementation approach. Key examples of high quality liquid assets (HQLA) implications that banks will face are as follows:
• Unused portions of eligible HQLA assets, already pledged, that are part of the collateral pool can be used toward the bank’s stock of HQLA with associated haircuts considered.
Banks are being urged to implement a robust risk management framework to identify, measure, monitor and report IRRBB.
cognizant 20-20 insights 7
Where the bank cannot determine which collateral remains unused it may be assumed that these assets are encumbered in order of increasing liquidity value.
• Lower-rated (BBB+ to BBB-) sovereign and central bank securities that cannot be included in the definition of Level 1 assets may be included in the Level 2B assets with a 50% haircut but will not constitute more than 15% of level 2B assets.
• Non-0% risk-weighted sovereign/central bank debt securities included in the Level 1 assets and the amounts of foreign currency exposures should be limited to the jurisdiction of the issuing sovereign/central bank.
• Common equities, which are exchange-traded and are part of a major market index within the home jurisdiction of the bank, should be denominated in the same currency.
NSFR enables better assessment of funding risk across on- and off-balance sheet items, and promotes funding stability by reducing reliance on short-term wholesale funding. This ratio reduces the possibility that a disruption at a bank’s standard source of funding will impact its liquidity position to cause the bank’s failure and trigger systemic risk (Basel Committee). The amounts of available and required funding are calibrated to reflect the presumed degree of stability of liabilities and liquidity of assets. The calibra-tion promotes the use of more stable, long-term sources of funding. This calibration reflects which stable funding type and counterparty is used (e.g., longer term is assumed to be more stable) to fund the resilient credit creation of the asset side of the balance sheet.
The Basel Committee has proposed a set of sup-plementary monitoring tools to assist supervisors with the analysis of bank-specific and system-wide liquidity risk trends. Additionally, the committee has introduced tools to monitor data on the
quantity, type, currency and location of available unencumbered assets. These include market-related monitoring tools that allow monitoring of market-wide information (e.g., market data from debt markets or specific products such as secu-ritized products), financial sector information (to check how the financial sector is reacting to broader market movements) and bank-specific information (to gauge market confidence in and risks associated with specific banks).
Leverage Ratio
Basel III introduced a non-risk-based leverage ratio to complement the risk-based capital requirements so as to reduce the excessive buildup of on- and off-balance sheet leverage. This will diminish destabilizing deleveraging exercises during periods of stress. The leverage ratio measures the relationship between the capital base and the assets of an institution. The ratio is designed to put a floor under the buildup of leverage in the banking system as well as to introduce additional safeguards against model risk and measurement errors by supplementing the risk-based capital requirements with a simple, transparent measure of risk. In addition, off-balance sheet positions shall be included in the denominator. In contrast to capital requirement calculation and accounting, collateral and netting for derivative and repo transactions will not be considered. To ensure international comparability of the ratio, it will be adjusted for differences in accounting standards.
The exposure measure is the sum of five components:
• On-balance-sheet exposures, including collateral for derivatives and securities financing transac-tions but not the corresponding assets as they form the next two points.
• Derivative exposures – accounts for replace-ment cost, potential future exposure and adjustment for certain collateral.
• Securities financing transaction exposures – accounts for counterparty credit exposure related to repos, reverse repos, securities borrowing/lending and margin lending trans-actions.
• Other off-balance-sheet items.
• Leverage ratio acts as a backstop measure to the risk-based capital requirements and therefore provides added protection against model risk and measurement error.
The liquidity measures mandated by Basel III aim to reduce reliance
on unstable sources of funding, highlight the importance of managing funding costs and encourage banks to review the composition of assets and
liabilities on their balance sheets.
cognizant 20-20 insights 8
The implementation of the leverage ratio will entail changes to regulatory reporting processes and potentially require system changes.
Revisiting Pillar 2
The purpose of the second pillar under Basel is to supplement existing regulatory capital require-ments for banks’ capital planning process and risk management. Pillar 2 guidance intends to help banks better identify, assess, manage and mitigate risks in their internal capital adequacy assessment process (ICAAP). Pillar 2 should exceed Pillar 1 capital requirements so that all risks are adequately covered. The ICAAP process should be commensurate with the size and complexity of the bank’s business as well as its risk appetite. A supplemental guidance was issued by the Basel Committee to support their ICAAP exercise. It addresses the following areas:
• Risk concentrations.
• Off-balance-sheet exposures with focus on securitization.
• Valuations.
• Sound stress-testing practices.
ICAAP should incorporate stress testing to complement other processes such as setting risk appetite and assessing economic capital so that the bank has the shock absorption capability to adequately protect against severe stress events. The bank’s capital planning should incorporate rigorous and forward-looking stress testing in order to withstand uncertain market conditions and volatility over time. Banks should also assess their capital adequacy under stress conditions against a variety of capital ratios (e.g., RWA, Tier 2).
Banks will be forced to move further away from holding risky and costly assets (e.g., OTC deriva-tives) on their balance sheet, and will reshape their strategies toward client businesses. This will impact banks’ profitability and require them to transform their operating models. Capital management will also require improvements and upgrades to systems used for stress testing and back testing.
Similar to ICAAP, Pillar 2 addresses the bank’s internal liquidity adequacy assessment process (ILAAP). The bank is required to undertake an annual assessment of its liquidity and funding risk across different time horizons in accordance with existing ILAA and CRDIV rules. Banks’ ILAAP
must be consistent with their risk appetite and with their overall approach for measuring and managing liquidity and funding risk. ILAAP involves a comprehensive stress testing on variables that affect liquidity risk, assessment of intraday liquidity risk, the bank’s ability to meet its intraday liability requirements, assessing its liquidity risk governance framework and a robust transfer pricing system in place to ensure that costs, benefits and risks are fully incorporated into the bank’s product pricing and incentives.
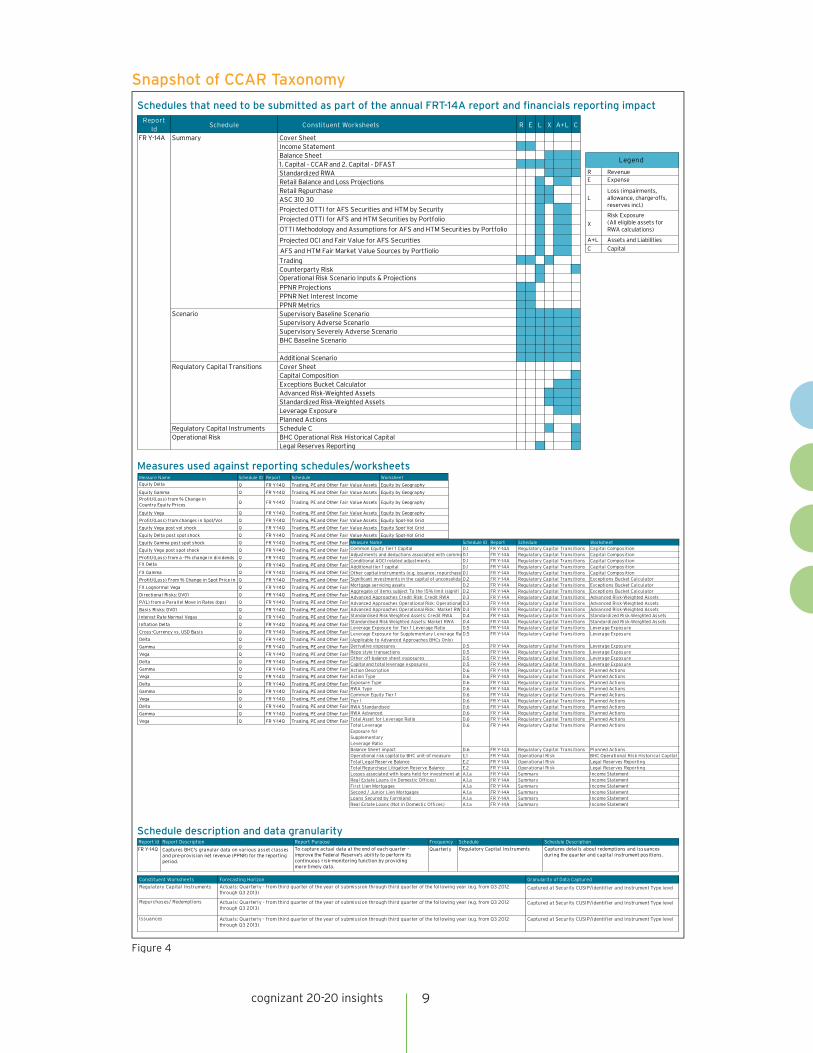
U.S. intermediate holding companies (IHCs) with $50 billion or more in total consolidated assets are subject to assessments by bank regulators to check if the banks have effective capital planning processes and sufficient capital to absorb losses during stressful conditions. The assessment includes the comprehensive capital analysis and review (CCAR) and Dodd-Frank Act stress testing (DFAST).
CCAR evaluates an IHC’s capital adequacy, capital distributions and capital adequacy processes. For the annual CCAR submission, IHCs are required to assess capital adequacy under three supervisory scenarios provided by the FRB (baseline, adverse and severely adverse), as well as at least two internally developed scenarios (baseline, severely adverse). As part of CCAR, the Federal Reserve evaluates whether IHCs have sufficient capital to continue operations through times of economic and financial market stress and whether they have robust, forward-looking capital planning processes that account for their unique risks. As such, banks have to perform key tasks to be compliant with CCAR: conduct stress tests based on relevant scenarios; ensure a control and governance structure is in place to reduce risks; and enable accurate and timely reporting of annual, quarterly and monthly reports.
DFAST is a complementary exercise to CCAR that assesses whether financial institutions have sufficient capital to absorb losses and support operations during adverse economic conditions. A snapshot of the CCAR taxonomy indicates that these developments will significantly increase
Banks will be forced to move further away from holding risky and costly assets (e.g., OTC derivatives) on their balance sheet, and will reshape their strategies toward client businesses.
cognizant 20-20 insights 9
Snapshot of CCAR Taxonomy
Figure 4
Report Id
Schedule Constituent Worksheets R E L X A+L C
Cover SheetIncome StatementBalance Sheet1. Capital CCAR and 2. Capital DFASTStandardized RWARetail Balance and Loss ProjectionsRetail RepurchaseASC 310 30
Projected OTTI for AFS Securities and HTM by Security
Projected OTTI for AFS and HTM Securities by Portfolio
OTTI Methodology and Assumptions for AFS and HTM Securities by Portfolio
Projected OCI and Fair Value for AFS Securities
AFS and HTM Fair Market Value Sources by Portfiolio
TradingCounterparty RiskOperational Risk Scenario Inputs & Projections
PPNR ProjectionsPPNR Net Interest IncomePPNR MetricsSupervisory Baseline ScenarioSupervisory Adverse ScenarioSupervisory Severely Adverse ScenarioBHC Baseline Scenario
Additional ScenarioCover SheetCapital CompositionExceptions Bucket CalculatorAdvanced Risk Weighted AssetsStandardized Risk Weighted AssetsLeverage ExposurePlanned Actions
Regulatory Capital Instruments Schedule CBHC Operational Risk Historical CapitalLegal Reserves Reporting
FR Y-14A Summary
Scenario
Regulatory Capital Transitions
Operational Risk
Measure Name Schedule ID Report Schedule Worksheet
Equity Delta Q FR Y-14Q Trading, PE and Other Fair Value Assets Equity by Geography
Equity Gamma Q FR Y-14Q Trading, PE and Other Fair Value Assets Equity by Geography
Profit/(Loss) from % Change in Country Equity Prices Q FR Y-14Q Trading, PE and Other Fair Value Assets Equity by Geography
Equity Vega Q FR Y-14Q Trading, PE and Other Fair Value Assets Equity by Geography
Profit/(Loss) from changes in Spot/Vol Q FR Y-14Q Trading, PE and Other Fair Value Assets Equity Spot-Vol Grid
Equity Vega post vol shock Q FR Y-14Q Trading, PE and Other Fair Value Assets Equity Spot-Vol Grid
Equity Delta post spot shock Q FR Y-14Q Trading, PE and Other Fair Value Assets Equity Spot-Vol Grid
Equity Gamma post spot shock Q FR Y-14Q Trading, PE and Other Fair Value Assets Equity Spot-Vol Grid
Equity Vega post spot shock Q FR Y-14Q Trading, PE and Other Fair Value Assets Equity Spot-Vol Grid
Profit/(Loss) from a -1% change in dividends Q FR Y-14Q Trading, PE and Other Fair Value Assets Other Equity
FX Delta Q FR Y-14Q Trading, PE and Other Fair Value Assets FX Spot Sensitivities
FX Gamma Q FR Y-14Q Trading, PE and Other Fair Value Assets FX Spot Sensitivities
Profit/(Loss) From % Change in Spot Price in Q FR Y-14Q Trading, PE and Other Fair Value Assets FX Spot Sensitivities
FX Lognormal Vega Q FR Y-14Q Trading, PE and Other Fair Value Assets FX Vega
Directional Risks: DV01 Q FR Y-14Q Trading, PE and Other Fair Value Assets Rates DV01
P/(L) from a Parallel Move in Rates (bps) Q FR Y-14Q Trading, PE and Other Fair Value Assets Rates DV01
Basis Risks: DV01 Q FR Y-14Q Trading, PE and Other Fair Value Assets Rates DV01
Interest Rate Normal Vegas Q FR Y-14Q Trading, PE and Other Fair Value Assets Rates Vega
Inflation Delta Q FR Y-14Q Trading, PE and Other Fair Value Assets Other Rates
Cross-Currency vs. USD Basis Q FR Y-14Q Trading, PE and Other Fair Value Assets Other Rates
Delta Q FR Y-14Q Trading, PE and Other Fair Value Assets Energy
Gamma Q FR Y-14Q Trading, PE and Other Fair Value Assets Energy
Vega Q FR Y-14Q Trading, PE and Other Fair Value Assets Energy
Delta Q FR Y-14Q Trading, PE and Other Fair Value Assets Metals
Gamma Q FR Y-14Q Trading, PE and Other Fair Value Assets Metals
Vega Q FR Y-14Q Trading, PE and Other Fair Value Assets Metals
Delta Q FR Y-14Q Trading, PE and Other Fair Value Assets Ags and Softs
Gamma Q FR Y-14Q Trading, PE and Other Fair Value Assets Ags and Softs
Vega Q FR Y-14Q Trading, PE and Other Fair Value Assets Ags and Softs
Delta Q FR Y-14Q Trading, PE and Other Fair Value Assets Diversified Commodity Indices
Gamma Q FR Y-14Q Trading, PE and Other Fair Value Assets Diversified Commodity Indices
Vega Q FR Y-14Q Trading, PE and Other Fair Value Assets Diversified Commodity Indices
Schedules that need to be submitted as part of the annual FRT-14A report and financials reporting impact
Measures used against reporting schedules/worksheets
Schedule description and data granularity
Measure Name Schedule ID Report Schedule WorksheetCommon Equity Tier 1 Capital D.1 FR Y-14A Regulatory Capital Transitions Capital CompositionAdjustments and deductions associated with commoD.1 FR Y-14A Regulatory Capital Transitions Capital CompositionConditional AOCI related adjustments D.1 FR Y-14A Regulatory Capital Transitions Capital CompositionAdditional tier 1 capital D.1 FR Y-14A Regulatory Capital Transitions Capital CompositionOther capital instruments (e.g, issuance, repurchase D.1 FR Y-14A Regulatory Capital Transitions Capital CompositionSignificant investments in the capital of unconsolida D.2 FR Y-14A Regulatory Capital Transitions Exceptions Bucket CalculatorMortgage servicing assets D.2 FR Y-14A Regulatory Capital Transitions Exceptions Bucket CalculatorAggregate of items subject To the 15% limit (signifi D.2 FR Y-14A Regulatory Capital Transitions Exceptions Bucket CalculatorAdvanced Approaches Credit Risk: Credit RWA D.3 FR Y-14A Regulatory Capital Transitions Advanced Risk Weighted AssetsAdvanced Approaches Operational Risk: Operational D.3 FR Y-14A Regulatory Capital Transitions Advanced Risk Weighted AssetsAdvanced Approaches Operational Risk: Market RW D.3 FR Y-14A Regulatory Capital Transitions Advanced Risk Weighted AssetsStandardised Risk Weighted Assets: Credit RWA D.4 FR Y-14A Regulatory Capital Transitions Standardized Risk Weighted AssetsStandardised Risk Weighted Assets: Market RWA D.4 FR Y-14A Regulatory Capital Transitions Standardized Risk Weighted AssetsLeverage Exposure for Tier 1 Leverage Ratio D.5 FR Y-14A Regulatory Capital Transitions Leverage ExposureLeverage Exposure for Supplementary Leverage Ra(Applicable to Advanced Approaches BHCs Only)
D.5 FR Y-14A Regulatory Capital Transitions Leverage Exposure
Derivative exposures D.5 FR Y-14A Regulatory Capital Transitions Leverage ExposureRepo style transactions D.5 FR Y-14A Regulatory Capital Transitions Leverage ExposureOther off-balance sheet exposures D.5 FR Y-14A Regulatory Capital Transitions Leverage ExposureCapital and total leverage exposures D.5 FR Y-14A Regulatory Capital Transitions Leverage ExposureAction Description D.6 FR Y-14A Regulatory Capital Transitions Planned ActionsAction Type D.6 FR Y-14A Regulatory Capital Transitions Planned ActionsExposure Type D.6 FR Y-14A Regulatory Capital Transitions Planned ActionsRWA Type D.6 FR Y-14A Regulatory Capital Transitions Planned ActionsCommon Equity Tier 1 D.6 FR Y-14A Regulatory Capital Transitions Planned ActionsTier 1 D.6 FR Y-14A Regulatory Capital Transitions Planned ActionsRWA Standardised D.6 FR Y-14A Regulatory Capital Transitions Planned ActionsRWA Advanced D.6 FR Y-14A Regulatory Capital Transitions Planned ActionsTotal Asset for Leverage Ratio D.6 FR Y-14A Regulatory Capital Transitions Planned ActionsTotal LeverageExposure forSupplementaryLeverage Ratio
D.6 FR Y-14A Regulatory Capital Transitions Planned Actions
Balance Sheet impact D.6 FR Y-14A Regulatory Capital Transitions Planned ActionsOperational risk capital by BHC unit-of measure E.1 FR Y-14A Operational Risk BHC Operational Risk Historical CapitalTotal Legal Reserve Balance E.2 FR Y-14A Operational Risk Legal Reserves ReportingTotal Repurchase Litigation Reserve Balance E.2 FR Y-14A Operational Risk Legal Reserves ReportingLosses associated with loans held for investment at A.1.a FR Y-14A Summary Income Statement Real Estate Loans (in Domestic Offices) A.1.a FR Y-14A Summary Income Statement First Lien Mortgages A.1.a FR Y-14A Summary Income Statement Second / Junior Lien Mortgages A.1.a FR Y-14A Summary Income Statement Loans Secured by Farmland A.1.a FR Y-14A Summary Income Statement Real Estate Loans (Not in Domestic Offices) A.1.a FR Y-14A Summary Income Statement
Report Id Report Description Report Purpose Frequency Schedule Schedule Description
FR Y-14Q QuarterlyCaptures BHC's granular data on various asset classes and pre-provision net revenue (PPNR) for the reporting period.
To capture actual data at the end of each quarter - improve the Federal Reserve's ability to perform its continuous risk-monitoring function by providing more-timely data.
Regulatory Capital Instruments Captures details about redemptions and issuances during the quarter and capital instrument positions.
Constituent Worksheets Forecasting Horizon Granularity of Data Captured
Regulatory Capital Instruments
Repurchases/ Redemptions
Issuances
Actuals: Quarterly - from third quarter of the year of submission through third quarter of the following year (e.g. from Q3 2012 through Q3 2013)
Actuals: Quarterly - from third quarter of the year of submission through third quarter of the following year (e.g. from Q3 2012 through Q3 2013)
Actuals: Quarterly - from third quarter of the year of submission through third quarter of the following year (e.g. from Q3 2012 through Q3 2013)
Captured at Security CUSIP/identifier and Instrument Type level
Captured at Security CUSIP/identifier and Instrument Type level
Captured at Security CUSIP/identifier and Instrument Type level
R RevenueE Expense
L
X
A+L Assets and Liabilities
C Capital
Legend
Loss (impairments, allowance, charge-offs, reserves incl.)
Risk Exposure (All eligible assets for RWA calculations)
cognizant 20-20 insights 10
The 2008 global financial crisis resulted in new regulations aimed at increasing the resilience of banks; a key focus has been the preparation of a recovery and resolution plan (RRP).
data and reporting requirements. However, there are multiple commonalities between CCAR and DFAST in terms of data, processes and supervi-sion. Hence, there is significant scope for banks to align processes to gain synergies while ensuring compliance with both, provided they reassess their current operating model.
Both regulations should serve to inform the Federal Reserve and the general public of how these financial institutions’ capital ratios might change during a hypothetical set of adverse economic conditions and the same three FRB-provided supervisory scenarios as under CCAR are required of the IHCs for the year-end DFAST.
For institutions with significant trading businesses, extensive data template submissions are required to support supervisory stress tests and analysis of the firm’s trading operations.
A thorough understanding of the CCAR reporting requirements of all regulatory reporting templates will help banks identify the level of data granularity in each schedule and regulatory requirement demand. The regulatory risk taxonomy analysis in Figure 4 (see previous page) will also help banks ensure that the required data is available in an appropriate structure.
Risk-Based Pricing: A Pressing Imperative Risk-based pricing is the alignment of pricing of a trade by reflecting the riskiness of the product in the trade. A borrower’s credit risk determines the price as well as the interest payment, and thus the higher the perceived risk, the higher the fee that should be charged on the OTC trade. Risk-based pricing closely aligns the cost structure with the real costs by incorporating considerations such as cost of capital, cost of funding, expected and unexpected losses, and other allocated expenses to provide a price that maximizes value.
Along with CVA, rising funding costs that affect a firm’s P&L should be included in the valuation of a product – i.e., fair value adjustment (FVA). FVA incorporates the PV of funding cost into the value of the product rather than accruing it over the life of the product. Banks also use fund transfer pricing (FTP) to charge a lending business or desk the cost of raising funds. FTP allows a bank to allocate funding costs to each business unit or product based on how much capital is required for that particular product.
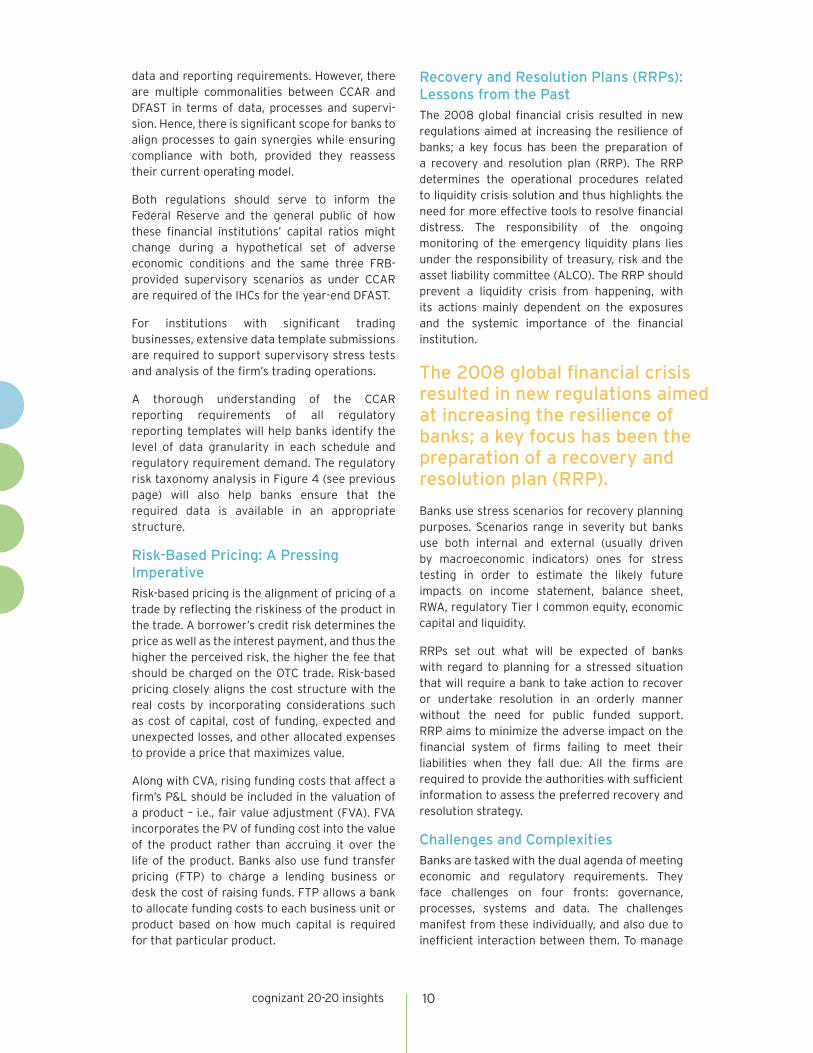
Recovery and Resolution Plans (RRPs): Lessons from the Past The 2008 global financial crisis resulted in new regulations aimed at increasing the resilience of banks; a key focus has been the preparation of a recovery and resolution plan (RRP). The RRP determines the operational procedures related to liquidity crisis solution and thus highlights the need for more effective tools to resolve financial distress. The responsibility of the ongoing monitoring of the emergency liquidity plans lies under the responsibility of treasury, risk and the asset liability committee (ALCO). The RRP should prevent a liquidity crisis from happening, with its actions mainly dependent on the exposures and the systemic importance of the financial institution.
Banks use stress scenarios for recovery planning purposes. Scenarios range in severity but banks use both internal and external (usually driven by macroeconomic indicators) ones for stress testing in order to estimate the likely future impacts on income statement, balance sheet, RWA, regulatory Tier I common equity, economic capital and liquidity.
RRPs set out what will be expected of banks with regard to planning for a stressed situation that will require a bank to take action to recover or undertake resolution in an orderly manner without the need for public funded support. RRP aims to minimize the adverse impact on the financial system of firms failing to meet their liabilities when they fall due. All the firms are required to provide the authorities with sufficient information to assess the preferred recovery and resolution strategy.
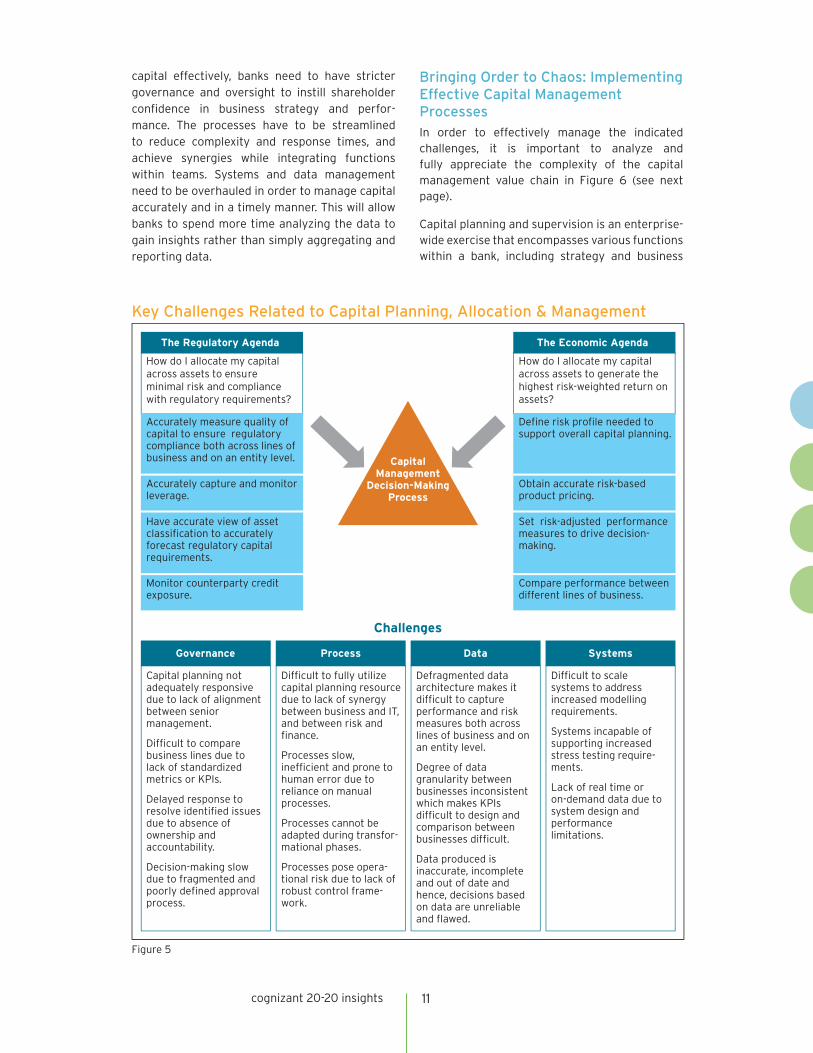
Challenges and Complexities Banks are tasked with the dual agenda of meeting economic and regulatory requirements. They face challenges on four fronts: governance, processes, systems and data. The challenges manifest from these individually, and also due to inefficient interaction between them. To manage
cognizant 20-20 insights 11
Key Challenges Related to Capital Planning, Allocation & Management
Figure 5
Challenges
How do I allocate my capital across assets to ensure minimal risk and compliance with regulatory requirements?
Accurately measure quality of capital to ensure regulatory compliance both across lines of business and on an entity level.
Accurately capture and monitor leverage.
Have accurate view of asset classification to accurately forecast regulatory capital requirements.
Monitor counterparty credit exposure.
The Regulatory Agenda
How do I allocate my capital across assets to generate the highest risk-weighted return on assets?
Define risk profile needed to support overall capital planning.
Obtain accurate risk-based product pricing.
Set risk-adjusted performance measures to drive decision-making.
Compare performance between different lines of business.
The Economic Agenda
Capital Management
Decision-Making Process
Capital planning not adequately responsive due to lack of alignment between senior management.
Difficult to compare business lines due to lack of standardized metrics or KPIs.
Delayed response to resolve identified issues due to absence of ownership and accountability.
Decision-making slow due to fragmented and poorly defined approval process.
Difficult to fully utilize capital planning resource due to lack of synergy between business and IT, and between risk and finance.
Processes slow, inefficient and prone to human error due to reliance on manual processes.
Processes cannot be adapted during transfor-mational phases.
Processes pose opera-tional risk due to lack of robust control frame-work.
Defragmented data architecture makes it difficult to capture performance and risk measures both across lines of business and on an entity level.
Degree of data granularity between businesses inconsistent which makes KPIs difficult to design and comparison between businesses difficult.
Data produced is inaccurate, incomplete and out of date and hence, decisions based on data are unreliable and flawed.
Difficult to scale systems to address increased modelling requirements.
Systems incapable of supporting increased stress testing require-ments.
Lack of real time or on-demand data due to system design and performance limitations.
Data SystemsGovernance Process
capital effectively, banks need to have stricter governance and oversight to instill shareholder confidence in business strategy and perfor-mance. The processes have to be streamlined to reduce complexity and response times, and achieve synergies while integrating functions within teams. Systems and data management need to be overhauled in order to manage capital accurately and in a timely manner. This will allow banks to spend more time analyzing the data to gain insights rather than simply aggregating and reporting data.
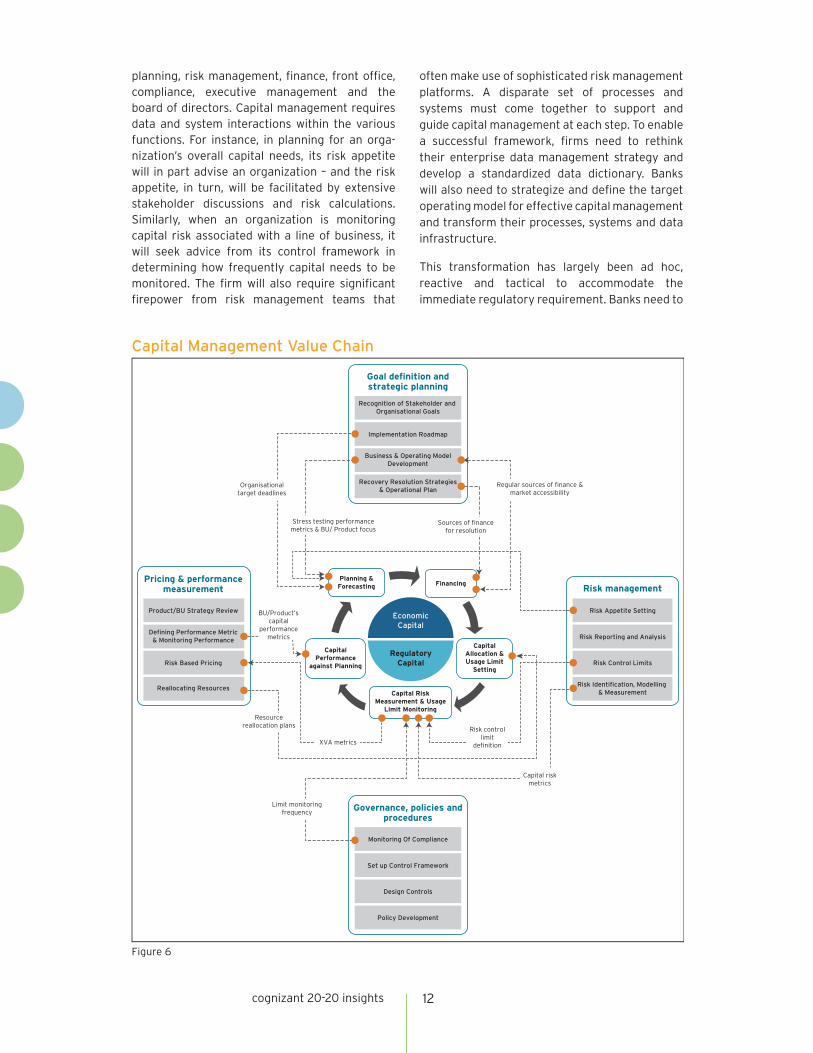
Bringing Order to Chaos: Implementing Effective Capital Management Processes In order to effectively manage the indicated challenges, it is important to analyze and fully appreciate the complexity of the capital management value chain in Figure 6 (see next page).
Capital planning and supervision is an enterprise-wide exercise that encompasses various functions within a bank, including strategy and business
cognizant 20-20 insights 12
planning, risk management, finance, front office, compliance, executive management and the board of directors. Capital management requires data and system interactions within the various functions. For instance, in planning for an orga-nization’s overall capital needs, its risk appetite will in part advise an organization – and the risk appetite, in turn, will be facilitated by extensive stakeholder discussions and risk calculations. Similarly, when an organization is monitoring capital risk associated with a line of business, it will seek advice from its control framework in determining how frequently capital needs to be monitored. The firm will also require significant firepower from risk management teams that
often make use of sophisticated risk management platforms. A disparate set of processes and systems must come together to support and guide capital management at each step. To enable a successful framework, firms need to rethink their enterprise data management strategy and develop a standardized data dictionary. Banks will also need to strategize and define the target operating model for effective capital management and transform their processes, systems and data infrastructure.
This transformation has largely been ad hoc, reactive and tactical to accommodate the immediate regulatory requirement. Banks need to
Implementation Roadmap
Recognition of Stakeholder and Organisational Goals
Business & Operating ModelDevelopment
Recovery Resolution Strategies& Operational Plan
Goal definition andstrategic planning
Set up Control Framework
Monitoring Of Compliance
Design Controls
Policy Development
Governance, policies andprocedures
Defining Performance Metric& Monitoring Performance
Product/BU Strategy Review
Risk Based Pricing
Reallocating Resources
Pricing & performancemeasurement
Risk Reporting and Analysis
Risk Appetite Setting
Risk Control Limits
Risk Identification, Modelling & Measurement
Risk management
Capital Management Value Chain
Figure 6
Planning & Forecasting Financing
Capital Risk Measurement & Usage
Limit Monitoring
RegulatoryCapital
EconomicCapital
Capital Performance
against Planning
Capital Allocation & Usage Limit
Setting
Regular sources of finance & market accessibility
Stress testing performance metrics & BU/ Product focus
Sources of finance for resolution
Risk control limit
definition
Capital risk metrics
Resource reallocation plans
Limit monitoring frequency
XVA metrics
Organisational target deadlines
BU/Product’s capital
performance metrics
cognizant 20-20 insights 13
engage in strategic rather than ad hoc enterprise-level change programs. Our experience suggests that business and IT transformations are often disconnected and poorly aligned with enterprise-level strategy. Hence, a change that can improve multiple functions often addresses only a few due to lack of relevant stakeholder involvement in the early stages. By the time other functions are involved, implementation deadlines force singular changes, and firms fail to leverage potential synergies. Enterprise-wide change management programs would enable proper integration, address challenges at the outset and avoid work-arounds that often create governance issues.
For instance, embedding a strategic transforma-tion process will help banks successfully optimize their regulatory capital and hence optimize RWA. Reviewing current systems and data can help make granular data available to achieve this.
Based on our analysis of the underlying challenges within the capital management process, we propose an efficient IT platform model that facili-tates and automates the complex challenges covered in this paper. At the outset, the model collates data from multiple disparate systems in
the “enterprise service bus” before transforming it appropriately in the “warehousing layer.”
The transformed data is ready to support various processes underlying capital management. Several of these processes are performed in the core “computation” layer. In particular, the model allows the organization to gauge capital demand, and allows planning and forecasting to be performed on a “dynamic” basis by incorporating the changes within the industry and regulatory landscape.
It is important to recognize that there are various levers within an organization that influence its RWA. The allocation module incorporates these various levers to provide re-optimized capital allocations across LOBs and products and ensure a firm’s RWA is minimized. The capital risk mate-riality module generates relevant capital risk cal-culations and advises on the materiality of limit breaches to ensure organizations can be well-prepared. The information must be presented through function-specific dashboards that allow stakeholders to monitor risks and control outcomes.
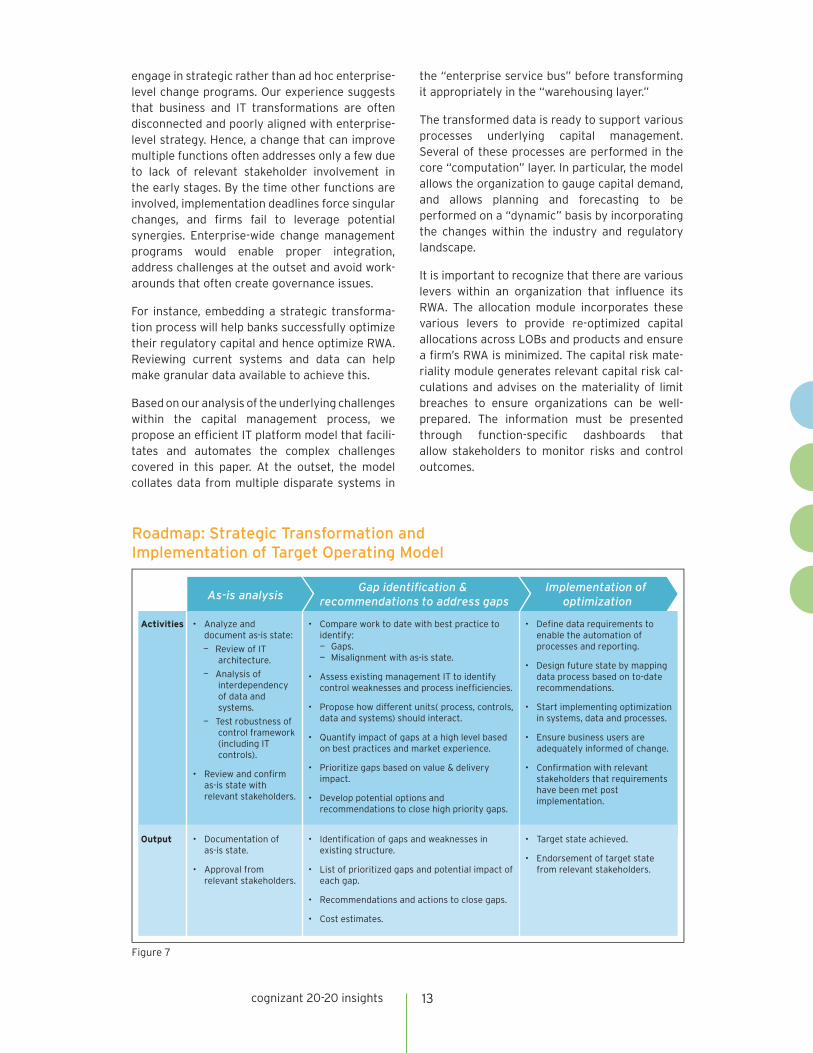
Roadmap: Strategic Transformation and Implementation of Target Operating Model
Activities • Analyze and document as-is state:
— Review of IT architecture.
— Analysis of interdependency of data and systems.
— Test robustness of control framework (including IT controls).
• Review and confirm as-is state with relevant stakeholders.
• Define data requirements to enable the automation of processes and reporting.
• Design future state by mapping data process based on to-date recommendations.
• Start implementing optimization in systems, data and processes.
• Ensure business users are adequately informed of change.
• Confirmation with relevant stakeholders that requirements have been met post implementation.
• Compare work to date with best practice to identify:— Gaps.— Misalignment with as-is state.
• Assess existing management IT to identify control weaknesses and process inefficiencies.
• Propose how different units( process, controls, data and systems) should interact.
• Quantify impact of gaps at a high level based on best practices and market experience.
• Prioritize gaps based on value & delivery impact.
• Develop potential options and recommendations to close high priority gaps.
• Documentation of as-is state.
• Approval from relevant stakeholders.
• Target state achieved.
• Endorsement of target state from relevant stakeholders.
• Identification of gaps and weaknesses in existing structure.
• List of prioritized gaps and potential impact of each gap.
• Recommendations and actions to close gaps.
• Cost estimates.
Output
As-is analysisGap identification &
recommendations to address gapsImplementation of
optimization
Figure 7

cognizant 20-20 insights 14
Capital Management IT Model
Trading System
Data Repository
Finance System
Enterprise Service Bus
(Routing, Messaging,…)
Risk System
Legal & ComplianceOther Relevant
Systems
Existing Client
Systems
WarehousingLayer
ComputationLayer
ReportingLayer
Trade Positions, PV
Industry & EntityPerformance Metrics
Regulatory Capital & Economic Capital Metrics
Business/LOB/ProductPerformance Metrics
Business/LOB/Product Risk & Regulatory Limits
Business/LOB/Product Capital Risk Metrics
Business/LOB/Product Capital Usage Metrics
PnL, Tier 1 and Tier 2 Capital, RAROC, Leverage Ratios
Other Metrics
PGs, LGDs, EPE, ENE Expected Shortfall, Stress Tests, Back Testing,
AMA, VaR sensitivities and VaRs, Risk Limits
Static Trade Data, Historical and Market Data (e.g., Ratings)
Trading AgreementsNetting Agreements
Collateral Agreements
Orchestration, Validation &
Reconciliation Component
Demand ScenarioGenerator
Dynamic Capital Demand
Forecasting Engine
Exception Manager
Scenario creation
rules
DemandForecasting
Model &Rules
Allocation Engine
Aggregation Engine
AdjustmentsRules
AggregationRules
OptimisationRules
Capital Risk Engine
MaterialityAssessment Engine
MaterialityDefinition
Capital RiskDefinition
Planning & Forecasting
Module
Market Prices & Margin
Financing Costs
...
ROE
RAROC
EVA…
Achieved RAROC
Achieved RWA
Achieved Leverage
Ratio…
Credit Limit
Breaches
VaR Breaches
…
Credit exposure
Limit
VaR Limits
LCR Limits
…
Entity Risk Appetite
Entity RAROC
Leverage Ratio
…
Capital Risk Materiality
Module
Performance Analysis
Dashboard
Allocation Module
Data Sourcing & Transformation Engine
Capital Projections
Optimal RWA & Capital Allocations
Reported and Analysed by Line of Business, Product, Geography, etc.
Capital Risk Assessment & Materiality Heatmaps
Risk & Finance Data
Figure 8
Conclusion
In this increasingly dynamic post-crisis era, banks’
decision-makers will need to work through layers
of complexity when implementing a comprehen-
sive capital management strategy. Banks need to
perform an in-depth assessment of the existing
governance structure, processes, systems and
data. Adopting a holistic approach will not only
allow banks to improve operationally through
streamlined processes, but also help identify
the areas where capital is being inappropriately
allocated. This will help establish greater predict-ability on capital demand.
In addition to encouraging greater collaboration between various stakeholders, the change in approach will enable banks to fully utilize existing resources and generate greater return on pre-existing investments and assets. Ultimately, a holistic capital management framework will enable banks to comply with regulations while also ensuring that they generate sustainable value for their shareholders.
cognizant 20-20 insights 15
Footnotes1 ROE = Net Income / Capital
2 A certain iteration of EVA can be given by EVA = (Revenues – Costs-Expected Loss – Tax) - (Economic Capital * Cost of Capital Employed)
3 Capital Ratio = Regulatory Capital (Tier 1 + Tier2) / RWA Assets (Credit, Market, Operational)
4 Liquidity Coverage Ratio = Stock of high quality liquid assets / Net cash outflows over a 30 day period ≥ 100%
5 Net Stable Funding Ratio = Available amount of stable funding / Required amount of stable funding) ≥ 100%
References
• Le Leslé, V. and Avramova, S., Revisiting Risk-Weighted Asset: “Why Do RWAs Differ Across Countries and What Can Be Done about it?” March 2012. www.imf.org/external/pubs/ft/wp/2012/wp1290.pdf.
• Shearman & Sterling, Basel III Framework: The Credit Valuation Adjustment (CVA) Charge for OTC Derivative Trades, November 2013. www.shearman.com/~/media/Files/NewsInsights/Publica-tions/2013/11/BaselIIIFrameworkTheCreditValuationAdjustmentCVA-ChargeforOTCDerivativeTrades-FIAFR111113.pdf.
• Blackrock, Credit Valuation Adjustment in Europe – Implications for Pension Plans, July 2012. www.blackrock.com/corporate/en-us/literature/whitepaper/credit-valuation-adjustment-europe-implica-tions-pension-plans.pdf.
• Basel Committee on Banking Supervision, Basel III: the net stable funding ratio, October 2014. www.bis.org/bcbs/publ/d295.pdf.
• JP Morgan, Leveraging the Leverage Ratio, 2014. www.jpmorgan.com/cm/BlobServer/is_lever-agingtheleverage.pdf?blobkey=id&blobwhere=1320634324649&blobheader=application/pdf&blobheadername1=Cache-Control&blobheadervalue1=private&blobcol=urldata&blobtable=MungoBlobs.
• Sid Verma, Regulation: Banks brace for Basel interest-rate risk push, May 2015. www.euromoney.com/Article/3450624/Regulation-Banks-brace-for-Basel-interest-rate-risk-push.html.
• Basel Committee on Banking Supervision, Interest rate risk in the banking book; Consultative Document, September 2015. www.bis.org/bcbs/publ/d319.pdf.
• Basel Committee on Banking Supervision, Fundamental review of the trading book: A revised market risk framework; Consultative Document, October 2013. www.bis.org/publ/bcbs265.pdf.
• Basel Committee on Banking Supervision, Basel III leverage ratio framework and disclosure require-ments, January 2014. www.bis.org/publ/bcbs270.pdf.
• Basel Committee on Banking Supervision, Revised Basel III leverage ratio framework and disclosure requirements, June 2013. www.bis.org/publ/bcbs251.pdf.
• European Banking Authority, CRD IV – CRR / Basel III monitoring Exercise, June 2014. www.eba.europa.eu/documents/10180/950548/CRDIV-CRR+Basel+III+monitoring+Report+-+Results+as+of+June+2014.pdf/92bc3251-f527-4f6f-9dc0-5edd5132f65d.
• Polk, D. and Wardwell, Revised Basel III Leverage Ratio, January 2014. www.davispolk.com/sites/default/files/01.21.14.Revised.Basel_.III_.Leverage.Ratio_.pdf.
• International Swaps and Derivatives Association, Fundamental Review of the Trading Book, April 2015. www2.isda.org/attachment/NzU1MQ==/FRTB%20Briefing%20Notes%20FINAL.pdf.
• Binham,C., Noonan, L. and Jopson, B., “Banks urged to set aside more capital for interest rate risk,” June 2015. www.ft.com/cms/s/0/0288ca9e-0df4-11e5-8ce9-00144feabdc0.html#axzz3lk9HJTyV.
World Headquarters500 Frank W. Burr Blvd.Teaneck, NJ 07666 USAPhone: +1 201 801 0233Fax: +1 201 801 0243Toll Free: +1 888 937 3277Email: [email protected]
European Headquarters1 Kingdom StreetPaddington CentralLondon W2 6BDPhone: +44 (0) 20 7297 7600Fax: +44 (0) 20 7121 0102Email: [email protected]
India Operations Headquarters#5/535, Old Mahabalipuram RoadOkkiyam Pettai, ThoraipakkamChennai, 600 096 IndiaPhone: +91 (0) 44 4209 6000Fax: +91 (0) 44 4209 6060Email: [email protected]
© Copyright 2017, Cognizant. All rights reserved. No part of this document may be reproduced, stored in a retrieval system, transmitted in any form or by any means, electronic, mechanical, photocopying, recording, or otherwise, without the express written permission from Cognizant. The information contained herein is subject to change without notice. All other trademarks mentioned herein are the property of their respective owners.
Codex 2151
About CognizantCognizant (NASDAQ-100: CTSH) is one of the world’s leading professional services companies, transforming clients’ business, operating and technology models for the digital era. Our unique industry-based, consultative approach helps clients envision, build and run more innovative and efficient businesses. Headquartered in the U.S., Cognizant is ranked 230 on the Fortune 500 and is consistently listed among the most admired companies in the world. Learn how Cognizant helps clients lead with digital at www.cognizant.com or follow us @Cognizant .
About the AuthorsDavid Paris is Governance, Risk & Compliance (GRC) head within the Banking and Financial Services sector for Cognizant Technology Solutions in the UK. He has over 30 years of experience in financial services management and advisory globally, focused on credit, market, liquidity and operational risk management. This includes roles at Wells Fargo Bank, First Interstate Bank, Ernst & Young, Reuters Instinet, IBM and Cognizant. David has an M.B.A. in finance from the American Graduate School of Inter-national Management and a degree in Chinese and Russian history from Washington University. He can
be reached at [email protected].
Guruprasad Chavan is an Associate Director (Consulting Senior Manager) within Cognizant Business Consulting’s BFS Governance Risk and Compliance Practice. He has over 16 years of experience in business/IT consulting and auditing across various areas such as strategy consulting, enterprise-wide risk management, accounting policy, SOX compliance, AML, information security and business continuity management. Guruprasad has in-depth knowledge and experience across various domains within banking and capital markets. He can be reached at [email protected].
Nick Palamaras is a Senior Manager (Consulting Manager) within Cognizant Business Consulting. He has over 12 years of experience in risk consulting and investment banking. Nick has significant experience across the risk, finance and treasury functions, and with regulatory teams of global investment banks. He has in-depth knowledge of prudential regulation, liquidity risk and Basel (CRDIV and CRR), and has led assignments in the assessment as well as the design and implementation of treasury and liquidity risk management frameworks. Nick is a Chartered Accountant (ACCA) and holds a postgraduate degree in economics and banking. He can be reached at [email protected].
Zareef Anam is an Associate (Business Analyst) within Cognizant Business Consulting. He has worked on multiple consulting engagements including business transformation, regulatory compliance and opera-tional risk. He can be reached at [email protected].
• Swati Agiwal, Regulatory and economic capital, 2011. www3.math.umn.edu/finmath/seminar/MaterialsY11/slidesY11M11D18agiwal.pdf.
• Klaasen and Idzard, How It Works and What Every Manager Should Know, 2009.
• Douglas, R. and Pugachevsky, D., Comparing Alternate Methods for Calculating CVA Capital Charges under Basel III, 2012. www.garp.org/media/1110535/whitepaper_cvacapitalcalculation_121812.pdf.