building a campus network monitoring system for research sue b. moon eecs, division of cs
TRANSCRIPT

Building a Campus Network Monitoring System
for Research
Sue B. MoonEECS, Division of CS

2
Is Campus Network a Good Place to Monitor?
1GE/10GE/100GE link speedcomparable to backbone networks
•BcN (Broadband convergence Network) will turn access networks to backbone networks.
•B/W distinction between access and backbone may no longer exist.
Source of “innovation” research communities “invent” new things
•first users of new applications•new attacks / vulnerable machines•extreme types of usage

3
Speed Comparison
Last hop
LAN/MAN Long-Haul
1980 T1/T3
1990 64Kbps
10/100M EthernetFDDI rings
OC-3 ~ OC-12
2000 10 Mbps
100M/1GE/10GE
OC-48/192/768 (2.5/10/40G)
4
Is Campus Network a Good Place to Monitor?
Bureacratic overheadLower bar to tap (or so I believe)
Less sensitive to business

5
Goals
Share data with researchersGigascope with AT&T, UMass, ...KISTI

6
Data to Collect
Data PlanePacket tracesNetFlow dataSink hole data
Control PlaneRouting protocol tables/updatesRouter configurationSNMP statistics

7
Monitoring System Infrastructure
ComponentsDAGMONPCsStorageAnalysis platform

8
Projects in Mind
Port scanning activities
General study on security attacks
9
Overview
Definition and implications of small-time scaling behaviors
Queueing delay vs. Hurst parameter Observations from high-speed links Flow composition
Large vs. smallDense vs. sparse
Summary Future directions

10
Scaling Behaviors of Backbone Traffic
What does it mean? Fluctuations in traffic volume over time
• e.g. measured in 10ms, 1s or 1min intervals
Large-time scale (> 1 sec): Hurst parameter 0.5 <= H < 1, measure of “correlation” over
time H > 0.5, long-range dependent or asym. self-
similar
Small-time scale (1-100 ms): Important to queueing performance, router
buffer dimensioning

11
How to Represent Time Scales
Dyadic time index system Fixing a reference time scale T0
At scale j (or –j): Tj = T0 / 2 t j,k = (k Tj, (k+1) Tj) W j,k = 2j/2 (Tj+1,2k - Tj+1,2k+1)
j

12
Scaling Exponent and Wavelet Analysis
Energy function: Energy Plot: Second-order (local) scaling exponent: h
Suppose spectrum density function has the form
Long range dependence (asym. self-similar) process:
Fractional Brownian Motion: single h for all scales
][ ,2
kjj WE E
][,||~)( 2121 ,νν ν range frequency in ν νΓ h
],[)21(~ 12 jjj constant, hj Elog then j2
-j vs. Elog j2
5.0)21(~ H withj constant, Hj Elog j2
13
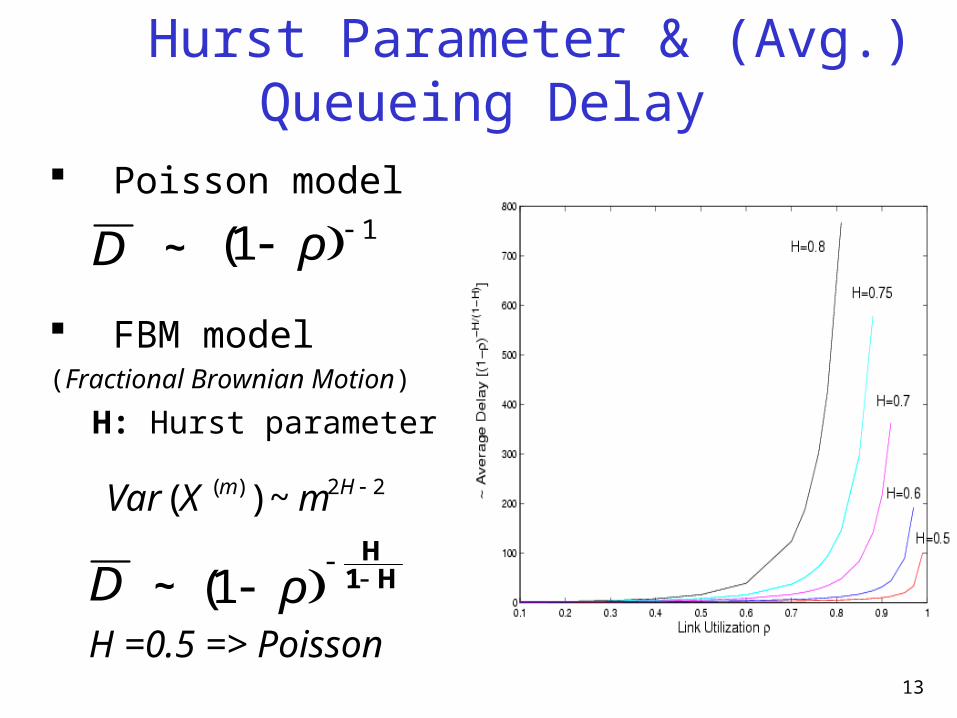
Hurst Parameter & (Avg.) Queueing Delay
Poisson model
FBM model(Fractional Brownian Motion)
H: Hurst parameter
H1H
ρ1(D ~
H =0.5 => Poisson
D ~11( ρ
22)( ~)( Hm mXVar

14
Traces
Collected from IPMON systemsOC3 to OC48 linksPeer, customer, intra-POP inter-router, inter-POP inter-router links
GPS timestamps40 bytes of header per packetTrace 1: domestic tier-2 ISP (OC12-tier2-dom)
Trace 2: large corporation (OC12-corp-dom)

15
Energy Plots
Trace 1 Trace 2

16
Observations
Large time scale Long-range dependent asymptotically “self-similar”
Small time scale: more “complex” Majority traces: uncorrelated or nearly
uncorrelated• Fluctuations in volume tend to be
“independent” Some traces: moderately correlated

17
Traffic Composition
How is traffic aggregated?By flow size
•Large vs. smallBy flow density
•Dense vs. sparse
18
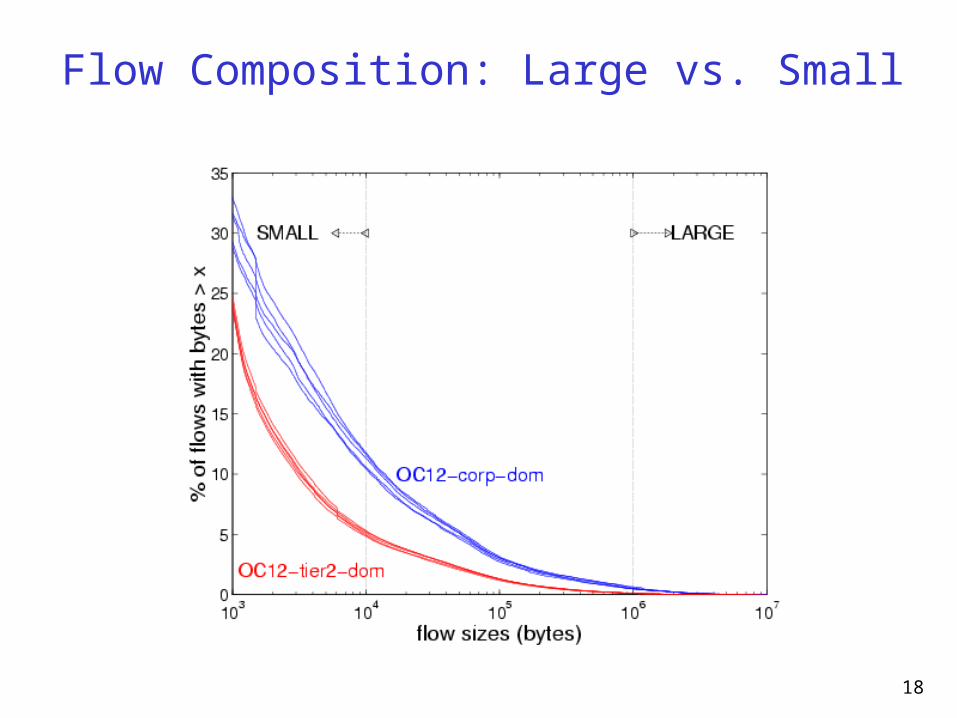
Flow Composition: Large vs. Small

19
Byte Contribution

20
Impact of Large vs. Small Flows on Scalings
Flow size alone does not determine small-time scaling behaviors(cf. large-time scaling behaviors)
large: flow size > 1MB; small: flow size < 10KB

21
Dense vs. Sparse Flows
Density defined by inter-arrival times
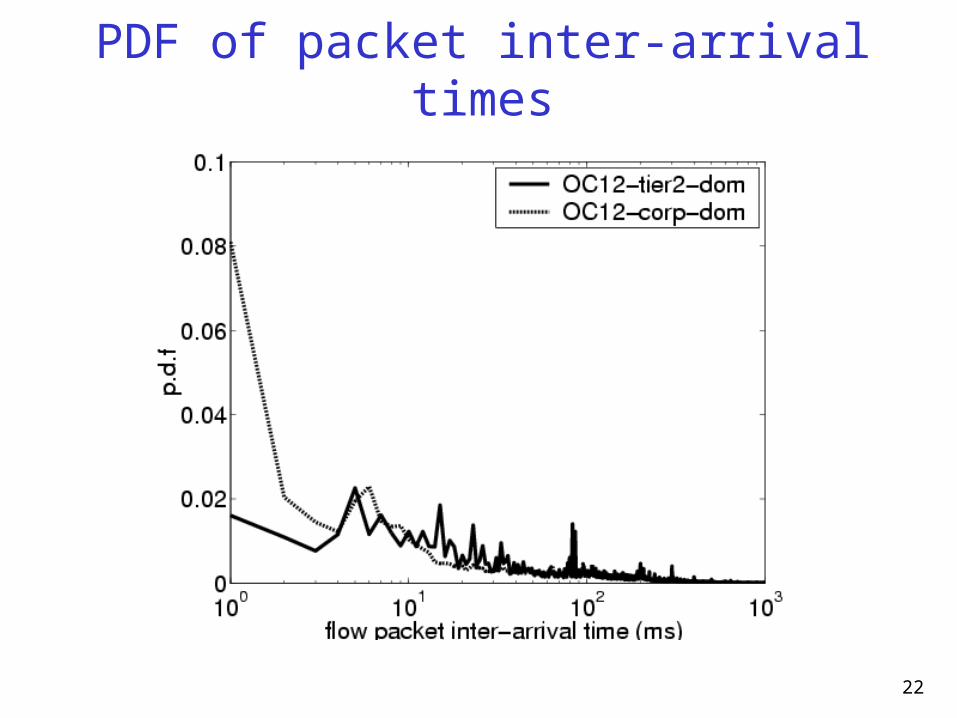
22
PDF of packet inter-arrival times
23
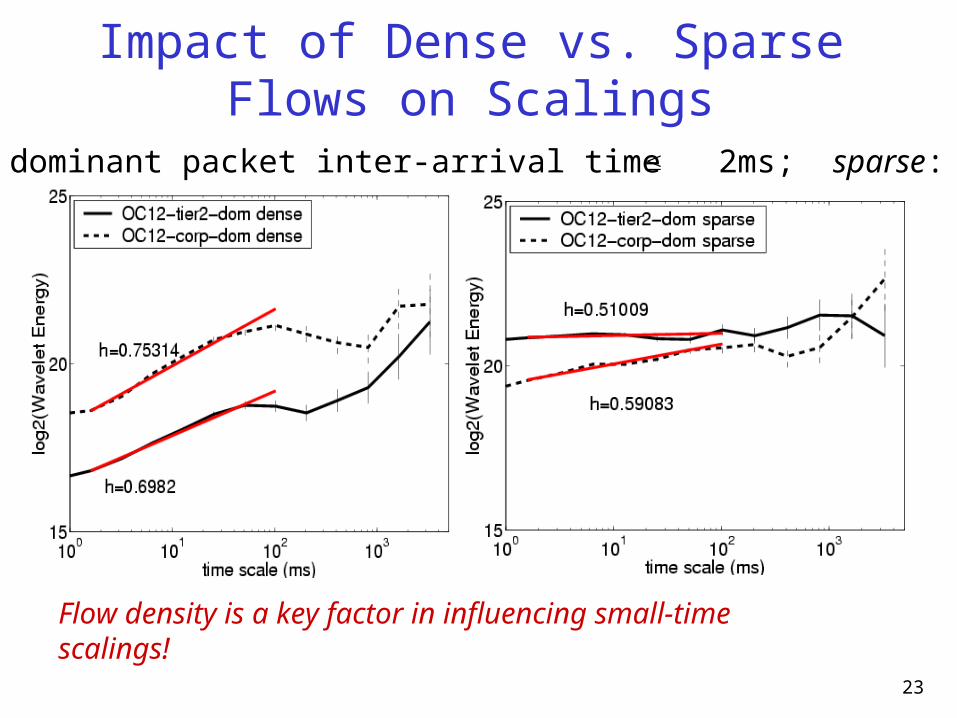
Impact of Dense vs. Sparse Flows on Scalings
Flow density is a key factor in influencing small-time scalings!
dense: dominant packet inter-arrival time 2ms; sparse: > 2ms

24
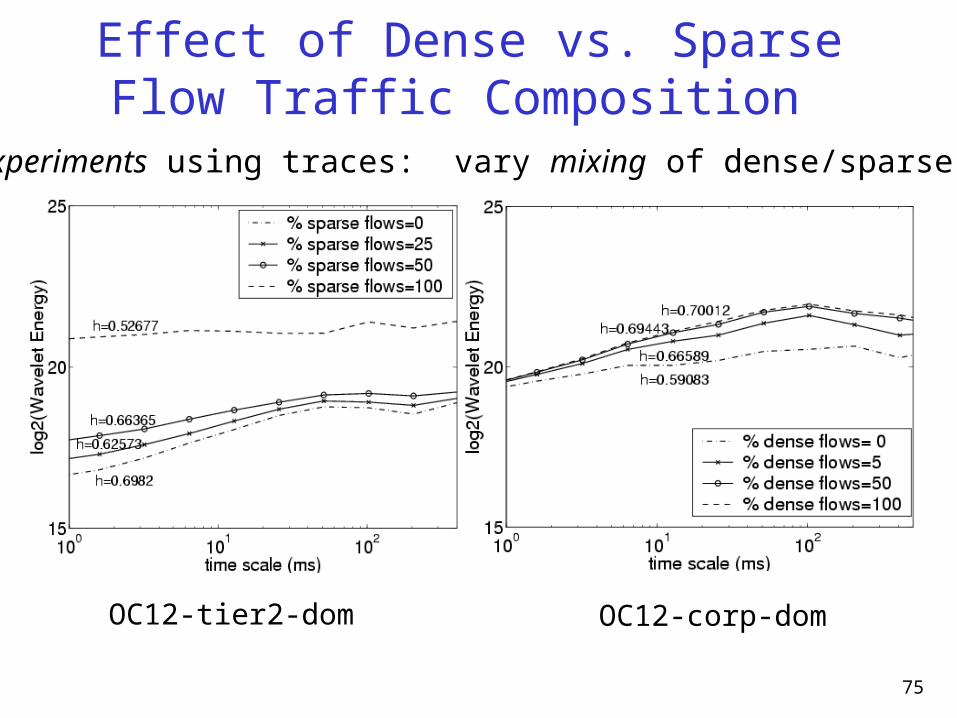
Effect of Dense vs. Sparse Flow Traffic Composition
Semi-experiments using traces: vary mixing of dense/sparse flows
OC12-tier2-dom OC12-corp-dom

25
Where Does Correlation in Traffic Come From?
Effect of TCP window-based feedback control Sparse flows:
packets from small flows arrive “randomly”
Dense flows: Packets injected into network in bursts (window) Burst of packets arrive every round-trip-time(RTT)
Speed and location of bottleneck links matters! Larger bottleneck link => larger bursts Deeper inside the network => more corr. flows

26
So Within Internet Backbone Network …
Facts about today’s Internet backbone networks bottleneck links reside outside backbone networks bottleneck link speeds small relative to backbone linksHigh degree of aggregation of mostly independent
flows! Consequences:
Queueing delay likely negligible!• And easier to model and predict • More so with higher speed links (e.g., OC192)
Can increase link utilization Only higher degree of aggregation of independent
flowsBe cautious with high-speed “customer” links!

27
Will Things Change in the Future?
But what happens if More hosting/data centers and VPN customers
directly connected to the Internet backbone?• have higher speed links, large-volume data transfers
User access link speed significantly increased?• e.g., with more DSL, cable modem users
Larger file transfer? • e.g. distributed file sharing (of large music/video files)
UDP traffic increases significantly? • e.g. Video-on-Demand and other real-time applications

28
Status Quo of IP Backbone
Backbone network well-provisioned High-level of traffic aggregation
•Negligible delay jitter Low average link utilization
•< 30% Protection in layer 3
QoS? Not needed inside the backbone Is it ready for VoIP/Streaming media?
•Yet to be decided

29
Future Directions in Networking Research
RoutingNo QoS with current routing protocols
Performance issuesBcN: bottleneck moves closer to you!
Wired/wireless integrationSensitivity to lossE2e optimization
Security IPv6 vs NAT

30
Fraction of Packets in Loops

31
Single-Hop Queueing Delay PDF

32
Multi-Hop Queueing Delay CCDF
Data Set 3, Path 1

33
Multi-Hop Queueing Delay
Data Set 3

34
Impact of Bottleneck Link Load
90

35
Variable Delay Revisited: Tail
Data Set 3, Path 1

36
Peaks in Variable Delay

37
Closer Look
Queue Build up &Drain
Backup Slides
39
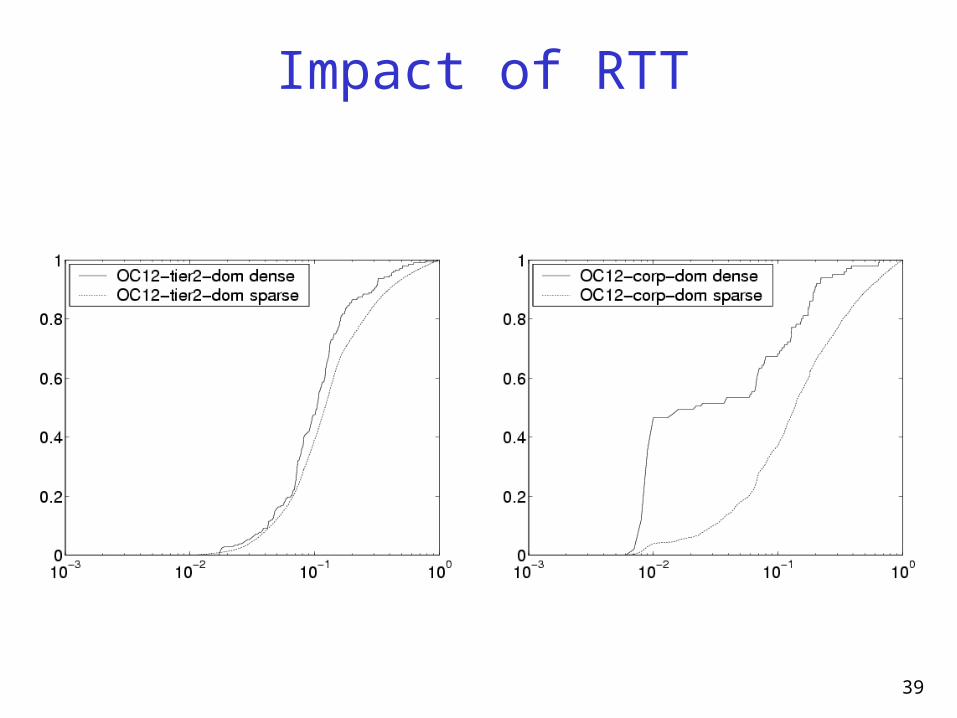
Impact of RTT

40
Impact of Traffic Composition
Trace 1 Trace 2
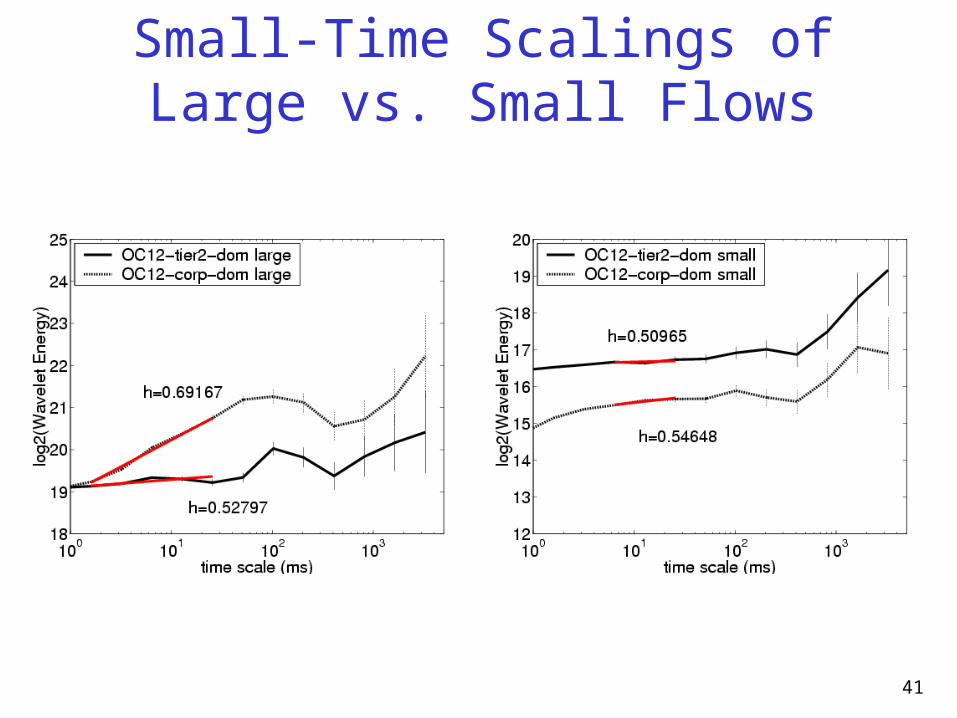
41
Small-Time Scalings ofLarge vs. Small Flows

42
Small-Time Scalings ofDense vs. Sparse Flows
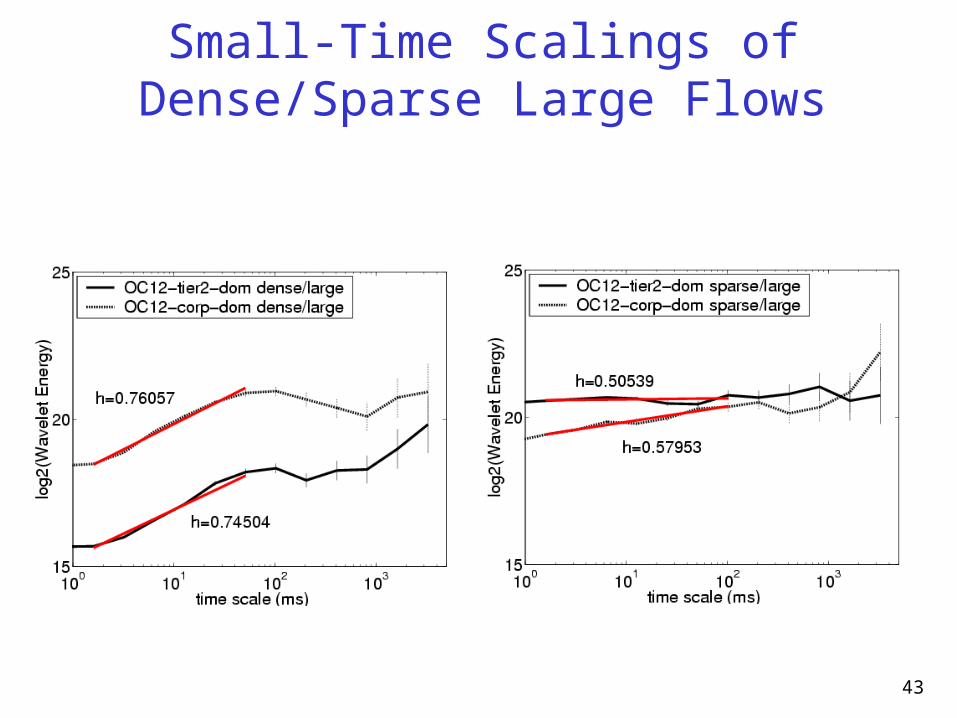
43
Small-Time Scalings ofDense/Sparse Large Flows
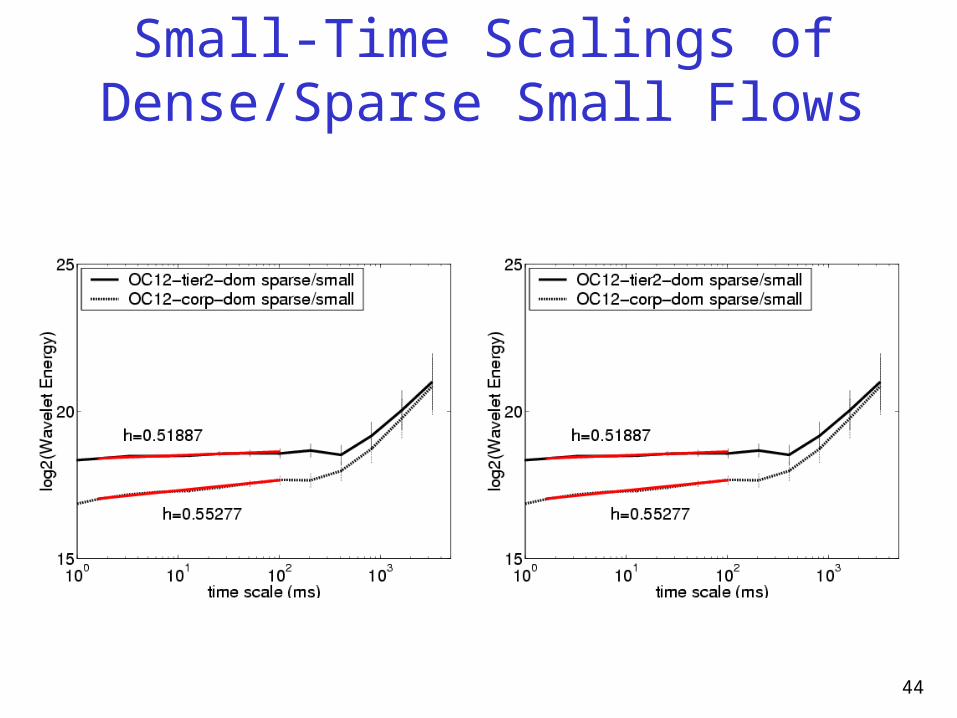
44
Small-Time Scalings ofDense/Sparse Small Flows

45
Fourier Transform Plots
Trace 1 Trace 2
46
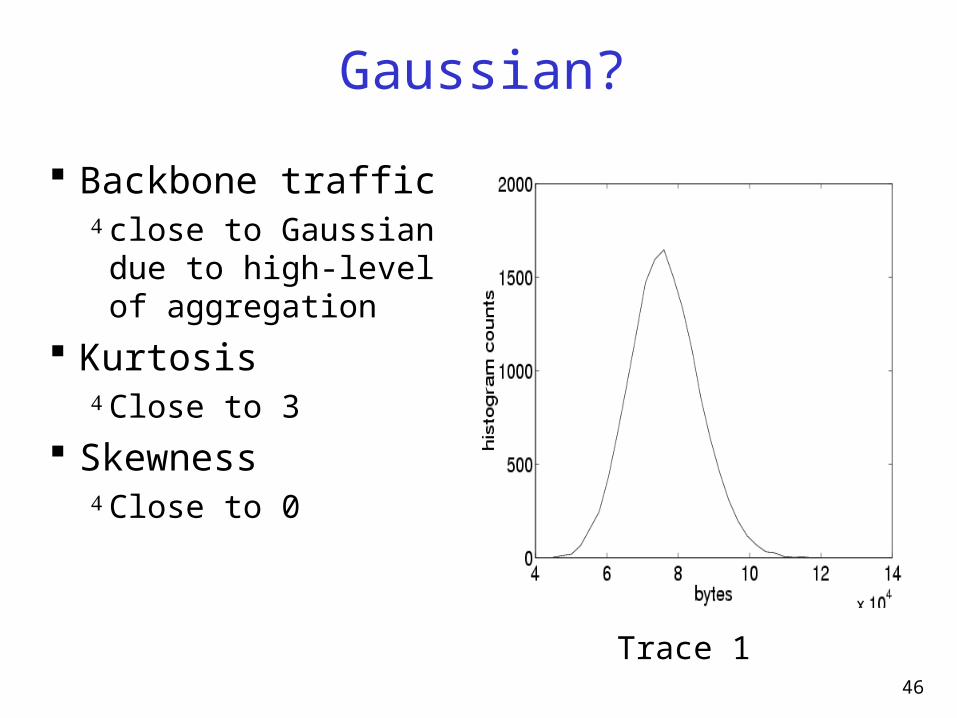
Gaussian?
Backbone traffic close to Gaussian due to high-level of aggregation
Kurtosis Close to 3
Skewness Close to 0
Trace 1

47
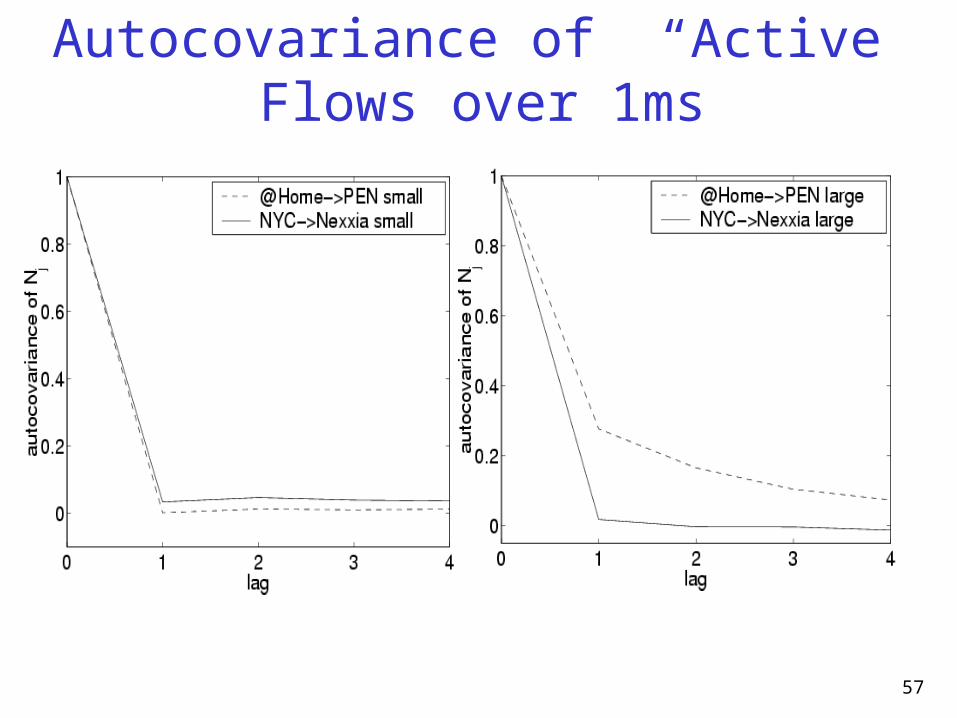
Illustrations of Small Time Scale Behaviors
(Nearly) Uncorrelated Moderately Correlated
NYC Nexxia (OC12) @Home PEN (OC-12)

48
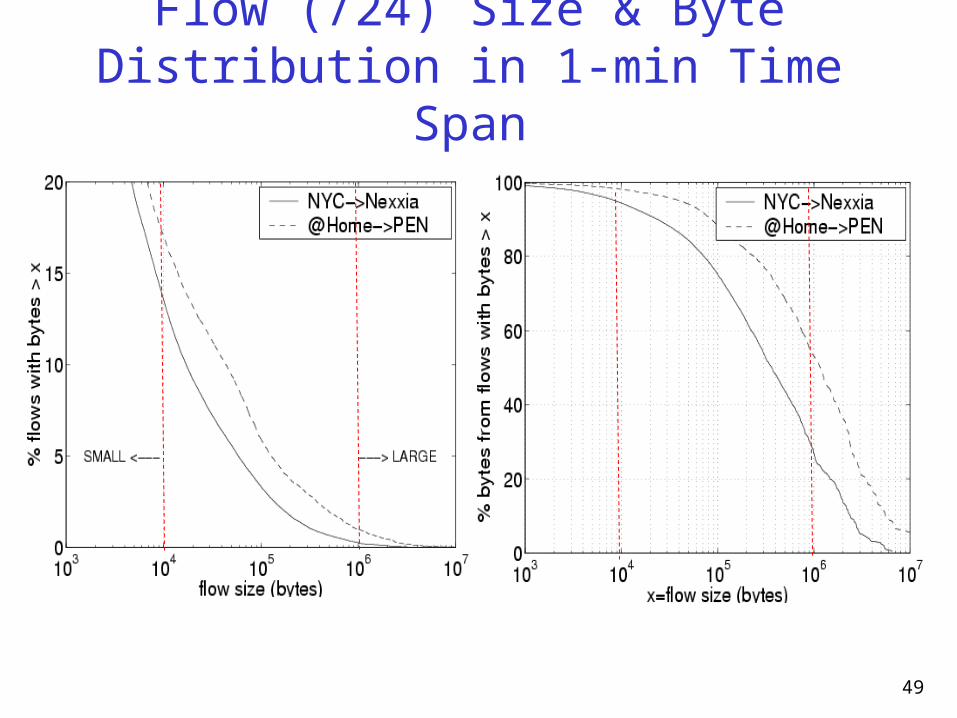
What Affect the Small-Time Scalings?
composition of small vs. large flows “correlation structure” of large flows
49
Flow (/24) Size & Byte Distribution in 1-min Time Span

50
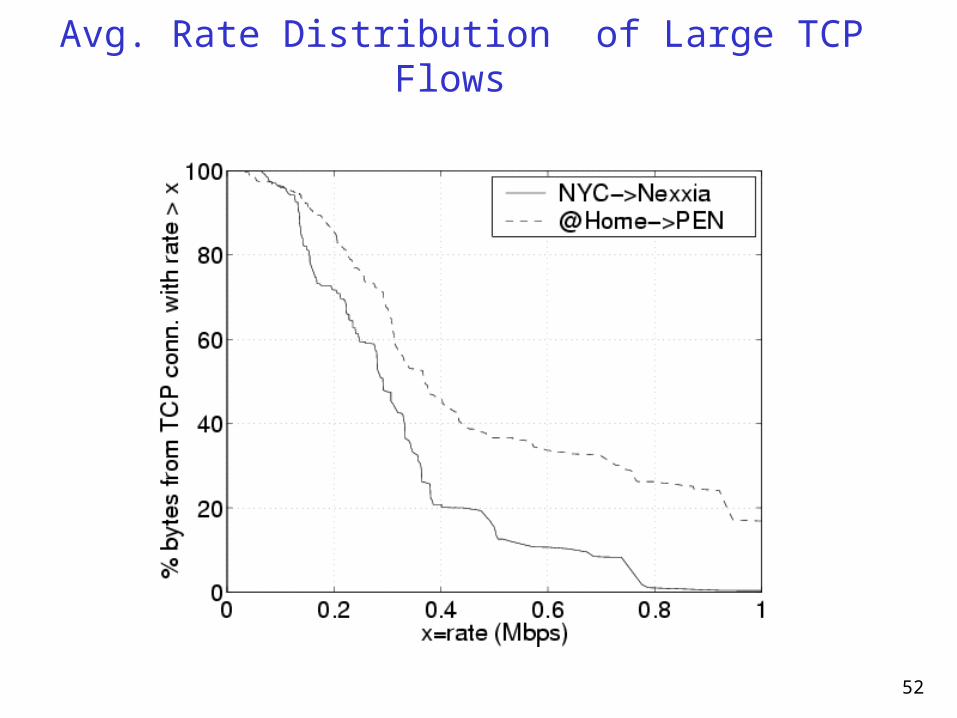
Where Does Correlation in Traffic Come From?
Effect of TCP window-based feedback control Small flows:
packets from small flows arrive “randomly” Large flows:
Packets injected into network in bursts (window) Burst of packets arrive every round-trip-time(RTT)
Speed and location of bottleneck links matters! Larger bottleneck link => larger bursts Deeper inside the network => more corr. flows

51
Three Distinct Time Scales: HTTP TCP Flows
52
Avg. Rate Distribution of Large TCP Flows

53
So Within Internet Backbone Network …
Facts about today’s Internet backbone networks bottleneck links reside outside backbone networks bottleneck link speeds small relative to backbone linksHigh degree of aggregation of (mostly) independent flows!
Consequences: Queueing delay likely negligible!
•And easier to model and predict •More so with higher speed links (e.g., OC192)
Can increase link utilization (while ensure little queueing)•Only higher degree of aggregation of independent flows
Be cautious with high-speed “customer” links!
54
Will Things Change in the Future?
But what happens if More hosting/data centers and VPN customers
directly connected to the Internet backbone?• have higher speed links, large-volume data transfers
User access link speed significantly increased?• e.g., with more DSL, cable modem users
Larger file transfer? • e.g. distributed file sharing (of large music/video files)
UDP traffic increases significantly? • e.g. Video-on-Demand and other real-time applications

55
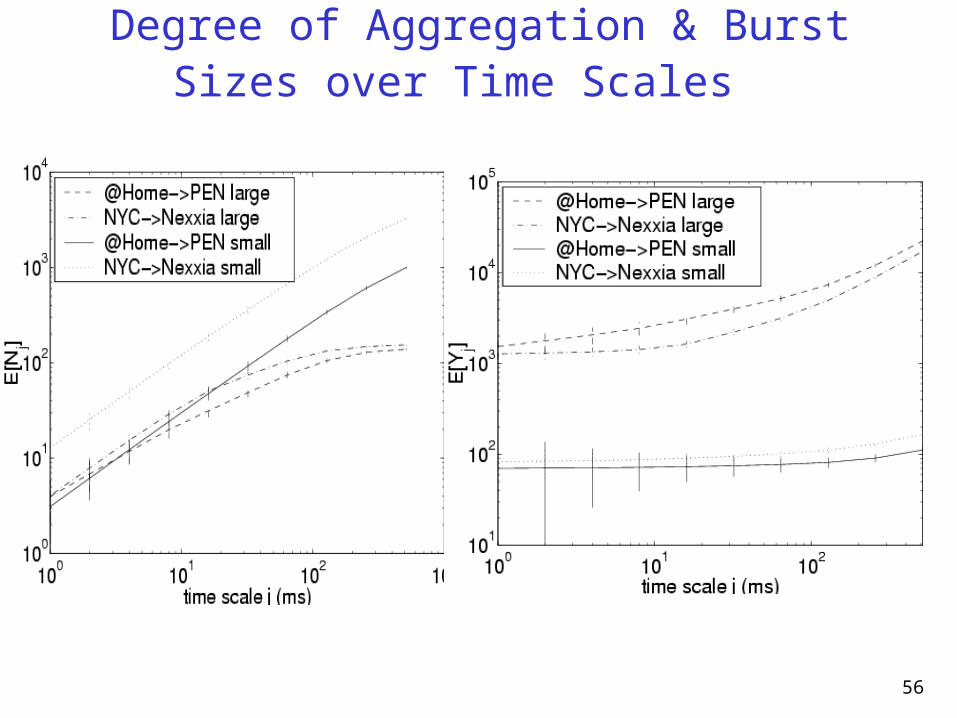
How Large Flows Affect Small Time Scalings?
56
Degree of Aggregation & Burst Sizes over Time Scales
57
Autocovariance of “Active” Flows over 1ms

58
Effect of TCP: Large vs. Small Flows
Three Distinct Time Scales Session time scale: on-off sessions
• file sizes, applications RTT Time Scale:
• TCP window-based feedback control• window size: burst of packets • RTT: prop. delay (+ random
variable) Inter-packet time scale
• packet sizes• TCP: ack-paced packet injection
Bottleneck Link & Queueing session duration clustered bursts, RTT inter-packet arrival times

59
Effect of Aggregation: (In-)dependence?
aggregating different (presumably independent) flows intermixing bursts and packets from different flows
Introduce independence (randomness) in the aggregate,
but also can induce “correlation” (due to TCP)! depending on where bottleneck link is!
different effects may manifest in different time scales!
60
Summary: Time and Space of Observation
What time scale we observe traffic matters! Where we observe traffic also matters! Large vs. small time scale behaviors
Large time scale:•superposition of many independent on-off sessions•heavy-tail file size distribution => self-similar scaling
Small time scale: more “complex”!• degree of aggregation•composition of large vs. small flows• correlation structure of bursts (of large flows)
Small-Time Scaling Behaviors of
Internet Backbone TrafficZhi-Li Zhang
U. of MinnesotaJoint work with
Vinay Ribeiro (Rice U.), andSue Moon, Christophe Diot (Sprint ATL)

62
Scaling Exponent and Wavelet Analysis
Energy function: Energy Plot: Second-order (local) scaling exponent: h
Suppose spectrum density function has the form
Long range dependence (asym. self-similar) process:
Fractional Brownian Motion: single h for all scales
Multi-scale Fractional Brownian: multiple h’s
][ ,2
kjj WE E
][,||~)( 2121 ,νν ν range frequency in ν νΓ h
],[)21(~ 12 jjj constant, hj Elog then j2
-j vs. Elog j2
time)-(large Jj for H and time),-(small Jj for h e.g.,
5.0)21(~ H withj constant, Hj Elog j2

63
Importance of Scaling Exponents
Poisson model
FBM model (Fractional Brownian
Motion) H: scaling exponent Var(t) ~
H1H
ρ1(D ~
H =0.5 => Poisson
2Ht
D ~11( ρ

64
Observations on OC3/OC12/OC48 Links
Large time scale Long-range dependent, asymptotically self-similar
Small time scale: more “complex” behavior Majority traces: (nearly) uncorrelated
• fluctuations in volume almost “independent” Some traces: moderately correlated
Small time scaling behavior: link specific (mostly) independent of link utilization observed

65
Illustrations of Scaling Behaviors
(Nearly) Uncorrelated Slightly Correlated
OC3-tier1-dom OC48-bb-1

66
Illustrations of Scaling Behaviors (cont’d)
(Nearly) Uncorrelated Moderately Correlated
OC12-tier2-dom OC12-corp-dom

67
Relation between SDF and Scaling Exponent
OC12-tier2-dom
OC12-corp-dom

68
Multi-Fractal Scaling Analysis
Linearity of => Monofractal scaling
Based on wavelet partition functions:
OC12-tier2-dom OC12-corp-dom
q
qh q constantqj~ qSlog qqqqqj /,2/,)(2
|| )( ,q
kjj WEqS

69
Multi-Fractal Scaling Analysis (cont’d)
Gaussian marginals => Monofractal scaling
Marginal distributions over 4 ms time scale
OC12-Tier2-Dom OC12-Corp-Dom
Kurtosis: 3.04Skew: 0.2
Kurtosis: 2.86Skew: 0.24
70
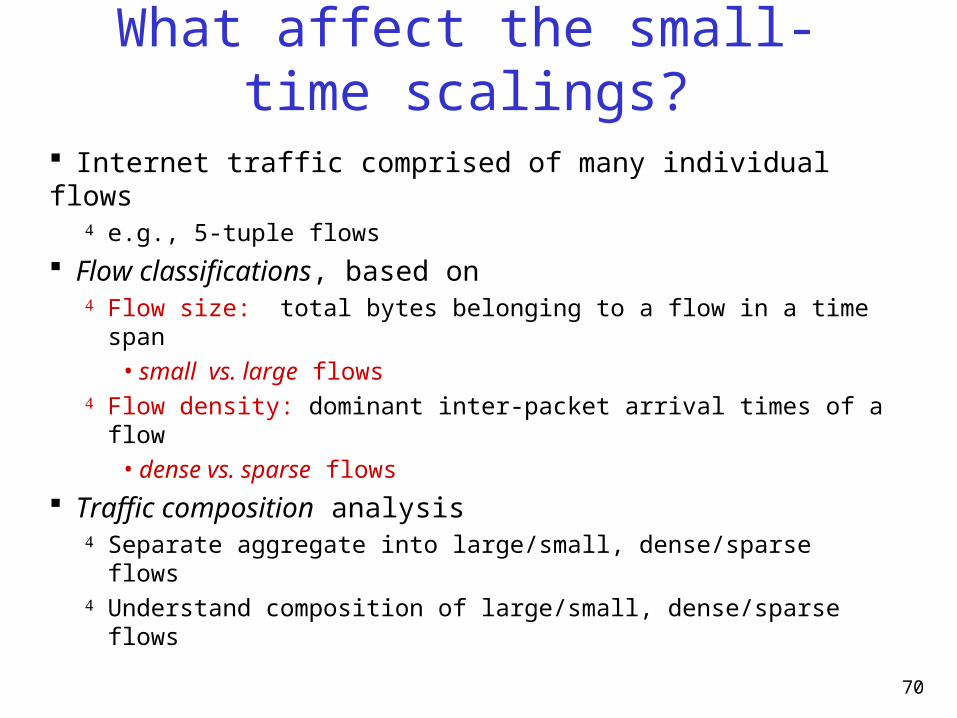
What affect the small-time scalings?
Internet traffic comprised of many individual flows e.g., 5-tuple flows
Flow classifications, based on Flow size: total bytes belonging to a flow in a time span
• small vs. large flows Flow density: dominant inter-packet arrival times of a
flow• dense vs. sparse flows
Traffic composition analysis Separate aggregate into large/small, dense/sparse flows Understand composition of large/small, dense/sparse
flows

71
Large vs. Small Flows
Based on 5 1-min segment of packet traces, each one hour apart

72
Dense vs. Sparse Flows
a dense flow
a sparse flow
“cumulative” packet inter-arrival times of all flows

73
Impact of Large vs. Small Flows on Scalings
Flow size alone does not determine small-time scaling behaviors(cf. large-time scaling behaviors)
large: flow size > 1MB; small: flow size < 10KB

74
Impact of Dense vs. Sparse Flows on Scalings
Flow density is a key factor in influencing small-time scalings!
dense: dominant packet inter-arrival time 2ms; sparse: > 2ms
75
Effect of Dense vs. Sparse Flow Traffic Composition
Semi-experiments using traces: vary mixing of dense/sparse flows
OC12-tier2-dom OC12-corp-dom

76
Where does correlation in traffic come from?
Aggregation of relatively large proportion of dense flows OC12-corp-dom: >2% dense flows, >15% total
bytes OC12-corp-dom: <1% dense flows, < 4% total
bytes Density of flows:
likely due to bottleneck link speed coupled with TCP window-based feedback control “fatter” bottleneck links => more dense flows
OC12-corp-dom: connect more high-speed users
OC12-tier2-dom: connect more diverse users

77
So Within Internet Backbone Network …
Facts about today’s Internet backbone networks bottleneck links reside outside backbone networks bottleneck link speeds small relative to backbone linksHigh degree of aggregation of (mostly) independent flows!
Consequences: queueing delay likely negligible!
• and (relatively) easier to model and predict • more so with higher speed links (e.g., OC192)
can increase link utilization (while ensure little queueing)• only higher degree of aggregation of independent flows
Be cautious with high-speed “customer” links!

78
Will Things Change in the Future?
But what happens if More hosting/data centers and VPN customers
directly connected to the Internet backbone?• have higher speed links, large-volume data transfers
User access link speed significantly increased?• e.g., with more DSL, cable modem users
Larger file transfer? • e.g. distributed file sharing (of large music/video files)
UDP traffic increases significantly? • e.g. video-on-Demand and other real-time applications