budget committee item f8 for march 30, 2015 - brampton committee... · city of brampton - budget...
TRANSCRIPT

»*•♦•*•
Illilfll!
STEAM | Canadian Sport Tourism Alliance Page 1 of2
ENGLISH FRANCAIS
AboutCSTA
Membership
News
Industry Tools
Research
STEAM
STEAM PRO
STEAM PRO Rate Card
Industry Reports
Custom Research
Value of Sport Tourism
Hosting Programs
Sport Events Congress
PRESTIGE Awards
Ontario Trillium Foundation
Workshops
Consulting Services
Links
Contact Us
Member Profile
spoRTSurreyAHBADOFTHS CA!.I£J
Sport Tourism Cheatsheet
Share This
STEAM
GtMKttati Spcrt Tourism Alliance
STEAM —i Sport Tourism Economic Assessment Model (STEAM)
As part of the preparation of hosting an event, it is often desirable to
conduct an economic impact assessment in order to estimate the level of economic activity that could potentially be supported by the event.
There are two main challenges associated with performing an impact analysis. First, depending on the assumptions made during the preparation of these studies, the estimated impact can vary widely.
Second, the costs associated with conducting an impact review can be prohibitive fcr small to medium sized hosting organizations.
The Canadian Sport Tourism Alliance has recognized the challenges associated with generating credible and cost-effective economic impact studies. Therefore, in 2002, and in association with Sport Canada, the
Canadian Tourism Commission, the Conference Board of Canada's
Canadian Tourism Research Institute (CTRI), and the Canadian
Association of Convention & Visitors Bureaux, the CSTA has developed
the Sport Tourism Economic Assessment Model (STEAM).
The objective of developing this tool was to create a model that is both
easy to use and easy to access. STEAM meets the first criteria, ease of
use, as the only information needed to generate results from the model are a basic knowledge of participant and spectator demographics, augmented with information contained in the event's business plan. The
second criterion, ease of access, has been met through the hosting of the model on the internet. STEAM is the world's first web-based
economic impact model specifically designed for sport events.
There are two key components of the model that act to standardize the results, thereby allowing for comparability of the economic impacts of different events in different locations across Canada. The first is the use
of standardized visitor expenditure profiles that have been developed with primary data collected by the CSTA, which is then supplemented with data from Statistics Canada. The second is the use of a modified
version of CTRI's TEAM model, which creates the economic impact estimates from the expenditure inputs.
As noted, the average daily expenditures of visitors at sporting events
have been prepared using the results of on-site economic impact
assessments conducted by the CSTA. On-site surveys have been
conducted at more than 50 sports events across Canada including
summer and winter sports as well as spectator and participant based
events. This extensive data set has allowed for the development of key indicators to differentiate the spending of visitors, including the person's
Members Only
Usemame
ore-mail
LOG IN
Recuest new ns'.'.vrrd
SPORT EVENTS CONGRESS
SuMftg Smtoea nragft Spcrr
Don't miss Spcrt Events Congress. Canada's largest annual gathering of sport and tourism professionals, event managers and industry suppliers!
March 30-April 1, 2015
CSTA Alerts
Enter your email address:
• Iwculd like toreceive CSTA communications
SUBSCRIBE
ViS-.y C1..,' P' :•'-,:• rCliCV
Report to the Secretary of State (Physical Activity

STEAM | Canadian Sport Tourism Alliance Page 2 of2
and Sport) On Hosting International Sport
role at an event (i.e. spectator, participant, and media), the distance they travelled, their age, and their length of stay. Accordingly, the model
Events in Canada - Amakes adjustments to the expenditure profileused in the preparation of proposal for a strategic the impact assessment based on these demographic characteristics, as framework well as the location of the event. This spending estimate is then Click hwefPDPl
combined with capital and operations expenditures contained in an event's business plan to produce an overall estimate of the expenditures associated with the event under consideration, which is then entered into
the economic impact assessment component of the model.
The multipliers used within the STEAM model have been developed by CTRI and are based on their TEAM model, the pre-eminent economic impact assessment model in Canada. STEAM (and TEAM)is based on Statistics Canada's provincial input/ output tables, which are then combined with other data to incorporate the local and provincial employment and tax structures of the host community. Moreover, the results produced by STEAM are fullyconsistent with the STEAM PRO model for those events in which users wish to conduct a pre-event
projection as well as a post-event analysis.
Both the expenditure profiles and the multipliers are updated frequently as more survey results become available or due to major changes in tax structures (i.e. introduction of HST).
Access to STEAM is free to all members of the Canadian Sport Tourism Alliance; however it is restricted to members of the CSTA who have
participated in a STEAM training session, offered at our annual congress or periodically throughout the year via webcast. For a fee, the CSTA is able to conduct either a STEAM projection or on-site STEAM PRO analysis; for more information, please see our rate card.
For more information about STEAM, please don't hesitate to contact the CSTA via email at [email protected].
Access to STEAM is restricted to members of the Canadian Sport Tourism Alliance who have attended a training workshop, offered
regionally across Canada throughout the year.
HOWE ABOUT CSTA MEMBERSHIP NEWS CONTACT US
©2005-2013 CanadianSport Tourism Alliance.Allrights reserved. Site by Answermen Ltd.

Table #A-Economic Impact Summary (Dollars)
Initial Expenditure
Gross Domestic Product
Direct Impact Indirect Impact
Induced Impact Total Impact
Wages & Salaries
Direct Impact Indirect Impact
Induced Impact
Total Impact
Employment (Full-year jobs) Direct Impact
Indirect Impact
Induced Impact
Total Impact
Direct Taxes
Federal
Provincial
Municipal Total
Total Taxes
Federal
Provincial
Municipal Total
Industry Output Direct & Indirect
Induced Impact Total Impact
Combined Total:
Total
Ontario
$4,514,248
$1,872,584
$1,625,988
$1,248,548 $4,747,120
$1,364,823
$933,092
$771,096
$3,069,010
39.4
15.9
15.5
70.7
$455,400
$464,030
$240,564
$1,159,994
$1,007,583 $860,186
$373,138
$2,240,907
$7,420,621
$2,730,716
$10,151,337
Local Area
Brampton
$4,514,248
$1,872,584
$492,094
$511,288
$2,875,966
$1,364,823
$409,084
$324,002
$2,097,909
39.4
7.3
9.7
56.4
$455,400
$464,030
$240,564
$1,159,994
$682,680
$622,824
$292,793
$1,598,296
$5,352,232
$1,118,041
$6,470,272
Ontario
Rest of
Ontario
$0
$0
$1,133,894
$737,260
$1,871,154
$524,007
$447,094
$971,101
8.5
5.8
14.3
$0
$0
$0
$0
$324,903
$237,362
$80,346
$642,611
$2,068,390
$1,612,675
$3,681,065
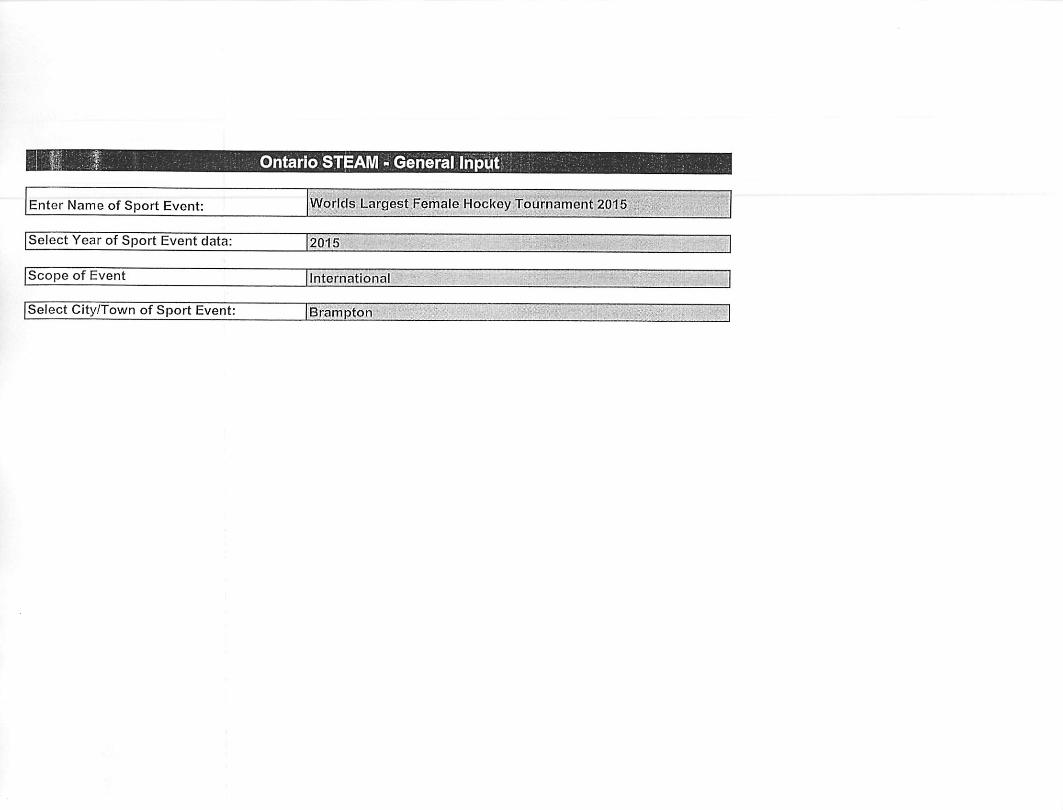
Ontario STEAM - General Input
Enter Name of Sport Event: Worlds Largest Female Hockey Tournament 2015
Select Year of Sport Event data: 2015
Scope of Event Internationa
Select City/Town of Sport Event: Brampton IB

Ontario STEAMS Participant Input
4,250Number of unique out of town participants
Percentage of out of town participants staying overnight (0-100) 40
Overnight participants (0-100) % of overnight participants from Canada
95
% of overnight participants from U.S. % of overnight participants from Overseas
Total (must sum to 100) 100
Overnight Domestic Distance (0-100)
80%of Canadian participants travelling from out of town up to 320km, regardless of province of origin
%of Canadian participants travelling from more than 320km and the same province as the event 10
%of Canadian participants travelling from more than 320km and a different province as the event 10
Total(must sum to 100) 100
3.0 Average overnight length of stay
Age of Participants (0-100) 80
% of participants under 19 10
% of participants 19-44 10
% of participants 45 and over Total (must sum to 100) 100
%of partipants under 19 who are staying in commercial accommodation 100
Same Day participant Average number of day trips taken by each participant
3.0

Ontario STEAM - Spectator Input
Number of unique out of town spectators 12,750
% of out of town spectators staying overnight (0-100) 40
Overnight Spectators (0-100)
% of overnight spectators from Canada 95
% of overnight spectators from U.S. 5
% of overnight spectators from Overseas 0
Total (must sum to 100) 100
Overnight Domestic Distance (0-100)
% of Canadian Spectators travelling from out of town up to 320km, regardless of province of origin 80
% of Canadian Spectators travelling from more than 320km and the same province as the event 10
% of Canadian Spectators travelling from more than 320km and a different province as the event 10
Total (must sum to 100) 100
Average overnight length of stay 3.0
Importance of event for spectators (on a scale of 0-100)
Overnight Domestic 100
Overnight USA 100
Overnight Int. 100
Same Day Spectator Average number of day trips taken by each spectator 3.0

Ontario STEAM - MedlaBtlP Input
Number of unique out of town media /VIPs
1Percentage of out of town media / VIPs staying overnight (0-100)
Overnight media / VIPs (0-100) 100 % of overnight media / VIPs from Canada % of overnight media /VIPs from U.S. % of overnight media / VIPs from Overseas
Total (must sum to 100) 100
Overnight Domestic Distance (0-100)%of Canadian media /VIPs travelling from out of town up to 320km, regardless of
100 province of origin%of Canadian media / VIPs travelling from more than 320km and the same
0 province as the event %of Canadian media / VIPs travelling from more than 320km and a different
0 province as the event
Total (must sum to 100) 700
~O0 Average overnight length of stay
Same Day media/VIP 0.0Average number of day trips taken by each media / VIP

Ontario STEAMS Operating Expenditure
Enter Operating Expenditures on: Salaries, Fees and Commissions
Advertising Services
Professional Services
Financial Services
Insurance
Rent
Laundry and Cleaning Services Other Services
Communication
Energy and Other Utilities Guest Room Supplies Office Supplies
Kitchen Supplies
Other Supplies
Repairs
Food and Beverages - Organizing Committee
Food and Beverages - Participants
Food and Beverages - Media / VIP
Accommodation - Organizing Committee
Accommodation - Participants
Accommodation - Media / VIP
Merchandise and Retail
Personal Travel
Transportation and Storage
Enter Taxes:
Property Taxes
Corporate Taxes
HST
Other Indirect Taxes (municipal)
$139,500
$10,200
$100
$133,000
$2,350
$0
$0
$0
$600
$22,000
$0
$0
$2,000
i15,000
$0
$0
$0
$0

Total expenditures itemized above (including all taxes)
Enter total revenue (must be >= total expenditures)
Operating Surplus Calculated
Enter direct employment (in equivalent full-year jobs)
Does all of the transportation spending occur in the local area?
Select Industry Sector
Organizing Committee Sponsorship (0-100)
% of paticipants being sponsored
% of media/VIP being sponsored
$324,750
$381,000
$56,250
Yes
No
Yes
Attractions & Recreation
Accommodation
Attractions & Recreation
Restaurants
0
0